 Masashi Kiguchi
 Jun Matsumoto
 Shinjiro Kanae4
- 1Institute of Industrial Science, The University of Tokyo, Tokyo, Japan
- 2Department of Geography, Tokyo Metropolitan University, Tokyo, Japan
- 3Japan Agency for Marine-Earth Science and Technology, Yokosuka, Japan
- 4Department of Civil and Environmental Engineering, Tokyo Institute of Technology, Tokyo, Japan
We analyzed rainfall during the pre-monsoon season from 1979 to 2002 over the Indochina Peninsula. Our multi-year analysis confirmed that the passage of the upper trough and moisture convergence in the lower troposphere produce intermittent rainfall events during the pre-monsoon season. From this result, three questions are raised. First, what are the characteristics of the upper trough? Second, what is the cause of the significant amount of moisture during the pre-monsoon season over inland Indochina? Third, what is the relationship between the intermittent pre-monsoon rainfall and monsoon onset? Our study suggests the following answers to these questions: (1) The upper trough is associated with the cyclone over the Yangtze River basin. This cyclone is baroclinic, so the upper trough over the study area is produced by the mid-latitude regime. (2) A significant amount of moisture over the Indochina Peninsula is produced by both intermittent rainfall associated with the passage of the upper trough and continuous rainfall occurred over a wide region associated with the equatorial southwesterly. (3) We found no clear relationship between rainfall amount during the pre-monsoon period and timing of monsoon onset over the Indochina Peninsula.
Introduction
A number of studies have reported the appearance of strong convection over the Indochina Peninsula, indicative of the early start of the summer monsoon over the Asian continent (e.g., Lau and Yang, 1997; Webster et al., 1998; Wang and LinHo, 2002). According to these studies, the monsoon begins over the Indochina Peninsula in early or mid-May and migrates northward from the southern part of the Bay of Bengal. However, Matsumoto's (1997) analysis of rainfall data indicated that rainy season onset occurs earlier in late April over the inland region of the Indochina Peninsula, even though this region is still in a mid-latitude westerly regime at that time. Zhang et al. (2002) defined the annual monsoon onset in Thailand, located in the central part of the Indochina Peninsula, using a rainfall index. The mean onset date over 46 years (1951–1996) is 9 May. One pentad later, Thailand is covered by a southwesterly that progressed from the equatorial Indian Ocean. This result also showed that the monsoon onset determined by the rainfall index occurs before the monsoon circulation is established. Yoshimura et al. (2004) found that, before monsoon onset, moisture over the Indochina Peninsula originates not from the Indian Ocean but from the Pacific Ocean. In other words, the wind system is important in determining monsoon onset. Hereafter, rainfall before the monsoon onset is referred to as “pre-monsoon rainfall.” This phenomena is not only meteorological impact but leaf-out onset and soil moisture (Yoshifuji et al., 2014).
Qian and Yang (2000) examined that regional features of the different summer monsoon components over the South China Sea (SCS). The effect of convection over the southern SCS in the monsoon onset is not clear. It was suggested that the early precipitation over the northern SCS and South China is provided by subtropical fronts separated from the tropical monsoon rainfall. Kodama et al. (2005) analyzed lightning and echo top in tropical monsoon region using TRMM-PR and LIS observations. It was indicated that pre-monsoon rainfall is characterized high echo tops and lightning activity. Kiguchi and Matsumoto (2005) investigated pre-monsoon rainfall in Indochina in 1998 as part of the intensive observation period (IOP) of the Global Energy and Water Cycle Experiment (GEWEX), Asian Monsoon Experiment (GAME). They found that the intermittent rainfall during the pre-monsoon season is produced by the passage of an upper tropospheric trough and moisture inflow in the lower troposphere. However, because the analysis was performed for only three cases in 1998, the results should be verified in other years. In particular, three questions require further clarification.
First, what are the characteristics of the upper trough? Matsumoto's (1997) noted that mid-latitude westerlies are located over the Indochina Peninsula from early May in a mean field. Also from a 1998 case study, Kiguchi and Matsumoto (2005) reported that the upper trough migrates eastward in the mid-latitude westerlies along the southern periphery of the Tibetan Plateau. However, it is not known whether this upper trough passes over the Indochina Peninsula in other years. Moreover, the vertical characteristic of this upper trough are not clear.
Second, what is the origin of the significant amount of moisture during the pre-monsoon season over the inland Indochina Peninsula? Previous studies showed convergence in the lower troposphere around the Indochina Peninsula in mean fields. In the monthly mean field, Thompson (1951) reported that the airflow convergence at 10,000 ft (about 700 hPa) is located over the Indochina Peninsula in May. Matsumoto (1992) indicated that boundary between the westerlies and easterlies at 850 hPa migrates southward from the northern Indochina Peninsula to the maritime continent in the transitional phase between the dry and wet season. Such mean-field convergence exists over the Indochina Peninsula from the dry to rainy seasons. However, this convergence field is not maintained during the pre-monsoon season. The moisture increase in the lower troposphere when the convergence field is dominant was shown in the case study of Kiguchi and Matsumoto (2005). However, moisture increase in the lower troposphere has not previously been examined for other years.
Finally, what is the relationship between the intermittent pre-monsoon rainfall and monsoon onset? The most fundamental driving mechanism of a monsoon system is differential heating of land and ocean (e.g., Webster, 1987). Hsu et al. (1999) noted that the maximum heating near 100°E between 10°N and 20°N corresponded to the deep convection that appeared before monsoon onset. Recently, Fu and Li (2004) showed that convective activity just before rainy season onset in the Amazon region can change the rainy season wind circulation. In the Indochina Peninsula, this issue was addressed using reanalysis data and a numerical model. Ishizaki and Ueda (2006) used reanalysis data from 1998 to show that the rainfall during the pre-monsoon season produces an atmospheric heat budget via the release of latent heat. Kanae et al. (2002) used a numerical model to reveal that monsoon onset requires warm sea surface temperature (SST) surrounding the Indochina Peninsula as part of the global asymmetric SST field. However, the relationship between SST surrounding the Indochina Peninsula and rainfall over the Indochina Peninsula was not clarified. Furthermore, pre-monsoon rainfall was not expressed in their model. Xue et al. (2004, 2006) analyzed the changes in surface sensible heat and circulation in monsoon onset and the start of the monsoon mature stage using numerical simulations with/without vegetation in East Asia, West Africa, and South America. They pointed out that difference of land surface produced sensible head gradient at the surface influences the moisture transportation low troposphere. While they did not mentioned the influence of pre-monsoon rainfall on the monsoon onset. It remains to be seen whether rainfall phenomena during the pre-monsoon season affect the monsoon onset.
In this paper, we revisit the study of Kiguchi and Matsumoto (2005) and expand it to include pre-monsoon rainfall during the period 1979–2002. Section Data describes the data used in this study. Section Definition of Monsoon Onset defines monsoon onset in the individual years. The climatologies before and after monsoon onset over the long period are described in Sections Convection Activity to Bring Rainfall and Continuous Rainfall Occurred over a Wide Region (Type B) during the Pre-Monsoon. In Section Discussion we investigate the following: (1) the characteristics of the upper trough; (2) the source for the significant amount of moisture during the pre-monsoon season; and (3) the relationship between the intermittent rainfall during the pre-monsoon season and the monsoon onset.
Data
In the National Centers for Environmental Prediction/National Center for Atmospheric Research (NCEP/NCAR) reanalysis project, a state-of-the-art analysis/forecast system was used to perform data assimilation using data from 1948 to the present day (Kalnay et al., 1996). Before 1979, the data used for assimilation varied enormously. The principal difference between the data before and after 1979 is that satellite observations of Earth were available after 1979. Hence in this study, the reanalysis dataset for the period 1979–2002 are utilized. As an indicator of the convective activity, the daily mean interpolated Outgoing longwave radiation (OLR) data (Liebmann and Smith, 1996) provided by the National Oceanic and Atmospheric Administration (NOAA) are utilized. The spatial resolution for both data is 2.5 degree. Station-observed rainfall data obtained from local meteorological departments is also used for the period 1979–2002. The distribution of observation stations is shown in Figure 1.
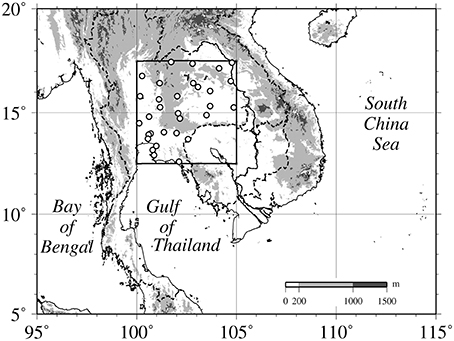
Figure 1. Map of the study area. Light and dark shadings indicate elevations greater than 200 and 1000 m, respectively. Open circles are the rainfall stations used in this study.
Rainfall during the Pre-Monsoon Season
Definition of Monsoon Onset
Many studies tried to decide monsoon onset using various meteorological elements. As meteorological elements for determination of monsoon onset, they used wind (e.g., Cheang and Tan, 1988; Wang et al., 2004; Li and Zhang, 2009), rainfall (e.g., Matsumoto's, 1997; Wang and LinHo, 2002; Htway and Matsumoto, 2011; Nguyen-Le et al., 2015), precipitable water (e.g., Zeng and Lu, 2004; Uang-aree et al., 2015), precipitation isotope (e.g., Yoshimura et al., 2004; Yang et al., 2012), and so on.
First, the monsoon onset date in each year was determined from the wind circulation in the lower troposphere, as described by Kiguchi and Matsumoto (2005). In this study, monsoon onset was defined as the first day when the zonal wind components at both 850 hPa and 700 hPa become positive and stayed positive for at least 20 days (e.g., Cheang and Tan, 1988). The monsoon onset determined using this definition was compared with the equatorial southwesterly over the central area of the Indochina Peninsula using the pentad-averaged wind field at 850 hPa layer (not shown). In some years, it was difficult to divide the field into the equatorial flow and the mid-latitude westerly jet from the time series of the zonal wind in the lower troposphere. In such cases, the onset date was determined using the pentad-averaged wind field in the 850 hPa layer.
According to the above definition, monsoon onset dates for each year were determined (Table 1). The mean onset date of monsoon circulation over 24 years is found to be 17 May. This is consistent with existing results for mid-May reported by Orgill (1967). The year with the earliest onset of monsoon circulation is 2001, when the circulation began on 3 May. The year of latest onset of monsoon circulation (14 June) is 1996. The standard deviation is approximately 10.8 days. For comparison, the standard deviations in Kerala (Indian monsoon region) and Darwin (Australian monsoon region) are 7.8 days from 1901 to 1980 and 15 days from 1952 to 1983, respectively (Holland, 1986; Joseph et al., 1994).
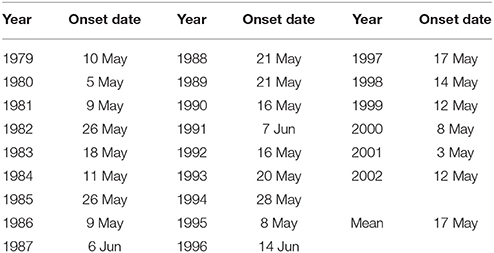
Table 1. The onset date of the monsoon circulation over the Indochina Peninsula for the period 1979–2002.
To test this definition of monsoon onset, we created a pentad wind field based on the onset dates. The symbols “−” and “+” show the field prior to and after monsoon onset day, respectively. The pentad mean fields prior to the monsoon onset date were obtained with pentad “−2” representing the average from days −10 to −6 and pentad “−1” representing the average from days −5 to −1. Similarly, the pentad mean fields after monsoon onset day were obtained with pentad “+2” representing the average from days +6 to +10 and pentad “+1” representing the average from days +1 to +5. In Figures 2A,B, we can see that the easterly from the western Pacific Ocean is dominant before the monsoon onset. In contrast, it is clear that southwesterly becomes dominant after the monsoon onset day (Figures 2C,D). Hence, this method to determine the monsoon onset date expresses a global field. Figure 3 shows the seasonal march of OLR along 12.5–17. 5°N and the onset date of monsoon circulation for the period 1979–2002. It is clear that the convective activity greatly increases after the monsoon onset.
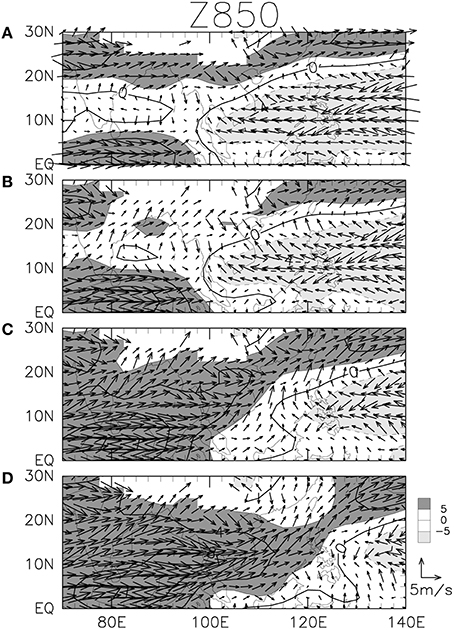
Figure 2. Composite of evolution of pentad mean field at 850 hPa in units of m s−1. (A) Pentad “−2,” (B) pentad “−1,” (C) pentad “+1,” and (D) pentad “+2.” The symbols “−,” and “+” denote that the field is prior to and after the monsoon onset day, respectively. The contour interval is 5 m s−1 zonal wind. Light and dark shadings are less than −5 m s−1 and more than 5 m s−1, respectively. Map of the study area. Light and dark shadings indicate elevations greater than 200 and 1000 m, respectively. Open circles are the rainfall stations used in this study.
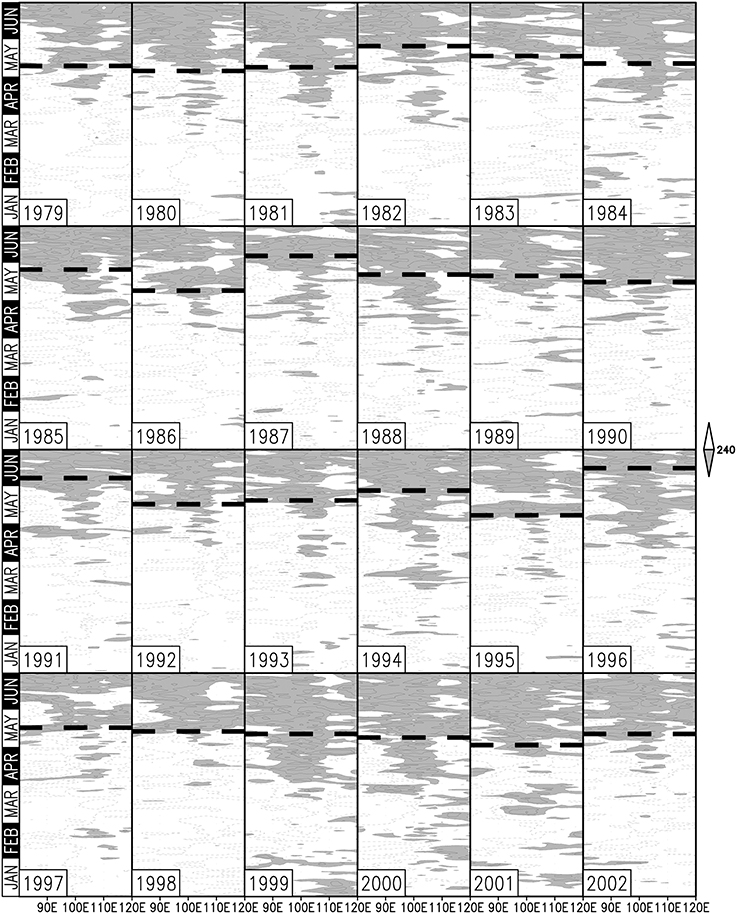
Figure 3. The time-longitude cross section of the daily mean OLR along 12.5–17.5°N between January and June from 1979 to 2002. Unit is W m−2. Shading is less than 240 W m−2. Contour interval is 40 W m−2. Dashed line indicates the summer monsoon onset date of the study area.
Zhang et al. (2002) determined the monsoon onset date using the rainfall index in Thailand (dotted line in Figure 4). The mean monsoon onset date (1979–1996) is 10 May. In this study (solid line in Figure 4), the mean monsoon onset date for the same year (1979–1996) is 20 May. The difference between these monsoon onset dates is 10 days. The correlation between the monsoon onset date in each year determined by the rainfall index in Thailand and that determined by the zonal wind in the central area of the Indochina Peninsula is almost 0. This shows the weakness in the definition of monsoon onset using the rainfall index. Pre-monsoon rainfall occurs intermittently, as shown in Figure 3. Unless pre-monsoon rainfall is separated from continuous rainfall occurred over a wide region, this definition of monsoon onset may lead to an incorrect result. Wang et al. (2004) determined the monsoon onset pentad using the zonal wind at 850 hPa over the South China Sea (dashed line in Figure 4). They found a mean monsoon onset date (1979–1996) of 21 May, i.e., only 1 day from our result. However, the correlation between the monsoon onset dates in each year as determined by Wang et al. (2004) and by our study is weak. From 1985 to 1992, on the other hand, correlation between the monsoon onset found by Wang et al. (2004) and by our study is 0.73, exceeding significance at a 99% confidence level. Hence we suggest that the pattern of northward progression of the equatorial westerly is different before and after 1992.
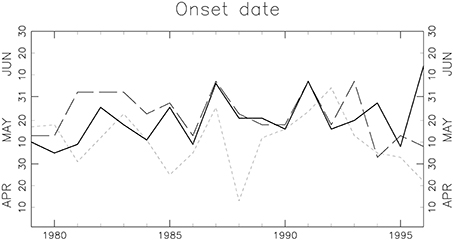
Figure 4. The onset dates determined during the period from 1979 to 1996 by previous studies and our result. Solid, dotted, and dashed lines mean the onset date by our result, Zhang et al. (2002), and Wang et al. (2004), respectively.
Convection Activity to Bring Rainfall
To investigate rainfall phenomena during the pre-monsoon in multiple years around the central area of the Indochina Peninsula, time series of rainfall were analyzed using rainfall amount data in the region shown in Figure 1. This region (12.5–17.5°N, 100–105°E) was selected as representative of the central part of the Indochina Peninsula. In this study, we selected stations for which there were no missing data during March to May from 1979 to 2002. As a result, 35 stations in Thailand were used in the period 1979–2002.
According to the time series of area-averaged precipitation for the period from March to May, intermittent rainfall events (referred to as Type A; when the ratio of the stations observing rainfall was greater than 10% and the area-averaged OLR was less than 240 W m−2) during the pre-monsoon are observed in all years (not shown). In some years, continuous rainfall occurred over a wide region. This rainfall is brought by a southwesterly, a phenomenon that was identified in this study (see Table 2). Such rainfall events (referred to as Type B) are noted in Section Continuous Rainfall Occurred over a Wide Region (Type B) during the Pre-Monsoon.
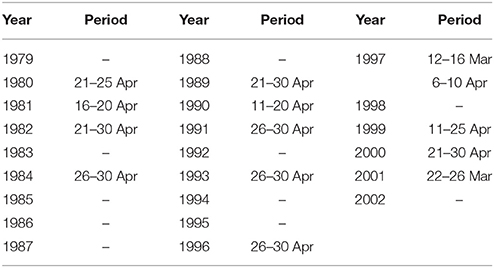
Table 2. Continuous rainfall occurred over a wide region (Type B) from March to April for the period 1979–2002.
To elucidate the spatial properties of the intermittent convective activity, we performed a composite analysis. Figures 5A,B show composite maps of Type A and non-rainy days (when no station observed rainfall) during March and April, respectively. Figure 5C shows the difference between the composite maps for Type A and non-rainy days, exceeding significance at a 99% confidence level. In case of Type A (Figure 5A), the region of OLR less than 240 W m−2 cover the Indochina Peninsula. In contrast, the Indian subcontinent, the Bay of Bengal, and the southern part of the South China Sea have higher OLR values, indicating suppressed convection. The difference shown in Figure 5C can more clearly indicate the properties shown above. A negative area where strong convective activity covers the Indochina Peninsula is shown. This result was similar to that of Kiguchi and Matsumoto (2005).
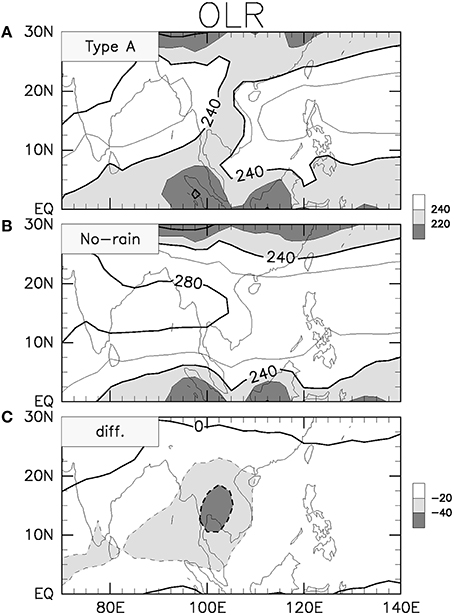
Figure 5. Composites of OLR on (A) the rainy days (when the ratio of the stations observed rainfall exceeding 0 mm is exceeding 10% and the area averaged OLR value is less than 240 W m−2) and (B) the non-rainy days (when there is no observed station) from March to April. The bottom panel (C) shows that the difference of the composite OLR distribution between on the rainy days (A) and on the non-rainy day (B), exceeding significance at a 99% confidence level. The difference is calculated to subtract (B) from (A). The unit is W m−2. The interval of contours is 20 W m−2. Light and dark shadings of (A) and (B) are less than 240 and 220 W m−2, respectively. Light and dark shadings of (C) are less than −20 and −40 W m−2, respectively.
On the basis of these findings, we came to the following conclusions. First, monsoon onset should be defined using the wind in the lower troposphere (Figure 2). Second, intermittent rainfall during the pre-monsoon season occur every year from 1979 to 2002. The region of convective activity is located over the Indochina Peninsula from the tropics to mid-latitudes. By our multiple-year composite analysis, we confirmed the synoptic conditions near the monsoon onset indicated by Kiguchi and Matsumoto (2005).
Continuous Rainfall Occurred over a Wide Region (Type B) during the Pre-Monsoon
In Section Convection Activity to Bring Rainfall, we noted that rainfall occurred when the southwesterly dominant from the equatorial zone into the inland region of Thailand. In south Asia, this kind phenomena was explained by previous studies (Flatau et al., 2001; Romatschke and Houze, 2011; Xing et al., 2015), and false monsoon onsets was tried to reduce (Stiller-Reeve et al., 2014). Flatau et al. (2001) indicated the development of such kind of phenomena (they called “bogus onset”) depends on intraseasonal oscillation in the Indian Ocean and propagation of convective activities in the western Pacific Ocean.
We mapped the distributions of the convective activity and mean field in the lower troposphere. Figures 6A,B show composite maps of case of Type B and the monsoon season from monsoon onset to the end of June, respectively, obtained using OLR data. Figure 6C shows the difference between (a) and (b), exceeding significance at a 99% confidence level. In Figure 6A, convection is active from the Indochina Peninsula to the equatorial zone. After monsoon onset (Figure 6B), however, convective activity is shown widely over the region from the Bay of Bengal to the South China Sea. The pattern of convective activity is different in Type B (Figure 6A) and monsoon (Figure 6B) rainfall situations over the Indochina Peninsula. The distribution of convective activity during the period when Type B events occur (Figure 6A) is similar to that during the period when Type A events occur (Figure 5A).
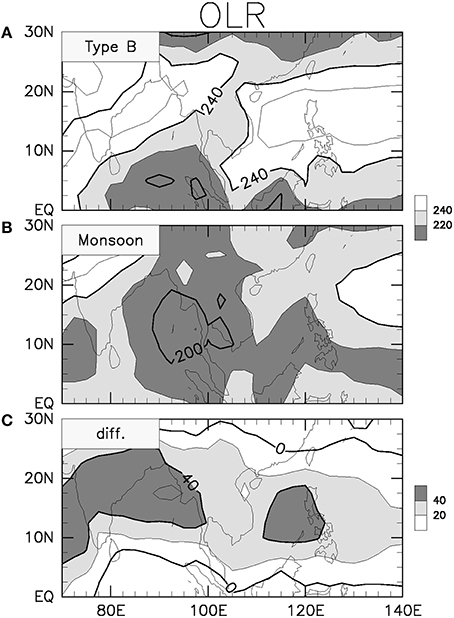
Figure 6. Composites of OLR on (A) the monsoon-like rainfall days and (B) the monsoon days (from the monsoon onset to end day of June. The bottom panel (C) shows that the difference of the composite OLR distribution between on the monsoon-like rainfall days (A) and on the monsoon day (B), exceeding significance at a 99% confidence level. The difference is calculated to subtract (B) from (A). The unit is W m−2. The interval of contours is 20 W m−2. Light and dark shadings of (A,B) are less than 240 and 220 W m−2, respectively. Light and dark shadings of (C) are less than −20 and −40 W m−2, respectively.
We can see a difference in wind fields in the lower troposphere between the two periods. During the period when Type B events occurred, easterlies from the west Pacific Ocean reach the South China Sea. At the same time, southwesterlies from the equatorial region and northwesterlies from the northern Bay of Bengal flow over the Indochina Peninsula (Figure 7). As also noted in Section Moisture in the Pre-Monsoon Season, easterlies from the west Pacific Ocean reach the central part of the Indochina Peninsula when Type A occur (Figure 8). After monsoon onset, southwesterlies reach the South China Sea. According to the composite distribution of the wind field in the upper troposphere of Type B and monsoon rainfall (Figure 9), when Type B events occur, the mid-latitude westerly is strong and located in the northern part of the Indochina Peninsula. Such Type B rainfall is not seen over the South China Sea.
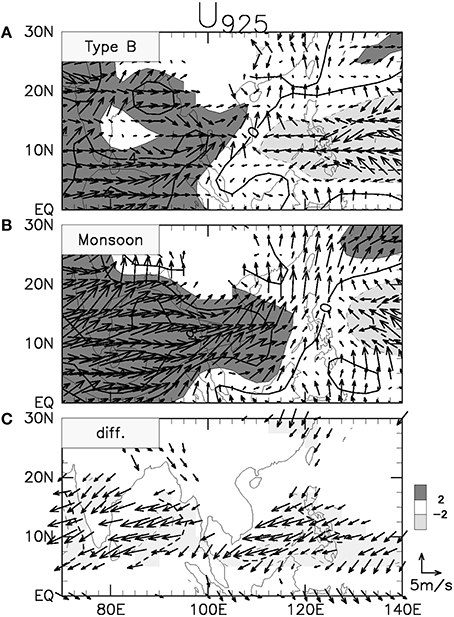
Figure 7. As in Figure 6 but for the 925 hPa wind vector and the speed of zonal wind on (A) the monsoon-like rainfall days and (B) the monsoon days (from the monsoon onset to end day of June). The bottom panel (C) shows that the difference of the composite 925 hPa wind vector and the speed of zonal wind between (A) and (B), exceeding significance at a 99% confidence level. The difference is calculated to subtract (B) from (A). Contour interval is 2 m s−1. Light and dark shadings are less than −2 m s−1 and more than 2 m s−1, respectively.
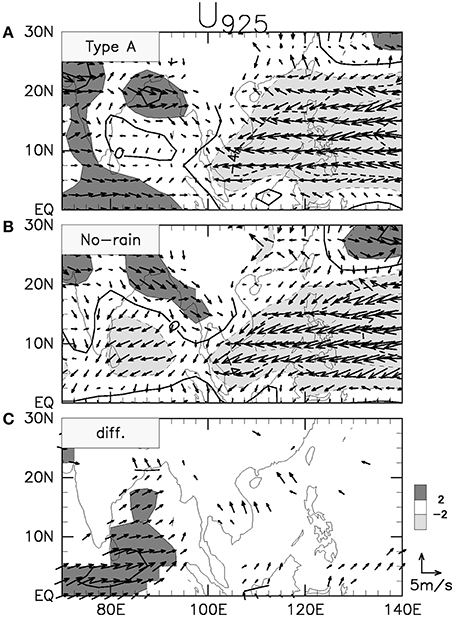
Figure 8. As in Figure 5 but for the 925 hPa wind vector and the speed of zonal wind on (A) the rainy days (when the ratio of the stations observed rainfall exceeding 0 mm is exceeding 10% and the are averaged OLR value is less than 240 W m−2) and (B) the non-rainy days (when there is no observed station) from March to April. The bottom panel (C) shows that the difference of the composite 925 hPa wind vector and the speed of zonal wind between (A) and (B), exceeding significance at a 99% confidence level. The difference is calculated to subtract (B) from (A). Contour interval is 2 m s−1. Light and dark shadings are less than −2 m s−1 and more than 2 m s−1, respectively.
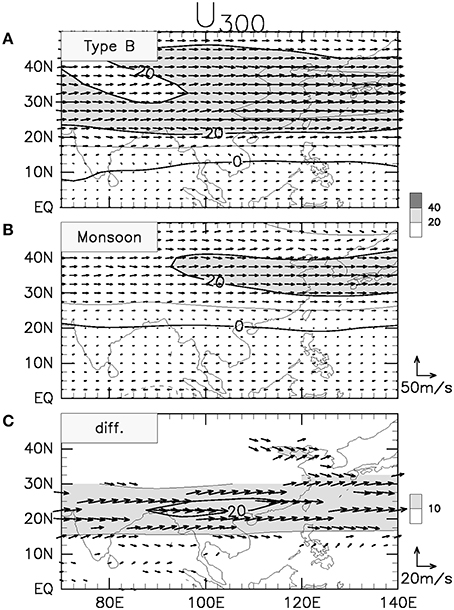
Figure 9. As in Figure 6 but for the 300 hPa wind vector and the speed of zonal wind on (A) the monsoon-like rainfall days and (B) the monsoon days (from the monsoon onset to end day of June). The bottom panel (C) shows that the difference of the composite 300 hPa wind vector and the speed of zonal wind between (A) and (B), exceeding significance at a 99% confidence level. The difference is calculated to subtract (B) from (A). Contour interval is 20 m s−1. Light shading is more than 20 m s−1.
Discussion
Upper Trough in the Pre-Monsoon Season
To understand the reasons for convective activity during the pre-monsoon season, we analyzed the synoptic conditions using daily mean NCEP/NCAR reanalysis data for the period 1979–2002.
Troughs in the upper troposphere and moisture convergence in the lower troposphere are regarded as factors for pre-monsoon rain events in 1998, as described by Kiguchi and Matsumoto (2005). To ensure the generality of these factors for rain events, trough passage in the upper troposphere and moisture fields in the lower troposphere when rainfall occur are studied for a longer period (1979–2002).
To reveal the trough passage in the upper troposphere in case of Type A, we performed a composite analysis of the wind field at 300 hPa. Figure 10 shows a composite map of the wind field at the 300 hPa layer in case of Type A (a), on non-rainy days (b), and the difference between the two (c), exceeding significance at a 99% confidence level using Welch's t-test (Welch, 1947). The period in case of Type A using the composite analysis is the period when the area-averaged OLR value was less than 240 W m−2, indicating strong convection.
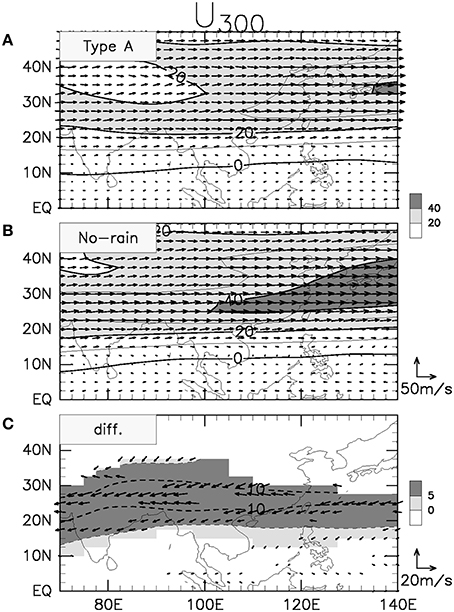
Figure 10. As in Figure 5 but for the 300 hPa wind vector and the speed of zonal wind on (A) the rainy days (when the ratio of the stations observed rainfall exceeding 0 mm is exceeding 10% and the are averaged OLR value is less than 240 W m−2) and (B) the non-rainy days (when there is no observed station) from March to April. The bottom panel (C) shows that the difference of the composite 300 hPa wind vector and the speed of zonal wind between (A) and (B), exceeding significance at a 99% confidence level. The difference is calculated to subtract (B) from (A). Contour interval is 10 m s−1. Light and dark shadings in (A,B) are more than 20 m s−1 and more than 40 m s−1, respectively. Light shading of (C) is less than 0 m s−1.
According to composite analysis of the wind field at 300 hPa, we observed that a weak jet westerly is located over Bangladesh in case of Type A. This result is almost consistent with that obtained for 1998 by Kiguchi and Matsumoto (2005). In Kiguchi and Matsumoto (2005), the difference between the rainy and non-rainy days shows a cyclonic anomaly centered over the Andaman Sea, indicating the presence of a trough. On the other hand, it is not clear about the presence of upper tropospheric trough in this study.
According to Kiguchi and Matsumoto (2005), the pre-monsoon rainfall events originate from the trough in the upper troposphere. Here, we discuss the mean field as background for trough passage in the upper troposphere and moisture convergence in the lower troposphere. Trough passage in the upper troposphere is provided by southward extension of the mid-latitude westerly zone. It is not clear to us whether the presence of cold air in the upper troposphere caused rainfall events during the pre-monsoon season in the central part of the Indochina Peninsula. However, it was clear that the presence of a trough in the upper troposphere is associated with mid-latitude westerlies. The uplift flow is possibly strengthened when troughs in the upper troposphere advance southward to the Indochina Peninsula, due to the meandering of mid-latitude westerlies.
No trough is found in the lower troposphere (see Figure 11). According to the vertical structure of the trough along 15°N, 20°N, 25°N, and 30°N on +2 day, the trough in the north is located more eastward than that in the south (Figure 11). It is suggested that the trough associated with the cyclone in the Yangtze River basin, which may be similar to that described by Murakami and Huang (1984), extends toward the Indochina Peninsula. This suggestion is consistent with the band-like strong convective activity from the Indochina Peninsula to the southern coast area of China, as indicated by a composite analysis of the migration of convective activity (Kiguchi and Matsumoto, 2005).
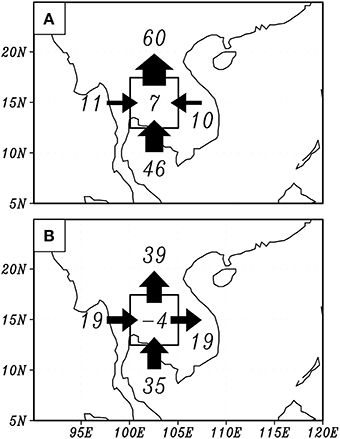
Figure 11. Composites of the vertical integration of zonal and meridional moisture fluxes passing across boundaries of the box (12.5–17.5°N, 100–105°E) and the precipitable water in this box on (A) the rainy days and (B) the non-rainy day from March to April for the period 1979–2002. Arrows indicate the positive direction of flux. The numeral written in the center of the box is the precipitable water in the box. The unit of the moisture flux and that of the precipitable water are 106 Kg s−1 and 106 Kg m−2, respectively.
Moisture in the Pre-Monsoon Season
To assess quantitatively whether the direction of moisture inflow contributed to the Type A events during the pre-monsoon season, we performed a composite analysis of the vertically integrated moisture inflow into the study area from each direction for a 24-year period. Figure 12 shows a composite map of the vertically integrated moisture inflow in case of Type A (a) and non-rainy days (b) from March to April. According to this composite analysis, the moisture convergence became stronger in case of Type A. In contrast, Figure 12B indicates that the moisture divergence occurs on non-rainy days. The characteristics of inflow from the zonal direction are drastically different for rainy (Type A) and non-rainy days. In case of Type A, a convergence of zonal direction occurs. It is also indicated for the 24-year period that strengthening of inflow from the east produced moisture convergence when Type A events occur. According to the above analysis, moisture inflow into the study domain is consistent with the properties derived in the composite analysis of moisture inflow by Kiguchi and Matsumoto (2005).
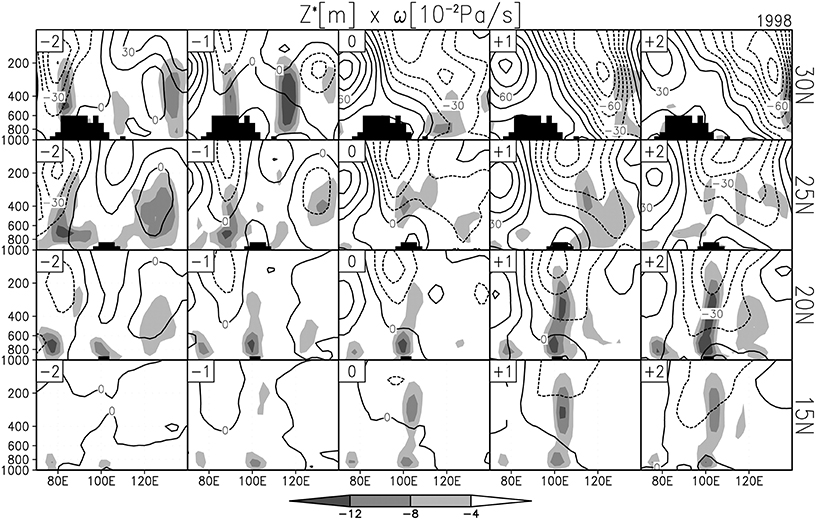
Figure 12. Daily evolution of the composite with reference to the first day of the strong convective activity periods (C-E, defined in Kiguchi and Matsumoto, 2005) of the vertical-longitude cross section of height anomaly from the 30-day running mean value (contoured) and omega (shaded) along each latitude (written in right side). Here “0” denotes the first day of the strong convective activity periods. “–” and “+” refer to prior to and after the first day of the strong convective activity periods (C, D, and E), respectively. The unit of height anomaly and omega are m and 10−2 Pa s−1, respectively. Contour interval of height anomaly is 15 m. Shading is less than −4 × 10⁻² Pa s−1. Shading interval is 4 × 10⁻² Pa s−1.
Furthermore, to investigate the atmospheric circulation field related to strengthening of the easterly, a composite map of the wind field in the lower troposphere containing a significant amount of moisture was constructed. Figure 8A shows the wind field in the 925 hPa layer in case of Type A. The line indicating a boundary between westerlies and easterlies is located at approximately 100°E in case of Type A. Clearly, southeasterly inflow occurs in the inland region of the Indochina Peninsula. In contrast, a westerly from the northern part of the Bay of Bengal is dominant over the Indochina Peninsula on non-rainy days (Figure 8B). This feature of Type A was clarified by considering the difference between (a) and (b), exceeding significance at a 99% confidence level (Figure 8C). We can see that in case of Type A, an anomalous easterly covers the area from the northern South China Sea to the Indochina Peninsula. Promchote et al. (2016) analyzed the 2011 great flood in Thailand, and pointed out that the great flood is caused by not only monsoon rain and tropical cyclone frequency but high rainfall during pre-monsoon. This high rainfall during pre-monsoon is provided by northeasterly from East Asia using anomaly of climatological wind field during the period from January to April. However, it is not consistent with our study. The reason should be that their result was included winter season.
We have already shown that moisture convergence in the lower troposphere is caused by strengthening of the easterly from the South China Sea. Next, we attempt to explain the climatological seasonal march of the moisture field.
Let us consider the moisture inflow and convergence in our study area. The monthly mean distribution of the vertically integrated precipitable water from January to June in the climatological field shown in Figure 13 was calculated using the reanalysis data. In January, there is a significant amount of moisture over the maritime continent, which lay in the boreal winter monsoon region. In February, moisture over the southern Indochina Peninsula and the South China Sea increase slightly. In March and April, a considerable amount of moisture already exists over the southern Indochina Peninsula, as much as that over the maritime continent. Moreover, more moisture exists over the southern Indochina Peninsula than over the Indian subcontinent, which is located in same latitudinal zone as the Indochina Peninsula. In contrast, the moisture is considerably less in the Bay of Bengal. In addition, the moisture in the Bay of Bengal is less than that in same latitudinal belt of the South China Sea. In May, the wet region expands to the entire South China Sea, and there is a considerable amount of moisture over the southern coastal part of China. Although much moisture exists over the southern part of the west coast of India, overall moisture levels are much lower over the Indian subcontinent. It is clear that the increase in moisture over the Indochina Peninsula begin earlier than that over the Indian subcontinent, the Bay of Bengal, and the South China Sea. Hence, we emphasize that the moisture distribution in March and April is important for Type A events during the pre-monsoon season. Type A events during the pre-monsoon caused the moisture amount over the Indochina Peninsula to increase earlier than that in other regions in the same latitudinal zone. In addition, we suggest that the moisture increase is produced by intermittent convergence in the lower troposphere associated with the passage of the upper trough and inflow of a southwesterly from the equatorial region when the Type B events occur.
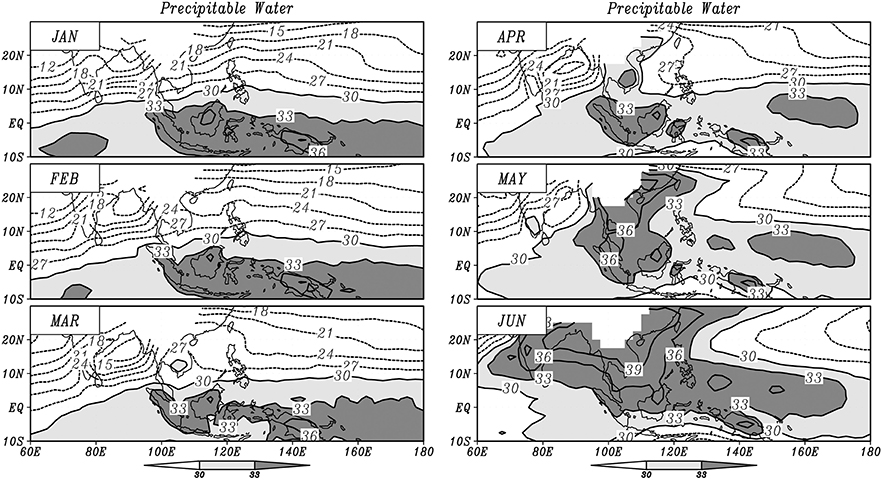
Figure 13. The climatological monthly mean distribution of the vertical integration of the precipitable water from January to June. The unit is mm. The interval of contours is 3 mm. Light and dark shadings are more than 30 and 33 mm, respectively. The region, which the surface pressure is under 925 hPa, is neglected.
We now discuss the difference due to the area of moisture in greater detail. Moisture levels increase earlier over the South China Sea than over the Bay of Bengal. During the pre-monsoon season, the air above the South China Sea is more humid than that above the Bay of Bengal. Figure 14 shows the vertical profile of specific humidity over the Bay of Bengal (along 90°E, 10–15°N), the Indochina Peninsula (along 102.5°E, 10–15°N), and the South China Sea (along 115°E, 10–15°N), from March to May. In March and April, specific humidity in the lower troposphere over the Bay of Bengal is less than that over the Indochina Peninsula and the South China Sea. It is important to emphasize that the specific humidity in the lower troposphere over the Indochina Peninsula is greater than over the surrounding sea in March and April. In May, the specific humidity over the three regions is similar. We suggest that the increase in moisture over the Indochina Peninsula results from a strengthening of the upward flow associated with the trough passage in the upper troposphere.
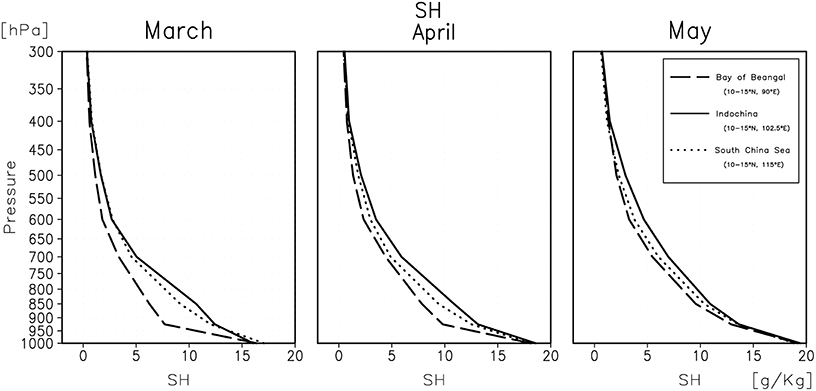
Figure 14. The climatological vertical profile of the specific humidity from March to May. The dash, solid, and dotted line means over the Bay of Bengal (along 90°E, 10–15°N), the Indochina Peninsula (along 102.5°E, 10–15°N) and the South China Sea (along 115°E, 10–15°N), respectively. The unit is g Kg−1.
Effects of Pre-Monsoon Rainfall on Monsoon Onset
Kiguchi et al. (2013) indicated that heat flux from land surface is changed by Type A events during the pre-monsoon period. Because a previous study (Ishizaki and Ueda, 2006) suggested that convection during the pre-monsoon season affects monsoon onset, we considered the effects of pre-monsoon rainfall events over the Indochina Peninsula. Figure 15 shows the relationship between early / late monsoon onset date and rainfall amount during the pre-monsoon from March to the monsoon onset date in each year from 1979 to 2002, as defined in Table 1. In addition, Figure 15 presents the rainfall intensity per upper trough during the pre-monsoon season. The rainfall amount during the pre-monsoon period is large when the monsoon onset is late. Correlation between the monsoon onset date and rainfall amount during the pre-monsoon period is 0.73, exceeding significance at a 99% confidence level. Rainfall amount per upper trough is almost constant, indicating that the rainfall amount during the pre-monsoon season is defined by the length of the pre-monsoon season.
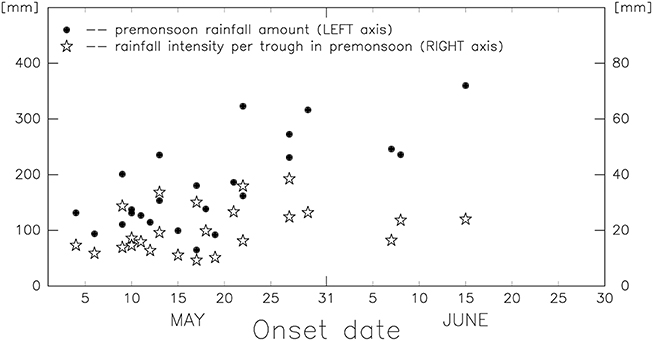
Figure 15. The monsoon onset date vs. the rainfall amount during the pre-monsoon period. The unit of the rainfall amount is mm. Close circle and open star mean the pre-monsoon rainfall amount (left axis) and the rainfall amount per each trough (right axis), respectively.
However, the sensible heat flux from the land surface over the Indochina Peninsula is large in March and April in the mean field (Tian and Yasunari, 1998). To reveal the relationship between the rainfall activity during the pre-monsoon period and the start of monsoon circulation, a heat budget analysis for the area above the Indochina Peninsula during the pre-monsoon period is required. Recently, Singhrattna et al. (2012) tried to forecast rainfall amount over Thailand using statistical approach. Their model presents better performance in pre-monsoon rainfall in dry years compared to wet years, in particular, at the lead time of 5–6 months, and vice versa for monsoon rainfall. For the forecasting of rainfall amount during pre-monsoon and monsoon season, the understanding of relationship between pre-monsoon condition and monsoon is necessary.
Conclusion
We considered the following three problems, as described in Section Introduction.
1. The characteristics of the upper trough.
2. The reason for the significant amount of moisture during the pre-monsoon season.
3. The relationship between the intermittent rainfall during the pre-monsoon season and the monsoon onset.
First, our results indicated that the weak jet westerly in the west of the Indochina Peninsula associated with the upper trough. This cyclone has a mid-latitude structure rather than a tropical one. In other words, its structure is baroclinic. The upper trough over the study area is produced by the mid-latitude regime.
Second, it was suggested that a significant amount of moisture over the Indochina Peninsula is relative to the intermittent rainfall phenomena (Type A) associated with passage of the upper trough and continuous rainfall occurred over a wide region (Type B) events associated with equatorial southwesterlies. In the climatology, a convergence zone is present over the Indochina Peninsula. However, the most important aspects for moisture convergence during the pre-monsoon are Type A events produced by both convergence in the lower troposphere and inflow of equatorial southwesterlies.
Third, an analysis of the correlation between rainfall amounts during the pre-monsoon season and the monsoon onset date suggested that no relationship exists between monsoon onset and Type A events during the pre-monsoon season. Ishizaki and Ueda (2006) indicated that latent heat is released by pre-monsoon rainfall. In the future, the correlation should be studied using the heat budget rather than the rainfall amount.
While the environmental field before monsoon onset should be important. Kawamura et al. (2002) noted that the rapid intensification of land-ocean thermal contrast during the pre-monsoon season causes well-organized continental-scale shallow vertical circulation over the Australian continent. This is important for the enhanced convective instability required for monsoon onset. In addition, the arrival of large-scale disturbances (such as the Madden-Julian oscillation) is required before deep cumulus convection can break out, indicating the onset of the monsoon. The environmental field required for monsoon onset over the Indochina Peninsula is not yet known. The atmospheric conditions, however, are affected by disturbances during the pre-monsoon season (Ishizaki and Ueda, 2006). From upper balloon observations, Nodzu et al. (2006) found that instability in the near-surface layer is dominant from mid-February to monsoon onset in Bangkok, Thailand. In this sense, the environmental field for the monsoon onset should be prepared during the pre-monsoon season. Future studies should further investigate the conditions required for monsoon onset.
We investigated pre-monsoon rainfall phenomena using a multiple-year analysis. We successfully isolated the rainfall in the pre-monsoon period by focusing on the lower wind. We found continuous rainfall occurred over a wide region (Type B) during the pre-monsoon season. In addition, we found that the causes of pre-monsoon rainfall depended on the wind system. The absence of a relationship between the monsoon onset date and the rainfall amount during the pre-monsoon is an interesting result.
Author Contributions
MK have analyzed main results and make figures and tables. JM, SK, and TO have discussed with MK many times.
Conflict of Interest Statement
The authors declare that the research was conducted in the absence of any commercial or financial relationships that could be construed as a potential conflict of interest.
Acknowledgments
Part of this study was financially supported by the JSPS KAKENHI (grant number 26220202, 23226012), the Core Research for Evolutional Science and Technology (CREST) project of the Japan Science and Technology Agency (JST), JST/JICA (Japan International Cooperation Agency), SATREPS (Science and Technology Research Partnership for Sustainable Development), and by the Global Environment Research Fund (S-10, S-14) from the Japanese Ministry of the Environment. In memory of Prof. Takehiko SATOMURA, who made a great contribution to this paper and inspired many during his short life.
References
Cheang, B. K., and Tan, V. H. (1988). Some aspects of the summer monsoon in South-East Asia May to September 1986. Aust. Met. Mag. 36, 227–233.
Flatau, M. K., Flatau, P. J., and Rudnick, D. (2001). The dynamics of double monsoon onsets. Clim. J. 14, 4130–4146. doi: 10.1175/1520-0442(2001)014<4130:TDODMO>2.0.CO;2
Fu, R., and Li, W. (2004). The influence of the land surface on the transition from dry to wet season in Amazonia. Theor. Appl. Climatol. 78, 97–110. doi: 10.1007/s00704-004-0046-7
Holland, G. J. (1986). Interannual variability of the Australian summer monsoon at Darwin: 1952–82. Mon. Wea. Rev. 114, 594–604.
Hsu, H. H., Terng, C. T., and Chen, C. T. (1999). Evolution of large-scale circulation and heating during the first transition of Asian summer monsoon. Clim. J. 12, 793–810.
Htway, O., and Matsumoto, J. (2011). climatological onset dates of summer monsoon over Myanmar. Int. J. Climatol. 31, 382–393. doi: 10.1002/joc.2076
Ishizaki, N., and Ueda, H. (2006). Seasonal heating processes over the Indochina Peninsula and the Bay of Bengal prior to the monsoon onset in 1998. J. Meteorol. Soc. Jpn. 84, 375–387. doi: 10.2151/jmsj.84.375
Joseph, P. V., Eischeid, J. K., and Pyle, R. J. (1994). Interannual variability of the onset of the Indian summer monsoon and its association with atmospheric features, El Nino, and sea surface temperature anomalies. Clim. J. 7, 81–105.
Kalnay, E., Kanamitsu, M., Kistler, R., Collins, W., Deaven, D., Gandin, L., et al. (1996). The NCEP/NCAR 40-year reanalysis project. Bull. Am. Meteorol. Soc. 77, 437–471.
Kanae, S., Oki, T., and Musiake, K. (2002). Principal condition for the earliest Asian summer monsoon onset. Geophys. Res. Lett. 29, 1746. doi: 10.1029/2002GL015346
Kawamura, R., Fukuta, Y., Ueda, H., Matsuura, T., and Iizuka, S. (2002). A mechanism of the onset of the Australian summer monsoon. J. Geophys. Res. 107, ACL 5-1–ACL 5-15. doi: 10.1029/2001JD001070
Kiguchi, M., and Matsumoto, J. (2005). The rainfall phenomena during the pre-monsoon period over the Indochina Peninsula in the GAME-IOP year, 1998. J. Meteorol. Soc. 83, 89–106. doi: 10.2151/jmsj.83.89
Kiguchi, M., Miyazaki, S., Kim, W., Kanae, S., Oki, T., Matsumoto, J., et al. (2013). “The heat flux from the land surface during the pre-monsoon season in the inland region of Thailand, Climate and Land-surface Changes in Hydrology,” in Proceedings of H01, IAHS-IAPSO-IASPEI Assembly, Gothenburg, 359, 239–245.
Kodama, Y.-M., Ohta, A., Katsumata, M., Mori, S., Satoh, S., and Ueda, H. (2005). Seasonal transition of predominant precipitation type and lightning activity over tropical monsoon areas derived from TRMM observations. Geophys. Res. Lett. 32, L14710. doi: 10.1029/2005GL022986
Lau, K. M., and Yang, S. (1997). Climatology and interannual variability of the southeast Asian summer monsoon. Adv. Atmos. Sci. 14, 141–162. doi: 10.1007/s00376-997-0016-y
Li, J., and Zhang, L. (2009). Wind onset and withdrawal of Asian summer monsoon and their simulated performance in AMIP models. Clim. Dyn. 32, 935–968. doi: 10.1007/s00382-008-0465-8
Liebmann, B., and Smith, C. A. (1996). Description of a complete (interpolated) outgoing longwave radiation dataset. Bull. Am. Meteorol. Soc. 77, 1275–1277.
Matsumoto, J. (1992). The seasonal changes in Asian and Australian monsoon regions. J. Meteorol. Soc. 70, 257–273.
Matsumoto, J. (1997). Seasonal transition of summer rainy season over Indochina and adjacent monsoon region. Adv. Atmos. Sci. 14, 231–245. doi: 10.1007/s00376-997-0022-0
Murakami, T., and Huang, G. W. (1984). Orographic effects of the Tibetan Plateau on the rainfall variations over central China during the 1979 summer. J. Meteorol. Soc. Jpn. 62, 895–909.
Nguyen-Le, D., Matsumoto, J., and Ngo-Duc, T. (2015). Onset of the rainy seasons in the eastern Indochina Peninsula. Clim. J. 28, 5645–5666. doi: 10.1175/JCLI-D-14-00373.1
Nodzu, M. I., Ogino, Y. S., Tachibana, Y., and Yamanaka, M. D. (2006). Climatological description of seasonal variations in lower-tropospheric temperature inversion layers over the Indochina Peninsula. Clim. J. 19, 3307–3319. doi: 10.1175/JCLI3792.1
Orgill, M. (1967). Some Aspects of the Onset of the Summer Monsoon Over South East Asia, Report to Army, U. S. Contact DA28–043–AMC–01303(E), Colorado State University, 75.
Promchote, P., Wang, Y. S., and Johnson, P. G. (2016). The 2011 great flood in Thailand: climate diagnostics and implications from climate change. Clim. J. 29, 367–379. doi: 10.1175/JCLI-D-15-0310.1
Qian, W., and Yang, S. (2000). Onset of the regional monsoon over Southeast Asia. Meteorol. Atmos. Phys. 75, 29–38. doi: 10.1007/s007030070013
Romatschke, U., and Houze, R. A. Jr. (2011). Characteristics of precipitating convective systems in the premonsoon season of South Asia. J. Hydrometeor. 12, 157–180. doi: 10.1175/2010JHM1311.1
Singhrattna, N., Babel, M. S., and Perret, S. R. (2012). Hydroclimate variability and long-lead forecasting of rainfall over Thailand by large-scale atmospheric variables. Hydrol. Sci. J. 57, 26–41. doi: 10.1080/02626667.2011.633916
Stiller-Reeve, M. A., Spengler, T., and Chu, S. P. (2014). Testing a flexible method to reduce false monsoon onsets. PLoS ONE 9:e104386. doi: 10.1371/journal.pone.0104386
Thompson, B. W. (1951). An essay on the general circulation of the atmosphere over Southeast Asia and the west Pacific. Q. J. R. Meteorol. Soc. 77, 569–597. doi: 10.1002/qj.49707733404
Tian, S.-F., and Yasunari, T. (1998). Climatological aspects and mechanism of spring persistent rains over central China. J. Meteorol. Soc. Jpn. 76, 57–71.
Uang-aree, P., Kingpaiboon, S., and Khuanmar, K. (2015). Determination of the dates of the southwest monsoon in northeastern Thailand from the data on precipitable water vapor obtained by GPS. Russian Meteorol. Hydrol. 40, 647–657. doi: 10.3103/S1068373915100027
Wang, B., and LinHo. (2002). Rainy season of the Asian–Pacific summer monsoon. Clim. J. 15, 386–398. doi: 10.1175/1520-0442(2002)015<0386:RSOTAP>2.0.CO;2
Wang, B., LinHo, Zhang, Y., and Lu, M. (2004). Definition of South China Sea monsoon onset and commencement of the East Asia summer monsoon. Clim. J. 17, 699–710. doi: 10.1175/2932.1
Webster, P. J. (1987). “The elementary monsoon,” in Monsoons, eds J. S. Fein and P. L. Stephens (New York, NY: Wiley Interscience), 3–32.
Webster, P. J., Magana, V. O., Palmer, T. N., Shukla, J., Tomas, R. A., Yanai, M., et al. (1998). Processes, predictability, and the prospects for prediction. J. Geophys. Res. 103, 14451–14510. doi: 10.1029/97JC02719
Welch, B. L. (1947). The generalization of ‘Student's’ problem when several different population variances are involved. Biometrika 34, 18–27. doi: 10.2307/2332510
Xing, N., Li, J., and Wang, L. (2015). Effect of the early and late onset of summer monsoon over the Bay of Bengal on Asian precipitation in May. Clim. Dyn. doi: 10.1007/s00382-015-2944-z. [Epub ahead of print].
Xue, Y., de Sales, F., Li, P., Mechoso, C. R., Nobre, C. A., and Juang, M. (2006). Role of land surface processes in south American monsoon development. Clim. J. 19, 741–762. doi: 10.1175/JCLI3667.1
Xue, Y., Juang, M. H., Li, P., Prince, S., DeFries, R., Jiao, Y., et al. (2004). Role of land surface processes in monsoon development: east Asia and west Africa. J. Geophys. Res. 109, D03105. doi: 10.1029/2003jd003556
Yang, X., Yao, T., Yang, W., Xu, B., He, Y., and Qu, D. (2012). Isotopic signal of earlier summer monsoon onset in the Bay of Bengal. Clim. J. 25, 2509–2516. doi: 10.1175/JCLI-D-11-00180.1
Yoshifuji, N., Igarashi, Y., Tanaka, N., Tanaka, K., Sato, T., Tantasirin, C., et al. (2014). Inter-annual variation in the response of leaf-out onset to soil moisture increase in a teak plantation in northern Thailand. Int. J. Biometeorol. 58, 2025–2029. doi: 10.1007/s00484-013-0784-2
Yoshimura, K., Oki, T., Ohte, N., and Kanae, S. (2004). Colored moisture analysis estimates of variations in 1998 Asian monsoon water sources. J. Meteorol. Soc. Jpn. 82, 1315–1329. doi: 10.2151/jmsj.2004.1315
Zeng, X., and Lu, E. (2004). Globally unified monsoon onset and retreat indexes. Clim. J. 17, 2241–2248. doi: 10.1175/1520-0442(2004)017<2241:GUMOAR>2.0.CO;2
Keywords: Asian monsoon, precipitation, mid-latitude westerly, upper trough, intermittent rainfall
Citation: Kiguchi M, Matsumoto J, Kanae S and Oki T (2016) Pre-Monsoon Rain and Its Relationship with Monsoon Onset over the Indochina Peninsula. Front. Earth Sci. 4:42. doi: 10.3389/feart.2016.00042
Received: 15 October 2015; Accepted: 01 April 2016;
Published: 06 May 2016.
Edited by:
David Mendes, Federal University of Rio Grande do Norte, BrazilReviewed by:
Ricardo De Camargo, Universidade de São Paulo, BrazilWen Chen, Chinese Academy of Sciences, China
Copyright © 2016 Kiguchi, Matsumoto, Kanae and Oki. This is an open-access article distributed under the terms of the Creative Commons Attribution License (CC BY). The use, distribution or reproduction in other forums is permitted, provided the original author(s) or licensor are credited and that the original publication in this journal is cited, in accordance with accepted academic practice. No use, distribution or reproduction is permitted which does not comply with these terms.
*Correspondence: Masashi Kiguchi, a2lndWNoaUBpaXMudS10b2t5by5hYy5qcA==