 Thorsten C. Seehaus1*
 Sebastián Marinsek2,3
 Pedro Skvarca4
 Jan M. van Wessem5
 Carleen H. Reijmer5
 José L. Seco2
 Matthias H. Braun1
- 1Institute of Geography, Friedrich-Alexander University Erlangen-Nürnberg, Erlangen, Germany
- 2Department of Glaciology, Instituto Antártico Argentino, Buenos Aires, Argentina
- 3Facultad Regional Buenos Aires, Universidad Tecnológica Nacional, Buenos Aires, Argentina
- 4Museo del Hielo Patagónico, Glaciarium, El Calafate, Argentina
- 5Institute for Marine and Atmospheric Research Utrecht, Utrecht University, Utrecht, Netherlands
The substantial retreat or disintegration of numerous ice shelves has been observed on the Antarctic Peninsula. The ice shelf in the Prince Gustav Channel has retreated gradually since the late 1980s and broke up in 1995. Tributary glaciers reacted with speed-up, surface lowering and increased ice discharge, consequently contributing to sea level rise. We present a detailed long-term study (1993–2014) of the dynamic response of Sjögren Inlet glaciers to the disintegration of the Prince Gustav Ice Shelf. We analyzed various remote sensing datasets to identify the reactions of the glaciers to the loss of the buttressing ice shelf. A strong increase in ice surface velocities was observed, with maximum flow speeds reaching 2.82 ± 0.48 m d−1 in 2007 and 1.50 ± 0.32 m d−1 in 2004 at Sjögren and Boydell glaciers respectively. Subsequently, the flow velocities decelerated, however in late 2014, we still measured approximately twice the values of our first observations in 1996. The Sjögren Inlet glaciers retreated 61.7 ± 3.1 km2 behind the former grounding line in 1996. For the glacier area below 1000 m a.s.l. and above the 2014 grounding (399 km2), a mean surface lowering of −68 ± 10 m (−3.1 m a−1) was observed in the period 1993–2014. The lowering rate decreased to −2.2 m a−1 in the period 2012–2014. Based on the surface lowering rates, geodetic mass balances of the glaciers were derived for different time periods. A strongly negative mass change rate of −1.16 ± 0.38 Gt a−1 was found for the area of all Sjögren Inlet glaciers (including the area above 1000 m a.s.l.) above the 2014 grounding line (559 km2) for the earliest period (1993–2001). Due to the dynamic adjustments of the glaciers to the new boundary conditions the rate changed to −0.54 ± 0.13 Gt a−1 in the period 2012–2014, resulting in an average mass change rate of −0.84 ± 0.18 Gt a−1 (1993–2014) for the same domain. Including the retreat of the ice front and grounding line, a total mass change of −37.5 ± 8.2 Gt (−1.79 ± 0.39 Gt a−1) and a contribution to sea level rise of 20.9 ± 5.2 Gt (−0.99 ± 0.25 Gt a−1) were computed for the period 1993–2014. Analysis of the ice flux revealed that available bedrock elevation estimates at Sjögren Inlet are too shallow and are the major uncertainty in ice flux computations. This temporally dense time series analysis of Sjögren Inlet glaciers shows that the adjustments of tributary glaciers to ice shelf disintegration are still ongoing and provides detailed information of the changes in glacier dynamics.
Introduction
On the northern Antarctic Peninsula substantial atmospheric changes have taken place in recent decades. A considerable increase in air temperature was reported, for example, by Skvarca et al. (1998) and Turner et al. (2005). Morris and Vaughan (2003) related the viability of ice shelves to the −9°C annual isotherm, which shifted southward with changing climatic conditions. Scambos et al. (2003) linked the instability and recession of ice shelves to an increase in summer air temperatures and surface melt. Shepherd et al. (2003) also reported previous thinning, indicating substantial basalt melt. Numerous ice shelves (e.g., Larsen A/B, Larsen Inlet, Prince Gustav and Wordie) along the Antarctic Peninsula have significantly retreated or disintegrated since the late 1980s (Cook and Vaughan, 2010). Former ice shelf tributary glaciers reacted with accelerated ice flow and surface lowering to the loss of the buttressing ice shelf (e.g., Rott et al., 2002, 2007; De Angelis and Skvarca, 2003; Rack and Rott, 2003, 2004; Rignot et al., 2004; Wendt et al., 2010). Subsequently, significant glacier surface lowering was observed by Berthier et al. (2012) and Scambos et al. (2004) as a consequence of increased ice discharge. Rott et al. (2011) and Wuite et al. (2015) quantified the ice discharge of the Larsen B outlet glaciers using various remote sensing data. Along the Nordenskjöld Coast, Rott et al. (2014) derived a mass change rate of −4.2 ± 0.4 Gt a−1 for the period 2011–2013 from bi-temporal TanDEM-X data. Based on photogrammetric digital elevation models (DEMs), a mass change rate of −24.9 ± 7.8 Gt a−1 (2003–2008) for the northern Antarctic Peninsula was found by Scambos et al. (2014). Ivins et al. (2011) reported a current ice mass change rate of −41.5 ± 9 Gt a−1 from analysis of GRACE time series and bedrock uplift data. Shepherd et al. (2012) performed an integrated glacier mass balance compilation of the Antarctic and Greenland ice sheets based on modeling results and observation data. The authors revealed a mass change rate of −20 ± 14 Gt a−1 (1992–2011) at the Antarctic Peninsula. The regional estimates show a significant mass loss at the Antarctic Peninsula, however, the individual imbalance results vary strongly and have uncertainties of up to 70%.
Seehaus et al. (2015) performed a detailed time series analysis of various remote sensing datasets for the Dinsmoor-Bombardier-Edgeworth glacier system. The authors compiled the results in a comprehensive study of the effects of ice shelf disintegration for former Larsen-A tributary glaciers in the period 1993–2014. They identified major sources of uncertainties in mass loss computations. Furthermore, significant temporal variations of ice dynamics and mass loss were found, indicating that bi-temporal data analysis only partly reveals the dynamic response of tributary glaciers. The aim of this study is thus to analyze the dynamic adjustments of the Sjögren Inlet glaciers since the disintegration of the Prince Gustav Ice Shelf, as well as to examine the temporal change in imbalance and to quantify the ice mass loss for the whole study period 1993–2014.
Study Site
The Prince Gustav Ice Shelf was the most northerly ice shelf in Antarctica, covering an area of ~1600 km2 in 1957 between James Ross Island and the Antarctic Peninsula (Figures 1, 2B). It retreated gradually and broke up in 1995 (Skvarca et al., 1995; Cooper, 1997; Ferrigno et al., 2006; Cook and Vaughan, 2010) with the subsequent retreat, thinning and acceleration of former tributaries in the Röhss Bay on James Ross Island and Sjögren Inlet on the Antarctic Peninsula (Rau et al., 2004; Glasser et al., 2011; Rott et al., 2014). In 1993, the Prince Gustav Ice Shelf had retreated to the southern end of the mouth of Sjögren Inlet (ERS-1 SAR image 16 February, 1993; and in Rott et al., 1996 ERS-1 SAR image 26 August 1993). Subsequently, the ice front of Sjögren Inlet receded rapidly inwards of the bay. The retreat states between 1993 and 2014 are show in Figure 1. The catchment of Sjögren Inlet covered an area of about 560 km2 in 2014 and consists of five tidewater glaciers, where Sjögren and Boydell glaciers dominate. The glacier catchment delineations are taken from the Antarctic Digital Database ADD6.0 (Cook et al., 2014) and the glaciers are named according to Davies et al. (2012). The GAP11 and GAP12 glaciers defined in Davies et al. (2012) are merged in the ADD6.0 delineations to jointly form the Sjögren Glacier. The same definition is used in this study. The lower regions with gentle surface slopes are separated from the Antarctic Peninsula plateau by escarpments and ice falls. A strong west-east gradient in precipitation from the plateau to the coastal regions is caused by strong westerly winds reaching over the peninsula's mountain range (van Wessem et al., 2015). The study site is often affected by foehn-type wind situations (Orr et al., 2004; Marshall et al., 2006; Cape et al., 2015), inducing higher surface air temperatures and increased solar radiation (due to cloud free conditions) compared to the west coast of the peninsula. High surface melt and the formation of melt ponds at lower elevations are linked to these events.
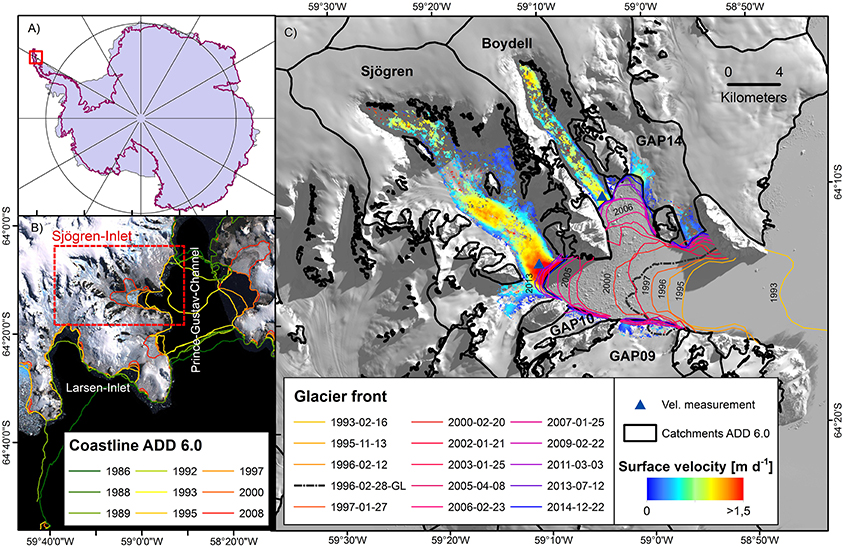
Figure 1. Panels (A,B): Location of Sjögren Inlet on the Antarctic Peninsula and retreat states of the Prince Gustav Ice Shelf. Map base, Landsat LIMA Mosaic © USGS and SCAR Antarctic Digital Database, version 6.0. Panel (C), Surface velocity field and glacier front variation of Sjögren Inlet glaciers. Surface velocities were derived from TerraSAR-X/TanDEM-X acquisitions (December 11 and 22, 2012). Colored lines, Changes of glacier front position picked from SAR intensity images. Black dashed-dotted line, Grounding line position in 1996 (Rignot et al., 2011). Blue triangles, Positions of surface velocity measurements. Black polygons, Glacier catchments from SCAR Antarctic Digital Database, version 6.0. Background, Landsat 8 image (band 4) from August 30, 2014 © USGS (for hypsometric curves of glacier catchments see Figure 3).
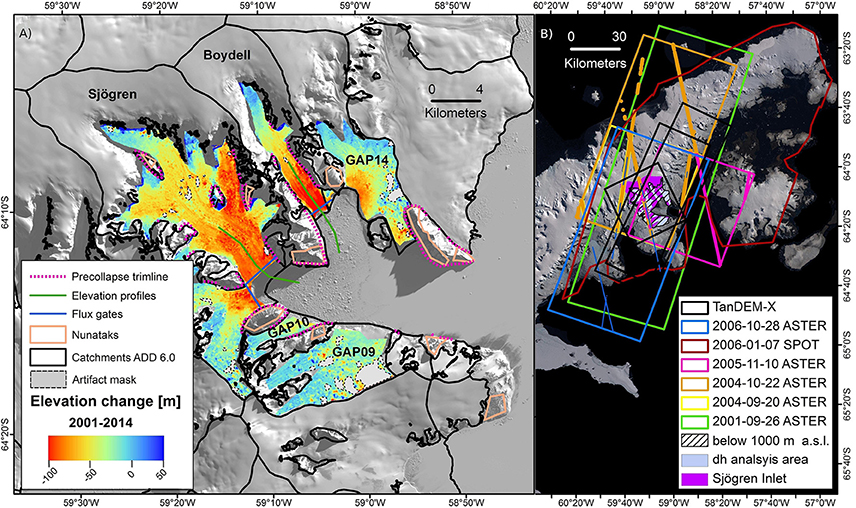
Figure 2. Panel (A): Glacier surface elevation change between September 26, 2001 and December 22, 2014 at Sjögren Inlet. Pink dotted lines, Pre-collapse trimline mapped on a Landsat 5 image from March 1, 1986. Green lines, Surface elevations profiles along Sjögren and Boydell glaciers (see Figure 5). Blue lines, Flux gates at Sjögren and Boydell glaciers (cross sections see Figure 7). Orange polygons, Rock outcrops (stable ground) used to assess the accuracy of the DEM referencing. Black polygons, Glacier catchments from SCAR Antarctic Digital Database, version 6.0. Dashed black polygons, Manually masked out artifacts in ASTER DEM from September 26, 2001. Background, Landsat 8 image (band 4) from August 30, 2014 © USGS. Panel (B), Spatial extent of DEMs used and coverage of stereoscopic DEMs by ICESat GLAS data (same color as the DEM extents for the respective dates) acquired at a time interval of ±20 days relative to the DEM acquisition (date format: yyyy-mm-dd). Striped polygon, Areas below 1000 m a.s.l. Light blue polygon, Area of elevation change measurements (dh), Purple polygon, Sjögren Inlet catchment area.
Data and Methods
A broad multi-mission remote sensing database is used to study the adjustments of the Sjögren Inlet glaciers forced by the disintegration of the Prince Gustav Ice Shelf. The processing and accuracy analysis are briefly described in the following. Details of the work flow, error analysis and specification of the sensors and datasets are provided in Seehaus et al. (2015).
Flow Velocity and Glacier Extent
Surface velocity fields and glacier retreat are derived by means of Synthetic Aperture Radar (SAR) image time series (1993–2014). Intensity offset tracking (Strozzi et al., 2002) is applied to consecutive image pairs to obtain displacement fields for the respective observation intervals. The accuracies of the velocity measurements are the sum of the uncertainties of the image co-registration (measured on stable reference points like rock outcrops) and the intensity offset tracking process (depending on image resolution, time interval, and oversampling, according to McNabb et al., 2012). Glacier fronts are manually mapped on multilooked SAR intensity images. GAMMA Remote Sensing software is used for processing the SAR data.
Surface Elevation Changes
The Sjögren Inlet glaciers are part of a “super test site” in the TanDEM-X mission plan. Consequently, bi-static interferometric SAR data have been regularly acquired by the TanDEM-X satellites at the study site since 2011. We interferometrically derived DEMs from the TanDEM-X Coregistered Single look Slant range Complex datasets (DLR-IMF et al., 2012). In order to reduce potential phase unwrapping errors a differential interferometric approach is applied. The ASTER AP DEM (Cook et al., 2012) is used as a reference DEM and in combination with the TanDEM-X data a differential interferogram is computed. Afterwards, the differential interferogram is filtered, phase unwrapped and transferred into an absolute DEM by adding the elevation from the reference DEM. Finally the TanDEM-X DEM is geocoded and orthorectified. In combination with DEMs (Table 1) from the “SPOT 5 stereoscopic survey of Polar Ice: Reference Images and Topographies” (SPIRIT) project (Korona et al., 2009) and Terra ASTER (Level 3 products processed by NASA Land Processes Distributed Active Archive Center, LP DAAC), changes in surface elevation are calculated by DEM differencing. Artifacts in the stereoscopic DEMs, caused by for example, sensor saturation, low image contrast or clouds, are manually masked out. The ASTER DEM in 2001, the SPIRIT DEM in 2006, and the TanDEM-X DEMs are vertically adjusted at sea level. Since stereoscopic DEMs are less reliable on water surfaces and TanDEM-X data strongly de-correlates on water, the sea ice covered area in Sjögren Inlet bay is used as a reference area (mean standard deviation of the vertical offsets on reference area is 2.02 m). The tidal changes of the sea level derived from the Circum-Antarctic Tidal Simulations model CATS2008a_opt (an updated version of the barotropic inverse tide model described by Padman et al., 2002) reach up to 3.74 m at the study site. A tidal correction is therefore included in the vertical DEM referencing. All other ASTER DEMs are vertically referenced to ICESat Geoscience Laser Altimeter System data (GLA06 L1B Global Elevation Data Version 33, Zwally et al., 2012) acquired at a time interval of ±20 days relative to the DEM acquisition. Figure 2B shows the spatial extent of the DEMs used and the ICESat coverage. The number of ICESat measurements used for vertical referencing, the respective laser periods and the measured vertical biases of all DEMs are listed in Table 1. The obtained offsets of the TanDEM-X DEMs vary between −35.44 and −11.84 m, due to different satellite orbit geometries and phase unwrapping start location. After vertical referencing, the vertical uncertainty of the DEMs is assessed on stable rock outcrops (Figure 2, orange polygons). Pre-collapse surface elevations are determined by mapping the former trimline on a Landsat 5 image from March 1, 1986 and its elevation extracted from the SPOT SPIRIT DEM in 2006. The stereoscopic DEMs are less reliable in the accumulation areas on the Antarctic Peninsula plateau, e.g., due to low image contrast and sensor saturation. Moreover, the steep transition from the lower regions to the plateau affects the processing of the TanDEM-X DEMs by causing phase unwrapping errors (phase jumps). Consequently, analysis of elevation change (dh) is limited to regions ranging from the ice front position in 2014 up to the escarpments of the Antarctic Peninsula plateau (0–1000 m a.s.l., Figure 2B, striped polygon). Some TanDEM-X DEMs are affected by layover, shadowing and foreshortening close to the steep bluffs. These areas are masked out.
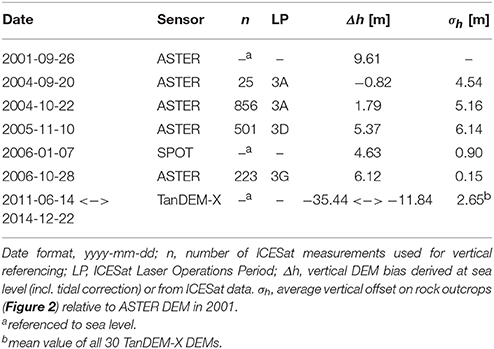
Table 1. Digital elevation models (DEMs) used to study surface elevation changes.
Mass Balance
Geodetic mass balances, according to Fountain et al. (1997), are derived from elevation change rate (dh/dt) measurements integrated over the glacier area and multiplied by an average ice density. In this study an average ice density of 900 kg m−3 is applied. Thin firn layer and bare ice surfaces were observed at lower elevations during field surveys. Firn compaction is thus considered to be insignificant, as was also previously found by Scambos et al. (2014). The mass balance calculations based on elevation change observations are limited to regions upstream of the glacier front position in 2014, which is assumed to correspond to the grounding line (see Section Results—Surface Elevation Change). The ice mass loss due to frontal retreat is computed separately and discussed in Section Discussion—Mass Balance. At the Antarctic Peninsula plateau, we applied an elevation change rate of 0.34 ± 0.15 m a−1 found by Scambos et al. (2014) at regions above 1000 m a.s.l., since our measurements are limited to areas below (see Section Data and Methods—Surface Elevation Changes). In areas not covered by our dh/dt analysis, volume change is derived by hypsometric interpolation at 50 m intervals using the observed mean elevation change rates for each altitude band. Figure 3 shows the hypsometric curves of Sjögren Inlet glaciers based on the ASTER AP DEM. The geodetic mass balance of all Sjögren Inlet glaciers combined and Sjögren and Boydell glaciers separately are calculated for five periods (four successive periods and the entire study period).
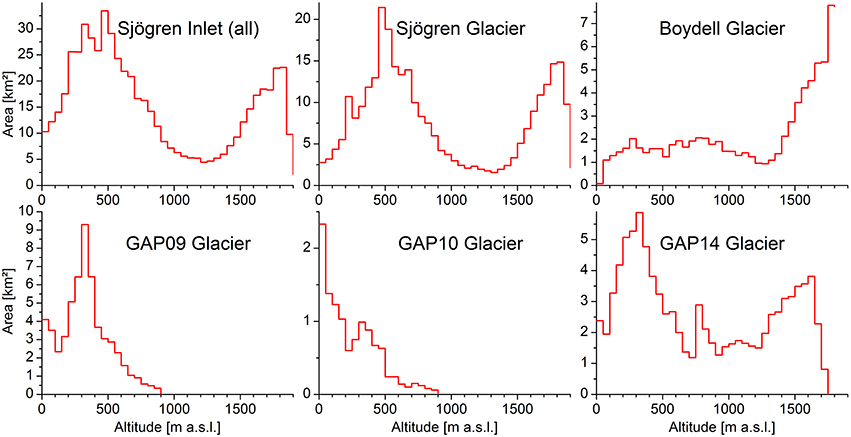
Figure 3. Hypsometric curves of Sjögren-Inlet glacier catchments based on the digital elevation model from Cook et al. (2012). Note the different scaling of the y-axes.
To evaluate the glacier mass balance and its temporal changes, the imbalance ratio is calculated for different time steps. According to Scambos et al. (2014), we calculated the imbalance ratio (I) by dividing the geodetic mass balance by the climatic mass balance (bclim; surface mass balance including internal accumulation according to Cogley et al., 2011). It indicates the level of imbalance of a glacier system. Climatic mass balance is analyzed from the regional atmospheric climate model RACMO2.3 at a horizontal resolution of 27 km (van Wessem et al., 2014) and of 5.5 km (van Wessem et al., 2016). Both model versions cover the period 1979–2014 and are forced at the lateral boundaries by ERA-Interim reanalysis data (Dee et al., 2011). The 27 km grid size model version covers the complete Antarctic ice sheet, while the high resolution version only covers the Antarctic Peninsula, leading to slight but insignificant differences in the boundary forcing (van Wessem et al., 2016). The climatic mass balance data is extracted for the individual catchments, considering a weighting of partly covered model grid cells.
Ice Mass Flux
The ice mass fluxes of Sjögren and Boydell glaciers are computed at the flux gates close to the estimated grounding line position in 2014 (Figure 2 and Section Conclusions). Ice thickness at the flux gates is calculated by utilizing the Huss and Farinotti (2014) bedrock map of the Antarctic Peninsula and the TanDEM-X DEM from December 22nd, 2014. The bedrock map is based on ice dynamic modeling. Changes in ice thickness due to surface lowering are considered in the ice flux computations. Surface velocities and bclim (from RACMO2.1, Lenaerts et al., 2012) were used as input as well as various ice thickness measurements for calibration and validation. The precision of the ice thickness at the flux gates is estimated using the accuracy map of the bedrock dataset.
Results
Flow Velocity and Glacier Extent
Due to the continuous retreat of the Prince Gustav Ice Shelf, the Sjögren Inlet was no longer buttressed by the ice shelf in early 1993. Subsequently, the ice front retreated rapidly into the Sjögren Inlet bay until it reached an almost stable position in 2007. The area change is calculated relative to the grounding line position in 2006 from Rignot et al. (2011) (black dashed-dotted line Figure 1). Its temporal course is plotted in Figure 4. The maximum retreat of −61.7 ± 3.1 km2 is mapped on the TanDEM-X SAR image from April 6, 2014, which correlates to the loss of grounded ice (see Section Results—Surface Elevation Changes).
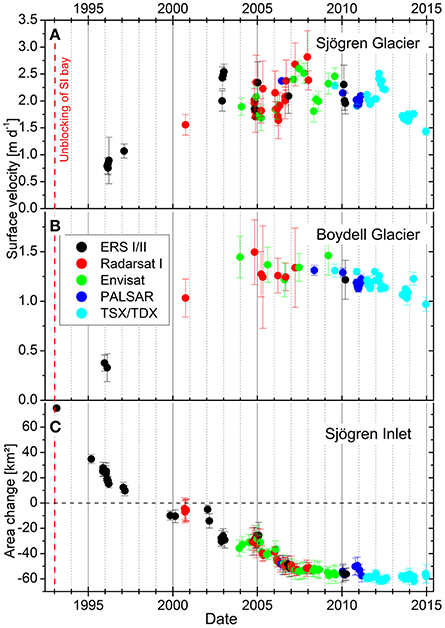
Figure 4. Variations of surface velocity and frontal retreat of Sjögren Inlet glaciers between 1995 and 2014. Panels (A,B): Surface velocities derived by SAR intensity tracking at the central flow line close to the front position in 2014 at Sjögren and Boydell glaciers (See Figure 1, blue triangles). Note the different scale of the y-axes. Panel (C): Glacier area changes due to frontal retreat relative to grounding line position in 1996.
The surface velocities of Sjögren and Boydell glaciers are measured at the central flow line position close to the ice front in 2014 (Figure 1, blue triangle). Within a radius of 200 m at both locations, the median ice velocities are extracted from the offset tracking results. Figure 4 shows the temporal changes (1995–2014) in surface velocities of both glaciers. The earliest tracking results reveal 0.79 ± 0.14 m d−1 for Sjögren Glacier in February 1996 and 0.38 ± 0.08 m d−1 for Boydell Glacier in December 1995. Flow velocities of both glaciers increased strongly afterwards, reaching the highest observed values of 2.82 ± 0.48 m d−1 for Sjögren Glacier in December 2007 and of 1.55 ± 0.32 m d−1 for Boydell Glacier in November 2004. Afterwards, the flow velocities decreased toward 1.44 ± 0.03 and 0.97 ± 0.07 m d−1 at Sjögren and Boydell glaciers in December 2014, respectively. In the austral summers 2002/03, 2004/05, 2006/07, 2007/08, 2010/11, 2011/12, and 2013/14 some short-term speedups are detected at Sjögren Glacier, which mostly correlate with fluctuations in the calving front position. Before 2002 and in austral summers 2003/04, 2005/06, 2008/09, 2009/10, and 2012/13 the data density is insufficient to evaluate such short term changes.
Surface Elevation Changes
Figure 2 shows the elevation differences between the ASTER DEM in 2001 and the latest TanDEM-X DEM from December 22, 2014. The surface lowering amounts to more than 100 m close to the calving front (2014) of Boydell Glacier and the mean measured lowering of all Sjögren Inlet glaciers is −34.1 ± 5.0 m during this period. We assume the recent grounding line position of all Sjögren Inlet glaciers to be close to the glacier front. No elevation change pattern is detected, which would indicate a grounding line position more upstream of the glacier. This assumption is supported by an observed increase in the slope a few 100 m behind the calving front. Elevation profiles along Sjögren and Boydell glaciers (Figure 2, green lines) are presented in Figure 5.
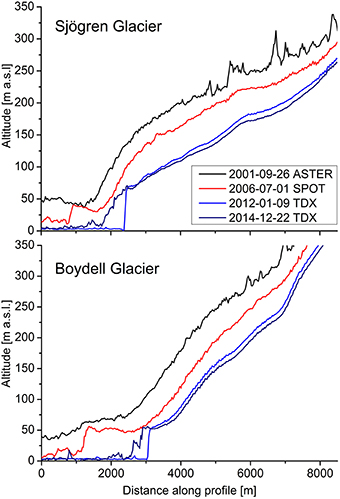
Figure 5. Ice surface elevation profiles at Sjögren and Boydell glaciers (see Figure 2). Breaks in slope on the lower part of the glaciers indicate the respective grounding line position. Date format: yyyy-mm-dd.
Changes in surface elevation are calculated relative to the earliest available cloudless stereoscopic ASTER acquisition on September 26, 2001. The vertical offsets σh of the DEMs relative to the ASTER DEM in 2001, calculated on rock outcrops, are listed in Table 1. DEMs are less reliable on steeper slopes (Toutin, 2002), which are typical for rock outcrops and nunataks. We thus used a maximum error of 5 m for our elevation change measurements, albeit the σh values of two ASTER DEMs are slightly higher. An inaccuracy of 10 m is estimated only for dh measurements derived from the DEM based on the trimline altitude. Figure 6 shows the mean measured surface lowering trend of Sjögren Inlet glaciers in the period 1993–2014. The ASTER DEMs in September 2004 and October 2006 are partly covered by clouds. The ASTER DEM in 2005 does not cover the whole study site, and therefore, not every ASTER DEM is used for each glacier to study elevation changes. It is supposed that the dynamic response to the disintegration of the Prince Gustav Ice Shelf started in early 1993, when the ice shelf had retreated behind the mouth of Sjögren Inlet bay. The derived pre-collapse surface elevation is thus taken as the starting point of the time series. At the GAP09, GAP10, and GAP14 glaciers, the pre-collapse surface elevation information only partly covers the glaciers. Therefore, the dh information of the covered area is interpolated by using the hypsometry (Figure 3) in order to calculate the average elevation change of all Sjögren Inlet glaciers between 1993 and 2001 (Figure 6). All glaciers show a clear surface lowering trend with a decrease in surface lowering rate in more recent years. The dense TanDEM-X time series (2011–2014) reveals seasonal fluctuation in austral summers 2011/12 and 2013/14. Higher surface elevations (~3–5 m) are found between late November and March. In austral summer 2012/13, the data density is too low to evaluate seasonal changes.
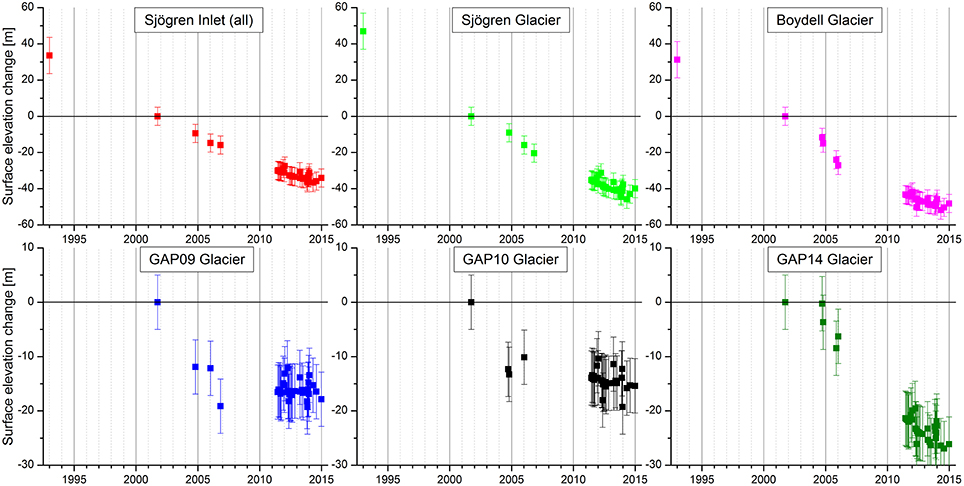
Figure 6. Mean measured surface elevation changes of Sjögren Inlet glaciers at areas below 1000 m a.s.l. relative to the ASTER DEM in 2001. Note the different scale of the y-axes for the lower graphs.
Mass Balance
The computed geodetic mass balance above the 2014 grounding line, ΔMT of the total glacier area and mass changes of the regions below 1000 m a.s.l. (ΔML), of all Sjögren Inlet glaciers combined and Sjögren and Boydell glaciers separately are listed in Table 2. For the period 2012–2014, an error for the elevation change rate of 0.34 m a−1 is applied. It is derived by differencing the corresponding TanDEM-X DEMs on stable areas and is similar to findings by Rott et al. (2014). In order to calculate the imbalance ratio, the climatic mass balance from both RACMO2.3 model versions is extracted considering 4 and 31 grid cells for the 27 km and the 5.5 km model version, respectively. The high resolution model version reveals bclim values ~3 times lower than for the 27 km model version. Due to the strong topographic gradients and spatial variability of precipitation at the study region, the results from the high resolution RACMO2.3 model version are used in the further analysis (see also Section Discussion). The obtained mean bclim values and glacier wide climatic mass balances Bclim as well as the imbalance ratios are also listed in Table 2 for the respective time intervals and catchments. The bclim shows a slight increase in recent years and the ΔMT is significantly less negative. Hence, the negative imbalance ratio decreased by a factor of about three and two compared to imbalance ratios of −4.7 ± 1.1 and −1.4 ± 0.6 at Sjögren and Boydell glaciers in the period straight after the collapse of the Prince Gustav Ice Shelf (negative imbalance ratios indicate the level of down wasting or excessive ice flux). The most recent imbalance ratio estimation of all Sjögren Inlet glaciers is ~3 times smaller than in the period 1993–2001, but still negative.
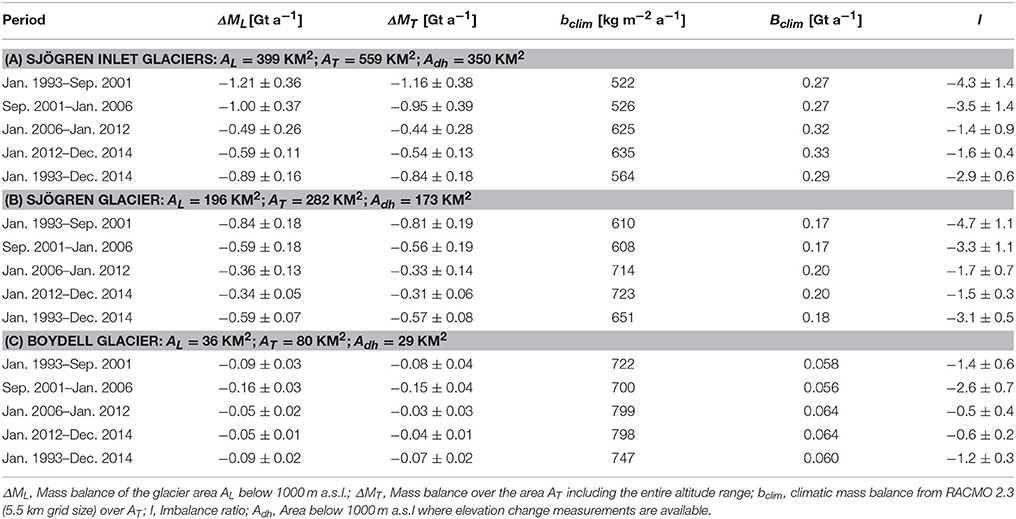
Table 2. Mass balance of all Sjögren-Inlet glaciers (A) and individually for Sjögren (B) and Boydell (C) glaciers for the area upstream of the grounding line in 2014 for different observation periods.
Ice Mass Flux
The profiles of bed topography, surface elevation (in December 2014) and ice thickness at the flux gate of Sjögren and Boydell glaciers are shown in Figure 7. The ice thickness is corrected for the linear trend of −3.6 m a−1 (R2 = 0.94) determined at regions below 200 m a.s.l. Figure 8 shows the temporal trend of the ice flux of Sjögren and Boydell glaciers. The horizontal lines indicate the mean bclim extracted from the RACMO2.3 model results in the study period. At the beginning of the study period, the mass flux of both glaciers is comparable to bclim. After the disintegration of the Prince Gustav Ice Shelf it increased significantly, up to fourfold, with a subsequent decrease. In the last observation period, it was about two times higher than under pre-collapse conditions. A peak curve fitting is applied to the flux time series to estimate the total mass discharge since the beginning of the study period. At Sjögren and Boydell glaciers it amounts to 13.80 and 2.77 Gt of ice, respectively.
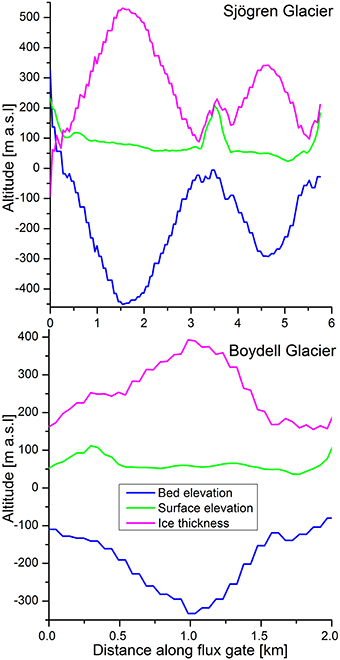
Figure 7. Ice surface and bedrock elevation at the flux gates of Sjögren and Boydell glaciers (see Figure 2). Blue line, Bedrock elevation from Huss and Farinotti (2014). Green line, Surface elevation from TanDEM-X DEM in December 2014. Pink line, Ice thickness = difference between surface and bedrock elevation.
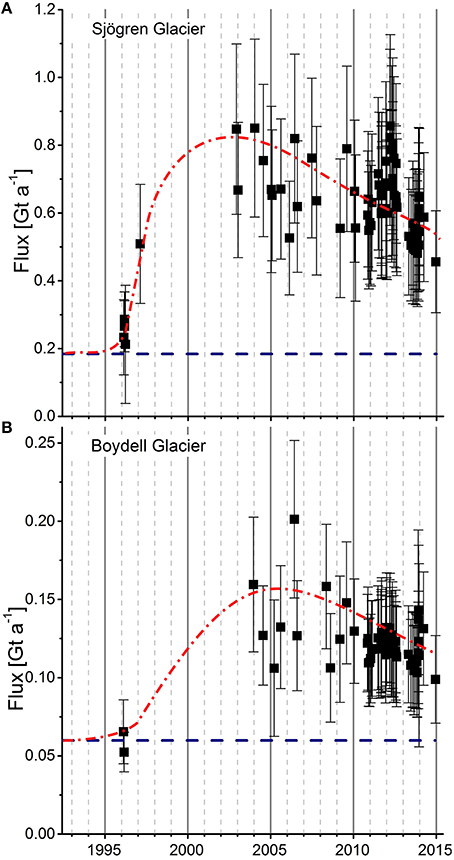
Figure 8. Temporal variation of ice mass flux at flux gates at (A) Sjögren and (B) Boydell glaciers. Blue dashed lines, Mean climatic mass balance of respective glacier derived from RACMO2.3. Red dashed-dotted lines, Curve fitting of ice flux (peak function).
Discussion
Ice Dynamics
Since the Prince Gustav Ice Shelf retreated behind the Sjögren Inlet bay in 1993, the ice dynamics of the tributary glaciers have shown substantial changes. In the 1990s, the glaciers retreated and accelerated rapidly, with a subsequent decrease in flow velocity and a stabilization of the ice front positions in recent years. The obtained flow velocities and ice flux of Sjögren and Boydell glaciers were about 2–3 times higher in 2014 than in late 1995 and early 1996, indicating that ice mass loss still persists. Unfortunately, no surface velocity information can be derived from SAR data before 1995 due to inadequate satellite image coverage.
Similar dynamic adjustments of tributary glaciers to ice shelf retreat and disintegration were reported for other study sites (e.g., Rignot et al., 2004; Rignot, 2005; Rott et al., 2011; Wuite et al., 2015). Our observed surface velocities at Sjögren Glacier are consistent with observations made by De Angelis and Skvarca (2003) and Rott et al. (2014). Some small deviations are most likely caused by differences in the location of the measurements. Davies et al. (2012) reported higher rates of glacier length changes at the Prince Gustav Ice Shelf tributary glaciers and a faster recession of the Sjögren Inlet glaciers between 1988 and 2001, compared to the period 2001–2009. Their findings are in accordance with ours, however the results presented in this study have a much higher temporal resolution. Maximum flow speeds are observed at Sjögren and Boydell glaciers 11 and 14 years after the retreat of the Prince Gustav Ice Shelf, respectively. The glacier front also stabilized its position after ~11 years of nearly continuous retreat. At Dinsmoor-Bombardier-Edgeworth glacier system, Seehaus et al. (2015) found the maximum velocity and a stabilization of the ice front position about 5–6 years after the disintegration Larsen-A Ice Shelf. The authors also observed a rapid increase in flow velocity shortly after ice shelf breakup. In contrast to Dinsmoor-Bombardier-Edgeworth glacier system, Sjögren and Boydell glaciers are located more inwards in the bay. The ice front at Sjögren Inlet was also about 10 km in 1993, and 3 km in 1996, away from the groundling line position in 1996. At Dinsmoor-Bombardier-Edgeworth glaciers system the ice front was close to the grounding line after disintegration of the Larsen-A Ice Shelf. Unfortunately, no information of the grounding line position in 1993 is available at Sjögren Inlet. We conclude that Sjögren and Boydell glaciers reacted more slowly to the loss of the ice shelf compared to Dinsmoor-Bombardier-Edgeworth glacier system, because of the different geometry of the glacier bays. Bedrock elevation data at the retreat areas would help to better interpret the different responses of the glaciers to nearly similar perturbations, but no reliable bathymetry data is available for either site.
Since 2002, short term accelerations and retreats of the glacier front have been detected. They occur during austral summers. We have two hypotheses to explain these events. On the one hand side, the accelerations and retreats could be caused by calving events and a weakening of the buttressing effect of the ice mélange in the fjord due to summer melt. Visual inspection of the SAR imagery reveals the formation of cracks and a fragmentation of the ice mélange in Sjögren Inlet bay as well as areas with open water in austral summers 2002/03, 2004/05, 2006/07, 2012/13. In austral summers 2007/08, 2010/11, and 2013/14 the ice mélange was not fragmented. Lower amplitudes of the accelerations are observed in these summers. This finding supports our hypothesis, and similar conclusions were obtained by Seehaus et al. (2015) for Dinsmoor-Bombardier-Edgeworth glacier system as well as by Amundson et al. (2010) and Moon et al. (2015) in Greenland. On the other hand, these events could be connected to melt water runoff availability, as observed by Moon et al. (2014) in Greenland. During early summer, an inefficient or closed subglacial drainage system may cause lubrication of the entire glacier bed, and thus a reduction of the basal friction with a consequent glacier speedup. If high runoff is available in late summer, the subglacial drainage system is well developed, forcing a channelized melt water discharge and a decline in glacier velocities as observed in 2005, 2007, 2008, 2010, and 2012 at Sjögren Glacier. Cape et al. (2015) analyzed meteorological records from the Argentine station Matienzo (~90 south of Sjögren Inlet) in the period 1962–2010. The authors found high numbers of foehn days in austral summers 2004/05, 2005/06, 2006/07, and 2007/08. Unfortunately, there are no observations available directly at Sjögren Inlet, but their findings support our hypotheses that high summer melt caused the acceleration and retreat events.
A continuous trend in ice surface elevation change was measured between 1993 and 2014 (−4.0 m a−1 at Sjögren Glacier, −3.6 m a−1 at Boydell Glacier, and −3.1 m a−1 for all Sjögren Inlet glaciers). The trend decreased in recent years, but still amounts to −2.51 m a−1 at Sjögren Glacier, and −2.17 m a−1 at Boydell for the period 2012–2014. Between austral winters 2011 and 2013, we observed a surface lowering rate of −1.90 m a−1 for all Sjögren Inlet glaciers, which is comparable to the findings of Rott et al. (2014) of −1.74 m a−1 for the similar period and observation area (the authors kindly provided their dh/dt grid). Scambos et al. (2014) found a value of −1.64 m a−1 for the period 2001–2006, which is significantly smaller than our observation of −3.45 m a−1. This divergence is most likely caused by the differences in the processing techniques and spatial extent of the observation area. The observation area of Scambos et al. (2014) also covers areas north-west of Sjögren Inlet and parts of Longing Peninsula, where relatively small elevation change values were observed. Our observed lowering rates are also comparable to, or smaller than, values reported for glacier systems in the Larsen-A/B region farther south. High surface lowering rates of −10 to −25 m a−1 at Hektoria, Green, Crane and Jorum glacier were found by Shuman et al. (2011) in the period 2001–2004. Seehaus et al. (2015) reported high surface lowering rates at Dinsmoor-Bombardier-Edgeworth glacier system immediately after the disintegration of the Larsen-A Ice Shelf in 1995 with subsequent smaller rates until 2014. This behavior is similar to that noted in our observations at Sjögren Inlet glaciers and indicates the dynamic adjustment of the tributary glaciers to the new boundary conditions. The surface lowering rate at Dinsmoor-Bombardier-Edgeworth glacier system was about 2 times higher than at Sjögren Inlet glaciers in the first years after ice shelf breakup, and is nearly the same in the period 2012–2014. The total surface lowering at Dinsmoor-Bombardier-Edgeworth glacier system is also significantly higher. These findings are in accordance with the more rapid and intense acceleration of the glacier system after ice shelf breakup, compared to Sjögren Inlet glaciers (see above).
Changes in the X-band SAR signal penetration depth most probably induced the seasonal changes in dh observed in the dense TanDEM-X data time series. Foehn wind events and summer melt cause a liquid water content in firn and on the snow surface. The scattering phase center of the SAR signal thus shifted close to the surface and penetration depth is minimal. By comparing TanDEM-X DEMs from the same season and comparing the stereoscopic DEMs with summer TanDEM-X DEMs (assuming nearly no penetration during summer melt conditions), we minimize the effect of SAR signal penetration on elevation change analysis (Seehaus et al., 2015).
Based on the SPOT SPIRIT DEM in 2006, Davies et al. (2012) classified the glacier tongues at Sjögren Inlet, except for Boydell Glacier, as “partly floating” and “grounded,” concordant with our grounding line estimate. The tongue of Boydell Glacier was classified as “floating,” which agrees partly with our findings. The break in slope, that indicates the grounding line position, was ~2 km upstream the glacier front in 2006 (Figure 5, lower panel, red line). Afterwards, the glacier front receded, whereas the break in slope moved backwards just slightly. In consequence, the grounding line position is currently close to the glacier front. Our own visual observations of the glacier tongue during survey flights support this assumption.
Mass Balance
The changes in ice dynamics after the disintegration of the Prince Gustav Ice Shelf caused a significant mass loss of its tributary glaciers. Between 1993 and 2014, 18.5 ± 4.0 Gt of ice upstream of the current grounding line (2014) were lost by dynamic readjustments. The mass gain in the plateau regions is very small, compared to relative large mass change ΔML observed in the lower regions, and just slightly affects the glacier wide mass balance ΔMT. The mass balance calculations reveal high mass losses after the retreat of the ice shelf, with a successive decrease. At Dinsmoor-Bombardier-Edgeworth glacier system, Seehaus et al. (2015) observed a similar temporal evolution of the mass loss at regions below 1000 m a.s.l. (observed area: 610 km2) as a consequence of ice shelf disintegration. In the period 2011–2013, Rott et al. (2014) found a mass change rate for Sjögren Inlet glaciers of −0.364 Gt a−1 ( −1.91 Mt km−2 a−1 observed area: 190.2 km2) at regions below the Antarctic Peninsula plateau, which is comparable to our observations in the period 2012–2014 considering the size of the observation area (Table 2). Scambos et al. (2014) reported a volume change of −1.40 km3 a−1 −1.26 Gt a−1 ( −1.48 Mt km−2 a−1 observed area: 852.8 km2) in regions below 1000 m a.s.l. for the period 2001–2006. As mentioned above, deviations from our results are most probably due to differences in the observed area.
All our observed ice mass loss, derived using the geodetic mass balance method, contributed to sea level rise, because it was measured on areas upstream of the grounding line position in 2014, however, the total contribution to sea level rise is certainly higher, since the grounding line has retreated significantly since 1996 (Section Conclusions). The thinning of the glacier caused the retreat of the groundling line. A glacier tongue starts to float when the ice-thickness decreases below a threshold defined by the hydrostatic equilibrium, and depends on the water depth (bedrock elevation). Consequently, only the ice mass loss of grounded ice contributes to sea level rise (see also Seehaus et al., 2015, Figure 2). Quantifying the ice mass loss caused by the retreat of the ice front and grounding line is difficult, since no reliable bathymetry data is available in the fjord (see also last paragraph of this section). The bedrock datasets from Huss and Farinotti (2014) and Bedmap2 (Fretwell et al., 2013) differ strongly in the retreat area, presumably caused by differences in the applied modeling and interpolation approaches and boundary effects at the margins of the model domains. We assume that all ice was grounded upstream of the grounding line in 1996 and estimate a mean fjord depth of −260 ± 66 m based on the average surface elevation (derived from trimline altitude analysis) at the former grounding line position in 1996 and the hydrostatic equilibrium assumption. Our estimate is larger than the average bedrock depth of −203 and −193 m at the flux gates of Sjögren and Boydell glaciers (Figure 7), respectively, based on the bedrock grid from Huss and Farinotti (2014). In combination with the pre-collapse surface elevations at the retreat area, a total mass change of −19.0 ± 4.2 Gt of previously grounded ice is found due to frontal retreat in the observation period. Just a small fraction of 2.4 ± 1.2 Gt contributed to sea level rise, because the volume below sea level of the lost ice has to be taken into account. Hence, the total mass change of −37.5 ± 8.2 Gt and contribution to sea level rise of 20.9 ± 5.2 Gt are comparable to values reported by Seehaus et al. (2015) for Dinsmoor-Bombardier-Edgeworth glacier system, even though larger surface lowering rates were found at the glaciers system. The size of the glacier catchments is comparable (~610 km2), but a larger fraction of Dinsmoor-Bombardier-Edgeworth glacier system covers the plateau, which is dynamically decoupled from the lower sections by escarpments and ice falls.
The temporal trend of the imbalance ratio clearly indicates a significant decrease in the glacier draw down. The imbalance ratio depends strongly on the applied climatic mass balance, and therefore, good quality bclim data is necessary. Due to the steep topography of the Antarctic Peninsula and pronounced upwind-downwind effects the climatic mass balance shows a strong spatial variability (Turner, 2002). Literature values from Fernandoy et al. (2012; Laclavère Plateau ~90 km northeast of Sjögren Inlet, bclim = 2350 kg m−2 a−1), Rott et al. (2011; Crane Glacier ~200 km southwest of Sjögren Inlet, bclim = 1087 ± 122 kg m−2 a−1) and Seehaus et al. (2015; Dinsmoor-Bombardier-Edgeworth glacier system ~40 km south of Sjögren Inlet, bclim = 1070–1720 kg m−2 a−1) also indicate the great spatial variability along the Antarctic Peninsula. Consequently, comparison of the model results at Sjögren Inlet with the literature values from other locations is difficult. The main glaciers in the Sjögren Inlet, Sjögren, and Boydell glaciers, have large, high-elevation accumulation areas at the plateau. Downstream of the easterly margins of the mountain ridge, the elevation drops strongly within several 100 m. At Sjögren Inlet catchment, the mean climatic mass balance (1979–2014) of the RACMO2.3 model amounts to 938 kg m−2 a−1 at regions above 1000 m a.s.l. and 418 kg m−2 a−1 below 1000 m a.s.l. On these small scales the results are very sensitive to the horizontal resolution of the model. Even at the high 5.5 km horizontal resolution of RACMO2.3, not all topographic features are resolved, affecting precipitation and foehn winds (van Wessem et al., 2016) and hence bclim. Despite this, the 5.5 km grid size RACMO2.3 model version is currently the most suitable model for our study region.
We assume that the Sjögren Inlet glaciers were in equilibrium before the breakup of the Prince Gustav Ice Shelf. The ice mass loss based on the curve fittings of the ice flux (Figure 8, red dotted dashed lines) is thus determined by subtracting bclim from the ice discharge. For the period 1993–2014, mass change rates for Sjögren and Boydell glaciers of −0.45 and −0.067 Gt a−1, respectively, are found. For both glaciers the mass change rate obtained from the ice flux is lower than the results obtained by the geodetic mass balance method (Sjögren: −0.57 ± 0.10 Gt a−1; Boydell: −0.07 ± 0.02 Gt a−1). The largest source of uncertainty in the computed ice mass flux is the bed topography. Surface velocities and the surface elevation at the flux gate show only small errors, however, no ice thickness measurements are available at Sjögren and Boydell glaciers, which could have been used to constrain the bedrock modeling and to reduce its uncertainty at the study site. Considering the difference in mass change rates obtained from dh measurements and ice mass flux, we conclude that the ice thickness at the flux gates is underestimated by about 30%.
Conclusions
This study presents a detailed long term analysis (1993–2014) of the response of tributary glaciers in the Sjögren Inlet to the retreat and disintegration of the Prince Gustav Ice Shelf. In early 1993, the Sjögren Inlet bay was no longer blocked by the ice shelf. As a consequence of the missing buttressing by the ice shelf, the glaciers receded by −9.1 km2 a−1 inwards of the Sjögren Inlet bay and the tributary glacier started to accelerate. During the last decade, the flow velocities slowed down, but are still higher than our earliest measurements in 1995/96. In contrast to Dinsmoor-Bombardier-Edgeworth glaciers system (Seehaus et al., 2015), the observed acceleration and surface lowering is less rapid and intense, which is most likely caused by the different settings of the glacier bay. In the period 1993–2001, the observed average mass loss rate is two times higher than in the time interval 2012–2014. The continuous decrease of mass loss leads to a reduction in the negative imbalance in recent years, with imbalance ratios ranging between −0.6 and −1.6 in the period 2012–2014. Overall, a total ice mass change of −37.5 ± 8.2 Gt and a contribution to sea level rise of 20.9 ± 5.2 Gt is found for all Sjögren Inlet glaciers in the study period 1993–2014. The temporally detailed analysis of glacier mass balances can be used to better delimitate and refine the glacio-isostatic uplift, found to be significant in the northern Antarctic Peninsula (Nield et al., 2014), since bi-temporal investigations do not fully reflect the ongoing dynamic changes.
Our observations point out that major uncertainties in mass balance calculations are caused by the imprecise bed topography data at the flux gates as well as at the glacier retreat area. The extreme elevation gradients and the high spatial variability of atmospheric parameters also suggest that the 5.5 km grid size RACMO2.3 model version currently provides the most reliable climatic mass balance database for the Antarctic Peninsula, where field measurements are still very sparse.
The nearly stable glacier front positions since 2007, the deceleration of the ice flow and the decrease in ice mass loss indicate that the dynamic response of Sjögren Inlet glaciers to ice shelf disintegration is slowly declining, however, the effects of the disintegration of the ice shelves on the dynamics of tributary glaciers can be still seen more than 20 years afterwards, as shown in this study. The comparison of the results of this study at Sjögren Inlet, with the analysis of the Dinsmoor-Bombardier-Edgeworth glacier system by Seehaus et al. (2015), reveals clear differences in the reaction and adjustments of tributary glaciers to ice shelf disintegration, most likely controlled by local settings such as bedrock elevation and fjord geometry. The temporally detailed analysis of ice dynamics performed in both studies provides a basis for modeling glacier responses to ice shelf disintegration in order to improve our understanding of the process.
Datasets generated for this study, such as surface velocity fields, DEMs and glacier front positions, are available via the PANGAEA database (https://www.pangaea.de), doi:10.1594/PANGAEA.859255.
Author Contributions
TS performed the remote sensing data analysis and imbalance computation. SM and JS organized the field surveys, supported the DEM analysis and provided additional GIS data sets. JW and CR processed and provided the RACMO2.3 data. PS co-lead the study and supported the field surveys. MB initiated the project, coordinated the research and wrote the manuscript jointly with TS. All authors revised the manuscript.
Conflict of Interest Statement
The authors declare that the research was conducted in the absence of any commercial or financial relationships that could be construed as a potential conflict of interest.
Acknowledgments
This work was supported by the Deutsche Forschungsgemeinschaft (DFG) in the framework of the priority programme “Antarctic Research with comparative investigations in Arctic ice areas” by a grant to M.B. (BR 2105/9-1). MB and TS would like to thank the HGF Alliance “Remote Sensing of Earth System Dynamics” for additional support. SM and JS were funded by IAA-DNA, project INST N°15. Exchange and field trips were partly funded by the European Commission 7th FP IRSES IMCONet project (FP7 IRSES, action no. 319718). JW and CR, acknowledge support from the Netherlands Polar Program of the Netherlands Organization for Scientific Research, section Earth and Life Sciences (NWO/ALW/NPP). IAA-DNA and AWI kindly provided logistic support as well as airborne operations. The authors particularly acknowledge the support of Marambio station personnel, the helicopters and Twin Otter DHC-6 crews for their support during the field surveys. Access to satellite data was kindly provided by various space agencies, e.g., under ESA AO 4032, DLR TerraSAR-X Background Mission Antarctic Peninsula and Ice Shelves, TSX AO LAN0013, TDX AO XTI_GLAC0264, ASF, GLIMS as well as NASA and USGS.
References
Amundson, J. M., Fahnestock, M., Truffer, M., Brown, J., Lüthi, M. P., and Motyka, R. J. (2010). Ice mélange dynamics and implications for terminus stability, Jakobshavn Isbræ, Greenland. J. Geophys. Res. Earth Surf. 115, F01005. doi: 10.1029/2009JF001405
Berthier, E., Scambos, T. A., and Shuman, C. A. (2012). Mass loss of Larsen B tributary glaciers (Antarctic Peninsula) unabated since 2002. Geophys. Res. Lett. 39, L13501. doi: 10.1029/2012GL051755
Cape, M. R., Vernet, M., Skvarca, P., Marinsek, S., Scambos, T., and Domack, E. (2015). Foehn winds link climate-driven warming to ice shelf evolution in Antarctica. J. Geophys. Res. Atmospheres 120, 11,037–11,057. doi: 10.1002/2015jd023465
Cogley, J. G., Hock, R., Rasmussen, L. A., Arendt, A. A., Bauder, A., Braithwaite, R. J., et al. (2011). Glossary of glacier mass balance and related terms. IHP-VII technical documents in hydrology No. 86, IACS Contribution No. 2, UNESCO-IHP, Paris. Polar Rec. 48. doi: 10.1017/S0032247411000805
Cook, A. J., Murray, T., Luckman, A., Vaughan, D. G., and Barrand, N. E. (2012). A new 100-m Digital Elevation Model of the Antarctic Peninsula derived from ASTER Global DEM: methods and accuracy assessment. Earth Syst. Sci. Data 4, 129–142. doi: 10.5194/essd-4-129-2012
Cook, A. J., and Vaughan, D. G. (2010). Overview of areal changes of the ice shelves on the Antarctic Peninsula over the past 50 years. Cryosphere 4, 77–98. doi: 10.5194/tc-4-77-2010
Cook, A. J., Vaughan, D. G., Luckman, A. J., and Murray, T. (2014). A new Antarctic Peninsula glacier basin inventory and observed area changes since the 1940s. Antarct. Sci. 26, 614–624. doi: 10.1017/S0954102014000200
Cooper, A. P. R. (1997). Historical observations of Prince Gustav ice shelf. Polar Rec. 33, 285–294. doi: 10.1017/S0032247400025389
Davies, B. J., Carrivick, J. L., Glasser, N. F., Hambrey, M. J., and Smellie, J. L. (2012). Variable glacier response to atmospheric warming, northern Antarctic Peninsula, 1988–2009. Cryosphere 6, 1031–1048. doi: 10.5194/tc-6-1031-2012
De Angelis, H., and Skvarca, P. (2003). Glacier surge after ice shelf collapse. Science 299, 1560–1562. doi: 10.1126/science.1077987
Dee, D. P., Uppala, S. M., Simmons, A. J., Berrisford, P., Poli, P., Kobayashi, S., et al. (2011). The ERA-Interim reanalysis: configuration and performance of the data assimilation system. Q. J. R. Meteorol. Soc. 137, 553–597. doi: 10.1002/qj,.828
DLR-IMF, Balss, U., Rossi, C., Fritz, T., Balzer, W., Breit, H., et al. (2012). TanDEM-X CoSSC Generation and Interferometric Considerations. Available online at: https://tandemx-science.dlr.de/pdfs/TD-PGS-TN-3129_CoSSCGenerationInterferometricConsiderations_1.0.pdf
Fernandoy, F., Meyer, H., and Tonelli, M. (2012). Stable water isotopes of precipitation and firn cores from the northern Antarctic Peninsula region as a proxy for climate reconstruction. Cryosphere 6, 313–330. doi: 10.5194/tc-6-313-2012
Ferrigno, J. G., Cook, A. J., Foley, K. M., Williams, R. S., Swithinbank, C., Fox, A. J., et al. (2006). Coastal-change and glaciological map of the Trinity Peninsula area and South Shetland Islands, Antarctica, 1843–2001.
Fountain, A. G., Krimmel, R. M., Trabant, D., and Geological Survey (U.S.) (1997). A Strategy for Monitoring Glaciers, U.S. G.P.O.; Free on applications to the U.S. Geological Survey, Information Services, Washington, DC: Denver.
Fretwell, P., Pritchard, H. D., Vaughan, D. G., Bamber, J. L., Barrand, N. E., Bell, R., et al. (2013). Bedmap2: improved ice bed, surface and thickness datasets for Antarctica. Cryosphere 7, 375–393. doi: 10.5194/tc-7-375-2013
Glasser, N. F., Scambos, T. A., Bohlander, J., Truffer, M., Pettit, E., and Davies, B. J. (2011). From ice-shelf tributary to tidewater glacier: continued rapid recession, acceleration and thinning of Röhss Glacier following the 1995 collapse of the Prince Gustav Ice Shelf, Antarctic Peninsula. J. Glaciol. 57, 397–406. doi: 10.3189/002214311796905578
Huss, M., and Farinotti, D. (2014). A high-resolution bedrock map for the Antarctic Peninsula. Cryosphere 8, 1261–1273. doi: 10.5194/tc-8-1261-2014
Ivins, E. R., Watkins, M. M., Yuan, D.-N., Dietrich, R., Casassa, G., and Rülke, A. (2011). On-land ice loss and glacial isostatic adjustment at the Drake Passage: 2003–2009. J. Geophys. Res. Solid Earth 116, B02403. doi: 10.1029/2010jb007607
Korona, J., Berthier, E., Bernard, M., Rémy, F., and Thouvenot, E. (2009). SPIRIT. SPOT 5 stereoscopic survey of polar ice: reference images and topographies during the fourth International Polar Year (2007–2009). ISPRS J. Photogramm. Remote Sens. 64, 204–212. doi: 10.1016/j.isprsjprs.2008.10.005
Lenaerts, J. T. M., van den Broeke, M. R., van de Berg, W. J., van Meijgaard, E., and Kuipers Munneke, P. (2012). A new, high-resolution surface mass balance map of Antarctica (1979–2010) based on regional atmospheric climate modeling. Geophys. Res. Lett. 39, L04501. doi: 10.1029/2011GL050713
Marshall, G. J., Orr, A., van Lipzig, N. P. M., and King, J. C. (2006). The Impact of a changing southern hemisphere annular mode on Antarctic Peninsula summer temperatures. J. Clim. 19, 5388–5404. doi: 10.1175/JCLI3844.1
McNabb, R. W., Hock, R., O'Neel, S., Rasmussen, L. A., Ahn, Y., Braun, M., et al. (2012). Using surface velocities to calculate ice thickness and bed topography: a case study at Columbia Glacier, Alaska, USA. J. Glaciol. 58, 1151–1164. doi: 10.3189/2012jog11j249
Moon, T., Joughin, I., and Smith, B. (2015). Seasonal to multiyear variability of glacier surface velocity, terminus position, and sea ice/ice mélange in northwest Greenland. J. Geophys. Res. Earth Surf. 120, 818–833. doi: 10.1002/2015JF003494
Moon, T., Joughin, I., Smith, B., van den Broeke, M. R., van de Berg, W. J., Noël, B., et al. (2014). Distinct patterns of seasonal Greenland glacier velocity. Geophys. Res. Lett. 41, 7209–7216. doi: 10.1002/2014GL061836
Morris, E. M., and Vaughan, D. G. (2003). “Spatial and temporal variation of surface temperature on the Antarctic Peninsula and the limit of viability of ice shelves,” in Antarctic Peninsula Climate Variability: Historical and Paleoenvironmental Perspectives, eds E. Domack, A. Levente, A. Burnet, R. Bindschadler, P. Convey, and M. Kirby (Washington, DC: American Geophysical Union), 61–68.
Nield, G. A., Barletta, V. R., Bordoni, A., King, M. A., Whitehouse, P. L., Clarke, P. J., et al. (2014). Rapid bedrock uplift in the Antarctic Peninsula explained by viscoelastic response to recent ice unloading. Earth Planet. Sci. Lett. 397, 32–41. doi: 10.1016/j.epsl.2014.04.019
Orr, A., Cresswell, D., Marshall, G. J., Hunt, J. C. R., Sommeria, J., Wang, C. G., et al. (2004). A “low-level” explanation for the recent large warming trend over the western Antarctic Peninsula involving blocked winds and changes in zonal circulation. Geophys. Res. Lett. 31, L06204. doi: 10.1029/2003GL019160
Padman, L., Fricker, H. A., Coleman, R., Howard, S., and Erofeeva, L. (2002). A new tide model for the Antarctic ice shelves and seas. Ann. Glaciol. 34, 247–254. doi: 10.3189/172756402781817752
Rack, W., and Rott, H. (2003). “Further retreat of the northern Larsen Ice Shelf and collapse of Larsen B,” in 16th International Workshop of the Forum for Research on Ice Shelf Processes (FRISP) (Bergen).
Rack, W., and Rott, H. (2004). Pattern of retreat and disintegration of the Larsen B ice shelf, Antarctic Peninsula. Ann. Glaciol. 39, 505–510. doi: 10.3189/172756404781814005
Rau, F., Mauz, F., de Angelis, H., Jaña, R., Neto, J. A., Skvarca, P., et al. (2004). Variations of glacier frontal positions on the northern Antarctic Peninsula. Ann. Glaciol. 39, 525–530. doi: 10.3189/172756404781814212
Rignot, E. (2005). Recent ice loss from the Fleming and other glaciers, Wordie Bay, West Antarctic Peninsula. Geophys. Res. Lett. 32. doi: 10.1029/2004gl021947
Rignot, E., Casassa, G., Gogineni, P., Krabill, W., Rivera, A., and Thomas, R. (2004). Accelerated ice discharge from the Antarctic Peninsula following the collapse of Larsen B ice shelf. Geophys. Res. Lett. 31. doi: 10.1029/2004gl020697
Rignot, E., Mouginot, J., and Scheuchl, B. (2011). Antarctic grounding line mapping from differential satellite radar interferometry: GROUNDING LINE OF ANTARCTICA. Geophys. Res. Lett. 38. doi: 10.1029/2011gl047109
Rott, H., Floricioiu, D., Wuite, J., Scheiblauer, S., Nagler, T., and Kern, M. (2014). Mass changes of outlet glaciers along the Nordensjköld Coast, northern Antarctic Peninsula, based on TanDEM-X satellite measurements. Geophys. Res. Lett. 41, 8123–8129. doi: 10.1002/2014gl061613
Rott, H., Müller, F., Nagler, T., and Floricioiu, D. (2011). The imbalance of glaciers after disintegration of Larsen-B ice shelf, Antarctic Peninsula. Cryosphere 5, 125–134. doi: 10.5194/tc-5-125-2011
Rott, H., Rack, W., and Nagler, T. (2007). “Increased export of grounded ice after the collapse of northern Larsen Ice Shelf, Antarctic Peninsula, observed by envisat ASAR,” in Geoscience and Remote Sensing Symposium, (2007). IGARSS 2007. IEEE International (Barcelona: IEEE), 1174–1176.
Rott, H., Rack, W., Skvarca, P., and De Angelis, H. (2002). Northern Larsen ice shelf, Antarctica: further retreat after collapse. Ann. Glaciol. 34, 277–282. doi: 10.3189/172756402781817716
Rott, H., Skvarca, P., and Nagler, T. (1996). Rapid Collapse of Northern Larsen Ice Shelf, Antarctica. Science 271, 788–792. doi: 10.1126/science.271.5250.788
Scambos, T. A., Berthier, E., Haran, T., Shuman, C. A., Cook, A. J., Ligtenberg, S. R. M., et al. (2014). Detailed ice loss pattern in the northern Antarctic Peninsula: widespread decline driven by ice front retreats. Cryosphere 8, 2135–2145. doi: 10.5194/tc-8-2135-2014
Scambos, T. A., Bohlander, J., Shuman, C. A., and Skvarca, P. (2004). Glacier acceleration and thinning after ice shelf collapse in the Larsen B embayment, Antarctica. Geophys. Res. Lett. 31. doi: 10.1029/2004gl020670
Scambos, T., Hulbe, C., and Fahnestock, M. (2003). “Climate-induced ice shelf disintegration in the Antarctic Peninsula,” in Antarctic Peninsula Climate Variability: Historical and Paleoenvironmental Perspectives, eds E. Domack, A. Levente, A. Burnet, R. Bindschadler, P. Convey, and M. Kirby (Washington, DC: American Geophysical Union), 79–92.
Seehaus, T., Marinsek, S., Helm, V., Skvarca, P., and Braun, M. (2015). Changes in ice dynamics, elevation and mass discharge of Dinsmoor–Bombardier–Edgeworth glacier system, Antarctic Peninsula. Earth Planet. Sci. Lett. 427, 125–135. doi: 10.1016/j.epsl.2015.06.047
Shepherd, A., Ivins, E. R., A, G., Barletta, V. R., Bentley, M. J., Bettadpur, S., et al. (2012). A reconciled estimate of ice-sheet mass balance. Science 338, 1183–1189. doi: 10.1126/science.1228102
Shepherd, A., Wingham, D., Payne, T., and Skvarca, P. (2003). Larsen ice shelf has progressively thinned. Science 302, 856–859. doi: 10.1126/science.1089768
Shuman, C. A., Berthier, E., and Scambos, T. A. (2011). 2001–2009 elevation and mass losses in the Larsen A and B embayments, Antarctic Peninsula. J. Glaciol. 57, 737–754. doi: 10.3189/002214311797409811
Skvarca, P., Rack, W., Rott, H., and Ibarzábal y Donángelo, T. (1998). Evidence of recent climatic warming on the eastern Antarctic Peninsula. Ann. Glaciol. 27, 628–632.
Skvarca, P., Rott, H., and Nagler, T. (1995). Satellite imagery, a base line for glacier variation study on James Ross Island, Antarctica. Ann. Glaciol. 21, 291–296.
Strozzi, T., Luckman, A., Murray, T., Wegmuller, U., and Werner, C. L. (2002). Glacier motion estimation using SAR offset-tracking procedures. IEEE Trans. Geosci. Remote Sens. 40, 2384–2391. doi: 10.1109/TGRS.2002.805079
Toutin, T. (2002). Three-dimensional topographic mapping with ASTER stereo data in rugged topography. IEEE Trans. Geosci. Remote Sens. 40, 2241–2247. doi: 10.1109/TGRS.2002.802878
Turner, J. (2002). Spatial variability of Antarctic Peninsula net surface mass balance. J. Geophys. Res. 107, AAC 4-1-AAC 4-18. doi: 10.1029/2001jd000755
Turner, J., Colwell, S. R., Marshall, G. J., Lachlan-Cope, T. A., Carleton, A. M., Jones, P. D., et al. (2005). Antarctic climate change during the last 50 years. Int. J. Climatol. 25, 279–294. doi: 10.1002/joc.1130
van Wessem, J. M., Ligtenberg, S. R. M., Reijmer, C. H., van de Berg, W. J., van den Broeke, M. R., Barrand, N. E., et al. (2016). The modelled surface mass balance of the Antarctic Peninsula at 5.5 km horizontal resolution. Cryosphere 10, 271–285. doi: 10.5194/tc-10-271-2016
van Wessem, J. M., Reijmer, C. H., Morlighem, M., Mouginot, J., Rignot, E., Medley, B., et al. (2014). Improved representation of East Antarctic surface mass balance in a regional atmospheric climate model. J. Glaciol. 60, 761–770. doi: 10.3189/2014JoG14J051
van Wessem, J. M., Reijmer, C. H., van de Berg, W. J., van den Broeke, M. R., Cook, A. J., van Ulft, L. H., et al. (2015). Temperature and wind climate of the antarctic Peninsula as Simulated by a high-resolution regional atmospheric climate model. J. Clim. 28, 7306–7326. doi: 10.1175/JCLI-D-15-0060.1
Wendt, J., Rivera, A., Wendt, A., Bown, F., Zamora, R., Casassa, G., et al. (2010). Recent ice-surface-elevation changes of Fleming Glacier in response to the removal of the Wordie Ice Shelf, Antarctic Peninsula. Ann. Glaciol. 51, 97–102. doi: 10.3189/172756410791392727
Wuite, J., Rott, H., Hetzenecker, M., Floricioiu, D., De Rydt, J., Gudmundsson, G. H., et al. (2015). Evolution of surface velocities and ice discharge of Larsen B outlet glaciers from 1995 to 2013. Cryosphere 9, 957–969. doi: 10.5194/tc-9-957-2015
Zwally, H. J., Schutz, R., Bentley, C., Bufton, J., Herring, T., Minster, J., et al. (2012). GLAS/ICESat L2 Antarctic and Greenland Ice Sheet Altimetry Data, Version 33. Boulder, CO: NASA DAAC at the National Snow and Ice Data Center. Available online at: http://nsidc.org/data/docs/daac/glas_icesat_l1_l2_global_altimetry.gd.html
Keywords: Prince Gustav Channel, glacier mass balance, Antarctic Peninsula, sensitivity analysis, remote sensing, glacier change, contribution to sea level rise
Citation: Seehaus TC, Marinsek S, Skvarca P, van Wessem JM, Reijmer CH, Seco JL and Braun MH (2016) Dynamic Response of Sjögren Inlet Glaciers, Antarctic Peninsula, to Ice Shelf Breakup Derived from Multi-Mission Remote Sensing Time Series. Front. Earth Sci. 4:66. doi: 10.3389/feart.2016.00066
Received: 22 December 2015; Accepted: 23 May 2016;
Published: 14 June 2016.
Edited by:
Alun Hubbard, University of Tromso & Aberystwyth University, NorwayReviewed by:
Etienne Berthier, Centre National de la Recherche Scientifique-Laboratory of studies on Spatial Geophysics and Oceanography, FranceTom Holt, Aberystwyth University, UK
Copyright © 2016 Seehaus, Marinsek, Skvarca, van Wessem, Reijmer, Seco and Braun. This is an open-access article distributed under the terms of the Creative Commons Attribution License (CC BY). The use, distribution or reproduction in other forums is permitted, provided the original author(s) or licensor are credited and that the original publication in this journal is cited, in accordance with accepted academic practice. No use, distribution or reproduction is permitted which does not comply with these terms.
*Correspondence: Thorsten C. Seehaus, dGhvcnN0ZW4uc2VlaGF1c0BmYXUuZGU=