 Robert S. Fausto
 Dirk van As
 Jason E. Box
 William Colgan2
 Peter L. Langen
- 1Geological Survey of Denmark and Greenland, Copenhagen, Denmark
- 2Department of Earth and Space Sciences and Engineering, York University, Toronto, ON, Canada
- 3Danish Meteorological Institute, Copenhagen, Denmark
- 4Centre for Ice and Climate, Niels Bohr Institute, University of Copenhagen, Copenhagen, Denmark
Two high melt episodes occurred on the Greenland ice sheet in July 2012, during which nearly the entire ice sheet surface experienced melting. Observations from an automatic weather station (AWS) in the lower ablation area in South Greenland reveal the largest daily melt rates (up to 28 cm d−1 ice equivalent) ever recorded on the ice sheet. The two melt episodes lasted 6 days, equivalent to 6% of the June-August melt period, but contributed 14% to the total annual ablation of 8.5 m ice equivalent. We employ a surface energy balance (SEB) model driven by AWS data to quantify the relative importance of the energy budget components contributing to melt through the melt season. During the days with largest daily melt rates, surface turbulent heat input peaked at 552 Wm−2, 77% of the surface melt energy, which is otherwise typically dominated by absorbed solar radiation. We find that rain contributed ca. 7% to melt during these episodes.
Introduction
Understanding the response of the Greenland Ice Sheet (GrIS) to contemporary climate change is crucial to predicting future changes in global sea-level (IPCC, 2013; Dutton et al., 2015). Climate models and remote sensing of ice sheet mass balance indicate that the GrIS is losing mass at an increasing rate (Shepherd et al., 2012; Tedesco et al., 2013; Andersen et al., 2015; Khan et al., 2015). The GrIS experienced a record mass loss in 2012 (Tedesco et al., 2013), when the combined surface mass balance and ice dynamic components of mass loss eclipsed the 2010 record loss (Tedesco et al., 2011; Sasgen et al., 2012). Year 2012 also established a new surface melt extent record, when satellite observations revealed that melting occurred across virtually the entire ice sheet surface on 12 July 2012. This extraordinary melt episode (8–11 July), unprecedented in the satellite record, was due to an advective heatwave over most of Greenland (Nghiem et al., 2012; Tedesco et al., 2013; Neff et al., 2014; Fausto et al., 2016). A second high melt episode occurred 27–28 July, covering all of West Greenland (Fausto et al., 2016).
When studying changes in ice ablation rates or local melt patterns, the spatial detail of regional climate models and satellite gravimetry is often insufficient to resolve the margin of the ice sheet, where strong spatial gradients in surface mass balance occur (e.g., Colgan et al., 2015; Langen et al., 2015). In these regions, in situ measurements can provide crucial insights into inter-annual and seasonal melt variability, and thus aid the interpretation of mass change patterns observed or simulated at larger spatial scales (Fausto et al., 2009, 2016; Tedesco et al., 2013; Van As et al., 2014; Machguth et al., 2016).
Earlier work has examined the partitioning the surface mass budget (SMB) components over Greenland ice with a focus on turbulent heat fluxes as the main contributor to SMB variability (Braithwaite, 1981, 1995; Smeets and van den Broeke, 2008a). Determining the contribution of turbulent heat fluxes to changes in surface melt, especially in the GrIS ablation area where most melt occurs, is important due to the direct link between turbulent fluxes and changes in the general atmospheric circulation (Braithwaite, 1981, 2009). Recent increases in turbulent heat fluxes over ice are a direct consequence of higher atmospheric temperatures in the Arctic (McGrath et al., 2013).
Automatic weather stations (AWSs) provide unique observational insight into GrIS surface mass balance (Citterio et al., 2015; Van As et al., 2016). By directly measuring both glaciological and meteorological quantities related to SMB, AWSs offer a detailed understanding of the climate-ice sheet interactions (Charalampidis et al., 2015; Noël et al., 2015; Fausto et al., 2016).
Here, we investigate the two 2012 high melt episodes [MEs, hereafter ME1 (8–11 July) and ME2 (27–28 July)] at the QAS_L AWS site in South Greenland (Figure 1), which routinely records high (7–9 m) annual ablation totals. We present observed daily ice melt rates from the 2012 summer (June, July, August), and perform diagnostic simulations of daily melt rates using a surface energy balance (SEB) model driven by AWS data, allowing us to quantify and rank all melt energy sources through the melt season.
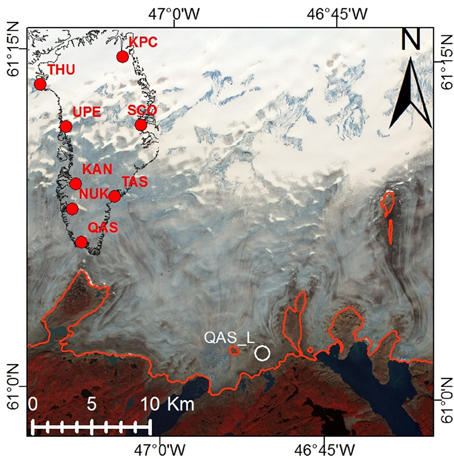
Figure 1. ASTER scene from 30 July 2013. The red line highlights the ice sheet margin and the white circle gives the location of the QAS_L weather station. The red dots on the overview map indicate the locations of the PROMICE AWS transects.
Methods
Site Description and Instrumentation
The QAS_L measurement record dates back to 2001 (Podlech et al., 2004). The QAS_L station was redesigned in 2007 following the standard detailed in the Programme for Monitoring of the Greenland ice sheet (PROMICE; e.g., Citterio et al., 2015). In 2009, the station was re-located 1.5 km to the east to avoid the AWS moving into a heavily crevassed area only 2.5 km from the ice margin (61°02′ N, 46°51′ W, 280 m a.s.l., Figure 1). QAS_L measures a suite of meteorological quantities (air pressure, temperature, humidity, wind speed, and the downward and upward short- and longwave radiation fluxes) at 10 min temporal resolution (Van As et al., 2016; Table 1). Its measurements also include glaciological quantities (ice temperatures, and snow and ice ablation; Fausto et al., 2012a).
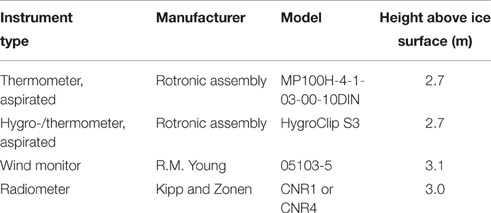
Table 1. Instrument overview for the important energy flux calculations.
Measurement errors vary by sensor and contribute to the uncertainty of the surface energy budget calculations. The largest manufacturer-reported sensor uncertainty is for the Kipp and Zonen CNR1/CNR4 radiometer at 10% for daily totals (Van As, 2011), a number which in practice has been found to be ca. 5% for daily totals (Van den Broeke et al., 2004). Solar radiation measurements are corrected for sensor/AWS tilt (Van As, 2011). The daily average melt rate measurements from the AWS's pressure transducer assembly were assessed to have a measurement uncertainty of 0.04 m ice equivalent (eq; Fausto et al., 2012b). Actual ablation at QAS_L and other locations around Greenland can show highly irregular melting. Several studies indicate that differences between measurements placed a few meters apart can be as much as ±10% (e.g., Braithwaite et al., 1998; Bøggild et al., 2004; Fausto et al., 2012b).
Surface Mass Balance Model
A point SEB model (Van As et al., 2005, 2012) is used to distinguish between the energy sources contributing to surface ice melt at the QAS_L site in 2012 (Figure 2). The model uses hourly averages of AWS data to calculate SEB components: absorbed shortwave radiation (SRnet); net longwave radiation (LRnet); sensible heat flux (SHF); latent heat flux (LHF); sub-surface heat flux (SSHF), rain heat flux (RHF). The calculated surplus energy is assumed to melt snow or ice (M), depending on which is present at the ice sheet surface:
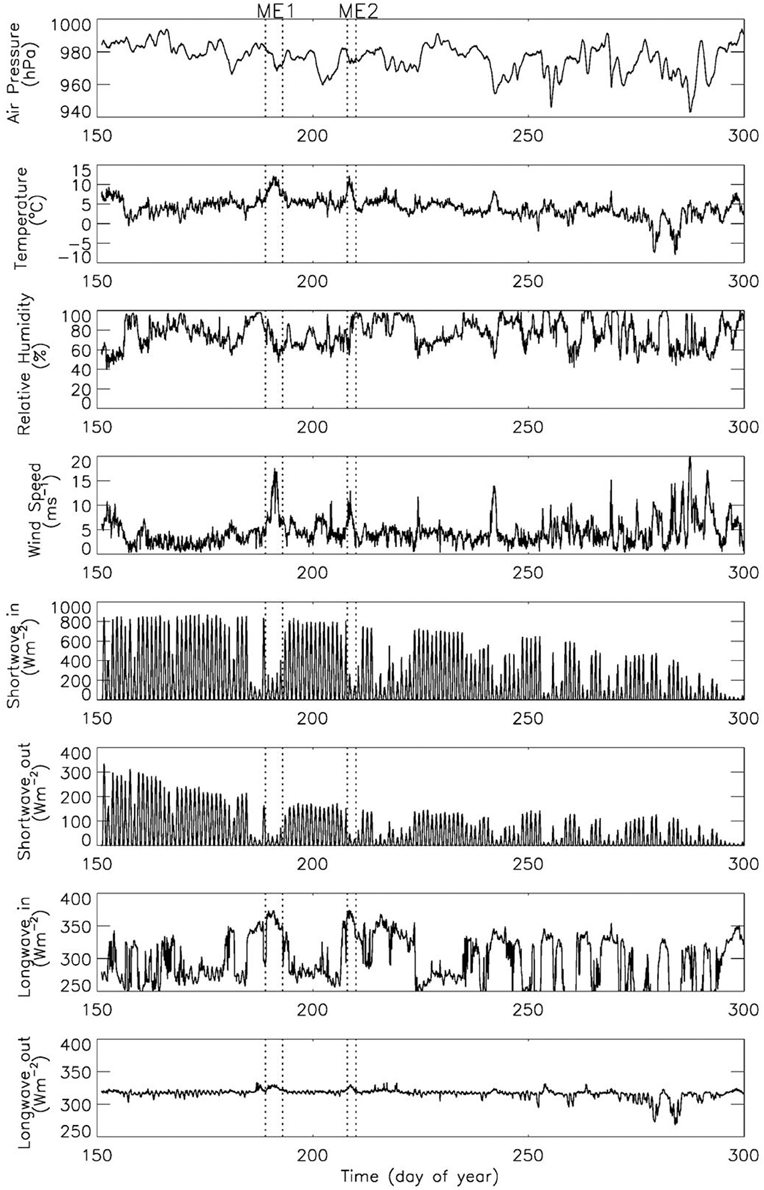
Figure 2. Hourly meteorological parameters measured by the AWS [air pressure (hPa), air temperature (°C), wind speed (ms−1), humidity (%), and the downward (in) and upward (out) short- and long-wave radiation fluxes (Wm−2)]. Vertical dotted lines indicate the melt episodes ME1 (8–11 July) and ME2 (27–28 July), respectively. Total ice melt period is 30 May (day 151) to 26 October (day 300).
The SMB is the sum of precipitation, runoff, and sublimation/deposition. Runoff is the sum of meltwater and rain. Lacking local precipitation measurements, values are bi-linearly interpolated to the QAS_L location from HIRHAM5 regional climate model after Fausto et al. (2016). Accuracy of the simulated SMB is ensured by evaluating modeled surface height change due to ablation with that independently observed at the AWS site (Figure 3A). The model assumptions and all equations are described by Van As et al. (2005), Van As (2011). Here, we summarize the calculation of the turbulent heat fluxes. Following the Monin-Obukhov similarity theory, SHF and LHF are approximated as:
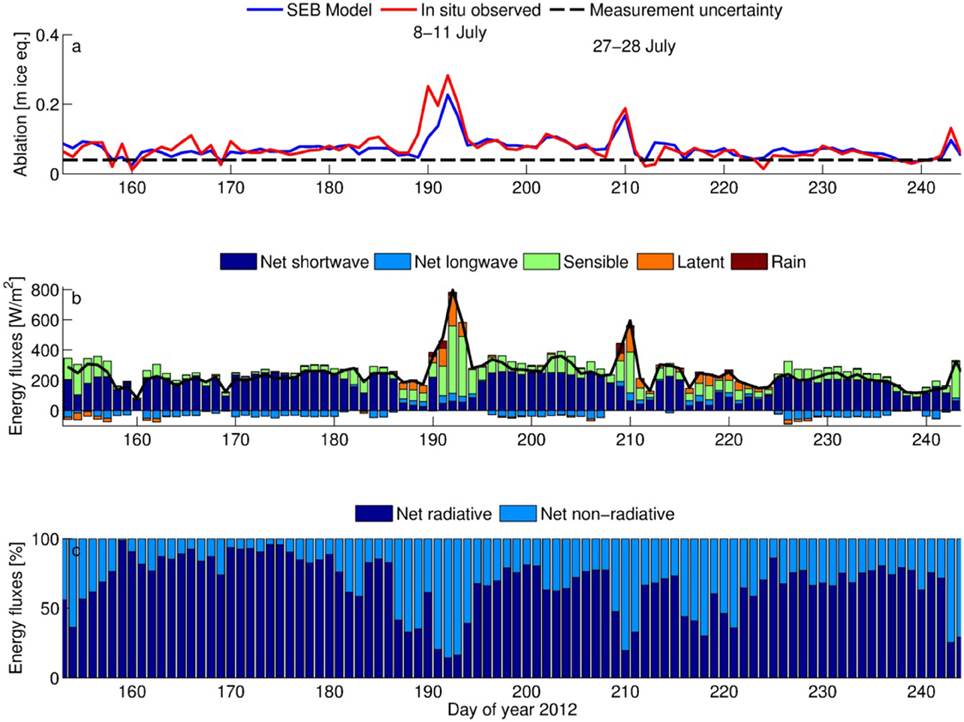
Figure 3. (A) Daily ablation at QAS_L. The black dashed line indicates the threshold of observational uncertainty. (B) Daily-mean surface energy budget fluxes at QAS_L. The black line is total melt; the negligible sub-surface heat flux contribution is not shown. (C) The partitioning of available melt energy between radiative (net short and long wave) vs. non-radiative (sensible, latent, rain, and sub-surface) energy fluxes. Ice melt period here is June, July, August.
In Equations (2) and (3), ρ is the density of air and Cp = 1005 JK−1kg−1 its specific heat capacity at constant pressure. Ls = 2.83·10−6 Jkg−1 and Lv = 2.50·10−6Jkg−1 are the latent heats of sublimation and evaporation, respectively, while κ = 0.4 is the von Karman constant. Calculating the turbulent heat fluxes requires the measurement height (zu, T, q, Table 1) of wind speed (u), temperature (T), and specific humidity (q), while the surface roughness lengths for momentum, heat and moisture are denoted z0T, q. Stability correction functions ψu, T, q are used for stable conditions (Holtslag and de Bruin, 1988) and for unstable conditions (Paulson, 1970). The aerodynamic surface roughness length for momentum (z0) is used in the calculation of the turbulent heat fluxes and is often set to differing constant values for snow and ice surfaces (Brock et al., 2006). While assuming these to be constant in space and time is an oversimplification (Smeets and van den Broeke, 2008a; van den Broeke et al., 2009), we adopt z0 values 5·10−3 m for ice, which we derive from tuning simulations to minimize the difference between modeled and observed ablation. The surface roughness lengths for heat and moisture are based on Smeets and van den Broeke (2008b) for an ice surface and Andreas (1987) for a snow surface. The temperature and specific humidity at the surface Ts and qs are iteratively calculated to ensure that surface energy fluxes are in balance. If the surface is melting, the surface temperature is kept at 0°C, and surplus energy is then used to melt ice following Equation (1).
Results
Meteorology and SMB in 2012
Figure 2 illustrates the meteorological parameters measured by the AWS. The two high melt episodes are characterized by relatively high air temperatures, wind speed and downward longwave radiation (LRin), while downward shortwave radiation (SRin) is relatively low. Low values of SRin and high LRin values are indicative of the presence of clouds (Figure 2; Van As, 2011). While summertime air temperature over snow-free terrain can exceed 20°C in South Greenland (Cappelen and Vinther, 2013), near-surface temperatures rarely exceed 5°C over the ice sheet, given the effectively infinite energy sink of ice melt (Van As et al., 2013). Occasionally though, advection of relatively warm and moist air provides conditions for anomalously high near-surface ice sheet air temperatures. During ME1 and ME2 such advection occurred and affected mostly the south, west, and northwest of Greenland (Fettweis et al., 2013; Neff et al., 2014). QAS_L measured a 2.7 m air temperature of 12.1°C on 11 July 2012 at 10:40 UTC. On 27 July 2012 at 10:10 UTC 2.7 m air temperature reached 13.1°C, a record-setting value since local PROMICE local observations began in April 2007. These exceptionally high temperatures coincided with periods of rare positive temperatures and melt production at the ice sheet summit (~3200 m a.s.l.; Nghiem et al., 2012; Bennartz et al., 2013; Neff et al., 2014).
The summer average air temperatures at QAS_L in 2012 were higher than those measured during the previous record-setting mass loss year of 2010 at QAS_L. July 2012, with a mean air temperature of 5.9°C, was 1.2°C warmer than the July 2007–2015 average (Table 2; Van As et al., 2016). In contrast, average December, January, and February (DJF) winter air temperature in 2011/12 (−8.3°C) was considerably lower than the analogous average winter (−6.5°C; Table 2). The 2012 ablation total at QAS_L during was 8.5 m ice eq., which was ca. 24% larger than the observational period average of 6.5 m ice eq. The 2010 ablation total, however, was higher at 9.3 m ice eq.
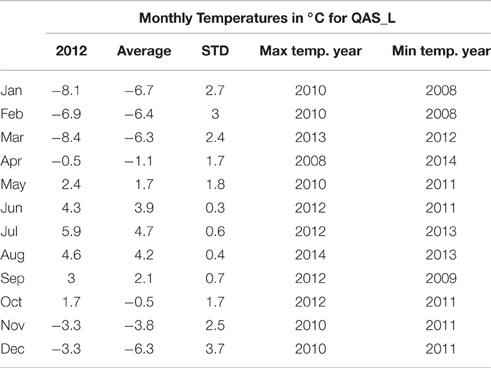
Table 2. Average monthly temperatures for 2012 and for the period of August 2007 to September 2015 with associated standard deviation (STD).
Winter accumulation at QAS_L, derived from acoustic surface height measurements was 0.7 m ice eq. in 2012, which is 0.3 m ice eq. above average. While the density of the snowpack is not measured throughout the year, measurements suggest a mean density of 430 kgm−3, which is consistent with Podlech et al. (2004). Snow depth at melt season onset provides an important temporal control on the transition of a glacier's surface from high albedo snow (>0.6) to comparatively low albedo ice (ca. 0.2 at QAS_L), after which the absorption of solar radiation increases by a factor 2–4. The large 2010 QAS_L ablation was therefore in part preconditioned by the low 2009/10 winter snow accumulation (Fausto et al., 2012a). The summer albedo value at QAS_L is lower than measured elsewhere on the ice sheet by either AWSs or MODIS (Box et al., 2012), and recurs annually (Van As et al., 2013). Figure 1 illustrates the band of dark ice visible across the ablation area in the absence of snow cover.
Melt Rates in 2012
Here, we present daily ablation observations from the pressure transducer assembly described by Fausto et al. (2012b). Figure 3A shows the daily ice ablation at QAS_L for the 2012 melt period June, July, and August. ME1 and ME2 are clearly identified and were the largest observed in Greenland to date. The ice melt season started in late May, after a 4-week period of snow melt. Surface height measurements confirm that there was no snow accumulation throughout the warm summer and well into the autumn, with first accumulation occurring on day 305 (1 November 2012). The modeled surface mass loss was captured accurately with the exception of three periods. The model underestimates ablation around 10 July (day 192), during ME1, and also around July 27 (day 209), during ME2, while it slightly overestimates ablation in the beginning of August (after day 214). Agreement between the variability in measured and modeled ablation is illustrated by a correlation of r = 0.82 and RMS difference of 0.03 m d−1 ice eq. within the measurement uncertainty of 0.04 m ice eq. (Fausto et al., 2012b). The average daily melt rate for the summer of 2012 was 0.08 m ice eq., which exceeds the measurement uncertainty. The largest daily melt rate (0.28 m ice eq.) occurred on 11 July, while the largest daily melt rate during ME2 was 0.19 m ice eq. on 27 July. These melt rates were 5 and 3 standard deviations above the 2012 average, respectively. ME1 contributed 0.9 m ice eq. of ablation (10% of the yearly total), while ME2 amounted to 0.3 m ice eq. of ablation (4% of the yearly total). Together, ME1 and ME2 lasted 6% of the total ablation season, but contributed 14% to the annual ablation total.
Surface Energy Fluxes
A comparison of SEB components illuminates the dominant physical processes during the high melt episodes (Figure 3B; Table 3). On average for June, July and August (JJA), 69% of the QAS_L 2012 melt energy flux (M, 244 W m−2) was supplied by net shortwave radiation. Conversely, net longwave radiation was an average surface energy sink of 6%. Thus, 63% of M was supplied by radiative fluxes, while the remaining M was provided by the sensible (30% of M), latent (6% of M), and rain (1% of M) heat fluxes, with an on average negligible (0%) SSHF.
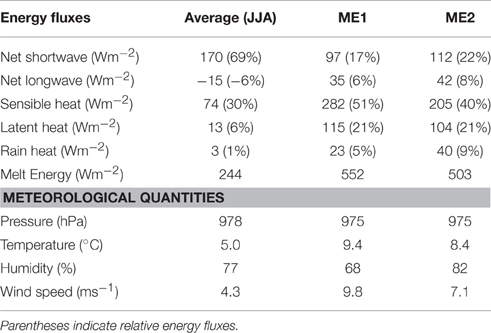
Table 3. Averaged energy fluxes and meteorological quantities for June, July, August (JJA), and the two high melt episodes ME1 (8–11 July) and ME2 (27–28 July), respectively.
During the two high melt episodes in July, absorbed solar radiation delivered just 17% (ME1) and 22% (ME2) of M. Net longwave radiation changed sign to become an energy source [6% (ME1) and 8% (ME2) of M], consistent with overcast conditions. While the turbulent heat exchange is typically smaller than the radiative energy fluxes over melting ice surfaces as in Figure 3B, during the two MEs SHF contributed over half [51% (ME1) and 40% (ME2) of M] and LHF contributed 22% of M each. The RHF contribution was 5% (ME1) and 9% (ME2) of M during both episodes (Figure 3B, Table 3). A SSHF near 0% of M throughout the melt season (not shown) is characteristic of isothermal melting ice.
Discussion
Given that absorbed solar radiation is the primary melt energy source on an annual basis, the influence of intra- and inter-annual variability in air temperature and other variables on ablation is often taken to be of secondary importance (e.g., Van den Broeke et al., 2011). Yet, during the MEs, the turbulent heat fluxes and the RHF were the primary control of melt (77% during ME1 and 70% during ME2; Figure 3C, Table 3). The large turbulent heat fluxes during these episodes stem from anomalously warm and moist southerly air flow being transferred onto the ice sheet by weather systems (Neff et al., 2014; Bonne et al., 2015). The SEB model underestimates in-situ observed ablation during the two episodes by 33 and 14%, respectively (Figure 3A; Fausto et al., 2016). Since the SEB calculation uses observed radiative fluxes with a ca. 5% measurement uncertainty (Van den Broeke et al., 2004), this cannot explain the bias. Therefore, we test the SEB model run called “z0 = 0.005” (Figure 4A) described in Methods, against different important parameter choices in the calculation of the turbulent and rain heat fluxes.
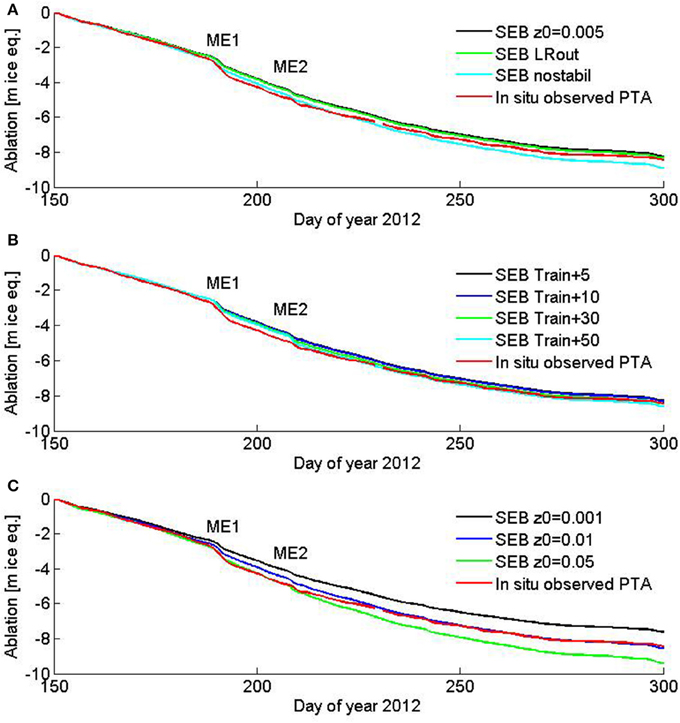
Figure 4. Cumulative surface ablation at the QAS_L site in 2012 from the observations (red) and SEB model sensitivity experiment. (A) z0 = 0.005 is equal to Fausto et al. (2016), and with no stability and longwave out corrections (B) with changing temperature of rain (C) with changing z0. ME1 (8–11 July) and ME2 (27–28 July) indicate the melt episodes. Total ice melt period is 30 May (day 151) to 26 October (day 300).
Due to the relatively large uncertainty in precipitation rates that we employ, as well as an unknown rain temperature that in the model is set to near-surface air temperature, substantial uncertainty is associated with the rain energy flux in the SEB calculations. Rain measurements from Qaqortoq, ~60 km southwest of QAS_L, reported 20 mm rain during ME1 and 50 mm rain during ME2 (Cappelen, 2015). The total amount of rainfall at QAS_L simulated by HIRHAM5 was 192 and 186 mm during the MEs, respectively. These large rainfall rates indicate the possibility that the RHF caused more melt than the SEB model calculates. For instance, in the presence of a temperature inversion in the atmospheric boundary layer, near-surface air temperature can be lower than the rain temperature. Weather balloon observations taken from the integrated global radiosonde archive (IGRA; Durre et al., 2006) at the settlement of Narsarsuaq (~80 km to the east) show a temperature inversion of up to 5°C during both melt episodes. Figure 4B addresses the possible melt underestimation with temperature inversion by increasing the rain temperature by a fixed number. Increasing model rain temperature by 5°C to compensate, this doubles the heat content delivered to the ice sheet surface by rain, but still only explains 10% the underestimation in modeled melt (Figure 4B). Langen et al. (2015), state that HIRHAM5 has a tendency to substantially overestimate (ca. 200%) precipitation events at weather stations on land at less than 50 km from the margin. In the interior of the Greenland ice sheet, however, Lucas-Picher et al. (2012) found it produces a realistic accumulation field with biases of ~10%. With very few rain measurements having been conducted in the ablation area it is very difficult to assess the actual precipitation rate at our study site. However, our model experiments indicate that the RHF is of minor importance.
The importance of stability-correction functions in the calculation of SHF and LHF has been examined by setting them to zero in the model (SEB nostabil, Figure 4A), increasing the turbulent heat output. The effect of these functions is fairly small at the high wind speeds that are common over the ice sheet. During the MEs, the wind speed was relatively high (~15 m s−1; Figure 2), yielding small stability correction. Figure 4A confirms that the stability correction has a minor influence on the calculated surface energy flux, and cannot explain the differences between modeled and observed ablation.
We also investigated to what extent longwave radiation measurements taken at ca. 3 m above the ice surface are representative for surface radiation. This potential issue is illustrated by the outgoing longwave radiation being larger than the theoretical maximum for a melting surface (315.6 W m−2). Giesen et al. (2014) provide an adjustment method for longwave radiation at above-freezing air temperatures. The result of this adjustment (SEB LRout) for QAS_L is illustrated in Figure 4A, and is found to be too small (~20 W m−2) to explain the difference between modeled and measured ablation during the MEs.
It is also entirely possible that z0, an important value in SHF and LHF calculation, attained a different value (e.g., Brock et al., 2006). In order to have the model calculate ablation better during the MEs, it would require an unrealistic z0 value 10–100 times larger (Figure 4C; Fausto et al., 2016). This is supported by Brock et al. (2006), who find changes in the order of a factor 2 during the ice melt season at Haut Glacier d'Arolla. We conclude that during the MEs at QAS_L, the daily mismatch between modeled and observed ablation also cannot be explained by choosing a larger z0 to increase the turbulent energy fluxes. The cause of the mismatch remains unclear, and may be in part explained by a combination of factors dealing with (1) underestimated heat from rain, (2) underestimated longwave radiation, (3) stability over-correction and (4) underestimated aerodynamic surface roughness. Würzer et al. (2016) discuss rain on snow melt episodes in the Swiss Alps and find that during heavy rain and transient atmospheric flow the sensible and latent heat exchange dominates the SEB by up to 84%, which is consistent with other studies under similar conditions (e.g., Garvelmann et al., 2014; Wever et al., 2014). We find that turbulent heat fluxes during rain on ice events at QAS_L show a distinct similarity to values obtained under similar conditions in the Swiss Alps.
The QAS_L AWS observations are largely consistent with the interpretation of Tedesco et al. (2013), who showed the 2012 extremes in melt, air temperature, runoff, and albedo to be unparalleled in the past three decades on an ice-sheet-wide scale. Their study shows that the extreme values observed in 2012 are partly explained by the presence of persistent high air pressure over Greenland, which commonly provides stable weather conditions with low cloud amounts and thus high amounts of solar radiation. The cause of the increased melt observed in Greenland in the past decade coincided with a change in general circulation patterns of the Arctic. A systematic, persistent change in the early-summer atmospheric circulation in the Arctic region is thought to be related to atmospheric blocking episodes (Overland et al., 2012; Hanna et al., 2013, 2014; Rajewicz and Marshall, 2014). Our study confirms these general findings, but provides an important contrasting detail. Namely, that 14% of the total annual ablation can be explained by non-radiative energy fluxes dominated by transient atmospheric flow and cloudy weather, during two brief melt episodes comprising just 6% of the June-August melt period.
Conclusions
During two high melt episodes in July 2012, the highest observed daily ablation rates (0.28 m ice eq.) were recorded by the QAS_L weather station in the lower ablation area of the South Greenland ice sheet. Surface mass balance modeling shows, that net radiation was responsible for 63% of melt energy during the 2012 melt season. During the two high melt episodes, however, turbulent and rain heat fluxes were responsible for ca. 77% of melt energy, peaking at 552 Wm−2. Sensible and latent heat contributed up to 51 and 21% to melt, respectively and rain heat up to 9%. These melt episodes, which lasted 6 days in total, or 6% of the June-August melt period, contributed 14% of the total annual ablation of 8.5 m ice eq. Surface energy flux values presented for the melt episodes may very well be underestimated because modeling reveals that more ice ablated than can be accounted for.
Author Contributions
RF and Dv conceived the study and performed the data analysis. RF wrote the manuscript with help from all authors; all authors continuously discussed the results and developed the analysis further.
Conflict of Interest Statement
The authors declare that the research was conducted in the absence of any commercial or financial relationships that could be construed as a potential conflict of interest.
Acknowledgments
We would like to thank the two reviewers and the editor, Michael Lehning, for valuable comments, which improved the study significantly. Weather station data was provided by the Programme for Monitoring the Greenland Ice Sheet (PROMICE), funded by the Danish Ministry of Energy, Utilities and Climate under Danish Cooperation for Environment in the Arctic (DANCEA). The Danish Council for Independent research (DFF) project 4002-00234 is also acknowledged for partial support of this study. Information about the PROMICE AWS network and the data are freely available at promice.org.
References
Andersen, M. L., Stenseng, L., Skourup, H., Colgan, W., Khan, S. A., Kristensen, S. S., et al. (2015). Basin-scale partitioning of Greenland ice sheet mass balance components (2007–2011). Earth Planet. Sci. Lett. 409, 89–95. doi: 10.1016/j.epsl.2014.10.015
Andreas, E. L. (1987). A theory for the scalar roughness and the scalar transfer coefficients over snow and sea ice. Bound. Layer Meteorol. 38, 159–184. doi: 10.1007/BF00121562
Bennartz, R., Shupe, M. D., Turner, D. D., Walden, V. P., Steffen, K., Cox, C. J., et al. (2013). July 2012 Greenland melt extent enhanced by low-level liquid clouds. Nature 496, 83–86. doi: 10.1038/nature12002
Bøggild, C. E., Olesen, O. B., Ahlstrøm, A. P., and Jørgensen, P. (2004). Automatic glacier ablation measurements using pressure transducers. J. Glaciol. 50, 303–304. doi: 10.3189/172756504781830097
Bonne, J., Steen-Larsen, H. C., Risi, C., Werner, M., Sodemann, H., Lacour, J., et al. (2015). The summer 2012 Greenland heat wave: In situ and remote sensing observations of water vapor isotopic composition during an atmospheric river event. J. Geophys. Res. Atmos. 120, 2970–2989. doi: 10.1002/2014JD022602
Box, J. E., Fettweis, X., Stroeve, J. C., Tedesco, M., Hall, D. K., and Steffen, K. (2012). Greenland ice sheet albedo feedback: thermodynamics and atmospheric drivers. Cryosphere 6, 821–839. doi: 10.5194/tc-6-821-2012
Braithwaite, R. J. (1981). On glacier energy-balance, ablation, and air-temperature. J. Glaciol. 27, 381–391.
Braithwaite, R. J. (1995). Aerodynamic stability and turbulent sensible-heat flux over a melting ice surface, the Greenland ice-sheet. J. Glaciol. 41, 139, 562–571.
Braithwaite, R. J. (2009). Calculation of sensible-heat flux over a melting ice surface using simple climate data and daily measurements of ablation. Ann. Glaciol. 50, 9–15. doi: 10.3189/172756409787769726
Braithwaite, R. J., Konzelmann, T., Marty, C., and Olesen, O. B. (1998). Errors in daily ablation measurements in northern Greenland, 1993–94, and their implications for glacier climate studies. J. Glaciol. 44, 583–588.
Brock, B. W., Willis, I. C., and Shaw, M. J. (2006). Measurement and parameterization of aerodynamic roughness length variations at Haut Glacier d'Arolla, Switzerland. J. Glaciol. 52, 281–297. doi: 10.3189/172756506781828746
Cappelen, J. (2015). Guide to Climate Data and Information from the Danish Meteorological Institute Denmark. Greenland and The Faroe Islands, Technical Report 15-10, Danish Meteorological Institute Copenhagen.
Cappelen, J., and Vinther, B. M. (2013). SW Greenland Temperature Data 1784-2013. Technical Report 14-06, Danish Meteorological Institute Copenhagen.
Charalampidis, C., Van As, D., Box, J. E., Van Den Broeke, M. R., Colgan, W. T., Doyle, S., et al. (2015). Changing surface-atmosphere energy exchange and refreezing capacity of the lower accumulation area, West Greenland. Cryosphere 9, 2163–2181. doi: 10.5194/tc-9-2163-2015
Citterio, M., van As, D., Ahlstrøm, A. P., Andersen, M. L., Andersen, S. B., Box, J. E., et al. (2015). Automatic weather stations for basic and applied glaciological research. Geol. Surv. Den. Greenl. Bull. 33, 69–72.
Colgan, W., Abdalati, W., Citterio, M., Csatho, B., Fettweis, X., Luthcke, S., et al. (2015). Hybrid glacier inventory, Gravimetry and Altimetry (HIGA) mass balance product for Greenland and the Canadian Arctic. Subm. Remote Sens. Environ. 168, 24–39. doi: 10.1016/j.rse.2015.06.016
Durre, I., Vose, R. S., and Wuertz, D. B. (2006). Overview of the integrated global radiosonde archive. Clim. J. 19, 53–68. doi: 10.1175/JCLI3594.1
Dutton, A., Carlson, A. E., Long, A. J., Milne, G. A., Clark, P. U., DeConto, R., et al. (2015). Sea-level rise due to polar ice-sheet mass loss during past warm periods. Science 349:aaa4019. doi: 10.1126/science.aaa4019
Fausto, R. S., Ahlstrøm, A. P., Van As, D., Bøggild, C. E., and Johnsen, S. J. (2009). A new present-day temperature parameterization for Greenland. J. Glaciol. 55, 95–105. doi: 10.3189/002214309788608985
Fausto, R. S., Van As, D., Ahlstrøm, A. P., Andersen, S. B., Andersen, M. L., Citterio, M., et al. (2012a). Ablation observations for2008–2011 from the Programme for Monitoring of the Greenland Ice Sheet (PROMICE). Geolo. Surv. Den. Greenl. Bull. 26, 25–28.
Fausto, R. S., Van As, D., Ahlstrøm, A. P., and Citterio, M. (2012b). Assessing the accuracy of Greenland ice sheet ice ablation measurements by pressure transducers. J. Glaciol. 58, 1144–1150. doi: 10.3189/2012JoG12J075
Fausto, R. S., van As, D., Box, J. E., Colgan, W., Langen, P. L., and Mottram, R. H. (2016). The implication of non-radiative energy fluxes dominating Greenland ice sheet exceptional ablation area surface melt in 2012. Geophys. Res. Lett. 43, 2649–2658. doi: 10.1002/2016GL067720
Fettweis, X., Hanna, E., Lang, C., Belleflamme, A., Erpicum, M., and Gallée, H. (2013). Important role of the mid-tropospheric atmospheric circulation in the recent surface melt increase over the Greenland ice sheet. Cryosphere 7, 241–248. doi: 10.5194/tc-7-241-2013
Garvelmann, J., Pohl, S., and Weiler, M. (2014). Variability of observed energy fluxes during rain-on-snow and clear sky snowmelt in a midlatitude mountain environment. J. Hydrometeor. 15, 1220–1237. doi: 10.1175/JHM-D-13-0187.1
Giesen, R. H., Andreassen, L. M., Oerlemans, J., and Van Den Broeke, M. R. (2014). Surface energy balance in the ablation zone of Langfjordjøkelen, an arctic, maritime glacier in northern Norway. J. Glaciol. 60, 57–70. doi: 10.3189/2014JoG13J063
Hanna, E., Fettweis, X., Mernild, S. H., Cappelen, J., Ribergaard, M. H., Shuman, C. A., et al. (2014). Atmospheric and oceanic climate forcing of the exceptional Greenland ice sheet surface melt in summer 2012. Int. J. Climatol. 34, 1022–1037. doi: 10.1002/joc.3743
Hanna, E., Jones, J. M., Cappelen, J., Mernild, S. H., Wood, L., Steffen, K., et al. (2013). The influence of North Atlantic atmospheric and oceanic forcing effects on 1900–2010 Greenland summer climate and ice melt/runoff. Int. J. Climatol. 33, 862–880. doi: 10.1002/joc.3475
Holtslag, A. A. M., and de Bruin, H. A. R. (1988). Applied modeling of the nighttime surface energy balance over land. J. Appl. Meteorol. 27, 689–704.
IPCC (2013). “Summary for policymakers,” in Climate Change 2013: The Physical Science Basis. Contribution of Working Group I to the Fifth Assessment Report of the Intergovernmental Panel on Climate Change, eds T. F. Stocker, D. Qin, G.-K. Plattner, M. Tignor, S. K. Allen, J. Boschung, A. Nauels, Y. Xia, V. Bex, and P. M. Midgley (Cambridge, UK; New York, NY: Cambridge University Press).
Khan, S. A., Aschwanden, A., Bjørk, A. A., Wahr, J., Kjeldsen, K. K., and Kjær, K. H. (2015). Greenland ice sheet mass balance: a review. Rep. Prog. Phys. 78:046801. doi: 10.1088/0034-4885/78/4/046801
Langen, P. L., Mottram, R. H., Christensen, J. H., Boberg, F., Rodehacke, C. B., Stendel, D., et al. (2015). Quantifying energy and mass fluxes controlling Godthåbsfjord freshwater input in a 5-km simulation (1991-2012). J. Clim. 28, 3694–3713. doi: 10.1175/JCLI-D-14-00271.1
Lucas-Picher, P., Wulff-Nielsen, M., Christensen, J. H., Adalgeirsdóttir, G., Mottram, R., and Simonsen, S. (2012). Very high resolution in regional climate model simulations for Greenland - identifying added value. J. Geophys. Res. 117, D02108. doi: 10.1029/2011jd016267
Machguth, H., MacFerrin, M., van As, D., Box, J. E., Charalampidis, C., Colgan, W., et al. (2016). Greenland meltwater storage in firn limited by near-surface ice formation. Nat. Clim. Change 6, 390–393. doi: 10.1038/nclimate2899
McGrath, D., Colgan, W., Bayou, N., Muto, A., and Steffen, K. (2013). Recent warming at Summit, Greenland: global context and implications. Geophys. Res. Lett. 40, 2091–2096. doi: 10.1002/grl.50456
Neff, W., Compo, G. P., Ralph, F. M., and Shupe, M. D. (2014). Continental heat anomalies and the extreme melting of the Greenland ice surface in 2012 and 1889. J. Geophys. Res. Atmos. 119, 6520–6536. doi: 10.1002/2014JD021470
Nghiem, S. V., Hall, D. K., Mote, T. L., Tedesco, M., Albert, M. R., Keegan, K., et al. (2012). The extreme melt across the Greenland ice sheet in 2012. Geophys. Res. Lett. 39, L20502, L20506. doi: 10.1029/2012GL053611
Noël, B., van de Berg, W. J., van Meijgaard, E., Kuipers Munneke, P., van de Wal, R. S. W., and van den Broeke, M. R. (2015). Evaluation of the updated regional climate model RACMO2.3: summer snowfall impact on the Greenland Ice Sheet. Cryosphere 9, 1831–1844. doi: 10.5194/tc-9-1831-2015
Overland, J. E., Francis, J. A., Hanna, E., and Wang, M. (2012). The recent shift in early summer Arctic atmospheric circulation. Geophys. Res. Lett. 39, L19804, L19806. doi: 10.1029/2012GL053268
Paulson, C. A. (1970). The mathematical representation of wind speed and temperature profiles in the unstable atmospheric surface layer. J. Appl. Meteorol. 9, 857–861.
Podlech, S., Mayer, C., and Bøggild, C. E. (2004). Glacier retreat, mass-balance and thinning: Sermilik glacier, South Greenland. Geogr. Ann. 86A, 305–317. doi: 10.1111/j.0435-3676.2004.00234.x
Rajewicz, J., and Marshall, S. J. (2014). Variability and trends in anticyclonic circulation over the Greenland ice sheet, 1948–2013, Geophys. Res. Lett. 41, 2842–2850. doi: 10.1002/2014GL059255
Sasgen, I., van den Broeke, M. R., Bamber, J. L., Rignot, E., Sørensen, L. S., Wouters, B., et al. (2012). Timing and origin of recent regional ice-mass loss in Greenland. Earth Planet. Sci. Lett. 333–334, 293–303. doi: 10.1016/j.epsl.2012.03.033
Shepherd, A., Ivins, E. R., Geruo, A., Barletta, V. R., Bentley, M. J., Bettadpur, S., et al. (2012). A reconciled estimate of ice-sheet mass balance. Science 338, 1183–1189. doi: 10.1126/science.1228102
Smeets, C. J. P. P., and van den Broeke, M. R. (2008a). The parameterisation of scalar transfer over rough ice. Bound. Layer Meteorol. 128, 339–355. doi: 10.1007/s10546-008-9292-z
Smeets, C. J. P. P., and van den Broeke, M. R. (2008b). Temporal and spatial variation of momentum roughness length in the ablation zone of the Greenland ice sheet. Bound. Layer Meteorol. 128, 315–338. doi: 10.1007/s10546-008-9291-0
Tedesco, M., Fettweis, X., Mote, T., Wahr, J., Alexander, P., Box, J. E., et al. (2013). Evidence and analysis of 2012 Greenland records from spaceborne observations, a regional climate model and reanalysis data. Cryosphere. 7, 615–630. doi: 10.5194/tc-7-615-2013
Tedesco, M., Fettweis, X., Van den Broeke, M. R., Van de Wal, R. S. W., Smeets, C. J. P. P., Van de Berg, W. J., et al. (2011). The role of albedo and accumulation in the 2010 melting record in Greenland. Environ. Res. Lett. 6:014005. doi: 10.1088/1748-9326/6/1/014005
Van As, D. (2011). Warming, glacier melt and surface energy budget from weather station observations in the Melville Bay region of northwest Greenland. J. Glaciol. 57, 208–220. doi: 10.3189/002214311796405898
Van As, D., Andersen, M. L., Petersen, D., Fettweis, X., van Angelen, J. H., Lenaerts, J. T. M., et al. (2014). Increasing meltwater discharge from the Nuuk region of the Greenland ice sheet and implications for mass balance (1960-2012). J. Glac. 60, 314–322. doi: 10.3189/2014JoG13J065
Van As, D., Fausto, R. S., Cappelen, J., Machguth, H., van de Wal, R. S. W., Charalampidis, J. E., et al. (2016). Placing Greenland ice sheet ablation measurements in a multi-decadal context. Geol. Surv. Den. Greenl. Bull. 35, 71–74.
Van As, D., Fausto, R. S., Colgan, W. T., Box, J. E., Ahlstrøm, A. P., Andersen, S. B., et al. (2013). Darkening of the Greenland Ice Sheet due to the melt albedo feedback observed at PROMICE weather stations. Geol. Surv. Den. Greenl. Bull. 28, 69–72.
Van As, D., Hubbard, A. L., Hasholt, B., Mikkelsen, A. B., Van den Broeke, M. R., and Fausto, R. S. (2012). Large surface meltwater discharge from the Kangerlussuaq sector of the Greenland ice sheet during the record-warm year 2010 explained by detailed energy balance observations. Cryosphere 6, 199–209. doi: 10.5194/tc-6-199-2012
Van As, D., van den Broeke, M. R., Reijmer, C., and van de Wal, R. (2005). The summer surface energy balance of the high Antarctic plateau. Bound. Layer Meteorol. 115, 289–317. doi: 10.1007/s10546-004-4631-1
van den Broeke, M., Paul, S., and Janneke, E. (2009). Surface layer climate and turbulent exchange in the ablation zone of the west Greenland ice sheet. Int. J. Climatol. 29, 2309–2323. doi: 10.1002/joc.1815
Van den Broeke, M. R., Smeets, C. J. P. P., and van de Wal, R. S. W. (2011). The seasonal cycle and interannual variability of surface energy balance and melt in the ablation area of the west Greenland ice sheet. Cryosphere 5, 377–390. doi: 10.5194/tc-5-377-2011
Van den Broeke, M. R., Van As, D., Reijmer, C. H., and Van de Wal, R. S. W. (2004). Assessing and improving the quality of unattended radiation observations in Antarctica. J. Atmosph. Oceanic Technol. 21, 1417–1431. doi: 10.1175/1520-0426(2004)021<1417:AAITQO>2.0.CO;2
Wever, N., Fierz, C., Mitterer, C., Hirashima, H., and Lehning, M. (2014). Solving Richards Equation for snow improves snowpack meltwater runoff estimations in detailed multi-layer snowpack model. Cryosphere 8, 257–274. doi: 10.5194/tc-8-257-2014
Keywords: South Greenland melt, surface mass balance, daily melt rates, turbulent heat fluxes, in situ observation, automatic weather stations
Citation: Fausto RS, van As D, Box JE, Colgan W and Langen PL (2016) Quantifying the Surface Energy Fluxes in South Greenland during the 2012 High Melt Episodes Using In-situ Observations. Front. Earth Sci. 4:82. doi: 10.3389/feart.2016.00082
Received: 02 May 2016; Accepted: 19 August 2016;
Published: 07 September 2016.
Edited by:
Michael Lehning, École Polytechnique Fédérale de Lausanne, SwitzerlandReviewed by:
Rianne H. Giesen, Utrecht University, NetherlandsEllyn Mary Enderlin, University of Maine, USA
Copyright © 2016 Fausto, van As, Box, Colgan and Langen. This is an open-access article distributed under the terms of the Creative Commons Attribution License (CC BY). The use, distribution or reproduction in other forums is permitted, provided the original author(s) or licensor are credited and that the original publication in this journal is cited, in accordance with accepted academic practice. No use, distribution or reproduction is permitted which does not comply with these terms.
*Correspondence: Robert S. Fausto, cnNmQGdldXMuZGs=