 Nathan Magnall
 Mike R. James
 Hugh Tuffen
 Charlotte Vye-Brown
- 1Lancaster Environment Centre, Lancaster University, Lancaster, United Kingdom
- 2The Lyell Centre, British Geological Survey, Edinburgh, United Kingdom
Accurate forecasts of lava flow length rely on estimates of eruption and magma properties and, potentially more challengingly, on an understanding of the relative influence of characteristics such as the apparent viscosity, the yield strength of the flow core, or the strength of the lava's surface crust. For basaltic lavas, the relatively high frequency of eruptions has resulted in numerous opportunities to test emplacement models on such low silica lava flows. However, the flow of high silica lava is much less well understood due to the paucity of contemporary events and, if observations of flow length change are used to constrain straightforward models of lava advance, remaining uncertainties can limit the insight gained. Here, for the first time, we incorporate morphological observations from during and after flow field evolution to improve model constraints and reduce uncertainties. After demonstrating the approach on a basaltic lava flow (Mt. Etna 2001), we apply it to the 2011–2012 Cordón Caulle rhyolite lava flow, where unprecedented observations and syn-emplacement satellite imagery of an advancing silica-rich lava flow have indicated an important influence from the lava flow's crust on flow emplacement. Our results show that an initial phase of viscosity-controlled advance at Cordón Caulle was followed by later crustal control, accompanied by formation of flow surface folds and large-scale crustal fractures. Where the lava was unconstrained by topography, the cooled crust ultimately halted advance of the main flow and led to the formation of breakouts from the flow front and margins, influencing the footprint of the lava, its advance rate, and the duration of flow advance. Highly similar behavior occurred in the 2001 Etna basaltic lava flow. In our comparison of these two cases, we find close similarities between the processes controlling the advance of a crystal-poor rhyolite and a basaltic lava flow, suggesting common controlling mechanisms that transcend the profound rheological and compositional differences of the lavas.
Introduction
Lava flows present a significant hazard in the immediate vicinity of volcanic complexes and can, in some cases, also present a hazard to more distal communities. However, despite the sophisticated numerical models that have been developed for basaltic lava flows (Crisci et al., 1986; Hidaka et al., 2005; Vicari et al., 2007; Hérault et al., 2011), a full understanding of the factors controlling the rate and extent of lava flow advance, which is essential for adequate hazard forecasting over a broad range of lava geochemistries, remains elusive due to the complexity of lava flow rheology, internal architecture, and interactions with topography. The frequency of basaltic eruptions has provided many examples for modeling low-silica lavas (Crisci et al., 1986; Hidaka et al., 2005; Vicari et al., 2007; Hérault et al., 2011), but equivalent studies of high-silica flows are relatively rare and poorly constrained, and thus reflect weaknesses in our universal understanding of lava emplacement processes. Here, we use observations of the 2011–2012 Cordón Caulle rhyolite lava flow as an unparalleled opportunity to study a high-silica flow, and we present the first modeling study to our knowledge that examines the advance of a high viscosity and crystal-poor lava. Our results significantly improve constraints on the rheological controls of high-viscosity flows.
Lava flow advance is thought to be initially controlled by the effusion rate at the vent and topographic slope (Pinkerton and Wilson, 1994). Volume-limited flows are those lavas that cease to advance when fresh material is no longer supplied to the flow front, due to cessation of effusion (Walker, 1971). If, instead, a flow continues to advance, it will eventually reach its cooling-limited length, at which point cooling has formed a crust sufficiently strong to inhibit flow advance (Cashman et al., 1998; Blake and Bruno, 2000; Hon, 2003). Pressure builds within the flow as new material is supplied to the flow front, causing inflation and eventually breaking the crust to form a secondary flow or breakout (Calvari and Pinkerton, 1998; Blake and Bruno, 2000). This is a common process in basaltic eruptions (Walker, 1971; Kilburn and Guest, 1993; Hon et al., 1994; Calvari and Pinkerton, 1998; Applegarth et al., 2010) but has been observed rarely in high silica lava flows (Harris et al., 2004), partly due to the infrequency with which such eruptions occur.
The 2011–2012 eruption of Cordón Caulle in southern Chile (low-silica rhyolite, 69.7 wt% SiO2) permitted the first detailed scientific observations of the emplacement of a crystal-poor, silica-rich lava flow (Silva Parejas et al., 2012; Castro et al., 2013; Schipper et al., 2013; Tuffen et al., 2013; Bertin et al., 2015). Prior to this eruption the only detailed observations of rhyolitic lava emplacement came from the 2008–2009 Chaitén eruption in Chile, in which a composite rhyolite dome was emplaced without the development of a laterally extensive flow field (Bernstein et al., 2013; Pallister et al., 2013). Initial observations of the flow at Cordón Caulle indicated that over the duration of the ~10 month eruption the flow front stalled, in some places against topographic barriers, and breakouts formed at the flow front and margins, creating a complex flow field (Tuffen et al., 2013). With flow fronts typically 30 m thick, models of conductive cooling suggest that the flow interior may have retained sufficient heat to permit advance for 36–48 months after emplacement (Farquharson et al., 2015), and breakouts were observed to advance for up to 10 months after the eruption ceased (Tuffen et al., 2013; Farquharson et al., 2015). The formation of breakouts in both basalts and rhyolites suggests that both compositional endmembers can generate cooling-limited lava flows and, hence, flow front advance may be controlled in the latter phases of emplacement by a cooled crust.
Previous studies of rhyolitic lava flows have focused mostly on higher-silica (72–74 wt% SiO2) Holocene flows in the US such as Big and Little Glass Mountain at Medicine Lake (Fink, 1980b, 1983; Grove and Donnelly-Nolan, 1986; Manley and Fink, 1987) and Big Obsidian Flow in Newberry Caldera (Castro et al., 2002). Detailed studies of lava flow morphology led to conceptual models in which slowly-spreading crystal-poor lava moved over talus derived from the flow front (Fink, 1980a, 1983) before stopping when supply ceased (i.e., volume-limited). This style of advance has been observed in active dacitic flows at Santiaguito, Guatemala (Harris and Flynn, 2002). However, the characteristics of the surface facies of Holocene lava flows additionally inspired models that included a cooled surface crust to account for features such as ogives, formed by crustal folding as the flow front slowed (Fink, 1980a; Castro and Cashman, 1999), crease structures (Anderson and Fink, 1992; Lescinsky and Merle, 2005), and large gas cavities (Castro et al., 2002). Such crusts have been inferred to significantly influence lava flow growth (Griffiths and Fink, 1993; Fink and Griffiths, 1998), and would also act to thermally insulate the flow, facilitating prolonged mobility and advance (Manley, 1992), as later observed at Cordón Caulle (Tuffen et al., 2013).
Straightforward analytical models to forecast lava flow length have been based on a number of different lava rheologies (Huppert, 1982; Lister, 1992; Kerr and Lyman, 2007; Castruccio et al., 2013). In these models, lava flow advance is assumed to be controlled by either an apparent Newtonian viscosity, a non-Newtonian flow core, or a surface crust of defined strength (Figure 1). Control may switch between rheology types as the flow advances, as suggested by a transition between best-fit models during emplacement (Castruccio et al., 2013). However, for most studied examples of silicic lava emplacement, relatively few parameter values or constraints are available (e.g., syn-eruptive flow lengths and widths only) and models are thus vulnerable to correlated parameter uncertainties which weaken confidence in the resulting interpretations of rheological control. Nevertheless, previous modeling studies have proposed that advancing crystal-rich high viscosity lava flows are yield strength controlled (Castruccio et al., 2013).
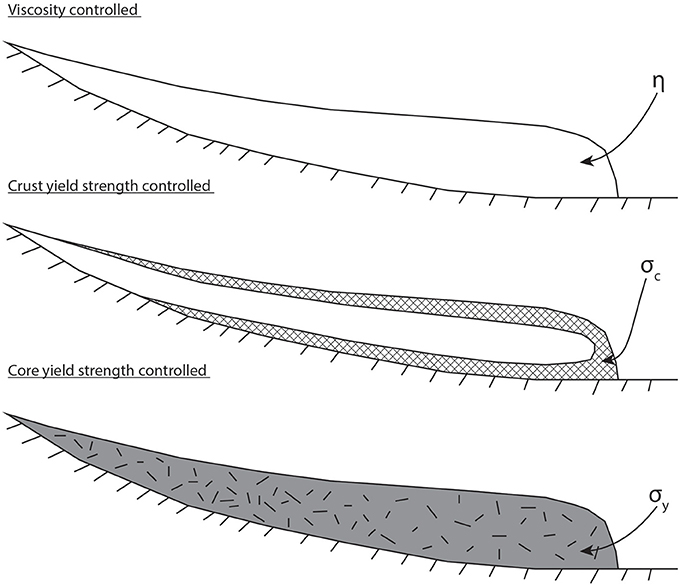
Figure 1. The three flow regimes that can control lava flow behavior: viscosity dominated, crust yield strength dominated, and core yield strength dominated (after Castruccio et al., 2013). The control on flow advance may change throughout the duration of the lava flow emplacement.
Here we examine model robustness by using field data in addition to morphological observations from sequential satellite images of evolving flow fields, to help constrain the time of transition between rheological models. We test the application of these additional observations on a basaltic lava from the 2001 Mt Etna eruption and then extend their application to the 2011–2012 Cordón Caulle rhyolitic flow field. Our overall aims are to (1) assess the consilience of such numerical models with morphological evidence for rheological change and (2) apply lava flow models to the Puyehue-Cordón Caulle lava flow field to explore the role of a thickening crust on the advance of a crystal-poor, high viscosity rhyolite flow. We show that whereas both the Etna and Cordón Caulle lava flows were initially under viscous control, their subsequent development was predominantly controlled by the evolving surface crust.
Flow Length Models
The models used in this study are given in Kerr and Lyman (2007) and Castruccio et al. (2013), where their derivations are presented in detail. If a lava flow is treated as a Newtonian viscous fluid emplaced into an environment of negligible density, its length L can be given by
where Cvs is a constant defined as (3/2)2/3 = 1.31, g is gravitational acceleration, ρ is lava density, β is the ground slope, q is the volume erupted per unit width of the flow front, t is the elapsed time, and η is the lava viscosity (Table 1; Huppert, 1982; Lister, 1992; Kerr and Lyman, 2007).
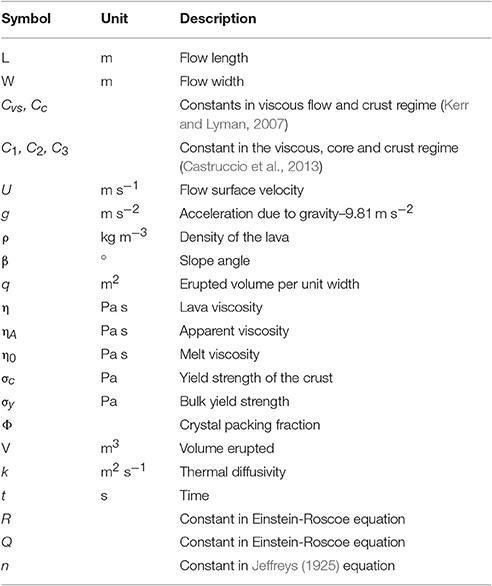
Table 1. Summary of parameters used in the numerical approach.
As a lava flow advances, its surface cools to form a crust of thickness δ, which can be assumed to thicken diffusively as δ ~(kt)1/2 (Griffiths and Fink, 1993), where k is the thermal diffusivity. If the strength of the crust controls the flow motion, the lava flow length is given by
where Cc is an unknown constant of the order 1, and σc is the crustal yield strength (Griffiths and Fink, 1993; Lyman et al., 2005; Kerr and Lyman, 2007). Equation (2) does not include ground slope because, as a cosβ multiplier term (Griffiths and Fink, 1993), for the low slope angles examined here, it can be assumed cosβ≈1 (Lyman and Kerr, 2006).
Although useful for first order estimates, Equations (1) and (2), termed here the fixed parameter approach, do not enable down-flow variations in parameters (e.g., slope) to be accounted for. Thus, Castruccio et al. (2013) derived equivalent models, but using a summative approach to enable parameter variation during emplacement. In this case, the length of an advancing flow dominated by a Newtonian viscosity is given by
where C1 is a constant in the viscous regime defined as (3/2)2/3 = 1.31 (in line with Equation 1), Vi is the volume added at each time step, βi is the terrain slope, ti is the time interval between each step, and ηi and Wi represent the lava viscosity and flow width at a given time step (Castruccio et al., 2013).
In the case of flow advance limited by a crustal yield strength, the evolving flow length can be given by
where t is the total time elapsed, C3 is a constant of order 1 (Castruccio et al., 2013), and σci is the crustal yield strength at a given time interval (Castruccio et al., 2013).
A third case represents flow behavior as a bulk non-Newtonian fluid rather than Newtonian. In this case a yield strength must be exceeded before the flow can advance (Castruccio et al., 2013), and flow length can be given by
where C2 is a constant of order 1, and σyi is the bulk yield strength at a given time interval (Castruccio et al., 2013). These three models are collectively termed the flexible parameter approach throughout this paper. Here we attempt to improve upon the application of these models by incorporating observations of lava flow advance and morphology to better constrain the timing of key rheological changes during lava flow emplacement.
Basaltic Lava from 2001 Mt Etna Eruption
The 2001 eruption of Mt Etna produced several lava flows from numerous vents (Ingv, 2001; Behncke and Neri, 2003; Coltelli et al., 2007; Applegarth, 2008). The eruption of the largest lava flow began from an altitude of ~2,100 m near La Montagnola (Figure 2) in the early hours of 18 July 2001 (Behncke and Neri, 2003; Applegarth, 2008). The flow that issued from this vent was the largest of the eruption, reaching over 6 km long and with a volume of 0.02 km3. The lava flow was active for 23 days but reached its maximum length after 7 days, after which activity was dominated by breakout development farther up-flow (Behncke and Neri, 2003; Coltelli et al., 2007).
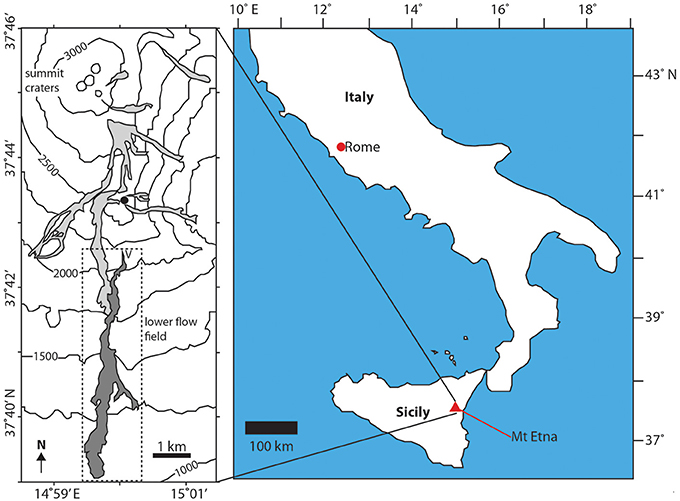
Figure 2. Location of Mt Etna and the 2001 lavas. The flow examined in this work (dark gray and highlighted by the dashed box) was erupted from a vent at 2,100 m elevation. This flow can be seen to be joined by others erupted from higher elevations (light gray), but this occurred after it had attained its final length and so did not contribute to the main flow advance (Coltelli et al., 2007).
As described in Applegarth (2008), the lava initially advanced as a thin (up to 2 m) sheet at ~150 m per hour before becoming concentrated in a channel at its eastern margin. By the evening of the 19 July the flow had attained a length of 3.4 km and was advancing at a rate of ~45 m per hour. On the morning of the 20th the flow front had reached an altitude of 1,350 m, and was 100 m wide and ~5 m high with an incandescent interior visible beneath a cover of black scoria. The flow continued to move down the volcano flanks at a rate of ~50 m per hour, eventually reaching an area of slightly flatter topography at 1,055 m on 23 July (Behncke and Neri, 2003; Applegarth, 2008). The flow reached its maximum length on 25 July, at which point the flow front was 200–300 m wide and 10–20 m high (Applegarth, 2008). The eruption continued and numerous small breakouts formed at the most distal flow margins and larger breakouts formed further up-flow until the eruption ceased on 9 August 2001 (Behncke and Neri, 2003; Coltelli et al., 2007; Applegarth, 2008). Between 26 and 27 July, a lava flow that had erupted from higher elevations merged with the lower 2001 lava flow (Lanzafame et al., 2003; Coltelli et al., 2007). However, because this was after the main flow had attained its final length (Coltelli et al., 2007), it did not contribute to the overall flow advance, but likely contributed to the later breakout emplacement.
Field Evidence for a Late Crustal Control
Field observations of the lava flow were made in April 2015 and focused on morphology and late stage flow features. The main portion of the lava is a channelized 'a'ā flow with well-developed levees and a significant portion of drained channel (>2 km long), whereas the distal region lacks levees and has numerous breakouts from its margin. The 2001 flow deposit is almost entirely covered by loose clinker (rubble), making it difficult to observe any surface crust. However, breakouts are common and typically found at flow margins (Figure 3A) and fronts, together with some areas of drained channel (Applegarth et al., 2010). Most breakouts are hundreds of meters long but some are substantially longer.
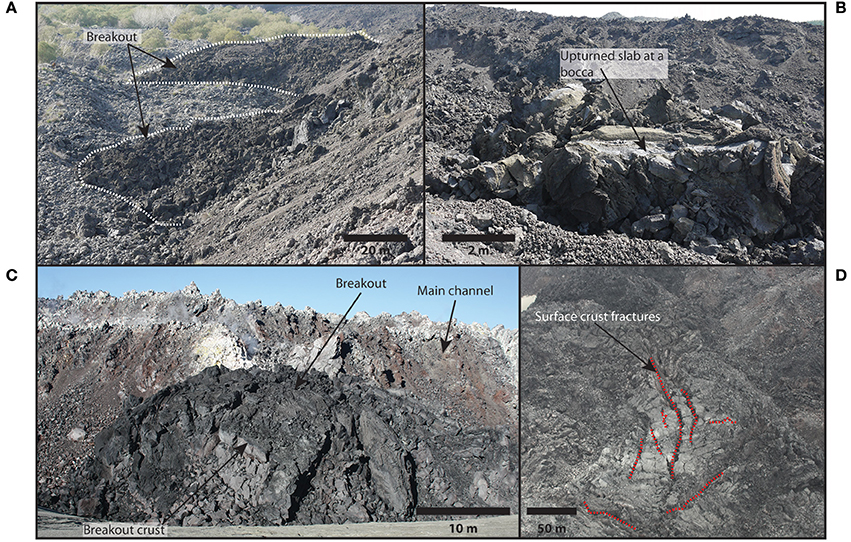
Figure 3. Field photographs from Mt Etna (A,B) and Cordón Caulle (C,D) that show evidence for the development of extensive surface crusts. (A) Breakouts from the margin of the 2001 Mt Etna lava flow, which formed in response to stalling of the flow front due to the development of an extensive surface crust. (B) An inflated bocca at the source of a breakout in a drained channel of the 2001 Mt Etna lava flow. Boccas are one of the few places that the surface crust is directly visible as it has been upturned when the breakout formed. (C) Breakout from the margin of the 2011–2012 Cordón Caulle rhyolite flow. The breakout has a domed morphology and an extensive surface crust. (D) Fractures in surface crust on the 2011–2012 Cordón Caulle rhyolite flow are tens to hundreds of meters long and likely several meters deep. These areas of crust provide direct evidence for the formation of a surface crust on the flow.
The surface crust is visible at the boccas (feeder points) of some breakouts, where it can be buckled upwards due to inflation (Figure 3B). Where observed, the crust is generally ~tens of centimeters thick, with a layer of incipiently welded clinker adhering to what would have been the top surface. However, this crustal thickness, formed in the latter stages of the eruption, may not be representative of the crust earlier in the flow evolution.
Inferred Changes in Rheological Control
As there are relatively sparse published observations of the eruption and spatio-temporal development of the lava flow field, the timing of inferred changes in rheological control is uncertain. However, a reported reduction in flow front advance rate occurred after ~40 h on a constant slope, and at a time when the vent effusion rate (Table 3) was increasing (Behncke and Neri, 2003; Coltelli et al., 2007). This suggests that surface cooling had generated a flow-retarding crust that had begun to exert significant influence.
The presence of breakouts, formed after the main flow front stalled, indicates the presence of a cooled crust that acted to halt, or substantially slow, the flow front and enabled breakout formation from the flow margins. Flow front halting was likely assisted by a reduced slope gradient. Direct observations of the crust at boccas show the development of a flow surface crust that could have influenced the flow development. The crust is visible only at areas of inflation or breakout formation, providing further evidence for the effectiveness of this crust, as it was able to accommodate an internal pressure increase within the flow due to material continuing to be supplied to the stalled front. It is worth noting that the breakout locations may be substantially controlled by inherent weaknesses in the surface crust. Here we assume flow behavior was initially controlled by its apparent Newtonian viscosity and there was insufficient cooling and crystallinity to acquire a yield strength in the first 40 h.
Application of Flow Models to the 2001 Mt Etna Flow
Previous work based on surface velocity measurements from videos of channelized sections of the flow have estimated a Newtonian flow viscosity of 3.5 × 10⁴–5.6 × 10⁵ Pa s (Applegarth, 2008) using Jeffreys (1925) equation
for flow in a wide channel, where ρ is the density, g is the acceleration due to gravity, d is the flow depth, β is the slope angle, n is an empirical constant for channelized flow and U is the flow surface velocity. It is assumed that the apparent viscosity ηA is equivalent to the viscosity η (Hulme, 1974; Stevenson et al., 2001; Harris et al., 2004; Farquharson et al., 2015). Here we use the central viscosity value of this range −3.0 × 10⁵ Pa s (Applegarth, 2008).
Models of Flow Lengthening
To account for uncertainty in the timing of the transition from viscosity to crust-controlled flow, lava flow models are used with transition times of 12, 24, and 36 h (Tables 2, 3), along with observed flow length changes from Applegarth (2008).
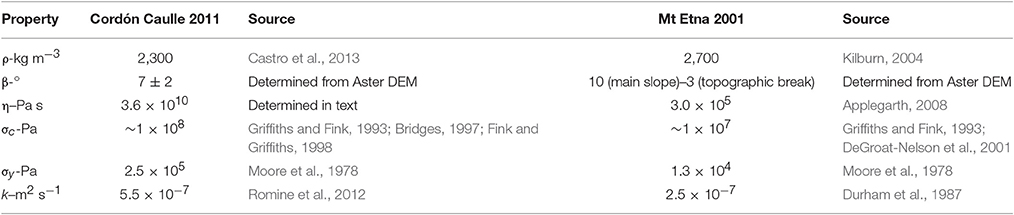
Table 2. Properties used in the numerical approach.
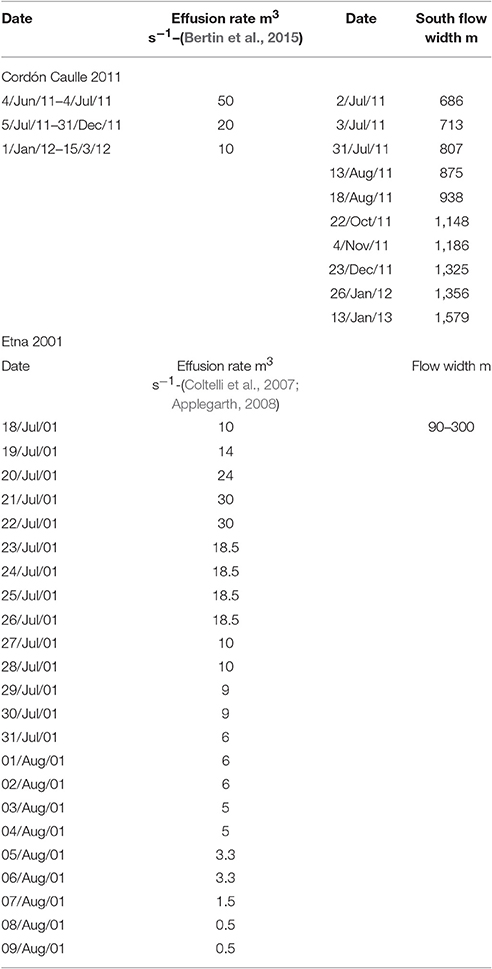
Table 3. Effusion rates and flow width variations.
The modeled lengths using the fixed parameter approach (Equations 1, 2) suggest that the transition from viscosity to crustal control occurred after 12–24 h, although in the case of a transition in control after 24 h the final lava flow length was overestimated by ~1 km (Figure 4A). The model may overestimate the advance rate during initial lava emplacement but this cannot be verified due to a lack of observed flow length data from this early stage.
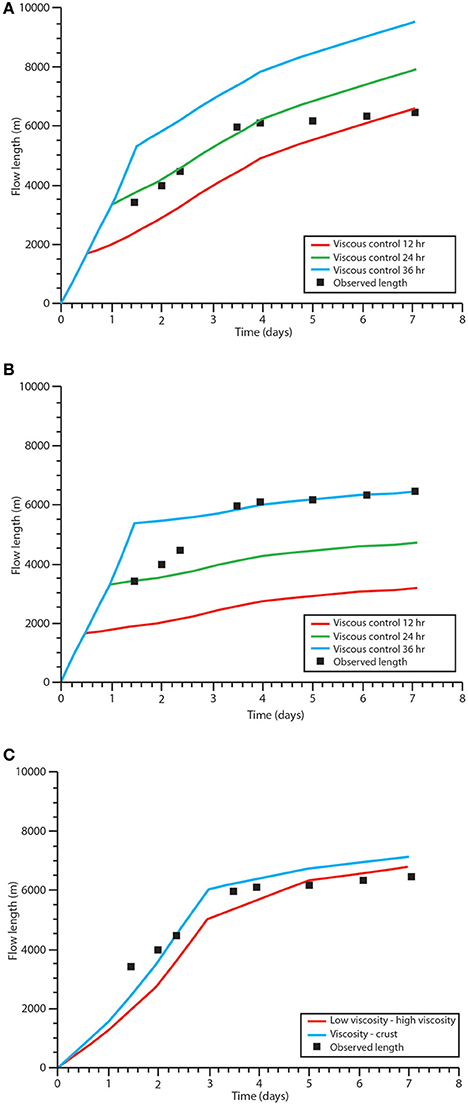
Figure 4. Modeled and actual flow length of the 2001 Mt Etna lava flow. (A) Results from the fixed parameter approach (Equations 1, 2) assuming the flow is controlled by its viscosity for 12, 24, or 36 h. (B) Results from flexible parameter approach (Equations 3, 4) assuming that the flow is controlled by its viscosity for 12, 24, or 36 h. (C) Results from flexible parameter approach (Equations 3, 4) using flow viscosities, crust yield strengths and transition times from Castruccio et al. (2013). Changes in flow control are inferred to occur after 3 days.
Modeled flow lengths using the flexible parameter approach (Equations 3, 4) show best fit to observational data with a viscosity to crustal-control transition after 36 h (Figures 4B). The reduced advance rate in Figure 4B in the crust controlled regime, compared with the model in Figure 4A, is due to changes in the flow width and a reduction in the ground slope that is not accounted for in the fixed parameter approach. The modeled results using values from Castruccio et al. (2013) are shown in Figure 4C and discussed fully in Section Comparison to previously modeled results.
Model Sensitivities
Most of the parameters used in the models are presented or calculated as a range. Here we briefly explore the effect of varying viscosity and crustal yield strength on the models. For viscosity, the plausible range of 3.5 × 10⁴–5.6 × 10⁵ Pa s (Applegarth, 2008) leads to final modeled flow lengths that vary by ~10 km (Figures 5A,B). These substantial differences highlight the model sensitivity to viscosity and emphasize that strong constraints on the timing of rheological control transitions are vital, as well as for parameter values. However, within this range, some model results provide a good match to the observed flow lengthening.
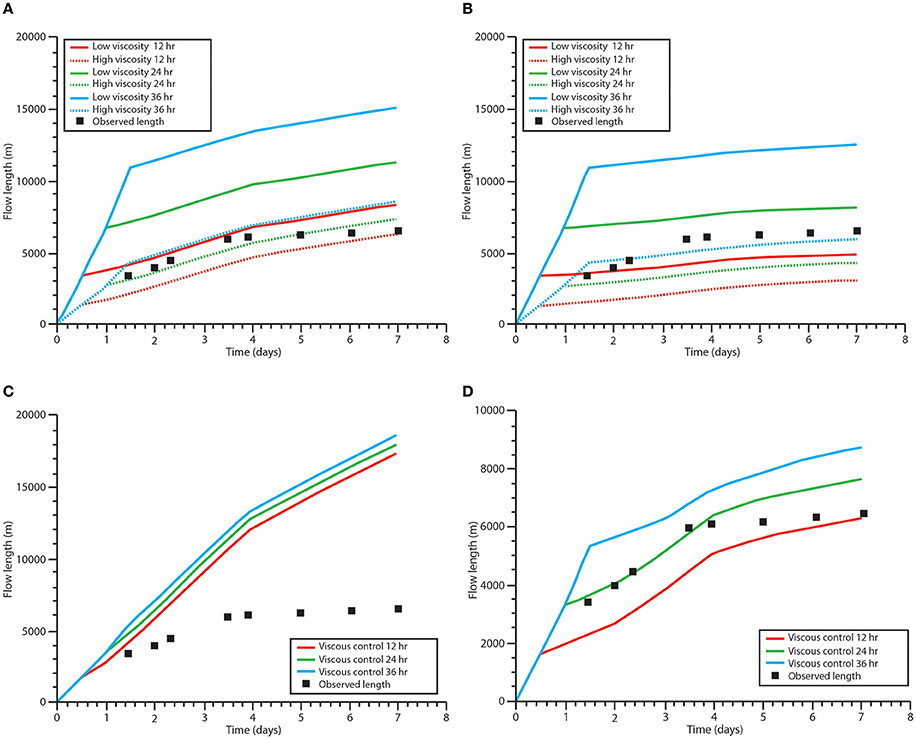
Figure 5. Modeled results for flow length of the 2001 Mt Etna lava flow showing variations in the material properties. (A) Range of possible flow lengths using viscosity range of 3.5 × 10⁴–5.6 × 10⁵ Pa s (Applegarth, 2008). Fixed parameter approach (Equations 1, 2). Dashed lines show the high viscosity end member and solid lines the low viscosity end member. (B) Similar to (A) but for the flexible parameter approach (Equations 3, 4). (C) Fixed parameter approach results (Equations 1, 2), showing changes from viscosity control to crustal yield strength control after 12, 24, and 36 h, respectively, crustal yield strength of 106 Pa. (D) Similar to (B) but for a flexible parameter approach (Equations 3, 4). The three model curves correspond to different transition times in the rheological control.
Models are similarly sensitive to the crustal yield strength value; for the fixed parameter approach (Equations 1. 2) decreasing yield strength from 107 to 106 Pa results in a final lava flow length overestimated by >10 km (Figure 5C). For the flexible parameter approach (Equations 3, 4) the final flow length increased by ~2 km (Figure 5D), with a transition in flow control after 36 h. However, with transition in flow control after 12 or 24 h, the model results give a closer fit to the observed flow front advance, reflecting a correlation between the parameters for crustal yield strength and the inferred timing of the onset of crustal control.
Rhyolitic Lava from the 2011–2012 Cordón Caulle Eruption
Puyehue-Cordón Caulle is a basaltic-rhyolitic volcanic complex in the southern volcanic zone of the Chilean Andes (Figure 6). One of the world's most frequently active rhyolitic/rhyodacitic volcanoes, it has most recently erupted in 1921–1922 (Katsui and Katz, 1967), 1960 (Lara et al., 2004, 2006), and 2011–2012. The VEI 5 2011–2012 eruption of crystal-poor rhyolite (69–74 wt% SiO2) began on 4 June 2011, initially producing a 15 km high Plinian column (Castro et al., 2013). At the onset of lava effusion, from 15 June 2011, the lava flux exceeded 50 m3s−1 (Bertin et al., 2015). Lava effusion was first identified from radar satellite images on 19 June 2011 (Bignami et al., 2014), with lava flowing into a gently-sloping (5–9°) topographic depression. Much of the eruption constituted hybrid explosive-effusive activity, with simultaneous lava emission and pyroclastic venting from a common vent (Castro et al., 2013; Schipper et al., 2013). The eruption ended on 15 March 2012, but parts of the lava flow continued to advance into January 2013 (Tuffen et al., 2013). In total ~0.4 km3 lava was emitted (Tuffen et al., 2013), alongside ~1 km3 tephra (Pistolesi et al., 2015). We acknowledge that the 2011–2012 Cordón Caulle lava flow lies at the low-silica end of the rhyolitic spectrum, but its high viscosity and crystal-poor nature does allow direct comparison with more typical higher-silica rhyolitic lava flows.
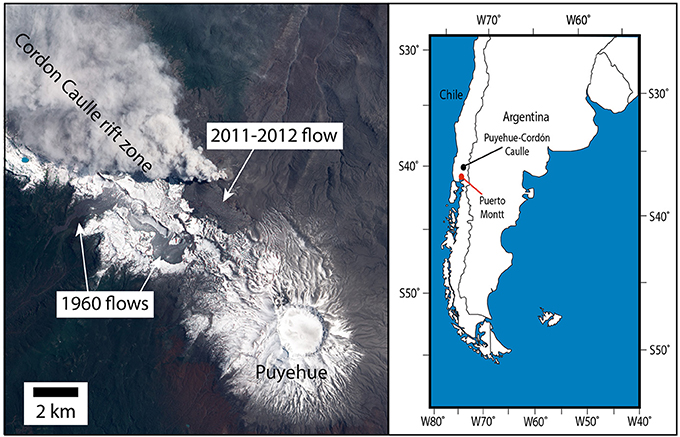
Figure 6. Satellite image (EO-1) showing the location of the Cordón Caulle lava flow and vent relative to the main Puyehue edifice. The Cordón Caulle rift zone is aligned NW-SE. Previous rhyolite flows from an eruption in 1960 are visible just south of the new lava flow. Inset shows the location Puyehue-Cordón Caulle within South America.
Lava Flow Advance and Morphology
Satellite images from GeoEye-1 and Earth Observing-1 ALI (EO-1 data available from the U.S. Geological Survey, https://eo1.usgs.gov/) show the evolution of the rhyolite flow during the eruption (Figure 7). The images were used to derive the position of the flow front and supplemented by flow outlines derived from COSMO-SkyMed radar data from Bignami et al. (2014).
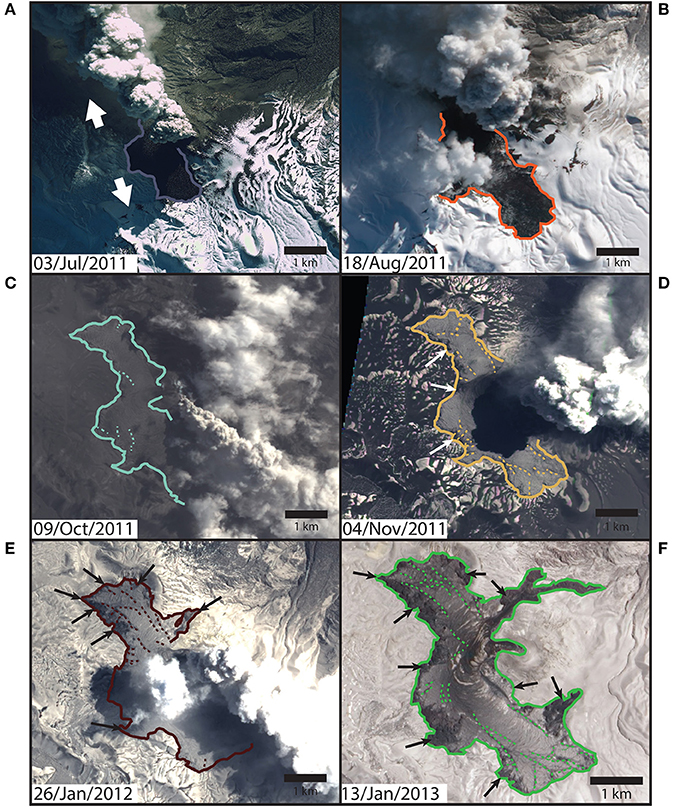
Figure 7. Satellite images taken during the 2011 eruption at Cordón Caulle. (A) 3 July 2011 GeoEye-1 image, white arrows show the dominant flow directions, image provided by GeoEye Foundation (scene ID: 1050410001685D00). (B–F) Images from the Advanced Land Imager (ALI) on NASA's Earth Observing-1 (EO-1) satellite (NASA, 2011a,b,c, 2012, 2013). Solid lines mark the flow front, dashed lines highlight surface fractures and the arrows show some of the areas of breakout formation. The two white arrows in par (A) show the dominant flow directions throughout the eruption. The flow initially spread over the topography. Over time, fractures (dashed lines) formed in the flow surface and shortly after this the first breakouts formed from the stalled flow front and margins.
By 26 June 2011 (d = 22 where d is the number of days from the eruption onset) the flow had split into two channels, one heading north and one heading south, hereafter referred to as the northern and southern flows. These flows advanced synchronously but the northern flow stopped against a topographic high on around 22 October 2011 (d = 140) after advancing ~3 km. This portion of the lava flow was impeded by topography at both its margins and flow front. The southern flow advanced throughout the ~285 day eruption, and continued to advance after eruption cessation, reaching ~4 km in total length. The lava advanced into a shallow topographic basin across a substrate of loose volcaniclastic material cut by numerous small gullies and ridges up to ~10 m in height, which are minor compared to the 30–40 m thickness of the lava flow.
The first 2 months of the eruption produced lava with a blocky appearance and no obvious large scale structures (Figure 7A), similar in appearance to other rhyolitic and high silica flows such as Big Glass Mountain in the US (Fink, 1980b; Fink et al., 1992; Castro et al., 2002). By 18 August 2011 the flow had developed surface folds hundreds of meters in length, with a wavelength of ~30–40 m (Figure 7B, d = 75).
By 9 October 2011 (d = 127, Figure 7C) large-scale fractures (hundreds of meters or longer) had formed in the surface crust of the flow (Figures 7C–F). Two fracture types developed–tensional fractures generated by coupling of the crust to the spreading flow core, and shear zones that separated the stalled flow margins from the mobile channel center.
The first breakouts formed from stalled flow fronts and margins by 4 November 2011 (d = 153, Figure 7D). Thereafter, almost all advance in the northern flow, from the front or margins, was via breakout formation (Figure 7D). Such prevalent breakout formation from this portion of the flow was likely aided by the early stalling of the northern flow against large (up to 100 m high) topographic barriers. In contrast, the southern flow continued to advance during and beyond the remainder of the eruption (Tuffen et al., 2013). Breakouts in the southern flow mostly formed from the flow margins, whilst some small breakouts formed at the flow front (Figures 7F, 8).
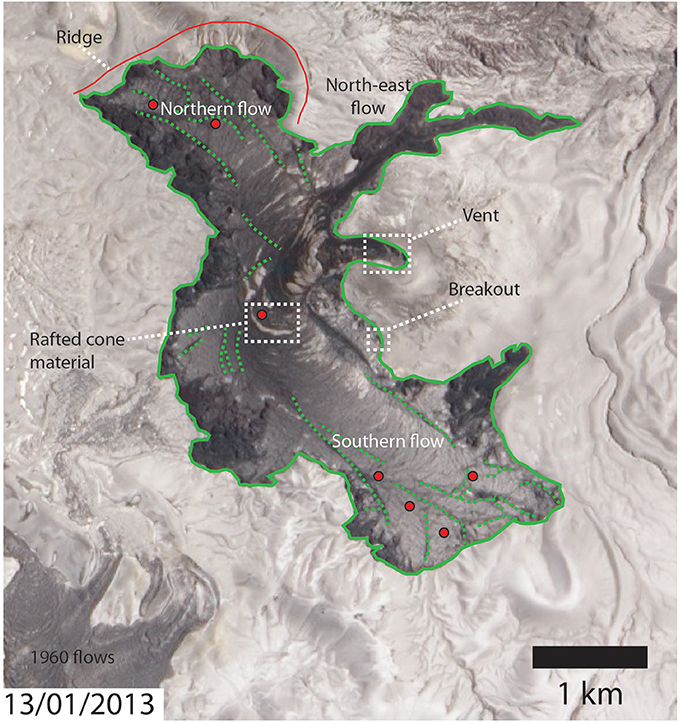
Figure 8. Cordón Caulle flow after the eruption ended and almost all flow movement had stopped. Features such as the rafted cone material are highlighted as well as the ridge to the north that acted to halt the northern flow. The location of the small breakout in Figure 3C is also shown. Red dots show approximate locations where flow surface velocities were calculated. Green dashed lines show locations of the large surface fractures.
A secondary flow, 2 km in length, formed from one breakout on the northern flow after stalling of the main flow front (Figures 7E,F, 8). It began to form around 23 Dec 2011 (d = 202) on the eastern margin of the northern flow (Figures 7E,F, 8). The secondary flow was narrow (100–400 m across), contained within a steep gully (~15° slope), and advanced into a forested area on the eastern volcano flank before halting. The southern flow began to advance into topographic barriers around 23 Dec 2011 (d = 202) and this may have impeded lava flow advance. A 50–150 m high ridge spanning the entire western side of the northern and southern flows severely restricted westward spreading of the flow front.
Other flow surface features visible in the satellite imagery include light brown/yellow patches several tens of meters across, and mostly confined to the main flow channel, which represent rafts of flow top pumice. Numerous rough, dark brown patches up to 500 m in length, visible in Figures 7F, 8, are elongate and ogive-parallel far from the vent, but occur as large, more equant patches closer to the vent. These consist of poorly-consolidated, coarse-grained pyroclastic deposits thought to derive from gravitational collapse of the tephra cone at the vent. Lava effusion ended around 15 March 2012 (d = 285) but local advance of breakouts in the southern flow continued for several months (Tuffen et al., 2013).
Field Evidence for Late Crustal control
Field campaigns at Cordón Caulle were conducted in January 2013, 2014, and 2015. Fieldwork focused on the morphological features of the flow as well as ground-truthing features observed in satellite images. The lava flow is blocky and ~30–40 m thick, with a surface consisting of loose debris tens of centimeters to meters across that comprise fragments of surface crust and pumiceous material. This cover of loose debris may have contributed to the thermal insulation of the flow but is unlikely to have had a substantial mechanical influence on the bulk flow advance. Direct evidence for an underlying surface crust is presented by extensional fractures meters to hundreds of meters in length (Figure 3D). The depth of downward penetration of these fractures (several meters to >10 m) indicates a plausible crustal thickness. Further evidence for vertical rheological variation is given by the presence of well-developed ogives (or surface ridges) that are 30–40 m in wavelength and several meters in amplitude.
Breakouts are widely distributed around the flow front and margins, where they display a range of morphologies. Many breakouts developed extensive surface crusts tens of centimeters thick (Figure 3C), which then fragmented as the breakout grew and inflated (Tuffen et al., 2013). Their presence indicates that although the main flow advance had halted, mobile lava remained available in regions close to the flow edges and was likely still being effused from the vent. Breakouts that initiated after vent effusion ceased were fed by lava drainage through the flow field, as observed at other flows (Dietterich et al., 2012).
Inferred Changes in Rheological Control
In its initial stages, flow advance may have been controlled either by an apparent Newtonian viscosity or a non-Newtonian (yield strength) rheology. However, in its latter phases the field and satellite observations of folds and fractures suggest that a surface crust exerted a strong influence. Surface folds (ogives) form in response to a slowing flow front and subsequent buckling of a rheologically stiff surface crust behind it (Fink, 1980a). The extensional fractures that formed after ogive formation appear similar to those generated in analog models of lava flows with a strong brittle crust (Lescinsky and Merle, 2005; Applegarth, 2008), and their orientation suggests that some fractures relate to the formation and spreading of flow front lobes. We infer that when surface fractures were produced the flow crust was significantly influencing flow advance. Furthermore, the presence of breakouts points toward sufficient crustal strength to halt overall advance, despite the availability of mobile material in the flow core (Tuffen et al., 2013; Farquharson et al., 2015).
Application of Flow Models to the 2011–2012 Cordón Caulle Lava Flow
Calculation of Bulk Flow Viscosity
In order to apply Newtonian flow lengthening models to the Cordón Caulle lava, the bulk flow viscosity must first be estimated using Equation (6) (Jeffreys, 1925). We use a lava density of 2,300 kg m−3 (Castro et al., 2013), a flow depth of ~30 m at the flow front (Farquharson et al., 2015), a slope of 7° (determined from a pre-eruption Aster DEM along the length of the southern flow), and n = 2 for flow in a wide channel (Hulme, 1974; Stevenson et al., 2001; Harris et al., 2004; Farquharson et al., 2015).
In order to determine the lava flow surface velocity, surface features in the main channel of the flow (ogives, fractures in the flow crust, and pale pumice rafts) were tracked between two georeferenced satellite images taken in 9 October 2011 and 26 January 2012 (Figure 8). Surface velocities of 2.2–6.2 × 10⁻⁵ m s−1 were derived (mean 3.8 × 10⁻⁵ m s−1), giving a viscosity range of 2.0–5.6 × 10¹⁰ Pa s (mean 3.6 × 10¹⁰ Pa s).
Models of Flow Lengthening
Due to the northern flow being topographically constrained at its front, lava flow advance models are only relevant to the initial advance of the southern flow. We assume that the lava flow was initially controlled by either a Newtonian or non-Newtonian bulk rheology for the first 75–127 days. Henceforth, the presence of ogives and surface fractures indicate that surface crust had attained sufficient thickness and strength to exert a controlling influence on flow behavior. Model results should be disregarded for periods after the southern flow front began to interact with a topographic barrier (202 days). However, by this time the major changes in rheological control had already occurred, with the lava firmly in the crustal-control regime and breakouts forming at many points around the lava flow. The effusion rates (Table 3) are cited for the entire flow field (Bertin et al., 2015). As a best estimate, we assume that the north and south flow branches were fed approximately equally—i.e., each at half the rate given in Table 3.
Models based on the fixed parameter approach (Equations 1, 2, utilizing values in Table 2) underestimate final lava flow length by ~1,500–1,000 m for transitions from viscosity to crustal control after 75 and 127 days respectively (Figure 9A). The biggest disparity is in the early stages of the eruption, when the observed lava flow advance rate far exceeded model predictions, suggesting that early-erupted lava was substantially less viscous than the later-erupted lava for which we have viscosity estimates (Farquharson et al., 2015). Such increases in the lava flow viscosity with time likely relate to cooling, degassing and crystallization of the lava flow.
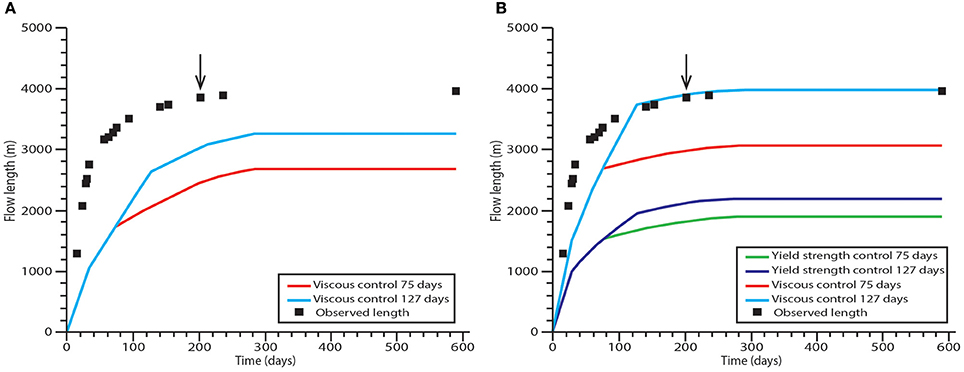
Figure 9. Modeled and actual flow length changes of the 2011 Cordón Caulle rhyolite lava flow. The black arrow shows the time at which the flow starts to interact with a topographic barrier. (A) Results from fixed parameter approach (Equations 1, 2) assuming the flow is initially controlled by its viscosity and then by the strength of a brittle crust. (B) Results from flexible parameter approach (Equations 3–5) assuming the flow is initially controlled by either its viscosity or internal yield strength.
Models that employ the flexible parameter approach (Equations 3–5) and assume a core yield strength control underestimate the final flow length by ~2,000 m (Figure 9B). When an initial viscosity control and 75 day crustal control transition are used the final lava flow length is underestimated by ~900 m. However, when the crustal control transition occurs after 127 days, the modeled final lava flow length closely fits with observed values. Not surprisingly, the flexible parameter approach provides a better fit for the early stages of the lava evolution than the fixed parameter approach, because it accounts for variations in lava flow properties, such as the flow width.
Inferring Cordón Caulle Flow Properties
The Cordón Caulle lava flow gained most of its length in the first 2–3 months of the eruption, during inferred viscosity-controlled advance. However, reliable viscosity estimates could only be made from the latter stages of the eruption when recognizable surface features could be tracked and the flow was less obscured by the eruption plume. Thus, viscosity estimates are upper bounds because they are likely to be affected by the presence of a crust, and the later lava was likely cooler, more degassed and more crystalline than during the earlier stages (Schipper et al., 2015). Flow length models offer an alternative approach to constrain plausible values of flow viscosity, crust yield strength and internal yield strength.
The optimized fixed parameter model provides a best fit to observed flow lengthening for a viscosity of 3.3 × 10⁹ Pa s, a crustal yield strength of 2.5 × 10⁸ Pa and a transition from viscosity to crustal control after 60 days (Figure 10A). This lower viscosity, an order of magnitude less than estimates for later lava (Farquharson et al., 2015), could be representative of initially effused lava that was hotter, less crystalline and more volatile-rich. A viscosity value can also be estimated directly using the Einstein-Roscoe equation:
where η0 is the melt viscosity which can be determined from Giordano et al. (2008), R and Q are constants equal to 1.67 and 2.5 respectively, and Φ is the crystal packing fraction. Using an eruptive temperature of 900°C, a melt composition from Schipper et al. (2015) with a volatile content of 0.1%, and an initial crystal content of ~30% at the vent (Schipper et al., 2015) gives a viscosity of ~1.5 × 10⁹ Pa s. This is in close agreement to the fixed parameter model suggested here (Equations 1, 2, Figure 10A). We acknowledge that the Einstein-Roscoe equation is based on the assumption that the crystal population is isotropic. However, in the Cordón Caulle flow most crystals are rod-like microlites (Schipper et al., 2015), and such high aspect ratio crystals increase the magma viscosity more strongly than isotropic crystals (Mueller et al., 2011; Mader et al., 2013). Accordingly, this estimate could be taken as a minimum value, and viscosity also likely increased with time due to degassing and crystallization of the lava flow. Alternatively, the alignment of an initial randomly orientated microlite population could lead to shear thinning behavior during lava flow emplacement and a reduction in apparent viscosity. Despite these limitations, the value independently derived from the Einstein-Roscoe equation does support the viscosity value derived through the optimized lava flow models, Equations 1, 2.
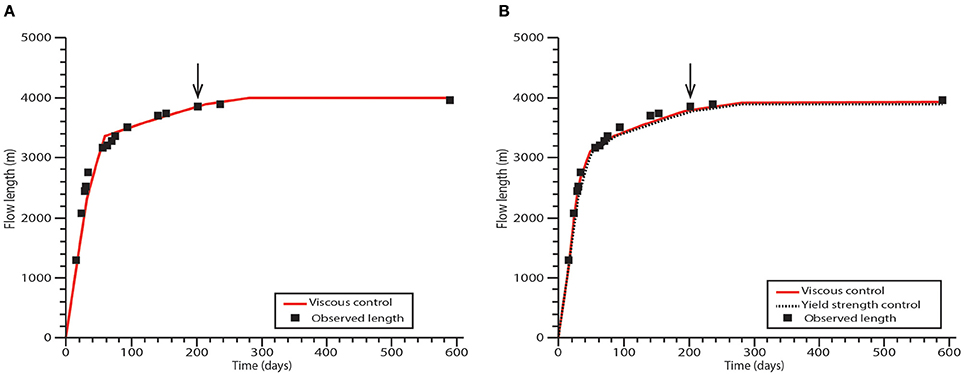
Figure 10. Model results for the Cordón Caulle lava flow. The black arrow shows the time at which the flow starts to interact with a topographic barrier. (A) Fixed parameter approach (Equations 1, 2) where flow properties have been inferred from the best fit of the applied models. (B) Flexible parameter approach (Equations 3–5) where flow properties have been inferred from the best fit of the applied model.
Optimizing a flexible parameter model with Newtonian viscosity and subsequent crustal control (Equations 3, 4) gives the best fit to the observed flow lengthening for a rather higher viscosity of 1 × 10¹⁰ Pa s, a lower crustal yield strength of 4 × 10⁷ Pa and a similar flow control transition time of 50 days (Figure 10B). A flexible parameter model that assumes initial core yield strength control provides best fit for a core yield strength of 9.8 × 10⁴ Pa, a crustal yield strength of 4 × 10⁷ Pa and a transition in flow control at 50 days. As these models are inherently non-unique and other combinations of flow properties and transition time in flow control can yield equally good fits to observations, it is valuable to compare the determined flow parameters to previously published results. The inferred values of crustal yield strength correspond with those proposed in other studies of silicic lava flows and domes (Griffiths and Fink, 1993; DeGroat-Nelson et al., 2001) and the lower core yield strength determined here is in line with other estimations of high silica content lava yield strength (Blake, 1990; Fink and Griffiths, 1998). The inferred viscosity from the idealized flexible parameter approach (Equations 3, 4, Figure 10B) is in line with the lower viscosities calculated by Farquharson et al. (2015) for breakouts (1.21 × 10¹⁰–4.01 × 10¹⁰ Pa s) from the flow margin but is slightly lower than the inferred bulk lava viscosity inferred from satellite observations.
Model Sensitivities
The uncertainties associated with model input result in uncertainties in model outputs; for example varying slope angle by 2° in all models leads to final flow length changes of ~2–10%, corresponding to flow length variations up to a few hundred meters. However, variations due to uncertainties in crustal yield strength and flow viscosity are much greater. Applying the range of viscosity values derived from initial range in flow channel velocities leads to a range in the final modeled flow lengths of ~1.5 km for the fixed parameter approach (Figure 11A) and 2 km for the flexible parameter approach (Figure 11B).
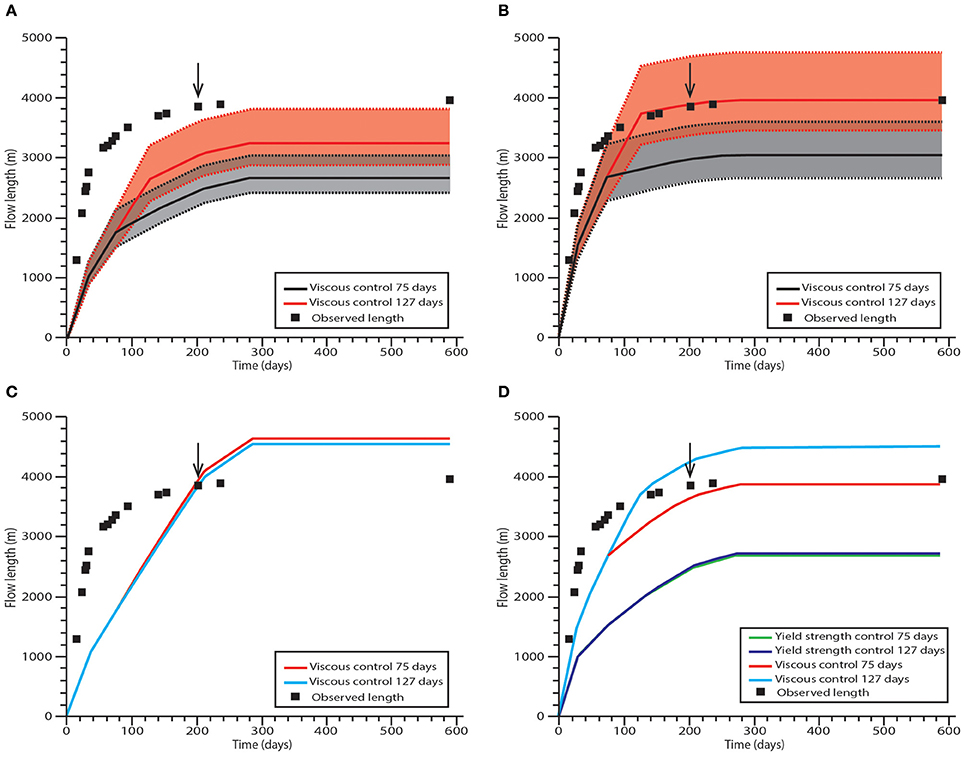
Figure 11. Model results for the Cordón Caulle lava flow. The black arrow shows the time at which the flow starts to interact with a topographic barrier. (A) Range of model results when viscosity is varied using the fixed parameter approach (Equations 1, 2). The red area represents a transition in rheological control after 127 days and the gray area represents a transition after 75 days. Dashed lines show the high and low viscosity end members and the solid lines show the mean viscosity. (B) Similar to (A) but for a flexible parameter approach (Equations 3, 4). (C) Fixed parameter approach (Equations 1, 2) where the crust yield strength is reduced by an order of magnitude to 107 Pa. (D) Similar to (C) but for a flexible parameter approach (Equations 3–5). Flow is initially controlled by either its viscosity or core yield strength. Two core yield strength curves give similar results for a transition in control after 75 days and 127 days.
Previously published values for the crustal yield strength of silicic lavas range from 106 to 108 Pa (Griffiths and Fink, 1993; Bridges, 1997; Fink and Griffiths, 1998; DeGroat-Nelson et al., 2001; Kerr and Lyman, 2007; Castruccio et al., 2013). Reducing the crustal yield strength by an order of magnitude to 107 Pa in the fixed parameter approach (Equations 1, 2) produces a significant increase in modeled lava flow advance rate in the crustal control regime (Figure 11C) compared to the original model (Figure 9A), and increases the final lava flow length by >1.5 km. An earlier transition in flow control (at day 75), results in a longer lava flow than when the transition occurs after 127 days. This is because at this time in the modeled scenario, the crust provided a lesser retarding force than the flow viscosity, leading to accelerated lava advance rates upon flow control transition. In reality though, the lava flow would have retained the viscous retardation and remained viscosity controlled until the crust became sufficiently strong to dominate over the viscous forces. Thus, this apparent increase in lava flow advance is an artifact of the modeling approach that considers rheological controls in isolation rather than combination. The effect on the flexible parameter models of lowering crust yield strength (Equations 3, 4) is not as pronounced (Figure 11D), but leads to an increase in the final flow length compared to the original model (Figure 9B), and provides a closer fit to the actual flow lengthening.
Discussion
Field and remote sensing observations, as well as straightforward flow advance models, suggest that both the 2001 Etna basaltic flow and the 2011–2012 Cordón Caulle rhyolitic lava flow were controlled in their latter stages by a cooled crust after an initial viscous control. The cooled crust acted to retard the lava flows, ultimately halting them before breakouts formed at the flow front and along flow margins (Behncke and Neri, 2003; Coltelli et al., 2007; Applegarth et al., 2010; Tuffen et al., 2013).
Model Limitations
The models are limited by the uncertainties in parameter values and inherent in-model assumptions (aleatory and epistemic uncertainties). The models themselves are straightforward and their ability to simulate flow lengths across a broad compositional range demonstrates their generality (Kerr and Lyman, 2007; Castruccio et al., 2013). The flexible parameter approach (Equations 3–5) will be most appropriate for lava flows that undergo substantial widening, such as the Cordón Caulle rhyolite flow, and likely explains the disparity among the model results. None of the models are valid for sections of uphill slope (i.e., negative β values) and so breakdown when topographic barriers are encountered. For this reason, averaged slope angles are typically used.
Values of crustal strength are poorly reported in the literature and often rely on scaling analysis from analog experiments (Griffiths and Fink, 1993; Fink and Griffiths, 1998). The evolution of crustal strength through time is also unknown and very difficult to determine. The effusion rate is relatively well constrained for the 2001 Mt Etna eruption (Behncke and Neri, 2003; Coltelli et al., 2007). However, the effusion rate for the 2011–2012 Cordón Caulle eruption is less well constrained, with only preliminary values currently available. Due to lack of data we assume that the north and south flows received an equal share of the vent effusion rate. Because both flows were continuously fed and active throughout the eruption (either through breakout formation or main flow advance) this assumption appears reasonable.
Error in imagery-derived lava flow velocity estimates mostly relate to potential georeferencing problems, although physical effects, such as compression of the flow surface during ogive formation giving an apparent shortening of the flow's surface, will also contribute. Such errors are likely small compared with other uncertainties and the velocity values calculated encompass those estimated by Farquharson et al. (2015) for breakouts in the latter phases of flow emplacement (3.57 × 10⁻⁵ m s−1). The topographic slope may also have changed during the eruption, as Castro et al. (2016) have shown that considerable uplift (>200 m) occurred around the Cordón Caulle vent in the first month of the eruption. This uplift, which is attributed to the emplacement of a shallow laccolith intrusion, may have increased the average gradient along the length of the southern flow by up to ~3°. However, such a magnitude of slope change has a minor effect on the model outputs when compared with other influences, as discussed in Section Model sensitivities.
The frequency of available observational data remains a substantial factor within the uncertainties of model outputs. For Cordón Caulle, the precision in the timing of the transition between viscous and crustal control (identified through observations of crustal fracturing or the formation of features such as ogives and breakouts), is limited by the infrequent satellite image acquisitions (one to two partial images per month).
Despite these uncertainties, the models provide reasonable estimates of the evolution of compositionally diverse lava flows. Nevertheless, is clear that good knowledge of the evolving flow architecture can help constrain models and identify when underpinning assumptions breakdown. Morphological considerations can thus aid model selection and improve the accuracy of estimated parameter values, as well as helping identify where the greatest remaining uncertainties lie.
Comparison to Previously Modeled Results
Due to the additional constraints that we impose, our model results for the 2001 Mt Etna flow have a poorer fit to the observed flow lengthening (Figure 4) than those shown previously by Castruccio et al. (2013), in which more parameters were allowed to vary within the fitting process. Castruccio et al. (2013) suggests that the 2001 Etna flow advance was either controlled by an initially low viscosity (3.8 × 10⁶ Pa s), which increased after 3 days (2.4 × 10⁸ Pa s), or by an initial low viscosity (4.5 × 10⁶ Pa s) and then by the crustal yield strength (1 × 10⁶ Pa, Figure 4C). We have initially constrained crustal yield strength to a greater value in our models. However, when a value closer to that of Castruccio et al. (2013) is used, the modeled fit in the flexible parameter approach is much improved (Figure 5D). This suggests that the crust of the 2001 Etna flow may have been weaker than indicated by Griffiths and Fink (1993). The models presented here, as well as flow observations, suggest that (1) the transition in the lava flow control at Mt Etna occurred much sooner, within 36 h, than the 3 days suggested by Castruccio et al. (2013), and (2) the initial lava flow viscosity was considerably lower.
For high viscosity (dacite) lava flows, Castruccio et al. (2013) suggested a core yield strength control. However, our findings suggest that the high viscosity and crystal poor Cordón Caulle lava flow was initially viscosity-controlled. This arguably reflects a fundamental difference between the emplacement of crystal-poor and crystal-rich high-silica flows. Rhyolitic lavas are typically extruded as degassed, crystal-poor melt, because their high melt viscosity makes diffusion sluggish (Eichelberger et al., 1986; Eichelberger, 1995). In contrast, other high viscosity lavas including andesites and dacites typically have a significantly higher crystal content (Sparks et al., 2000), making a yield strength control far more likely. Indeed, the dacitic lava at Santiaguito is significantly more crystal-rich, 47% by volume (Rose, 1987; Holland et al., 2011), than the initially effused Cordón Caulle rhyolite.
Development of a Yield Strength
Thus, the advance rate of some high silica lava flows is thought to be controlled by their core yield strength (Castruccio et al., 2013), which develops when the lava crystal content exceeds ~30% volume (Saar et al., 2001; Castruccio et al., 2010). However, it is currently unclear whether the Cordón Caulle rhyolite could have developed substantial core yield strength during emplacement, as measured crystal contents in samples taken from the vent region are only ~10–30% (Schipper et al., 2015), and generally beneath the threshold proposed by Saar et al. (2001). Nevertheless, such vent samples only represent the last-erupted material and may not typify earlier-effused material, which could have had a lower crystal content.
In contrast, samples from breakouts exhibit significantly higher crystal content of 50–60% (Schipper et al., 2015), clearly sufficient to generate a yield strength. Nevertheless, given the slow crystallization kinetics of rhyolites (Swanson et al., 1989), it is unclear whether this crystal population could have formed before lava flow advance became dominated by a crust. Swanson et al. (1989) suggest the bulk of crystallization in rhyolites occurs only after lava has halted and had time to cool. Furthermore, much of the crystal population within a rhyolite lava flow may be products of devitrification, such as spherulites or globulites (Schipper et al., 2015), which largely form after lava has halted. Further work on detailed textural studies is needed in order to reconstruct the crystallization history relative to the emplacement duration, and unravel to what effect, if any, crystal populations had on the evolution of an effective crust and broader flow processes.
Breakouts and Crustal Control
Observations of Cordón Caulle demonstrate that not only was the lava flow controlled in its latter phases by a cooled crust, but the crust was able to halt the flow leading to breakout formation at the stalled front and flow margins. Such a strong crustal control had been inferred at other high silica flows (Anderson and Fink, 1992; Castro et al., 2002), but the absence of breakouts at these flows is intriguing. As the first Cordón Caulle breakouts formed only after ~150 days, the absence of breakouts at other rhyolite lava flows may reflect briefer emplacement timescales of lava flows that were volume-limited. Alternatively, a lack of breakouts may reflect the inability of other lava flows to develop a substantial surface crust, potentially indicative of higher flow advance rates than at Cordón Caulle caused either by higher effusion rates (Loewen et al., 2017) or steeper topography. In both cases, the greater lava flow velocity is likely to apply greater stress to the surface crust through developing greater velocity gradients, causing it to fail more regularly and potentially preventing development into a pervasive surface capable of halting the flow (Anderson et al., 1995; Kilburn, 2004). Similarly, pulses of higher effusion rate could result in periods of increased flow rate, leading to increased disruption of the flow surface crust. Furthermore, higher effusion rates would allow the flow to advance farther before cooling became a substantial controlling factor (Fink and Griffiths, 1998). Alternatively, surface crusts at other high silica flows could be sufficiently strong to prevent breakout formation in the first place, with the internal pressure failing to exceed the crustal yield strength.
A combination of these processes may have contributed to the lack of breakouts from the late north-east lobe of the Cordón Caulle flow (Figure 8). The north-east lobe displays pronounced levees and a possible area of drained channel, suggesting that its emplacement was volume limited. This lobe advanced down a much steeper slope (~15°) than the main flow field, potentially leading to increased deformation of any surface crust by the greater stresses involved. In contrast, the bulk of the flow field advanced over very gentle topography and, in some cases, abutted topographic barriers, which could have aided crust formation through putting the top surface under compression, reducing the degree to which the surface crust was ruptured by extensional fracturing.
Given the presence of very large fractures in the Cordón Caulle flow surface, the crust clearly behaved brittly for part of its lifetime. The models used here assume that the crust acts as a deforming viscoelastic layer that controls the lava flow advance. This layer is likely bounded by a cooled, strong brittle layer that would fragment. The energy used in the fragmentation of a brittle surface layer can be accounted for (Kilburn, 2004) and future models could attempt to incorporate this additional factor in lava flow lengthening models. It is also worth noting that, in many large basaltic lava flows, the crust not only halts flow advance but enables prolonged supply to the flow front through effective insulation of the material in the lava flow core (Anderson et al., 1999; Vye-Brown et al., 2013). This is also true of the Cordón Caulle rhyolite flow, where material continued to be supplied beneath the stalled crust to breakouts at the flow front and margins, enabling continued lava flow transport long after the eruption ended (Tuffen et al., 2013; Farquharson et al., 2015).
Crustal Thicknesses
Lava flow crustal thicknesses (δ) can be estimated at the time of transition from viscosity to crustal control if we assume that the crust grows diffusively by δ~(kt)1/2 (Griffiths and Fink, 1993), and with values of k given in Table 1. In the case of the 2001 Mt Etna flow, this suggests crustal thicknesses of 0.1, 0.15, and 0.2 m after 12, 24 and 36 h respectively, and 0.4 m by the time the lava flow reached its maximum length; broadly similar to thicknesses observed in the field. The Cordón Caulle flow would have attained a crustal thickness of ~1.9 and 2.5 m thickness after 75 and 127 days, and 4 m after 285 days at the eruption end. This is also a similar scale to the depths of fractures observed in the field and the estimated crust thickness at other rhyolite flows from fractures and ogive wavelengths (Fink, 1980a).
The point at which a lava flow becomes crustal controlled could be considered as a ratio between crustal thickness and the bulk flow thickness (Lescinsky and Merle, 2005). The timescale of crustal thickening is primarily controlled by the thermal diffusivity, with higher diffusivities, e.g., associated with low vesicularity, leading to a faster thickening and hence more rapid transition to crustal control. A crust with a higher yield strength ought to become a controlling factor more rapidly than a lower yield strength crust because it would not have to gain as great a thickness to have a commensurate effect on lava flow emplacement. The timing of the onset of crustal control must therefore be sensitive to both the initial crystallinity of the lava and the rate of in-flow crystallization.
The ratio of crustal thickness to flow thickness (Ψ) can be calculated for the moment of inferred viscosity to crustal control transition. In the case of the 2001 Etna flow, Ψ is equal to 0.02–0.04, depending on the inferred transition time. Similarly, for Cordón Caulle Ψ is equal to 0.06–0.08. We thus infer that the crust becomes a dominant influence when it accounts for 2–8% of the bulk flow thickness, but this proportion could be lower for crust with a higher yield strength. Such dimensionless numbers help to systematically define the timing of viscosity to crustal control transition. Crustal strength is clearly a key, but poorly understood, aspect of lava flow emplacement. Improved constraints are required to define and quantify the factors that influence it, which must include lava texture (i.e., crystallinity, vesicularity), composition, and cooling rate. Such an improved understanding could aid in defining the value of Ψ required to control lava flow advance rate for a broad compositional range.
Conclusions
Observations of lava flow emplacement from published studies, field data and satellite imagery indicate that a strong crust may significantly influence the growth of both basalt and high viscosity, crystal poor, rhyolite lava flows. By using these observations to help constrain numerical models of lava flow length change over time, we show that both the 2001 Mt Etna basaltic lava flow and the 2011–2012 Cordón Caulle rhyolite lava flow were initially controlled by their apparent Newtonian viscosities and then by their surface crusts. In the case of the rhyolite, this change in control occurred only after several months and our results underscore that relatively straightforward lava advance models, based on bulk rheological properties, can be effective across a large compositional range of lava flows. The emplacement of high silica flows is not always dominated by their internal yield strength, as previously inferred, but crystal-poor high-silica lavas, including rhyolites, may behave in a manner similar to initially viscosity controlled basalts, albeit over different temporal and spatial scales.
Author Contributions
All authors contributed to the project design and preparation of the manuscript. NM, MJ and HT conducted fieldwork at Cordón Caulle. NM and MJ conducted fieldwork at Mt Etna. NM analyzed satellite imagery and carried out the numerical modeling assisted by MJ and HT.
Funding
NM is supported by a NERC Envision studentship and a BUFI grant from the British Geological Survey. HT is supported by a Royal Society University Research Fellowship. CV publishes with the permission of the Executive Director of the British Geological Survey.
Conflict of Interest Statement
The authors declare that the research was conducted in the absence of any commercial or financial relationships that could be construed as a potential conflict of interest.
Acknowledgments
We thank C. Bignami for the provision of additional flow outlines from COSMO SkyMed data, as well as the BBC Earth team for assistance with aerial photography of the Cordón Caulle lava flow. We are also grateful to J. Castro and C.I. Schipper for assistance during fieldwork in 2013 and 2014, plus discussion of lava emplacement at Cordón Caulle.
References
Anderson, S. W., and Fink, J. H. (1992). Crease structures - indicators of emplacement rates and surface stress regimes of lava flows. Geol. Soc. Am. Bull. 104, 615–625. doi: 10.1130/0016-7606(1992)104<0615:csioer>2.3.co;2
Anderson, S. W., Fink, J. H., and Rose, W. I. (1995). Mount St Helens and Santiaguito lava domes: the effect of short-term eruption rate on surface texture and degassing processes. J. Volcanol. Geother. Res. 69, 105–116. doi: 10.1016/0377-0273(95)00022-4
Anderson, S. W., Stofan, E. R., Smrekar, S. E., Guest, J. E., and Wood, B. (1999). Pulsed inflation of pahoehoe lava flows: implications for flood basalt emplacement. Earth Planet. Sci. Lett. 168, 7–18. doi: 10.1016/s0012-821x(99)00044-8
Applegarth, L. J. (2008). Complexity in Lava Flows: Surface Features and Structural Morphology. Ph.D. Thesis, Lancaster University.
Applegarth, L. J., Pinkerton, H., James, M. R., and Calvari, S. (2010). Morphological complexities and hazards during the emplacement of channel-fed 'a'ā lava flow fields: a study of the 2001 lower flow field on Etna. Bullet. Volcanol. 72, 641–656. doi: 10.1007/s00445-010-0351-1
Behncke, B., and Neri, M. (2003). The July–August 2001 eruption of Mt. Etna (Sicily). Bullet. Volcanol. 65, 461–476. doi: 10.1007/s00445-003-0274-1
Bernstein, M., Pavez, A., Varley, N., Whelley, P., and Calder, E. S. (2013). Rhyolite lava dome growth styles at Chaiten Volcano, Chile (2008-2009): interpretation of thermal imagery. Andean Geol. 40, 295–309. doi: 10.5027/andgeoV40n2-a07
Bertin, D., Lara, L. E., Basualto, D., Amigo, Á., Cardona, C., Franco, L., et al. (2015). High effusion rates of the Cordón Caulle 2011-12 eruption (Southern Andes) and their relation with the quasi-harmonic tremor. Geophys. Res. Lett. 42, 7054–7063. doi: 10.1002/2015gl064624
Bignami, C., Corradini, S., Merucci, L., de Michele, M., Raucoules, D., De Astis, G., et al. (2014). Multisensor Satellite Monitoring of the 2011 Puyehue-Cordon Caulle Eruption. IEEE J. Select. Top. Appl. Earth Observ. Remote Sens. 7, 2786–2796. doi: 10.1109/jstars.2014.2320638
Blake, S. (1990). “Viscoplastic models of lava domes,” in Lava Flows and Domes: Emplacement Mechanisms and Hazard Implication, ed J. H. Fink (Berlin; Heidelberg: Springer), 88–126.
Blake, S., and Bruno, B. C. (2000). Modelling the emplacement of compound lava flows. Earth Planet. Sci. Lett. 184, 181–197. doi: 10.1016/s0012-821x(00)00278-8
Bridges, N. T. (1997). Ambient effects on basalt and rhyolite lavas under Venusian, subaerial, and subaqueous conditions. J. Geophys. Res. 102, 9243–9255.
Calvari, S., and Pinkerton, H. (1998). Formation of lava tubes and extensive flow field during the 1991–1993 eruption of Mount Etna. J. Geophys. Res. 103, 27291–27301.
Cashman, K., Pinkerton, H., and Stephenson, J. (1998). Introduction to special section: Long lava flows. J. Geophys. Res. Solid Earth 103, 27281–27289. doi: 10.1029/98jb01820
Castro, J., Cashman, K., Joslin, N., and Olmsted, B. (2002). Structural origin of large gas cavities in the Big Obsidian Flow, Newberry Volcano. J. Volcanol. Geother. Res. 114, 313–330. doi: 10.1016/s0377-0273(01)00296-7
Castro, J., and Cashman, K. V. (1999). Constraints on rheology of obsidian lavas based on mesoscopic folds. J. Struct. Geol. 21, 807–819. doi: 10.1016/s0191-8141(99)00070-x
Castro, J. M., Cordonnier, B., Schipper, C. I., Tuffen, H., Baumann, T. S., and Feisel, Y. (2016). Rapid laccolith intrusion driven by explosive volcanic eruption. Nat. Commun. 7:13585. doi: 10.1038/ncomms13585
Castro, J. M., Schipper, C. I., Mueller, S. P., Militzer, A. S., Amigo, A., Silva Parejas, C., et al. (2013). Storage and eruption of near-liquidus rhyolite magma at Cordon Caulle, Chile. Bullet. Volcanol. 75:702. doi: 10.1007/s00445-013-0702-9
Castruccio, A., Rust, A. C., and Sparks, R. S. J. (2010). Rheology and flow of crystal-bearing lavas: insights from analogue gravity currents. Earth Planet. Sci. Lett. 297, 471–480. doi: 10.1016/j.epsl.2010.06.051
Castruccio, A., Rust, A. C., and Sparks, R. S. J. (2013). Evolution of crust- and core-dominated lava flows using scaling analysis. Bullet. Volcanol. 75:681. doi: 10.1007/s00445-012-0681-2
Coltelli, M., Proietti, C., Branca, S., Marsella, M., Andronico, D., and Lodato, L. (2007). Analysis of the 2001 lava flow eruption of Mt. Etna from three-dimensional mapping. J. Geophys. Res. 112:F02029. doi: 10.1029/2006jf000598
Crisci, G. M., Gregorio, D., Pindaro, O., and Ranieri, G. A. (1986). Lava Flow Simulation Bv A Discrete Cellular Model: First Implementation. Int. J. Model. Simulat. 6, 137–140. doi: 10.1080/02286203.1986.11759975
DeGroat-Nelson, P. J., Cameron, B. I., Fink, J. H., and Holloway, J. R. (2001). Hydrogen isotope analysis of rehydrated silicic lavas: implications for eruption mechanisms. Earth Planet. Sci. Lett. 185, 331–341. doi: 10.1016/s0012-821x(00)00379-4
Dietterich, H. R., Poland, M. P., Schmidt, D. A., Cashman, K. V., Sherrod, D. R., and Espinosa, A. T. (2012). Tracking lava flow emplacement on the east rift zone of Kīlauea, Hawai‘i, with synthetic aperture radar coherence. Geochem. Geophys. Geosyst. 13:Q05001. doi: 10.1029/2011GC004016
Durham, W., Mirkovich, V., and Heard, H. (1987). Thermal diffusivity of igneous rocks at elevated pressure and temperature. J. Geophys. Res. 92, 11615–11634.
Eichelberger, J. C. (1995). Silicic volcanism - ascent of viscous magmas from crustal reservoirs. Annu. Rev. Earth Planet. Sci. 23, 41–63. doi: 10.1146/annurev.earth.23.1.41
Eichelberger, J. C., Carrigan, C. R., Westrich, H. R., and Price, R. H. (1986). Non-explosive silicic volcanism. Nature 323, 598–602.
Farquharson, J. I., James, M. R., and Tuffen, H. (2015). Examining rhyolite lava flow dynamics through photo-based 3D reconstructions of the 2011–2012 lava flowfield at Cordón-Caulle, Chile. J. Volcanol. Geother. Res. 304, 336–348. doi: 10.1016/j.jvolgeores.2015.09.004
Fink, J. (1980a). Surface folding and viscosity of rhyolite flows. Geology 8, 250–254. doi: 10.1130/0091-7613(1980)8<250:sfavor>2.0.co;2
Fink, J. H. (1980b). Gravity instability in the Holocene Big and Little Glass Mountain rhyolitic obsidian flows, Northern California. Tectonophysics 66, 147–166. doi: 10.1016/0040-1951(80)90043-8
Fink, J. H. (1983). Structure and emplacement of a rhyolitic obsidian flow - Little Glass Mountain, Medicine Lake Highland, northern California. Geol. Soc. Am. Bull. 94, 362–380. doi: 10.1130/0016-7606(1983)94<362:saeoar>2.0.co;2
Fink, J. H., Anderson, S. W., and Manley, C. R. (1992). Textural constraints on effusive silicic volcanism - beyond the permeable foam model. J. Geophys. Res. Solid Earth 97, 9073–9083. doi: 10.1029/92jb00416
Fink, J. H., and Griffiths, R. W. (1998). Morphology, eruption rates, and rheology of lava domes: insights from laboratory models. J. Geophys. Res. 103, 527–545. doi: 10.1029/97jb02838
Giordano, D., Russell, J. K., and Dingwell, D. B. (2008). Viscosity of magmatic liquids: a model. Earth Planet. Sci. Lett. 271, 123–134. doi: 10.1016/j.epsl.2008.03.038
Griffiths, R. W., and Fink, J. H. (1993). Effects of surface cooling on the spreading of lava flows and domes. J. Fluid Mech. 252, 667–702. doi: 10.1017/s0022112093003933
Grove, T., and Donnelly-Nolan, J. (1986). The evolution of young silicic lavas at Medicine Lake Volcano, California: implications for the origin of compositional gaps in calc-alkaline series lavas. Contrib. Mineral. Petrol. 92, 281–302.
Harris, A. J. L., and Flynn, L. P. (2002). The thermal stealth flows of Santiaguito dome, Guatemala: implications for the cooling and emplacement of dacitic block-lava flows. Geol. Soc. Am. Bull. 114, 533–546. doi: 10.1130/0016-7606(2002)114<0533:ttsfos>2.0.co;2
Harris, A. J. L., Flynn, L. P., Matias, O., Rose, W. I., and Cornejo, J. (2004). The evolution of an active silicic lava flow field: an ETM+ perspective. J. Volcanol. Geother. Res. 135, 147–168. doi: 10.1016/j.jvolgeores.2003.12.011
Hérault, A., Bilotta, G., Vicari, A., Rustico, E., and Del Negro, C. (2011). Numerical simulation of lava flow using a GPU SPH model. Anna. Geophys. 54, 600–620. doi: 10.4401/ag-5343
Hidaka, M., Goto, A., Umino, S., and Fujita, E. (2005). VTFS project: Development of the lava flow simulation code LavaSIM with a model for three-dimensional convection, spreading, and solidification. Geochem. Geophys. Geosyst. 6:Q07008. doi: 10.1029/2004GC000869
Holland, A. S. P., Watson, I. M., Phillips, J. C., Caricchi, L., and Dalton, M. P. (2011). Degassing processes during lava dome growth: Insights from Santiaguito lava dome, Guatemala. J. Volcanol. Geother. Res. 202, 153–166. doi: 10.1016/j.jvolgeores.2011.02.004
Hon, K. (2003). “The transition from 'A'ā to Pāhoehoe crust on flows emplaced during the Pu'u 'Ō'ō-Kūpaianaha eruption,” in U.S. Geological Survey Professional Paper 1676 (Washington, DC), 89–103. Available online at: http://cat.inist.fr/?aModele=afficheN&cpsidt=16272700
Hon, K., Kauahikaua, J., Denlinger, R., and Mackay, K. (1994). Emplacement and inflation of pahoehoe sheet flows - observations and measurements of active lava flows on Kilauea Volcano, Hawaii. Geol. Soc. Am. Bull. 106, 351–370. doi: 10.1130/0016-7606(1994)106<0351:eaiops>2.3.co;2
Hulme, G. (1974). The Interpretation of Lava Flow Morphology. Geophys. J. R. Astronom. Soc. 39, 361–383. doi: 10.1111/j.1365-246X.1974.tb05460.x
Huppert, H. E. (1982). Flow and instability of a viscous current down a slope. Nature 300, 427–429. doi: 10.1038/300427a0
Ingv, C. (2001). Multidisciplinary approach yields insight into Mt. Etna eruption. Eos Trans. Am. Geophys. Union 82, 653–656. doi: 10.1029/01eo00376
Jeffreys, H. (1925). The flow of water in an inclined channel of rectangular section. Philos. Magaz. Ser. 6 49, 793–807. doi: 10.1080/14786442508634662
Katsui, Y., and Katz, H. R. (1967). Lateral fissure eruptions in the southern Andes of Chile. J. Fac. Sci. Hokkaido Univ. Ser. 4 Geol. Mineral. 13, 433–448.
Kerr, R. C., and Lyman, A. W. (2007). Importance of surface crust strength during the flow of the 1988–1990 andesite lava of Lonquimay Volcano, Chile. J. Geophys. Res. Solid Earth 112:B03209. doi: 10.1029/2006jb004522
Kilburn, C. R. J. (2004). Fracturing as a quantitative indicator of lava flow dynamics. J. Volcanol. Geother. Res. 132, 209–224. doi: 10.1016/s0377-0273(03)00346-9
Kilburn, C. R. J., and Guest, J. E. (1993). “Aa lavas of Mount Etna, Sicily,” in Active Lavas: Monitoring and Modelling, eds C. R. J. Kilburn and G. Luongo (London: UCL Press), 73–101.
Lanzafame, G., Neri, M., Acocella, V., Billi, A., Funiciello, R., and Giordano, G. (2003). Structural features of the July–August 2001 Mount Etna eruption: evidence for a complex magma supply system. J. Geol. Soc. Lond. 160, 531–544. doi: 10.1144/0016-764902-151
Lara, L. E., Moreno, H., Naranjo, J. A., Matthews, S., and de Arce, C. P. (2006). Magmatic evolution of the Puyehue-Cordon Caulle volcanic complex (40 degrees S), Southern Andean Volcanic Zone: from shield to unusual rhyolitic fissure volcanism. J. Volcanol. Geother. Res. 157, 343–366. doi: 10.1016/j.jvolgeores.2006.04.010
Lara, L. E., Naranjo, J. A., and Moreno, H. (2004). Rhyodcacitic fissure eruption in Southern Andes (Cordon Caulle; 40.5 degrees S) after the 1960 (Mw: 9.5) Chilean earthquake: a structural interpretation. J. Volcanol. Geother. Res. 138, 127–138. doi: 10.1016/j.jvolgeores.2004.06.009
Lescinsky, D. T., and Merle, O. (2005). Extensional and compressional strain in lava flows and the formation of fractures in surface crust. Geol. Soc. Am. Spec. Papers 396, 163–179. doi: 10.1130/0-8137-2396-5.163
Lister, J. R. (1992). Viscous flows down an inclined plane from point and line sources. J. Fluid Mech. 242, 631–653. doi: 10.1017/s0022112092002520
Loewen, M. W., Bindeman, I. N., and Melnik, O. E. (2017). Eruption mechanisms and short duration of large rhyolitic lava flows of Yellowstone. Earth Planet. Sci. Lett. 458, 80–91. doi: 10.1016/j.epsl.2016.10.034
Lyman, A. W., and Kerr, R. C. (2006). Effect of surface solidification on the emplacement of lava flows on a slope. J. Geophys. Res 111:B05206. doi: 10.1029/2005JB004133
Lyman, A. W., Kerr, R. C., and Griffiths, R. W. (2005). Effects of internal rheology and surface cooling on the emplacement of lava flows. J. Geophys. Res. 110:B08207. doi: 10.1029/2005jb003643
Mader, H. M., Llewellin, E. W., and Mueller, S. P. (2013). The rheology of two-phase magmas: a review and analysis. J. Volcanol. Geother. Res. 257, 135–158. doi: 10.1016/j.jvolgeores.2013.02.014
Manley, C. R. (1992). Extended cooling and viscous-flow of large, hot rhyolite lavas - implications of numerical modeling results. J. Volcanol. Geother. Res. 53, 27–46. doi: 10.1016/0377-0273(92)90072-l
Manley, C. R., and Fink, J. H. (1987). Internal textures of rhyolite flows as revealed by research drilling. Geology 15, 549–552. doi: 10.1130/0091-7613(1987)15<549:itorfa>2.0.co;2
Moore, H. J., Arthur, D. W. G., and Schaber, G. G. (1978). Yield strengths of flows on the Earth, Mars, and Moon. Proc. Lunar Planet. Sci. Conf. Proceed. 3, 3351–3378.
Mueller, S., Llewellin, E. W., and Mader, H. M. (2011). The effect of particle shape on suspension viscosity and implications for magmatic flows. Geophys. Res. Lett. 38:L13316. doi: 10.1029/2011gl047167
NASA (2011a). EO-1 ALI scene EO1A2330882011230110KF_1T. Image Courtesy of U.S. Geological Survey. 18/08/2011
NASA (2011b). EO-1 ALI scene EO1A2330882011282110KF_1T. Image Courtesy of U.S. Geological Survey. 09/10/2011
NASA (2011c). EO-1 ALI scene EO1A2330882011308110KF_1T. Image Courtesy of U.S. Geological Survey. 04/11/2011
NASA (2012). EO-1 ALI scene EO1A2330882012026110KF_1T. Image Courtesy of U.S. Geological Survey. 26/01/2012
NASA (2013). EO-1 ALI scene EO1A2330882013013110PF_1T. Image Courtesy of U.S. Geological Survey. 13/01/2013
Pallister, J. S., Diefenbach, A. K., Burton, W. C., Munoz, J., Griswold, J. P., Lara, L. E., et al. (2013). The Chaiten rhyolite lava dome: eruption sequence, lava dome volumes, rapid effusion rates and source of the rhyolite magma. Andean Geol. 40, 277–294. doi: 10.5027/andgeoV40n2-a06
Pinkerton, H., and Wilson, L. (1994). Factors controlling the lengths of channel-fed lava flows. Bullet. Volcanol. 56, 108–120. doi: 10.1007/bf00304106
Pistolesi, M., Cioni, R., Bonadonna, C., Elissondo, M., Baumann, V., Bertagnini, A., et al. (2015). Complex dynamics of small-moderate volcanic events: the example of the 2011 rhyolitic Cordon Caulle eruption, Chile. Bullet. Volcanol. 77:3. doi: 10.1007/s00445-014-0898-3
Romine, W., Whittington, A., Nabelek, P., and Hofmeister, A. (2012). Thermal diffusivity of rhyolitic glasses and melts: effects of temperature, crystals and dissolved water. Bullet. Volcanol. 74, 2273–2287. doi: 10.1007/s00445-012-0661-6
Rose, W. I. (1987). Santa María, Guatemala: bimodal soda-rich calc-alkalic stratovolcano. J. Volcanol. Geother. Res. 33, 109–129. doi: 10.1016/0377-0273(87)90056-4
Saar, M. O., Manga, M., Cashman, K. V., and Fremouw, S. (2001). Numerical models of the onset of yield strength in crystal–melt suspensions. Earth Planet. Sci. Lett. 187, 367–379. doi: 10.1016/S0012-821X(01)00289-8
Schipper, C. I., Castro, J. M., Tuffen, H., James, M. R., and How, P. (2013). Shallow vent architecture during hybrid explosive-effusive activity at Cordon Caulle (Chile, 2011-12): evidence from direct observations and pyroclast textures. J. Volcanol. Geother. Res. 262, 25–37. doi: 10.1016/j.jvolgeores.2013.06.005
Schipper, C. I., Castro, J., Tuffen, H., Wadsworth, F., Chappell, D., Pantoja, A., et al. (2015). Cristobalite in the 2011–2012 Cordón Caulle eruption (Chile). Bullet. Volcanol. 77, 1–19. doi: 10.1007/s00445-015-0925-z
Silva Parejas, C., Lara, L., Bertin, D., Amigo, A., and Orozco, G. (2012). “The 2011–2012 eruption of Cordón Caulle volcano (Southern Andes): evolution, crisis management and current hazards,” in EGU General Assembly Conference Abstracts (Vienna), Vol. 14, 9382.
Sparks, R. S. J., Murphy, M. D., Lejeune, A. M., Watts, R. B., Barclay, J., and Young, S. R. (2000). Control on the emplacement of the andesite lava dome of the Soufriere Hills volcano, Montserrat by degassing-induced crystallization. Terra Nova 12, 14–20. doi: 10.1046/j.1365-3121.2000.00267.x
Stevenson, R. J., Dingwell, D. B., Bagdassarov, N. S., and Manley, C. R. (2001). Measurement and implication of “effective” viscosity for rhyolite flow emplacement. Bullet. Volcanol. 63, 227–237. doi: 10.1007/s004450100137
Swanson, S., Naney, M., Westrich, H. R., and Eichelberger, J. C. (1989). Crystallization history of Obsidian Dome, Inyo Domes, California. Bullet. Volcanol. 51, 161–176. doi: 10.1007/bf01067953
Tuffen, H., James, M. R., Castro, J. M., and Schipper, C. I. (2013). Exceptional mobility of an advancing rhyolitic obsidian flow at Cordon Caulle volcano in Chile. Nat. Commun. 4:2709. doi: 10.1038/ncomms3709
Vicari, A., Alexis, H., Del Negro, C., Coltelli, M., Marsella, M., and Proietti, C. (2007). Modeling of the 2001 lava flow at Etna volcano by a Cellular Automata approach. Environ. Model. Soft. 22, 1465–1471. doi: 10.1016/j.envsoft.2006.10.005
Vye-Brown, C., Self, S., and Barry, T. L. (2013). Architecture and emplacement of flood basalt flow fields: case studies from the Columbia River Basalt Group, NW USA. Bullet. Volcanol. 75:21. doi: 10.1007/s00445-013-0697-2
Keywords: rhyolite, lava flow emplacement, Puyehue-Cordón Caulle, basalt, numerical models, Mount Etna
Citation: Magnall N, James MR, Tuffen H and Vye-Brown C (2017) Emplacing a Cooling-Limited Rhyolite Lava Flow: Similarities with Basaltic Lava Flows. Front. Earth Sci. 5:44. doi: 10.3389/feart.2017.00044
Received: 27 February 2017; Accepted: 22 May 2017;
Published: 08 June 2017.
Edited by:
Luis E. Lara, Servicio Nacional de Geología y Minería, ChileReviewed by:
Jon J. Major, United States Geological Survey, United StatesColin J. N. Wilson, Victoria University of Wellington, New Zealand
Copyright © 2017 Magnall, James, Tuffen and Vye-Brown. This is an open-access article distributed under the terms of the Creative Commons Attribution License (CC BY). The use, distribution or reproduction in other forums is permitted, provided the original author(s) or licensor are credited and that the original publication in this journal is cited, in accordance with accepted academic practice. No use, distribution or reproduction is permitted which does not comply with these terms.
*Correspondence: Nathan Magnall, bi5tYWduYWxsQGxhbmNhc3Rlci5hYy51aw==