 Junichi Miyazaki1,2,3
 Akiko Makabe3Yohei Matsui2,3Naoya Ebina2,4Saki Tsutsumi2,4Jun-ichiro Ishibashi2,4
 Chong Chen1Sho Kaneko5
 Ken Takai1,2,3
 Shinsuke Kawagucci1,2,3,6*
- 1Department of Subsurface Geobiological Analysis and Research (D-SUGAR), Japan Agency for Marine-Earth Science and Technology, Yokosuka, Japan
- 2Research and Development Center for Submarine Resources, Japan Agency for Marine-Earth Science and Technology, Yokosuka, Japan
- 3Project Team for Development of New-generation Research Protocol for Submarine Resources, Japan Agency for Marine-Earth Science and Technology, Yokosuka, Japan
- 4Department of Earth and Planetary Sciences, Graduate School of Science, Kyushu University, Fukuoka, Japan
- 5Section 4, R&D Department, NiGK Corporation, Kawagoe, Japan
- 6Department of Earth Sciences (D-ERDW), Institute of Geochemistry and Petrology, ETH Zürich, Zürich, Switzerland
Deep-sea geofluid systems, such as hydrothermal vents and cold seeps, are key to understanding subseafloor environments of Earth. Fluid chemistry, especially, provides crucial information toward elucidating the physical, chemical, and biological processes that occur in these ecosystems. To accurately assess fluid and gas properties of deep-sea geofluids, well-designed pressure-tight fluid samplers are indispensable and as such they are important assets of deep-sea geofluid research. Here, the development of a new flow-through, pressure-tight fluid sampler capable of four independent sampling events (two subsamples for liquid and gas analyses from each) is reported. This new sampler, named WHATS-3, is a new addition to the WHATS-series samplers and a major upgrade from the previous WHATS-2 sampler with improvements in sample number, valve operational time, physical robustness, and ease of maintenance. Routine laboratory-based pressure tests proved that it is suitable for operation up to 35 MPa pressure. Successful field tests of the new sampler were also carried out in five hydrothermal fields, two in Indian Ocean, and three in Okinawa Trough (max. depth 3,300 m). Relations of Mg and major ion species demonstrated bimodal mixing trends between a hydrothermal fluid and seawater, confirming the high quality of fluids sampled. The newly developed WHATS-3 sampler is well-balanced in sampling capability, field usability, and maintenance feasibility, and can serve as one of the best geofluid samplers available at present to conduct efficient research of deep-sea geofluid systems.
Introduction
The extremely important role played by the subseafloor fluid advection system in Earth's element cycle and ecosystem development has been widely recognized (e.g., Elderfield and Schultz, 1996; German and Seyfried, 2014). The total water mass below the seafloor is estimated to constitute ~2% of the entire seawater mass (Johnson et al., 2006; Mottl et al., 2007). Subseafloor fluid advection and the associated fluid-rock interaction cause elemental flux between the lithosphere and the ocean, regulating the chemical composition of the ocean. In addition, since some of the subseafloor-derived reducing species are available for chemolithoautorophic metabolism, subseafloor fluid advection, and mixing with the overlying seawater plays an important role in supporting the unique (sub)seafloor biosphere.
Geofluids discharging from sources such as hydrothermal vents and cold seeps serve as windows for looking into this dynamic system developing below the seafloor, not directly reachable without enormous efforts through scientific drilling (e.g., Fisher et al., 2003; Yanagawa et al., 2017). Properties of discharged geofluids, particularly the fluid chemistry, can be interpreted as a representation of processes occurring within the subseafloor environment across tectonic scale (e.g., magmatism and crustal recycling; Sakai et al., 1990; Lilley et al., 2003; Mottl et al., 2004), regional hydrogeological scale (e.g., hydrothermal fluid circulation; Fisher et al., 2003; Pester et al., 2011; Kawagucci et al., 2011) and field scale (e.g., chemosynthetic ecosystem; Le Bris et al., 2006; Wankel et al., 2011). Deep-diving operations utilizing submersibles and Remotely Operated Vehicles (ROVs) allow direct investigation of the geofluids by accessing the deep seafloor. In addition to in situ chemical analyses, shown to be beneficial especially for obtaining high-resolution spatial distributions of chemically and biologically unstable compounds in the seawater column (Le Bris et al., 2000; Okamura et al., 2001, 2015; Wankel et al., 2010), fluid sampling followed by on-board/on-shore chemical analyses has been and remains an important asset for revealing compositional and isotopic characteristics of the fluid in its entirety.
Obtaining high-quality fluid sample is, however, difficult—a key hindrance in fluid chemistry research. The collection of vent fluids must be completed without mixing with the surrounding seawater, and the preservation of chemical species must be ensured during recovery of the sampler onto the research vessel. The latter is a substantial issue as a few hours generally pass between collection and recovery; both pressure and temperature condition of the laboratory is also usually quite different from that of the sampled fluid. Limited opportunities for dive operation and limited time on the seafloor during a dive are also obstacles in studying fluid chemistry.
A number of deep-sea geofluid samplers have been developed so far to overcome these hindrances (Table 1). It is vital that the sampler actively draws the fluid concerned, because contamination from the surrounding seawater cannot be reliably avoided with passive samplers such as Niskin bottles (e.g., Connelly et al., 2012). The actively fluid drawing geofluid samplers developed so far can be further classified by the sample container style (semi-closed and flow-through) and their gas tightness (gas-tight and non-gas-tight; Table 1). A semi-closed sampler is defined as a fluid sampler where the sample container is open at only one end. Such semi-closed samplers have a drawback, the fluid pre-filled in the tubes and containers before the dive commences (seawater or pure water) is unavoidably incorporated partly into the collected geofluid. Although, this contamination can be calibrated based on analytical data with appropriate assumptions, some bias at the calibration stage is unavoidable. This issue can be overcome by using a flow-through type sampler, in which the fluid container is purged and rinsed by the in situ geofluid prior to formal sampling. One risk concerning high-temperature hydrothermal fluid is that metals and sulfide may precipitate in flow-through tubes prior to reaching the sampling container, resulting in the underestimation of their concentrations. Gas tightness of the sampler is necessary for the accurate assessment of chemical conditions concerning subseafloor fluid-rock interactions and magmatism, gas flux from solid Earth to Ocean, and potential functioning of chemosynthetic ecosystems in consuming and producing gas species such as H2 and CH4 (Von Damm and Lilley, 2004; Proskurowski et al., 2008; Nakamura and Takai, 2014).
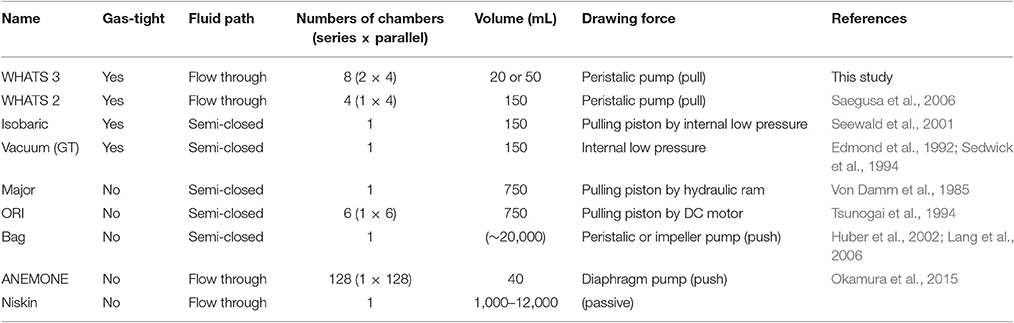
Table 1. Comparison of deep-sea geofluid samplers.
“Major” and “Bag” samplers are two widely-utilized semi-closed fluid samplers. The “Major” sampler, developed by Woods Hole Oceanographic Institution (WHOI; Von Damm et al., 1985), is essentially a titanium syringe consisting of a ~750 mL fluid chamber with an internal piston to draw the fluid from the inlet nozzle. The “Bag” sampler collects geofluids via an impeller pump (or a peristaltic pump) into a flexible-volume plastic container (~20 L), capable of quantifying elements and molecules present only in low concentration and also used to collect suspended particles including microbes and viruses (Huber et al., 2002; AEM; Lang et al., 2006; Yoshida-Takashima et al., 2012). The “ORI” sampler is another semi-closed sampler with the inlet nozzle connected to a manifold for multiple sampling events, each into a ~750 mL titanium or acrylic glass container (Tsunogai et al., 1994; Ishibashi et al., 1995). The recently developed “ANEMONE” sampler (Okamura et al., 2014) is a further flow-through type sampler with 40 mL-volume plastic tubes as fluid containers and is capable of collecting 128 samples during each dive. All the samplers mentioned above are, nevertheless, not gas-tight and therefore do not prevent dissolved gas components escaping from the collected fluid during recovery from the deep-sea, due to decreasing pressure and thus gas decompression.
The “vacuum” sampler is a simple and comparatively inexpensive sampler consisting of a stainless-steel (or titanium) container and a manually operated three-way valve (Sedwick et al., 1994; Kawagucci et al., 2013a). The sample chamber is evacuated prior to a dive (i.e., vacuum is maintained within) and draws the geofluid simply by opening the valve. The “gas-tight” (GT) sampler has a titanium cylinder body equipped with a gas-tight titanium valve actuated by hydraulic power supplied from the vehicle (Edmond et al., 1992). The “isobaric gas-tight” (IGT) sampler (Seewald et al., 2001) consists of an inlet nozzle, an electrically or hydraulically manipulated needle valve (Wu et al., 2011), and a titanium cylinder. The cylinder includes a ~150 mL sample container as well as the mechanics for maintaining the internal pressure of the collected fluid sample up to 450 bar prior to subsampling on-board. The IGT sampler is, to date, the only sampler capable of subsampling for both gas and liquid analyses from a single sample chamber. However, these gas-tight samplers described above are all semi-closed and without a flow-through system.
The WHATS-2 sampler (Saegusa et al., 2006), modified from the first-generation WHATS sampler (Tsunogai et al., 2003), is a flow-through, gas-tight fluid sampler (Table 1) capable of multiple sampling events under hydrostatic pressure up to 40 MPa. The WHATS-2 consists of four 150 mL stainless-steel containers, a motor-driven arm to manipulate the valves on the containers, a peristaltic pump, a control unit, and a flexible tube manifold connected by a titanium inlet. The mechanism of using a single electronic motor-driven arm to manipulate all eight valves reduces efforts required in both routine maintenance and operation. However, the WHATS-2 still had several shortcomings in terms of sample numbers and physical robustness of the system. As subsampling for gas analysis consumes an entire fluid container, two of the four containers are required at each sampling location in order to reveal both liquid and gas compositions of the geofluid concerned. As a result, the WHATS-2 can practically only obtain geofluid sample from two locations during one dive. Moreover, this shortcoming brings about two further unavoidable issues. One is that two temporally different fluid samples from each sampling point may not be entirely homogeneous, which is a potential source of bias in the interpretation of fluid chemistry. The other is that relatively longer sampling time is required at each fluid discharge location in order to fill two containers. In terms of physical robustness, the complicated mechanical geometry required for valve operation in the WHATS-2 is rather troublesome. As outlined above, the WHATS-2 is a superior system, but these issues still remain to be solved in order to maximize efficiency during limited deep-sea sampling opportunities.
We here report the development of a new version of the WHATS sampler, named WHATS-3 (Figure 1). The most notable improvement from WHATS-2 is the increased number of samples, by development of a system consisting of four sampling bottles with two separate chambers in each bottle. This enables collection of two gas-tight subsamples simultaneously from each sampling location, and from four different locations during one dive. In addition, there are several improvements, including (1) reduction of area required for equipment on vehicles, (2) reduction of valve operation time (from a few minutes to a few seconds), (3) improved physical robustness by modifying geometry involved in valve-manipulation, and (4) adoption of a new cylindrical outer frame to effortlessly prepare and maintain the sampler.
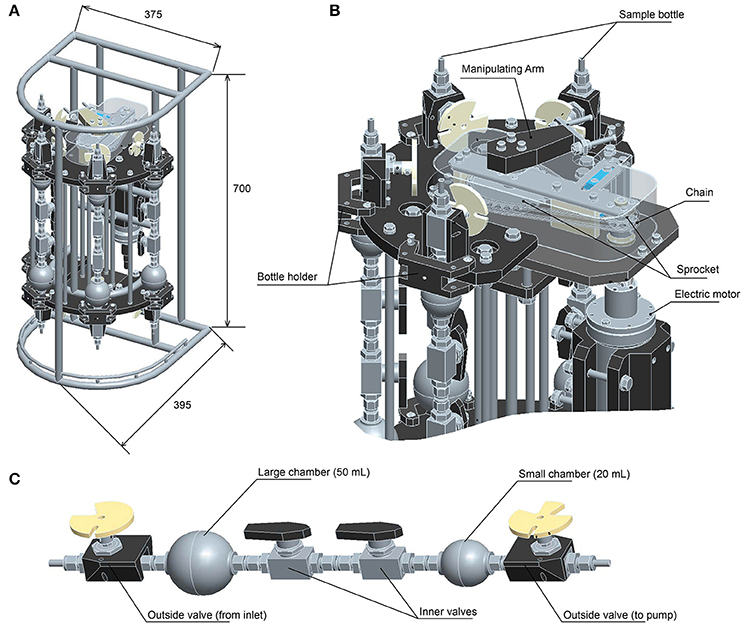
Figure 1. Illustrations of the WHATS-3. (A) Dimensions (mm). (B) Valve manipulating mechanics (upper part only). (C) Sampling bottle.
Instrument Design
Overview of the System
The WHATS-3 system consists of five components, including (1) a fluid inlet (so-called “pistol”), (2) four sets of dual-chambered sampling bottles, (3) a valve-manipulating system (Figure 1B), (4) an impeller pump unit, and (5) an electric control unit to operate the valve-manipulating digits and the impeller pump. The main body (including the sampling bottles and the manipulating system) is a titanium frame, semi-cylindrical in shape, with a dimension (H × W × D) of 700 × 375 × 395 (mm) (Figure 1A). A rectangular face 700 × 375 (mm) in size is required for tight attachment onto submersible vehicles; WHATS-2 had a larger attachment face of 595 × 560 (mm) (Saegusa et al., 2006). So far, the WHATS-3 has been attached on the payload space behind the right manipulator of the ROV Hyper-Dolphin, the rear payload space of ROV Kaiko (vehicle Mk-IV), and between the two manipulators of the Human Occupied Vehicle (HOV) Shinkai 6500 (Figure 2). Unlike most other fluid samplers including the WHATS-2, the pistol, the impeller pump unit, and the control unit are isolated from the main body. This is beneficial as it reduces the space required in the main payload space, usually in the front of submersible vehicles.
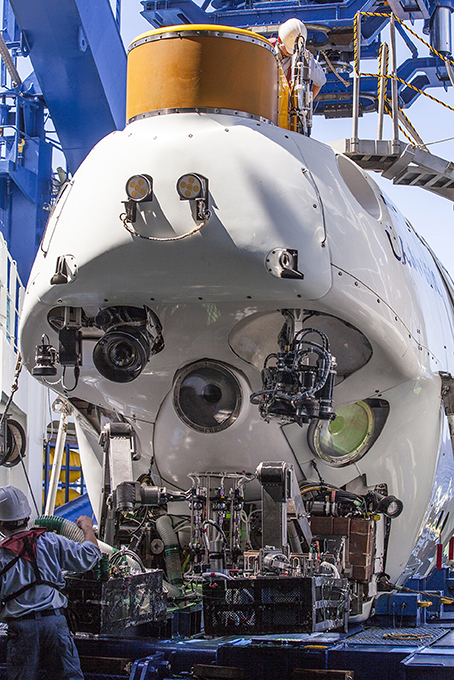
Figure 2. Photograph showing the WHATS-3 being installed directly below the center window of the HOV Shinkai 6500.
The pistol consists of a T-shaped titanium tube (O.D. 10 mm, I.D. 9 mm) and a thermometer (Pt 100Ω) blanketed with a steel shell. The thermometer, inserted from right side of the T tube through to the fluid inlet on the left and sealed with double silicon O-rings at the insertion end, is responsible for real-time monitoring of the fluid temperature during sampling, with a precision of ±1°C. Incoming fluid from the inlet on the left side flows to bottom end of the T tube, completely flushing any possible residues at the right side. For sampling of diffusive fluids, a funnel (>300 mL) is mounted on the inlet end as a reservoir of the geofluid to avoid mixing and contamination by ambient seawater. The impeller pump unit contains, in addition to the pump, an electronic motor contained within a pressure-resistance chamber sealed against a maximum pressure of 40 MPa. The pumping speed can be adjusted at three steps: ~400, ~200, and ~100 mL/min. In general, a slower pumping speed better avoids contamination of ambient seawater.
Fluid flow pathways of the pistol, the sampling bottles, and the impeller pump unit are connected in this order using polypropylene tubes (PP-PS-M, AS ONE, Osaka, Japan) and T-shaped connections (PP-PT-M, AS ONE, Osaka, Japan). These can also be made with Teflon, if necessary. The length of the plastic tube depends on attachment locations of each component, but is typically ~5 m. The inner volume of a 5 m-long tube is ~100 mL. The impeller pump unit is located at the most downstream part of the fluid pathway in order to avoid contamination from potential exfoliation of the tube in the pump.
Sampling Bottle
Each sampling bottle consists of two ball valves (SS-4SKPS4, Swagelok, Ohio, US) mounted on the two ends of the bottle, two spherical fluid chambers, and two ball valves (SS-4SKPS4) located between the chambers in a series (see Figure 1C). The SS-4SKPS4 valve has a gas-tight capacity for pressure difference up to 41.3 MPa (guaranteed by Swagelok), the same valve has been used without problem in the former WHATS-series samplers. The bottle is of a stainless-steel construct, the surface is treated with a SilicoNert coating (Silcotek Corporation, Bellefonte, Pennsylvania, USA) to avoid corrosion and metal contamination (particularly Fe, Cr, and Ni). Blank of H2 from the stainless-steel bottle has been examined and confirmed to be as low as 0.03 μM (Kawagucci et al., 2010). As in the WHATS-2, specific gingko-leaf-shaped discs are mounted as handles of the outside valves (see Saegusa et al., 2006 for a detailed description; Figure 1C). The two spherical fluid chambers differ in volumes (20 and 50 mL) but they may be attached in either order. When sampling, the two fluid chambers are connected and function as a single fluid container. When the WHATS-3 is recovered on-board, the two chambers are manually isolated using inner valves. This dual-chamber system allows separation of a single fluid sample into two discrete subsamples, each to be used for chemical analyses of gas or liquid.
Construction of Electric Motor-Driven Valve Manipulation
The construction of the valve manipulation system is newly designed for rapid and smooth operation, as well as increasing the robustness of the system (Figure 1B). As a common feature of the WHATS-series samplers, the handles mounted outside ball valves of the sampling bottles are operated by valve-manipulating digits. Specifically, the digits move horizontally at a right angle against the valves, rotating the valve handles for opening and/or closing them (see Saegusa et al., 2006 for detailed description). In the WHATS-2, the four sampling bottles were aligned on a plane, and the narrow and elongate valve manipulating arm (with one and two digits on each end) was mounted on a small block moving linearly by means of a rotating screw pole powered by an electronic motor. The delicate shape of the arm was vulnerable to external forces. Indeed, it was sometimes bent due to accidents during routine maintenance on-board, resulting in errors manipulating the valves in situ. The force transformation to linear movement was time-consuming with more than 1 min being required to manipulate the valves of a bottle. In addition, the sampling bottles were attached on the main body using stainless-steel tubes that also functioned as a fluid path. These tubes were sometimes bent or broken due to the sheer weight of the bottles when they were attached or detached. To resolve these issues, the WHATS-3 adopted a new semi-circular alignment with the sampling bottles set in 60° intervals (see Figure 1B). The valve-manipulating digits are mounted directly on blocks and rotate on a fixed axis via a roller-chain powered by an electronic motor. The sampling bottles are held on the built-in ports of the main frame, independent from tubes that make up the fluid path. The sturdy construction and the simplified geometry of valve manipulation in the WHATS-3 reduce potentials of inadvertent failures during operation, and the time required for manipulating the valves of a bottle is reduced to just a few seconds.
Construction of the Electronics
A power supply of DC24V is independently required for: (1) main electric system for valve manipulation, fluid pumping, and signal communication with the submersible vehicle (Figure 3) and (2) the thermometer. Cables and connectors used are made by SEACON (El Cajon, CA, US) and/or IMPULSE (San Diego, CA, US). The operating software for the main system and the thermometer was developed for Microsoft Windows operating systems and has been confirmed to function normally and successfully on Windows XP and Windows 7. The main functions of the software are: (1) to switch pumping ON/OFF, (2) to change the speed of pumping, (3) to operate the manipulator for opening/closing of the valves, and (4) to display and record the fluid temperature.
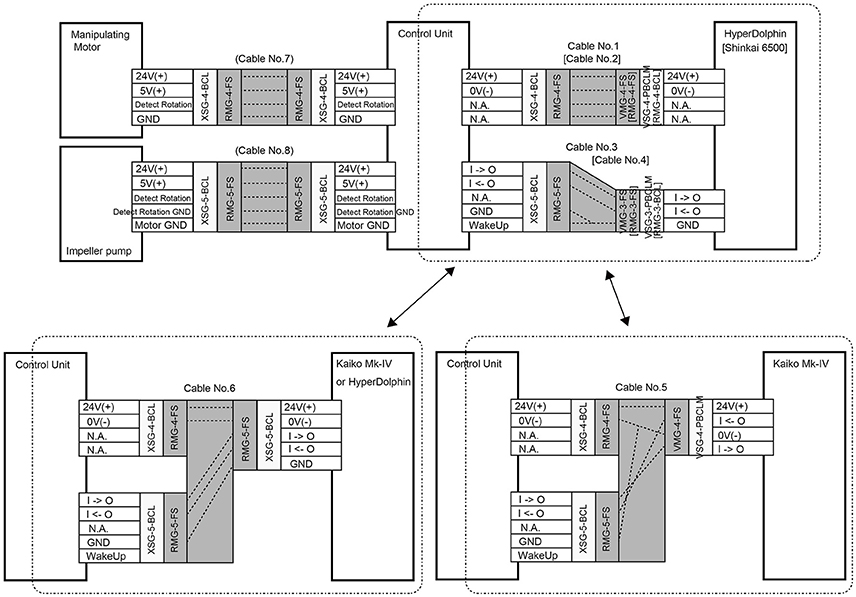
Figure 3. Construction of electronics in Japanese deep-diving vehicles.
On-Shore Tests
Pressure Resistance
The WHATS-3 system is designed to resist a pressure of 35 MPa, corresponding to 3,500 m water depth, with a safety coefficient of 1.7. It has been successfully operated under 33 MPa in deep-sea field testing. The 35 MPa resistance covers ~50% of the global seafloor, including most of Mid-Ocean Ridges, Arc, and Back Arc where hydrothermal activity is expected (German and Seyfried, 2014; Beaulieu et al., 2015; Ishibashi et al., 2015). The three sealed chambers (the pump unit, valve-manipulating motor, and electronic unit) are designed to resist an external pressure of 40 MPa while the sampling bottles withstand 30 MPa. The actual external high-pressure resistance of the whole system was examined in a laboratory pressure bath and confirmed to match the designed levels. Successful operations of the valves and manipulator were confirmed under 32 MPa external pressure in the laboratory.
For the sampling bottles, in reality, resistance against external high pressure is not important because all sampling bottles are open to ambient seawater during the descent to the seafloor (see Saegusa et al., 2006 for detailed description). Rather, resistance against internal high pressure post-sampling is more crucial for successful gas-tight fluid sampling because the pressure sealed sampling bottles, containing sampled fluids with dissolved gases, must be recovered intact from the deep-sea. The actual internal-high pressure resistance was examined by connecting a hydraulic pump (TP-500, Syn Corporation, Kyo-tanabe, Japan) and a digital pressure gage (VSMC series, VALCOM, Osaka, Japan) to the two ends of a sampling bottle. When pure water was filled at 40 MPa and stored for 22 h at room temperature, the sampling bottle did not show any visible leakage. Furthermore, when the sampling bottle was filled with pure water at 35 MPa and 2°C (mimicking the deep-sea environment), closed, and heated up to 20°C, as expected at the sea surface and during the recovery, the internal pressure increased to 38 MPa but there was again no visible leakage. These examinations demonstrate that the newly designed sampling bottle is suitable for use under deep-sea condition at a depth of 3,500 m.
Fluid Substitution
Sufficient substitution of the pre-filled fluid in the bottle (usually pure water) with the target geofluid was examined because unlike the simple rod-shaped sampling bottles in the WHATS-2, the relatively complex dual spherical chamber design of the sampling bottles in the WHATS-3 may make smooth and complete substitution difficult. In the WHATS-series samplers, the sampling bottles are positioned vertically (Figure 1) while the more dense seawater is introduced from the bottom for efficient substitution. During testing, pure water and seawater were used as the pre-filled fluid and the target fluid, respectively (Figure 4). Chloride concentrations of the fluid in the bottle were determined by ion chromatography (IC) (Dionex ICS-2100, Thermo Fisher Scientific) after 2,500 times dilution, within analytical errors of 2%. Substitution, represented by relative Cl concentration against seawater, was analyzed in relation to the amount of fluid pumping. The analyses were conducted in all three pumping speeds and both possible attachment orders of the two spherical chambers (large-small chamber and vice versa). The examination results proved that >98% substitution was achieved with 300 mL pumping under all settings of the pumping speed and both chamber attachment orders (Figure 4). Here, more than 98% substitution practically indicates complete substitution, when the 2% analytical errors is taken into consideration. In actual field usage, more than 600 mL of fluid is generally pumped to provide extra assurance of a complete substitution. The required time for pumping 600 mL was only 1.5, 3, and 6 min at high, mid, and slow speed pumping, respectively.
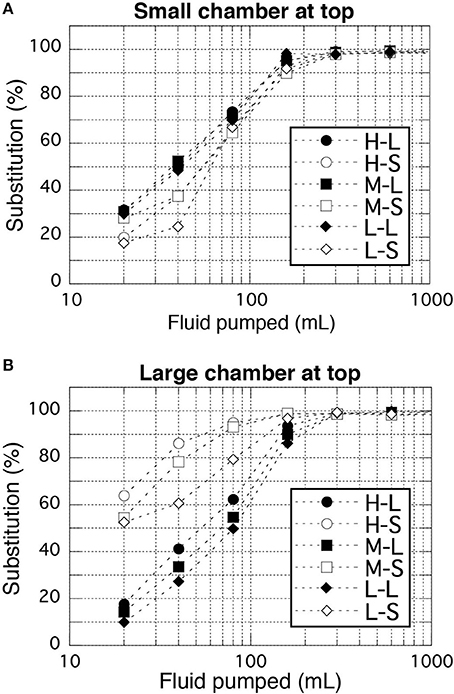
Figure 4. Results of fluid substitution examinations. (A,B) Represent the smaller chamber of a bottle at top and bottom, respectively. Two-characters labels shown in the legend represent a combination of pump speeds (High, Mid, Low) and analyzed chambers (Large and Small). Analytical errors (<2%) are comparable to the size of the symbols.
Onboard Application
Procedure for Sampling at the Seafloor
At the beginning of a cruise, the main body, the pump unit, and the control unit of the WHATS-3 are mounted on the submersible vehicle to confirm electronic power supply and communication. Just before the actual dive, the four sets of sampling bottles and plastic tubes are connected and filled by water, as any internal air bubbles may cause disastrous crushing of the bottles and tubes during descent. At the same time, tubes and connections are carefully checked for any fluid leakage. As the vehicle approaches the seafloor, the first sampling bottle is opened, and fluid pumping is started to sufficiently flush and substitute the pre-filled water in the fluid pathway with ambient seawater (Figure 5A). In the case of high-temperature hydrothermal fluid sampling, fluid temperature monitored in real-time gives an indication of the relative position of the pistol inlet with regards to fluid effluent. Fluid collection is undertaken at the highest possible temperature in order to collect as close to pure geofluid as possible. After successfully collecting geofluids into the last (fourth) sampling bottle, all external valves are closed to avoid fluid leakage from sampling bottles. When the vehicle is recovered on-board, all sample bottles are detached from the main body, and then all the internal valves are closed manually to separate the two chambers of a bottle (Figure 5B). The bottles are stored in a refrigerator prior to subsequent subsampling, as heating of the bottles increase the internal pressure and therefore risks leakage and explosion. After subsampling (see below), each of the fluid-path tubes (usually remains on the vehicle) and sampling bottles are sufficiently flushed with tap water to remove any remaining fluids and particles, and then rinsed with pure water prior to the subsequent dive.
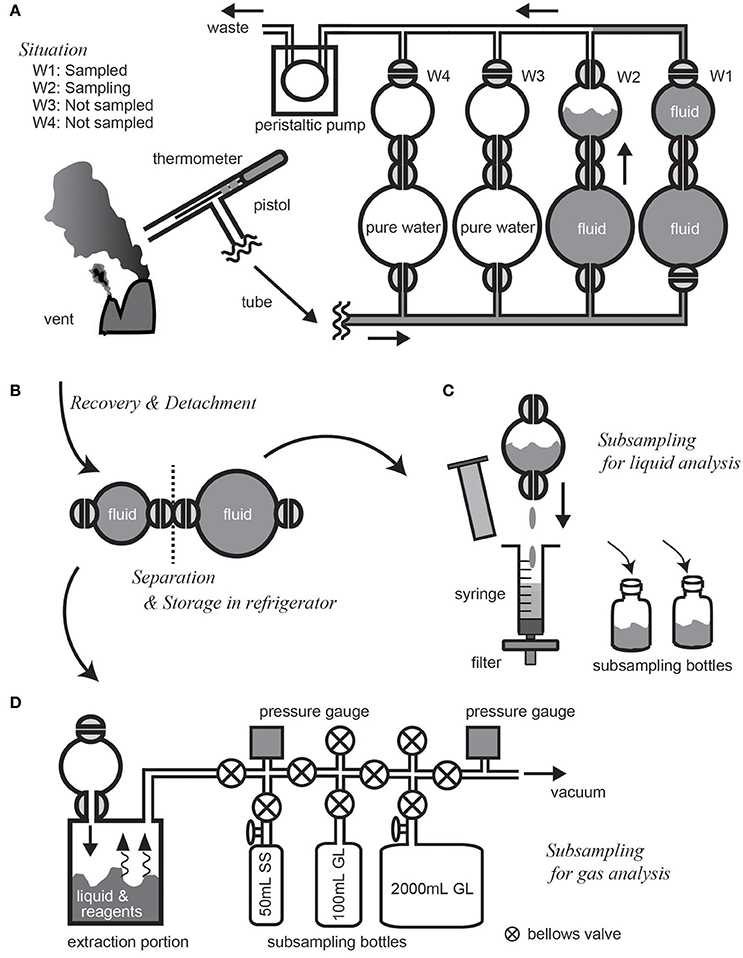
Figure 5. Illustrated walk-through of deep-sea geofluid sampling and on-board subsampling procedures using the WHATS-3. (A) Presents the situation within the second bottle at the time of geofluid sampling. (B) Shows bottle separation procedure for storage in refrigerator after sample recovery on board. (C,D) indicate methods of subsampling for liquid and gas analyses, respectively.
The two chambers in a sampling bottle serves as subsamples for liquid and gas analyses. Subsampling procedure for the WHATS-3 is the same as the WHATS-2, as presented elsewhere (e.g., Kawagucci et al., 2016). Although the current sampling chamber volumes of 20 and 50 mL in the WHATS-3 is less than the previous versions of WHATS (150 mL), these are already sufficient for subsequent analyses, described as follows.
For liquid subsampling (Figure 5C), a ~5 mL aliquot of the fluid sample is used without filtration for on-board analyses of pH, alkalinity, H2S, and NH3 concentration. The remaining fluid in the bottle (either 15 or 45 mL) is filtered through a 0.2 μm pore sized filter and used for major cation and anion analyses with Inductively Coupled Plasma Atomic Emission Spectroscopy (ICP-AES) and IC. Both ICP-AES and IC analyses generally consume ~0.1 mL of the sample because the sample is subjected to >1,000 times dilution with pure water prior to the analyses. The Cl concentration is sometimes quantified by the Mohr titration method without dilution (as it is more precise than IC) which consumes ~1 mL of the filtered subsample. For gas subsampling (Figure 5D), a chamber is connected to a vacuum line typically consisting of a glass-constructed gas extraction portion, subsampling bottles, pressure gauges, and a vacuum pump. Entire body of fluid in a chamber is introduced into the extraction portion and mixed with solid reagents, sulfamic acid (H3NSO3) and cadmium acetate [Cd(CH3COO)2, respectively, to extract inorganic carbon as CO2 and precipitate H2S as sulfide mineral. Subsampling bottles are optional, although 100 mL glass ampule, 50 mL stainless-steel bottle, and 2 L glass canister are usually used for general, He, and 14C analyses, respectively. The total gas content of a fluid sample is determined barometrically in the vacuum line. The volume of the vacuum line is adjusted to maintain an internal pressure not exceeding atmospheric pressure (0.1 MPa), because internal high pressure may cause gas leakage or explosion of the line. For example, a fluid sample collected in the larger chamber (containing 50 mL fluid) and expected to have a total gas content of 200 mM (likely for example in the hydrothermal fluids from the Okinawa Trough vents (Kawagucci, 2015)] requires a volume more than 250 mL in the vacuum line. For safety reasons, when processing the first sample from a new geofluid site where the total gas content is unknown, a 2 L glass canister is applied to the line to ensure sufficient volume is achieved. Although the small chamber of WHATS-3 is only one-tenth in volume compared to many other gas-tight samplers (Seewald et al., 2001; Saegusa et al., 2006), the amount of recovered major gases (CO2, CH4, H2, etc.) are usually sufficient to quantify their concentrations and isotope compositions using commercially available detectors via gas chromatography (e.g., Helium Ionization Detector; VICI, Houston) and continuous-flow isotope-ratio mass spectrometry (e.g., Proskurowski et al., 2006; Reeves et al., 2011).
Examples of Results from In situ Sampling at Deep-Sea Hydrothermal Fields
Pressure resistance and field operational feasibility of the WHATS-3 system were tested and confirmed at Kairei (2,450 m) and Edmond (3,300 m) hydrothermal fields in the Indian Ocean (Gamo et al., 2001; Van Dover et al., 2001). The whole system operated under a maximum external pressure of 33 MPa and experienced no operational or visible damage when inspected closely after recovery. Fluids collected from black smoker vents in each field were completely depleted in Mg (Table 2), suggesting successful samplings of “pure” hydrothermal fluids (Von Damm et al., 1985). Their fluid chemistry, including gas composition, showed good agreement with previously reported values (Kumagai et al., 2008; Kawagucci et al., 2016), despite limited sample numbers.
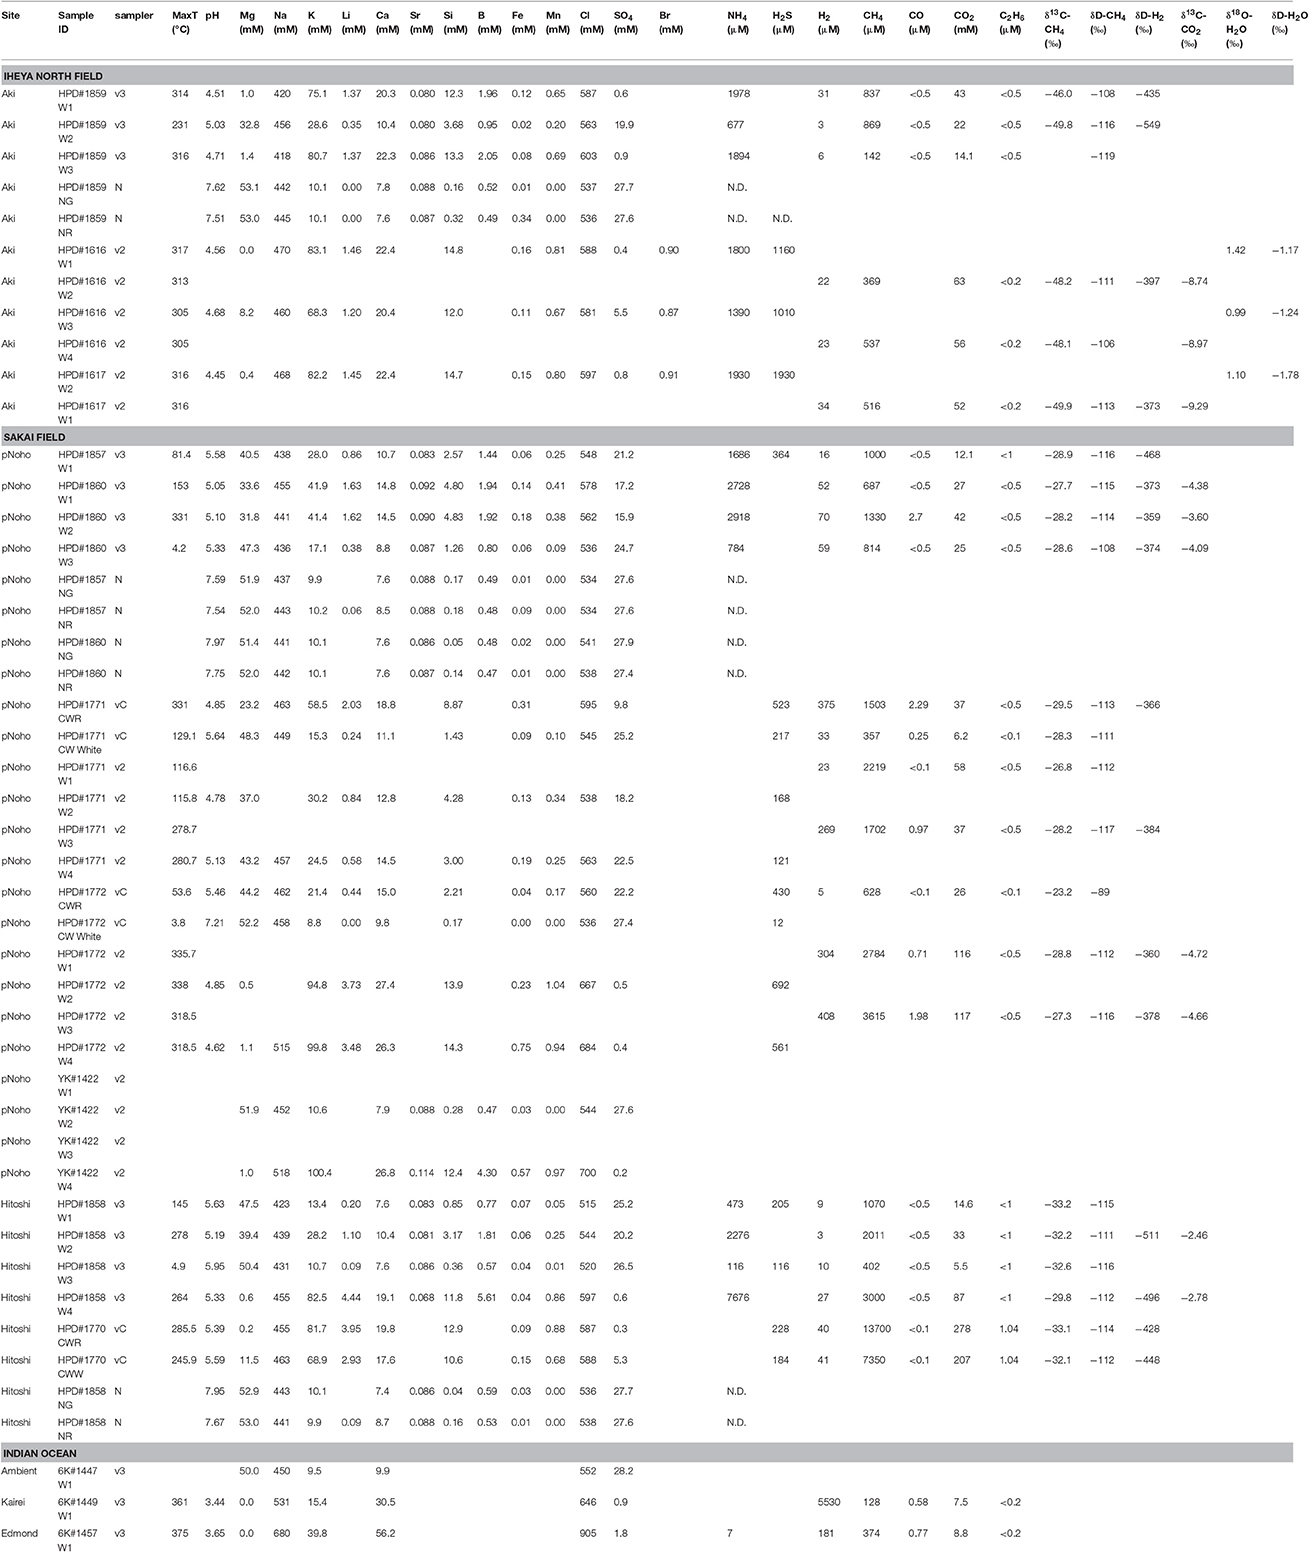
Table 2. All the analyses of hydrothermal fluids collected by WHATS-3 (v3) in addition to those by WHATS-2 (v2), Cheap-WHATS (vC), and Niskin samplers for comparison.
Furthermore, the WHTAS-3 was applied together with previous versions of the WHATS-series samplers [WHATS-2 and Cheap-WHATS (Kawagucci et al., 2016)], to determine the fluid chemistry of three recently discovered deep-sea hydrothermal sites in the mid-Okinawa Trough. These include Aki site in the Iheya North field (Kasaya et al., 2015) and Hitoshi and pseudo-Noho (pNoho) sites in the Sakai field (Nakamura et al., 2015).
The “Mg diagram” (Von Damm et al., 1985) for major ion species in each site demonstrated bimodal mixing trends between a hydrothermal fluid and seawater, regardless of the samplers used (Table 2). Gas concentrations show scattering on the Mg diagram, similar to observations from other Okinawa Trough hydrothermal sites reported in previous studies (Konno et al., 2006; Kawagucci et al., 2013a; Toki et al., 2016). This is because the Mg concentration is
an indicator for bimodal mixing between high-temperature fluid and seawater, but subcritical phase separation of CO2-enriched fluids results in the formation of bubbles and CO2 droplets (Sakai et al., 1990; Konno et al., 2006), serving as a third endmember in the samples collected. Erroneously high and variable gas concentrations, even in high-Mg samples, point to the incorporation of bubbles together with vent fluid and seawater because ambient seawater contains only ~2 mM of CO2 and negligible amounts of CH4 and H2 (see Discussion in Kawagucci et al., 2013a). Iron concentrations also show scattering on the Mg diagram. Similarly high Fe level in samples from both WHATS samplers and Niskin bottles indicate possible Fe contamination occurring during on-board or on-shore sample processing, although the stainless steel used in the WHATS-3 and the deep-diving vehicles cannot be entirely excluded as potential sources of contamination.
The estimated endmember fluid composition of the Aki site is generally identical to those of the Original and Natsu sites, the other two sites located within the Iheya North field (Table 3). The identical major fluid chemistry implies that the three sites are connected through a subseafloor fluid reservoir, despite the three sites being separated at ~1 km horizontal intervals in the North-South direction. This possible connection among the three sites will be examined by future seafloor drilling operations; previous drilling operations around the Original site has already revealed a subseafloor high-temperature fluid reservoir extending ~500 m in the East-West direction (Takai et al., 2012; Kawagucci et al., 2013b). On the other hand, CH4 concentrations and carbon isotope ratios are notably different among the three sites. This can be explained by a higher contribution of 13C-depleted biogenic CH4 incorporation into the venting fluid at the Original site.
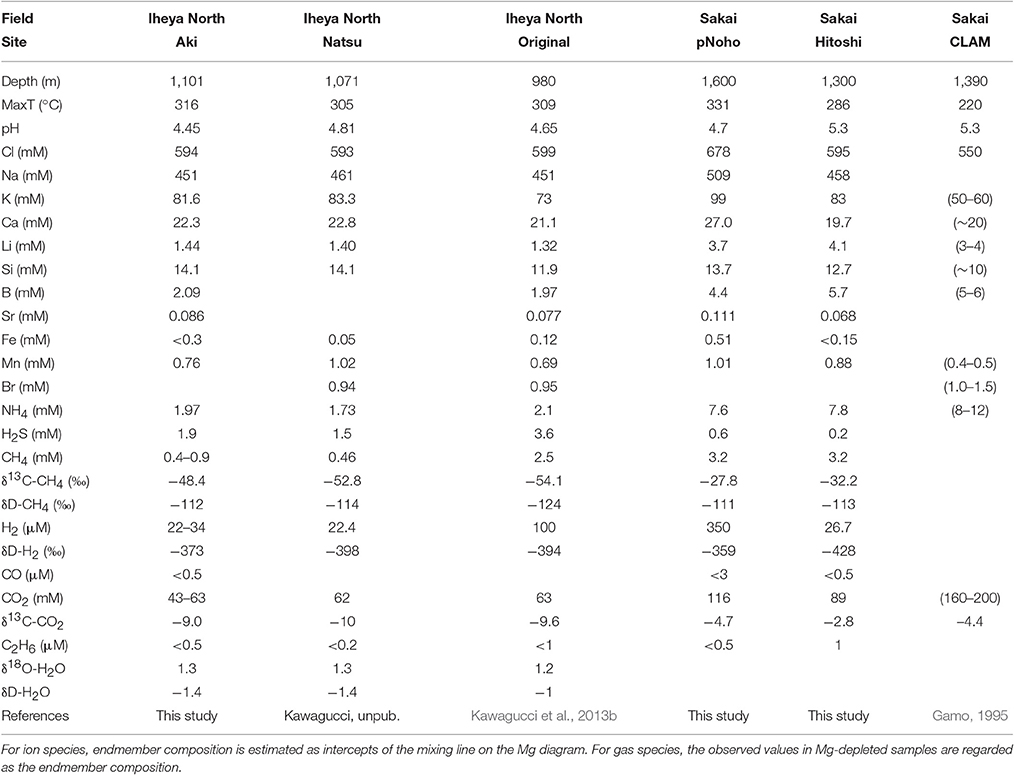
Table 3. Endmember fluid chemistry of Iheya North and Sakai fields.
The fluid chemistry of the pNoho and Hitoshi sites are distinct from each other (Table 3). The uniformly higher major ion concentrations in the pNoho site, compared to Hitoshi and CLAM sites also in the Sakai field (Gamo, 1995), are likely caused by the greater extent of vapor-lost phase formed through subseafloor fluid boiling. Such intra-field variation of fluid chemistry has also been confirmed in the Izena Hole and Daiyon-Yonaguni fields, Okinawa Trough (Suzuki et al., 2008; Ishibashi et al., 2014) and is considered to be a result of preferable emanation of the more mobile vapor-rich phase. Both maximum fluid temperature and endmember Cl concentration were highest at the pNoho site, suggesting that this is the center of activity in the Sakai field. Possible subseafloor connections among the three sites within the Sakai field will also be examined by a future drilling project.
Author Contributions
JM, SKan, and KT designed and constructed the WHATS-3 system. Testing and evaluation of functionality were carried out by JM, AM, NE, ST, JI, CC, and KT. Fluid chemistry was analyzed by AM, YM, NE, ST, JI, and SKaw. The manuscript was drafted by JM, CC, SKan, KT, and SKaw. All authors gave final approval for submission and publication.
Funding
This study was supported by Council for Science, Technology, and Innovation (CSTI) as the Cross Ministerial Strategic Innovation Promotion Program (SIP), Next-generation Technology for Ocean Resource Exploration. SKaw was also supported by a Ministry of Education, Culture, Sports, Science, and Technology (MEXT) Grant-in-Aid for Challenging Exploratory Research (15K12222).
Conflict of Interest Statement
The authors declare that the research was conducted in the absence of any commercial or financial relationships that could be construed as a potential conflict of interest.
Acknowledgments
The authors thank the operation teams of the HOV Shinkai6500, ROV Hyper-Dolphin, and ROV Kaiko, as well as the Captains and crews of the R/Vs Yokosuka, Natsushima, Kaiyo, and Kairei for their skillful support during the relevant cruises (YK16-E02, NT15-02, NT15-13, KY14-01, KR15-16). SKaw thanks Prof. Gretchen Bernasconi-Green for providing space and opportunity to draft the manuscript as an academic visitor of ETH Zurich.
References
Beaulieu, S. E., Baker, E. T., and German, C. R. (2015). Where are the undiscovered hydrothermal vents on oceanic spreading ridges? Deep Sea Res. 121, 202–212. doi: 10.1016/j.dsr2.2015.05.001
Connelly, D. P., Copley, J. T., Murton, B. J., Stansfield, K., Tyler, P. A., German, C. R., et al. (2012). Hydrothermal vent fields and chemosynthetic biota on the world's deepest seafloor spreading centre. Nat. Commun. 3, 620. doi: 10.1038/ncomms1636
Edmond, J. M., Massoth, G., and Lilley, M. (1992). Submersible-deployed samplers for axial vent waters. RIDGE Events 3, 23–24.
Elderfield, H., and Schultz, A. (1996). Mid-Ocean ridge hydrothermal fluxes and the chemical composition of the ocean. Annu. Rev. Earth Planet. Sci. 24, 191–224. doi: 10.1146/annurev.earth.24.1.191Fisher
Fisher, A. T., Davis, E. E., Hutnak, M., Spiess, V., Zühlsdorff, L., Cherkaoui, A., et al. (2003). Hydrothermal recharge and discharge across 50 km guided by seamounts on a young ridge flank. Nature 421, 618–621. doi: 10.1038/nature01352
Gamo, T. (1995). “Wide variation of chemical characteristics of submarine hydrothermal fluids due to secondary modification processes after high temperature water-rock interaction: a review,” in Biogeochemical Processes and Ocean Flux in the Western Pacific, eds H. Sakai and Y. Nozaki (Tokyo: TERRAPUB), 425–451.
Gamo, T., Chiba, H., Yamanaka, T., Okudaira, T., Hashimoto, J., Tsuchida, S., et al. (2001). Chemical characteristics of newly discovered black smoker fluids and associated hydrothermal plumes at teh Rodriguez Triple Junction, Central Indian Ridge. Earth Planet. Sci. Lett. 193, 371–379. doi: 10.1016/S0012-821X(01)00511-8
German, C. R., and Seyfried, W. E. Jr. (2014). “8.7 - hydrothermal processes,” in Treatise on Geochemistry, 2nd Edn, eds H. D. Holland and K. K. Turekian (Oxford: Elsevier), 191–233.
Huber, J. A., Butterfield, D. A., and Baross, J. A. (2002). Temporal changes in archaeal diversity and chemistry in a Mid-Ocean Ridge subseafloor habitat. Appl. Environ. Microbiol. 68, 1585–1594. doi: 10.1128/AEM.68.4.1585-1594.2002
Ishibashi, J., Sano, Y., Wakita, H., Gamo, T., Tsutsumi, M., and Sakai, H. (1995). Helium and carbon geochemistry of hydrothermal fluids from the mid-Okinawa Trough back arc basin, southwest of Japan. Chem. Geol. 123, 1–15. doi: 10.1016/0009-2541(95)00051-M
Ishibashi, J., Noguchi, T., Toki, T., Miyabe, S., Yamagami, S., Onishi, Y., et al. (2014). Diversity of fluid geochemistry affected by processes during fluid upwelling in active hydrothermal fields in the Izena Hole, the middle Okinawa Trough back-arc basin. Geochem. J. 48, 357–369. doi: 10.2343/geochemj.2.0311
Ishibashi, J., Ikegami, F., Tsuji, T., and Urabe, T. (2015). “Hydrothermal activity in the Okinawa Trough back-arc basin: geological background and hydrothermal mineralization,” in Subseafloor Biosphere Linked To Hydrothermal Systems: TAIGA Concept, eds J. Ishibashi, K. Okino and M. Sunamura (Japan: Springer), 337–359.
Johnson, H. P., Baross, J. A., and Bjorklund, T. A. (2006). On sampling the upper crustal reservoir of the NE Pacific Ocean. Geofluids 6, 251–271. doi: 10.1111/j.1468-8123.2006.00151.x
Kasaya, T., Machiyama, H., Kitada, K., and Nakamura, K. (2015). Trial exploration for hydrothermal activity using acoustic measurements at the North Iheya Knoll. Geochem. J. 49, 597–602. doi: 10.2343/geochemj.2.0389
Kawagucci, S. (2015). “Fluid geochemistry of high-temperature hydrothermal fields in the Okinawa Trough,” in Subseafloor Biosphere Linked to Hydrothermal Systems: TAIGA Concept, eds J. Ishibashi, K. Okino, and M. Sunamura (Japan: Springer), 337–359.
Kawagucci, S., Toki, T., Ishibashi, J.-I., Takai, K., Ito, M., Oomori, T., et al. (2010). Isotopic variation of molecular hydrogen in 20°–375°C hydrothermal fluids as detected by a new analytical method. J. Geophys. Res. 115, G03021. doi: 10.1029/2009JG001203
Kawagucci, S., Chiba, H., Ishibashi, J., Yamanaka, T., Toki, T., Muramatsu, Y., et al. (2011). Hydrothermal fluid geochemistry at the Iheya North field in the mid-Okinawa Trough: implication for origin of methane in subseafloor fluid circulation systems. Geochem. J. 45, 109–124. doi: 10.2343/geochemj.1.0105
Kawagucci, S., Ueno, Y., Takai, K., Toki, T., Ito, M., Inoue, K., Makabe, A., et al. (2013a). Geochemical origin of hydrothermal fluid methane in sediment-associated fields and its relevance to the geographical distribution of whole hydrothermal circulation. Chem. Geol. 339, 213–225. doi: 10.1016/j.chemgeo.2012.05.003
Kawagucci, S., Miyazaki, J., Nakajima, R., Nozaki, T., Takaya, Y., Kato, Y., et al. (2013b). Post-drilling changes in fluid discharge pattern, mineral deposition, and fluid chemistry in teh Iheya North hydrothermal field, Okinawa Trough, Geochem. Geophys. Geosyst. 14, 4774–4790. doi: 10.1002/2013GC004895
Kawagucci, S., Miyazaki, J., Noguchi, T., Okamura, K., Shibuya, T., Watsuji, T., et al. (2016). Fluid chemistry in the Solitaire and Dodo hydrothermal fields of the Central Indian Ridge. Geofluids 5, 988–1005. doi: 10.1111/gfl.12201
Konno, U., Tsunogai, U., Nakagawa, F., Nakaseama, M., Ishibashi, J.-I., Nunoura, T., et al. (2006). Liquid CO2 venting on the seafloor: Yonaguni Knoll IV hydrothermal system, Okinawa Trough. Geophys. Res. Lett. 33, L16607. doi: 10.1029/2006GL026115
Kumagai, H., Nakamura, N., Toki, T., Morishita, T., Okino, K., Ishibashi, J., et al. (2008). Geological background of the Kairei and Edmond hydrothermal fields along the Central Indian Ridge: implications of their vent fluids' distinct chemistry. Geofluids 8, 239–251. doi: 10.1111/j.1468-8123.2008.00223.x
Lang, S. Q., Butterfield, D. A., Lilley, M. D., Johnson, H. P., and Hedges, J. I. (2006). Dissolved organic carbon in ridge-axis and ridge-flank hydrothermal systems. Geochim. Cosmochim. Acta 70, 3830–3842. doi: 10.1016/j.gca.2006.04.031
Le Bris, N., Sarradin, P. M., Birot, D., and Alayse-Danet, A. M. (2000). A new chemical analyzer for in situ measurement of nitrate and total sulfide over hydrothermal vent biological communities. Mar. Chem. 72, 1–15. doi: 10.1016/S0304-4203(00)00057-8
Le Bris, N., Govenar, B., Le Gall, C., and Fisher, C. R. (2006). Variability of physico-chemical conditions in 9°50′N EPR diffuse flow vent habitats. Mar. Chem. 98, 167–182. doi: 10.1016/j.marchem.2005.08.008
Lilley, M. D., Butterfield, D. A., Lupton, J. E., and Olson, E. J. (2003). Magmatic events can produce rapid changes in hydrothermal vent chemistry. Nature 422, 878–881. doi: 10.1038/nature01569
Mottl, M. J., Wheat, C. G., Fryer, P., Gharib, J., and Martin, J. B. (2004). Chemistry of springs across the Mariana forearc shows progressive devolatilization of the subducting plate. Geochim. Cosmochim. Acta 68, 4915–4933. doi: 10.1016/j.gca.2004.05.037
Mottl, M. J., Glazer, B. T., Kaiser, R. I., and Meech, K. J. (2007). Water and astrobiology. Chem. Erde 67, 253–282. doi: 10.1016/j.chemer.2007.09.002
Nakamura, K., and Takai, K. (2014). Theoretical constraints of physical and chemical properties of hydrothermal fluids on variations in chemolithotrophic microbial communities in seafloor hydrothermal systems. Prog. Earth Planet. Sci. 1:5. doi: 10.1186/2197-4284-1-5
Nakamura, K., Kawagucci, S., Kitada, K., Kumagai, H., Takai, K., and Okino, K. (2015). Water column imaging with multibeam echo-sounding in the mid-Okinawa Trough: Implications for distribution of deep-sea hydrothermal vent sites and the cause of acoustic water column anomaly. Geochem. J. 49, 579–596. doi: 10.2343/geochemj.2.0387
Okamura, K., Kimoto, H., Saeki, K., Ishibashi, J., Obata, H., and Maruo, M. (2001). Development of a deep-sea in situ Mn analyzer and its application for hydrothermal plume observation. Mar. Chem. 76, 17–26. doi: 10.1016/S0304-4203(01)00043-3
Okamura, K., Noguchi, T., Hatta, M., Sunamura, M., Suzue, T., and Kimoto, H. (2014). Development of a 128-channel multi-water-sampling system for underwater platforms and its application to chemical and biological monitoring. Methods Oceanogr. 8, 75–90. doi: 10.1016/j.mio.2014.02.001
Okamura, K., Sugiyama, T., Noguchi, T., Fukuba, T., and Okino, K. (2015). Development of a deep-sea hydrogen sulfide ion sensor and its application for submarine hydrothermal plume exploration. Geochem. J. 49, 603–611. doi: 10.2343/geochemj.2.0391
Pester, N. J., Rough, M., Ding, K., and Seyfried, W. E. Jr. (2011). A new Fe/Mn geothermometer for hydrothermal systems: implications for high-salinity fluids at 13°N on the East Pacific Rise. Geochim. Cosmochim. Acta 75, 7881–7892. doi: 10.1016/j.gca.2011.08.043
Proskurowski, G., Lilley, M. D., Kelley, D. S., and Olson, E. J. (2006). Low temperature volatile production at the Lost City Hydrothermal Field, evidence from a hydrogen stable isotope geothermometer. Chem. Geol. 229, 331–343. doi: 10.1016/j.chemgeo.2005.11.005
Proskurowski, G., Lilley, M. D., Seewald, J. S., Früh-Green, G. L., Olson, E. J., Lupton, J. E., et al. (2008). Abiogenic hydrocarbon production at Lost City hydrothermal field. Science 319, 604–607. doi: 10.1126/science.1151194
Reeves, E. P., Seewald, J. S., Saccocia, P., Bach, W., Craddock, P. R., Shanks, W. C., et al. (2011). Geochemistry of hydrothermal fluids from the PACMANUS, Northeast Pual and Vienna Woods hydrothermal fields, Manus Basin, Papua New Guinea. Geochim. Cosmochim. Acta 75, 1088–1123. doi: 10.1016/j.gca.2010.11.008
Saegusa, S., Tsunogai, U., Nakagawa, F., and Kaneko, S. (2006). Development of a multibottle gas-tight fluid sampler WHATS II for Japanese submersibles/ROVs. Geofluids 6, 234–240. doi: 10.1111/j.1468-8123.2006.00143.x
Sakai, H., Gamo, T., Kim, E. S., Tsutsumi, M., Tanaka, T., and Ishibashi, J. (1990). Venting of carbon dioxide-rich fluid and hydrate formation in mid-Okinawa Trough backarc basin. Science248, 1093–1096. doi: 10.1126/science.248.4959.1093
Sedwick, P. N., McMurtry, G. M., Hilton, D. R., and Goff, F. (1994). Carbon dioxide and helium in hydrothermal fluids from Loihi Seamount, Hawaii, USA: temporal variability and implications for the release of mantle volatiles. Geochim. Cosmochim. Acta 58, 1219–1227. doi: 10.1016/0016-7037(94)90587-8
Seewald, J. S., Doherty, K. W., Hammar, T. R., and Liberatore, S. P. (2001). A new gas-tight isobaric sampler for hydrothermal fluids. Deep Sea Res. 49, 189–196. doi: 10.1016/S0967-0637(01)00046-2
Suzuki, R., Ishibashi, J. I., Nakaseama, M., Konno, U., Tsunogai, U., Gena, K., et al. (2008). Diverse range of mineralization induced by phase separation of hydrothermal fluid: Case study of the Yonaguni Knoll IV hydrothermal field in the Okinawa Trough back-arc basin. Resour. Geol. 58, 267–288. doi: 10.1111/j.1751-3928.2008.00061.x
Takai, K., Mottl, M. J., Nielsen, S. H. H., and I. O. D. P. Expedition, 331 scientists. (2012). IODP Expedition 331: Strong and expansive subseafloor hydrothermal activities in the Okinawa Trough. Sci. Drill. 13, 19–27. doi: 10.5194/sd-13-19-2012
Toki, T., Itoh, M., Iwata, S., Ohshima, S., Shinjo, R., Ishibashi, J., et al. (2016). Geochemical characteristics of hydrothermal fluids at Hatoma Knoll in the southern Okinawa Trough. Geochem. J. 50, 493–525. doi: 10.2343/geochemj.2.0449
Tsunogai, U., Ishibashi, J., Wakita, H., Gamo, T., Watanabe, K., Kajimura, T., et al. (1994). Peculiar features of Suiyo Seamount hydrothermal fluids, Izu-Bonin Arc: differences from subaerial volcanism. Earth Planet. Sci. Lett. 126, 289– 301. doi: 10.1016/0012-821X(94)90113-9
Tsunogai, U., Toki, T., Nakayama, N., Gamo, T., Kato, H., and Kaneko, S. (2003). WHATS: a new multi-bottle gas-tight sampler for seafloor vent fluids. Chikyukagaku 37, 101–109. doi: 10.14934/chikyukagaku.37.101
Van Dover, C. L., Humphris, S. E., Fornari, D., Cavanaugh, C. M., Collier, R., Goffredi, S. K., et al. (2001). Biogeography and ecological setting of Indian Ocean hydrothermal vents. Science 294, 818–823. doi: 10.1126/science.1064574
Von Damm, K. L., and Lilley, M. D. (2004). “Diffuse flow hydrothermal fluids from 9o50′N East Pacific Rise: origin, evolution and biogeochemical controls,” in The Subseafloor Biosphere at Mid-Ocean Ridges - Geophysical Monograph Series 144, eds W. S. D. Wilcock, E. F. Delong, D. S. Kelley, J. A. Baross, and S. C. Cary (Washington, DC: American Geophysical Union), 245–268.
Von Damm, K. L., Edmond, J. M., Grant, B., and Measures, C. I. (1985). Chemistry of submarine hydrothermal solutions at 21-degrees-N, East Pacific Rise. Geochim. Cosmochim. Acta 49, 2197–2220. doi: 10.1016/0016-7037(85)90222-4
Wankel, S. D., Joye, S. B., Samarkin, V. A., Shah, S. R., Friederich, G., Melas-Kyriazi, J., et al. (2010). New constraints on methane fluxes and rates of anaerobic methane oxidation in a Gulf of Mexico brine pool via in situ mass spectrometry. Deep Sea Res. II 57, 2022–2029. doi: 10.1016/j.dsr2.2010.05.009
Wankel, S. D., Germanovich, L. N., Lilley, M. D., Genc, G., DiPerna, C. J., Bradley, A. S., et al. (2011). Influence of subsurface bio- sphere on geochemical fluxes from diffuse hydrothermal fluids. Nat. Geosci. 4, 461–468. doi: 10.1038/ngeo1183
Wu, S.-J., Yang, C.-J., Pester, N. J., and Chen, Y. (2011). 2011 Index. IEEE J. Ocean Eng. 36, 462–469.
Yanagawa, K., Ijiri, A., Breuker, A., Sakai, S., Miyoshi, Y., Kawagucci, S., et al. (2017). Defining boundaries for the distribution of microbial communities beneath the sediment-buried, hydrothermally active seafloor. ISME J. 11, 529–542. doi: 10.1038/ismej.2016.119
Keywords: fluid sampler, gas-tight sampler, deep-sea research, hydrothermal fluid, fluid chemistry
Citation: Miyazaki J, Makabe A, Matsui Y, Ebina N, Tsutsumi S, Ishibashi J, Chen C, Kaneko S, Takai K and Kawagucci S (2017) WHATS-3: An Improved Flow-Through Multi-bottle Fluid Sampler for Deep-Sea Geofluid Research. Front. Earth Sci. 5:45. doi: 10.3389/feart.2017.00045
Received: 25 February 2017; Accepted: 23 May 2017;
Published: 07 June 2017.
Edited by:
Douglas Patrick Connelly, National Oceanography Centre, United KingdomReviewed by:
Peter Linke, GEOMAR Helmholtz Centre for Ocean Research Kiel (HZ), GermanyJun Sun, Tianjin University of Science and Technology, China
Jeffrey Seewald, Woods Hole Oceanographic Institution, United States
Copyright © 2017 Miyazaki, Makabe, Matsui, Ebina, Tsutsumi, Ishibashi, Chen, Kaneko, Takai and Kawagucci. This is an open-access article distributed under the terms of the Creative Commons Attribution License (CC BY). The use, distribution or reproduction in other forums is permitted, provided the original author(s) or licensor are credited and that the original publication in this journal is cited, in accordance with accepted academic practice. No use, distribution or reproduction is permitted which does not comply with these terms.
*Correspondence: Shinsuke Kawagucci, a2F3YWd1Y2NpQGphbXN0ZWMuZ28uanA=