 Amanda L. D. Bender
 Daniel H. Chitwood
 Alexander S. Bradley
- Department of Earth and Planetary Sciences, Washington University in St. Louis, St. Louis, MO, United States
Leaf wax n-alkanes are broadly used to reconstruct paleoenvironmental information. However, the utility of n-alkanes as a paleoenvironmental proxy may be modulated by the extent to which biological as well as environmental factors influence the structural and isotopic variability of leaf waxes. In paleoclimate applications, there is usually an implicit assumption that most variation of leaf wax traits through a time series can be attributed to environmental change and that biological sources of variability within plant communities are small. For example, changes in hydrology affect the δ2H of waxes via rainwater and the δ13C of leaf waxes by changing plant communities. We measured the degree of genetic control over δ13C variation in leaf waxes within closely related species with an experimental greenhouse growth study. We measured the proportion of variability in structural and isotopic leaf wax traits that is attributable to genetic variation using a set of 76 introgression lines (ILs) between two interfertile Solanum (tomato) species: S. lycopersicum cv M82 (hereafter cv M82) and S. pennellii. Leaves of S. pennellii, a wild desert tomato relative, produced significantly more iso-alkanes than cv M82, a domesticated tomato cultivar adapted to water-replete conditions. We report a methylation index to summarize the ratio of branched (iso- and anteiso-) to total alkanes. Between Solanum pennellii and cv M82, the iso-alkanes were found to be enriched in 13C by 1.2–1.4‰ over n-alkanes. The broad-sense heritability values (H2) of leaf wax traits describe the degree to which genetic variation contributes to variation of these traits. Variation of individual carbon isotopic compositions of alkanes were of low heritability (H2 = 0.13–0.19), suggesting that most variation in δ13C of leaf waxes in this study can be attributed to environmental variance. This supports the interpretation that variation in the δ13C of wax compounds recorded in sediments reflects paleoenvironmental and vegetation changes. Average chain length (ACL) values of n-alkanes were of intermediate heritability (H2 = 0.30), suggesting that ACL values are more strongly influenced by genetic cues.
Introduction
Long chain (C21–C39) n-alkanes are characteristic components of the cuticular waxes of terrestrial plants (Jetter et al., 2006). Alkanes are geologically stable, and their structures and isotopic compositions carry biological and environmental information. In a geological context, this information can be used for paleoenvironmental and paleoecological reconstructions. Structural traits in n-alkanes, such as average chain length (ACL), may relate to climatic variables such as temperature and humidity, as well as to the biology of the plants that have produced the n-alkanes (Bush and McInerney, 2013, 2015; Freeman and Pancost, 2014). Stable isotopes of carbon (δ13C) in plant materials, including waxes, may integrate information about carbon fixation pathway (Tipple and Pagani, 2010; Naafs et al., 2012) and physiological parameters such as water use efficiency (WUE) and stomatal conductance (Farquhar et al., 1989; Easlon et al., 2014), and may also be sensitive to environmental parameters such as light intensity, nutrient availability, position in the canopy, and atmospheric CO2 concentration (Schubert and Jahren, 2012; Diefendorf and Freimuth, 2017). These relationships are complex, and may be subject to change with plant adaptation (Diefendorf and Freimuth, 2017). Hydrogen ratios (δ2H) in plant wax n-alkanes are also informative, and relate to the δ2H of rainwater, as well as to a number of environmental and physiological parameters (Sachse et al., 2012).
The utility of n-alkanes in tracing environmental variability is moderated by uncertainties about the multiple sources of structural and isotopic variability. Generally, the values of parameters describing leaf waxes accumulated in sediments are assumed to have been smoothed by integration of many sources across a catchment. Nonetheless, the mechanistic controls of plant biology on variability is critical to understanding how to extract information from sedimentary leaf waxes. In this study, we address one source of such variability: the degree to which variability in leaf wax traits is a function of plant biology in addition to environmental conditions. This will address genetic and physiological factors that control structural and isotopic variability in plant wax compounds.
Previous studies have approached this problem by sampling leaf wax material from a range of species in a terrestrial environment. For example, Hou et al. (2007) showed that δ2H values co-vary with δ13C values of leaf waxes and may be related to WUE in a range of tree species sampled in a single environment near Blood Pond, Massachusetts (Hou et al., 2007). Total n-alkane abundances vary greatly among angiosperms; for example, total n-alkane abundances in different species of the same plant family (Betulaceae) range from <50 μg/g dry leaf to 1,300 μg/g dry leaf (Diefendorf et al., 2011). Carbon isotope values of n-alkanes measured from a wide range of angiosperms have been reported to vary by up to ~10‰ (Diefendorf et al., 2011), and alkanes among conifer families can vary by ~6‰ (Diefendorf et al., 2015). These examples demonstrate variability in leaf waxes among various lineages of plants.
Strong genetic determination is responsible for some of these differences. For example, differences in photosynthetic pathways impart a strong carbon isotopic discrimination in n-alkanes. Across 10 studies, n-C29 and n-C31 alkanes from C3 plants showed mean δ13C values of −34.0 and −34.3‰ with 1σ variation of 3.3 and 3.0‰, respectively, whereas the same alkanes from C4 plants have mean δ13C values of −21.4 and −21.7‰ and 1σ variations of 2.3 and 2.3‰ in C4 plants (Figure 1; Supplementary Dataset 1). Variation in the carbon isotopic composition of sedimentary leaf waxes is usually attributed to vegetation change, including varying inputs of C3 and C4 plants (Eglinton et al., 2002; Feakins et al., 2005, 2007; Castañeda et al., 2009a,b; Tipple and Pagani, 2010), distinctions between conifer and angiosperm inputs (e.g., Pedentchouk et al., 2008; Diefendorf et al., 2015), water availability (e.g., Diefendorf et al., 2010), and are used to track changes in the carbon cycle in the past (e.g., McInerney and Wing, 2011).
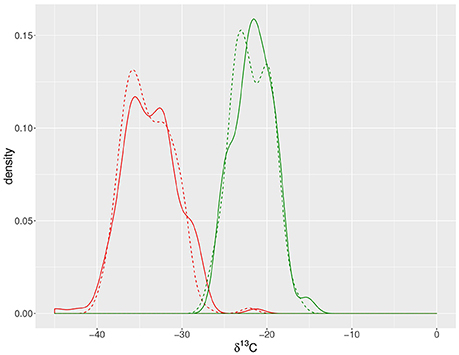
Figure 1. Density plot of n-C29 and n-C31 alkane δ13C values from C3 and C4 plants. n-C29 (solid lines) and n-C31 (dashed lines) alkanes from C3 plants (red) show a 1σ variation of 3.3 and 3.0‰, respectively, while the same alkanes have 1σ variations of 2.3 and 2.3‰ in C4 plants (green). Data shown are from 10 published studies (see Supplementary Dataset 1). Lines represent the kernel density estimates generated using Gaussian kernels with bandwidths chosen by Silverman's “rule of thumb” (Silverman, 1986).
Within a given plant type, variability of leaf waxes can result from changes in the environment. Variation in water availability and mean annual precipitation have been shown to influence δ13C values (Diefendorf et al., 2010). Light intensity, nutrient availability, and the partial pressure of CO2 might also affect δ13C values (Diefendorf and Freimuth, 2017). The response of individual plant types to these environmental forcings is a function of plant biology. Leaf wax parameters such as ACL, δ13C, and δD can be viewed as phenotypes—the set of characteristics of a plant that are produced from the interaction of the genotype with the environment. If δ13C values and other plant phenotypes are to be used to reconstruct environmental variation, this prompts a critical question: how much of the observed variability is due to environmental change, as opposed to genetic variability within populations?
This question can be addressed by quantifying the contribution of genetics and environment to phenotypic variability. Continuous phenotypic traits, such as ACL or the isotopic composition of n-alkanes, can be parameterized as reflecting a combination of genotypic factors that interact with the environment. Although this interaction is commonly recognized in biological studies, the genotype-environment interaction is rarely considered in paleoenvironmental applications.
The contribution of genetic variation to phenotypic variation of a trait can be measured as the broad-sense heritability (H2; Futuyma, 1998; Conner and Hartl, 2004). We directly assess H2 of structural and isotopic leaf wax traits of plants grown in a greenhouse. It is important to recognize that even in a relatively controlled environment like a greenhouse, significant environmental variations exist, many of which cannot be precisely controlled or measured. These differences can result in phenotypic differences among replicate plants—for example variation in structural and isotopic characteristics of leaf waxes. By definition, the phenotypic value (P) of a trait results from the genotype (G) of the organism plus an environmental deviation (E) from the genotypic value: (Conner and Hartl, 2004).
In a given environment we can calculate the relative influence of genotypic and environmental variation on phenotypic variation by precisely measuring variance in the phenotype (VP) and genotype (VG). In this study, we achieved this with a model species complex consisting of precisely defined near-isogenic introgression lines (ILs; Eshed and Zamir, 1995) between two interfertile Solanum (tomato) species. Each of the 76 ILs possesses a single introgressed genomic segment from the desert wild tomato relative Solanum pennellii in a domesticated tomato Solanum lycopersicum cv M82 background (hereafter, cv M82). Together, the introgression segments of the 76 ILs span the entire wild tomato genome. These two species are useful for this investigation because they are adapted to regions with vastly different hydrological settings. Endemic to the dry slopes of the Central Peruvian Andes (Warnock, 1991), S. pennellii bears smaller fruit and leaves that are smaller and less complex than those of cv M82, which is well-adapted to water-replete conditions (Chitwood et al., 2013). The leaves of these two species vary in their wax content; epicuticular lipids comprised 0.96 and 19.9% of total leaf dry weight in 17-week old leaves from cv M82 and S. pennellii, respectively (Fobes et al., 1985).
In this study, we use the S. pennellii ILs to resolve genetic and environmental effects on variability in leaf wax n-alkane δ13C values and structural traits, and to identify quantitative trait loci (QTL) for these leaf wax traits. Although these species are not abundant producers of leaf waxes in terrestrial ecosystems, they provide a useful tool for investigating plant genetics and physiology. These can be considered model organisms in the same way that Escherichia coli is used as a model organism for understanding fundamentals of bacterial physiology and genetics. Using this model species complex to determine the role of heritability in the production of plant wax traits allows us assess the importance of genetic variation in the variation of leaf wax phenotypes. Quantifying the contribution of genetic variation to total phenotypic variation is a step toward incorporating an understanding of genetic variation into interpretation of leaf wax isotopic records.
Materials and Methods
Plant Materials, Growth Conditions, and Experimental Design
We obtained second-generation S. pennellii ILs (Eshed and Zamir, 1995), Solanum pennellii, and Solanum lycopersicum cv M82 seeds from the Tomato Genetics Resource Center and the lab of Neelima Sinha (University of California, Davis) and Dani Zamir (Hebrew University, Rehovot, Israel). All seeds were prepared and germinated at the Donald Danforth Plant Science Center in St. Louis, MO as described in Chitwood et al. (2013).
Growth Conditions for cv M82 and S. pennellii
In order to characterize the variance of leaf wax traits between the two parent lines, we grew 10 replicates of each parent species in the greenhouse from November 2013–January 2014. The seeds were germinated in late November 2013. Seedlings were transplanted into 2-gallon planters in the greenhouse and staggered along a greenhouse bench. Seedlings were vigorously top watered after transplanting and further watered and fertilized to ensure plant growth; irrigation water was supplied from a tap water reservoir.
Anthesis (the flowering period) began in late December 2013; leaves were collected from each plant in early January 2014. One leaf was collected from each plant for leaf wax extraction and analysis based on specific criteria: (i) the leaf was fully developed (i.e., leaflets were fully unfurled), and (ii) the leaf was young (i.e., close to the top of the plant, arising after the reproductive transition). These criteria were selected to minimize variability due to timing of leaf development. Each sample comprised the five primary leaflets of each leaf (terminal, distal, and proximal lateral left and right).
Growth Conditions for ILs and cv M82
We grew the 76 ILs from December 2013–February 2014. Seeds were germinated in December and transplanted to 3-gallon planters in the greenhouse in January. The ILs and cv M82 were arranged in a randomized block design with four replicates (Supplemental Figure 1, Supplemental Dataset 2). Watering and fertilization proceeded as with the parent lines.
After anthesis in early February, we collected leaf samples in late February according to identical criteria as described above for the parent lines, collecting leaves that were 6–8″ in length. Our growing efforts were successful for all but four ILs (ILs 2.2, 5.3, 7.1, and 8.2).
During the growth period for the ILs, we monitored ambient conditions of the greenhouse that were not under direct control: relative humidity, temperature, pCO2, and δ13CCO2. Daytime temperature and relative humidity were monitored with custom systems integrated with the greenhouse (Argus Control Systems, Ltd.). Temperatures were maintained at approximately 78°F (25.6°C). We installed a Picarro Cavity Ring-Down Spectrometer G2131-i Analyzer in the greenhouse to monitor pCO2 and δ13CCO2; these data were aggregated from 5-min interval measurements (Supplemental Figure 2, Supplemental Dataset 3).
Leaf Harvest and Lipid Extraction
Each sample for lipid extraction consisted of five leaflets (terminal, distal lateral left and right, proximal lateral left and right) from a single leaf of each plant. We measured leaf area from all sample leaflets with a flatbed scanner and ImageJ software (Abràmoff et al., 2004). The collected leaf samples were cut into 1 cm2 pieces, placed into pre-baked 15 mL clear borosilicate vials (Qorpak), and then dried in a 70°C oven for 48 h. We extracted epicuticular waxes from the dried leaf samples by adding 5 mL of hexane (Omni-Solv HR-GC Hexanes 98.5%, VWR International, LLC) and agitating via pumping with a Pasteur pipette. The resulting total lipid extract (TLE) was collected into a pre-baked 15 mL borosilicate vial; the extraction step was repeated three times, and the three extractions were pooled. We evaporated the TLE to dryness with heat (30°C) under a steady stream of nitrogen gas (FlexiVap Work Station, Glas-Col).
To isolate alkanes for analysis, we performed silica gel column chromatography on the dried TLE of each sample. We transferred the TLE with 50 μL of hexane to a silica gel column (5 cm × 4 mm Pasteur pipette packed at the base with a small amount of pre-baked glass wool, which was covered by a thin layer of pre-baked chromatography grade sand and then filled 3–4 cm high with H2O-deactivated silica gel). We collected the alkane fraction by eluting with hexane. The polar compounds retained on the silica gel column were eluted with ethyl acetate and archived.
Leaf Wax Structural Analysis
We analyzed the alkane fractions using an Agilent 7890A gas chomatograph (GC) coupled with a 5975C Series Mass Spectrometric Detector system at Washington University in St. Louis. The GC was equipped with an Agilent J&W HP-5 ms column (30 m long, 0.25 mm inner diameter, 0.25 μm film thickness). The GC oven had an initial temperature of 60°C and was heated at a rate of 6°C/min to a final temperature of 320°C, which was held for 20 min. One sample run lasted approximately 65 min. Alkanes were identified by their mass spectra and quantified against an internal standard (n-hexadecane-d34, 98 atom%, Sigma-Aldrich).
Carbon Isotope Analysis
Compound-specific isotope analyses were performed at Washington University in St. Louis using a GC coupled via a combustion reactor to a Thermo Delta V Plus isotope ratio mass spectrometer. Isotopic compositions were determined relative to an internal n-alkane standard (n-C18 [−31.1‰]) and are reported as
where Rsamp and Rstnd represent the 13C/12C abundance ratio of the sample and standard, respectively. Delta values are reported in per mil notation (‰) and are expressed relative to Vienna Pee Dee Belemnite (VPDB). All samples were analyzed in triplicate. Externally calibrated sets of standards with n-alkanes (mixture B3 or A5) and fatty acids (mixture F8), provided by A. Schimmelmann (Indiana University), were measured between every fifth sample injection. Analytical uncertainty of reported δ13C values ranges between ±0.2 and 0.3‰ (SEM), dependent on the number of analytical replicates, after propagating the uncertainty of replicate analyses and external molecular standards (Polissar and D'Andrea, 2014; data available on GitHub repository at http://github.com/aldbender/13C-heritability).
Ambient greenhouse CO2 was monitored during growth of the Solanum ILs from December 19, 2013–February 24, 2014, except for the period from January 1–14 when a technical error prevented data collection. For the ILs and cv M82 plants grown simultaneously in the greenhouse, we report the apparent fractionation (ε) to characterize the difference in δ13C between source (i.e., atmospheric CO2) and product (i.e., lipid), which is defined as,
where δ13C values are calculated as described in Equation 2. As with delta values, epsilon values are reported in per mil notation. Carbon isotope values of lipids from S. pennellii and cv M82 grown during November 2013 are not reported as ε values because the carbon isotopic value of ambient greenhouse CO2 was not recorded during their growth period.
Statistical Modeling and QTL Analysis
Data from all traits measured from the ILs are reported in Supplemental Dataset 3. The R code and data sets used for modeling are available on GitHub at http://github.com/aldbender/13C-heritability. Leaf wax traits measured from the ILs and cv M82 grown simultaneously were modeled using mixed-effect linear models with the lme4 packages (http://CRAN.R-project.org/package=lme4) in R (R Development Core Team, 2015). Before modeling, we compared the measured values against theoretical normally distributed values in a Q-Q plot to check whether the measured values came from a normally distributed population. If a trait deviated from a normal distribution, we transformed the trait by either taking the square root, log, reciprocal, or arcsine of the trait and tested for normality of each transformed population via the Shapiro-Wilk test, using the transformation that resulted in the least deviation from a normal distribution (see Supplemental Dataset 4 for measured trait summaries and selected transformation for each trait). After performing the mixed-effect linear modeling, the normal distribution of residuals in the model was verified. We extracted p-values for significant (p < 0.05) differences between ILs and cv M82 from the models using the pvals.fnc function from the language R package (http://CRAN.R-project.org/package=languageR); these p-values were used to generate the QTL analysis. Broad sense heritability (H2) is defined as the proportion of total phenotypic variance that can be attributed to genetic variation (Futuyma, 1998), as given in the equation:
where VG is genetic variance and VE is environmental variance. We determined broad-sense heritability values (H2) using the estimates of variance for genetic and environmental effects (here, this includes the block assignment of each plant and the variance of residual effects) that were derived from the mixed-effect linear modeling (see Supplemental Datasets 5 and 6). We categorized H2 values as low (0.0–0.2), intermediate (0.2–0.4), or high (0.4–0.6); a trait with high heritability (closer to 1) generally indicates that genetic factors strongly influence the amount of trait variation.
Hierarchical Clustering of Traits
Hierarchical clustering is used to build nested groupings of traits that are organized based on similarities between sets of trait observations. We performed a correlation analysis of leaf wax traits from this study with traits existing in the phenomics database (Phenom-Networks, www.phenome-networks.com). For each trait in a data set, data were z-score normalized in order to transform all data ranges to a standardized average and standard deviation. Z-scores were averaged across replicates. We performed hierarchical clustering using the hclust function from the stats package in R (R Development Core Team, 2015), clustering by the absolute value of the Pearson correlation coefficient using Ward's minimum variance method. We created a correlation matrix (Spearman) between all traits measured in this study (modeled as described above) and traits from other published studies, as described below. Significance values for correlations were determined and the false discovery rate controlled via the Benjamini-Hochberg method (Benjamini and Hochberg, 1995).
All traits analyzed for hierarchical clustering are divided into five major groups, as determined by the studies from which they are reported and by the phenotype that they measure, following the naming system described by Chitwood et al. (2013). “DEV” refer to leaf morphological and developmental traits as reported by Chitwood et al. (2013). “MET” traits report metabolite levels in the fruit pericarp, as measured by Schauer et al. (2006, 2008). Traits labeled “MOR” as recorded in Schauer et al. (2006, 2008) and Phenom-Networks include traits relevant to yield and morphological measures of fruits and flowers. The “ENZ” traits measure enzymatic activities in the fruit pericarp, as reported by Steinhauser et al. (2011), and “SEED” traits measure metabolite levels in seeds, as derived from Toubiana et al. (2012). Traits described in the present study are termed “WAX” because they relate to leaf waxes.
Results
Compound Distributions and Carbon Isotope Values of Leaf Wax Alkanes
Odd-carbon-numbered n-alkanes in S. pennellii and cv M82 ranged from C27 to C35, with C31 being the most abundant, followed by C33 (Table 1; Figure 2). The prevalence of n-C31 among the leaves of cv M82 and S. pennellii in this study matches that reported from the fruit cuticles of the same plants (Yeats et al., 2012).

Table 1. Leaf wax traits for S. lycopersicum, S. pennellii, and ILs.
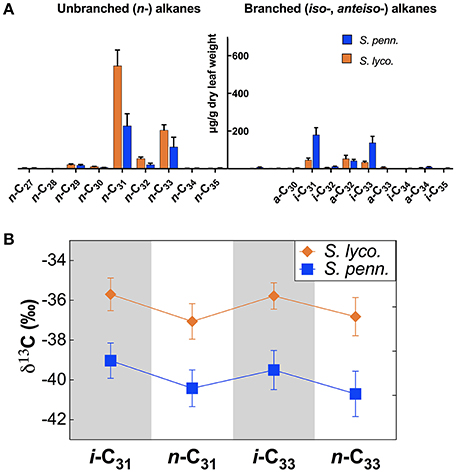
Figure 2. Leaf waxes from S. lycopersicum cv M82 and S. pennellii. (A) Average concentration of leaf wax molecules across ten biological replicates normalized to leaf mass, with unbranched (i.e., normal, left) and branched (i.e., iso- and anteiso-, right) alkanes. S. pennellii (blue) contains greater amounts of iso-alkanes than S. lycopersicum cv M82 (orange). Error bars indicate one standard deviation of the mean. (B) Carbon isotope values (δ13C) of n- and iso-alkanes from the most abundant chain lengths (C31 and C33) of S. pennellii (blue) and cv M82 (orange). The pattern of iso- over n-alkane enrichment is consistent between both species. Additionally, δ13C values from S. pennellii (blue) are consistently depleted relative to those from S. lycopersicum cv M82 (orange). Data are from 10 biological replicates analyzed in triplicate; analytical uncertainty ±0.2‰. Error bars represent standard deviation of biological replicates.
Branched alkanes with methyl groups at the iso (second) and anteiso (third) positions are present in measurable quantities among both S. pennellii and cv M82. For each carbon chain length, the iso-alkane precedes the anteiso-alkane, which precedes the n-alkane. For example, for alkanes with 31 carbon molecules, the elution order of alkanes would be i-C31, a-C31, and then n-C31. We compiled concentrations of high-molecular-weight iso-, anteiso-, and n-alkanes in order to quantify variations in alkane distributions. Standard deviations (1σ) for leaf wax traits from cv M82 and S. pennellii are provided in the text below and in Table 1.
We provide the reader with the range of each leaf wax trait value from all ILs in the text and in Table 1. A comprehensive database of leaf wax trait values measured from the ILs is available in Supplemental Dataset 4.
Alkane Methylation
We characterized the prevalence of branched (iso- and anteiso-) alkanes for each sample by calculating the methylation index (a novel measure of this study). Here, we define the methylation index as the relative abundance of branched alkanes to the total sum of branched and n-alkanes, expressed as
where Cn is the concentration of each iso-, anteiso-, or n-alkane with n carbon atoms. A methylation index of 0 indicates that only n-alkanes are present, whereas a methylation index of 1 would indicate that there are only iso- and anteiso-alkanes present.
The average methylation indices across 10 biological replicates are 0.15 ± 0.02 for cv M82 and 0.50 ± 0.04 for S. pennellii (Table 1), indicating that S. pennellii has a greater proportion of branched: normal alkanes than cv M82. This difference is driven by the higher percentage of iso-alkanes in S. pennellii (43.6 ± 2.6‰ in S. pennellii versus 8.8 ± 0.7‰ in cv M82; Table 1, Figure 2A). The percent of anteiso-alkanes is indistinguishable between the two species.
Methylation indices for the ILs range from 0.07 to 0.28 (Table 1 and Supplemental Figure 4), with an average value of 0.14. The percentages of anteiso- and iso-alkanes range from 2.8 to 15.7% and from 3.3 to 13.1%, respectively. Although S. pennellii has a greater percentage of iso-alkanes (43.6 ± 2.6%) than any IL, many ILs have a higher percentage of anteiso-alkanes than both S. pennellii and cv M82.
Structural Traits
There is a strong odd-over-even predominance among leaf wax n-alkanes of S. pennellii and cv M82, which matches previous observations (Eglinton and Hamilton, 1967; Lockheart et al., 1997). The odd-over-even prevalence of iso-alkanes and even-over-odd prevalence of anteiso-alkanes is consistent with observations of branched alkanes from Micromeria plants (Reddy et al., 2000). Carbon preference indices (CPIs) were used to assess the odd-over-even dominance of each sample, as calculated after Marzi et al. (1993):
where Cn represents the concentration of each alkane with n carbon atoms. CPIs were calculated independently for n-, iso-, and anteiso-alkanes.
The anteiso-alkanes were primarily even-numbered, whereas the iso-alkanes had a predominantly odd-numbered distribution, which is similar to patterns previously reported (Kolattukudy, 1969; Reddy et al., 2000). cv M82 and S. pennellii had average n-alkane CPIs of 10.4 ± 0.4 and 11.2 ± 1.3, respectively (Table 1). The anteiso-alkane CPIs were 0.0 ± 0.1 for cv M82 and 0.0 ± 0.0 for S. pennellii. The iso-alkane CPIs were 10.2 ± 0.6 for cv M82 and 19.4 ± 2.5 for S. pennellii. Among the ILs, the n-alkane CPIs ranged from 9.6 to 17.4, the anteiso-alkane CPIs ranged from 0.0 to 0.4, and the iso-alkane CPIs ranged from 5.8 to 21.2 (Supplemental Figure 5, Table 1).
To test genetic differences in average chain lengths (ACLs) among the parent lines and the ILs, we calculated the weighted average of the carbon chain lengths after Freeman and Pancost (2014), defined as:
We calculated ACL for chain lengths C27–C35, including both odd- and even-numbered alkanes in the ACLs. ACLs were calculated separately for n-, iso-, and anteiso-alkanes.
cv M82 and S. pennellii had identical n-alkane ACLs (31.5 ± 0.0 and 31.5 ± 0.1, respectively). The anteiso-alkane ACLs were 32.1 ± 0.0 for cv M82 and 32.2 ± 0.0 for S. pennellii. The iso-alkane ACLs were identical for both cv M82 and S. pennellii (31.8 ± 0.1). Among the ILs, n-alkane ACLs varied from 31.0 to 31.8, anteiso-alkane ACLs ranged from 31.9 to 32.3, and iso-alkane ACLs varied from 31.1 and 32.3 (Supplemental Figure 6, Table 1).
Carbon Isotopes
The n-alkanes were depleted in 13C relative to the iso-alkanes for chain lengths C31 and C33 for both cv M82 and S. pennellii (Figure 2B, Table 1), which is consistent with the pattern observed by Grice et al. (2008). We report the magnitude of the 13C depletion between n- and iso-alkanes of the same carbon numbers as δn – δiso:
For C31 alkanes, δn – δiso was −1.4 ± 0.5‰ for cv M82 and −1.4 ± 0.3‰ for S. pennellii. For C33 alkanes, δn–δiso was −1.2 ± 0.4‰ for cv M82 and −1.2 ± 0.5‰ for S. pennellii (Table 1). Alkanes from S. pennellii are consistently depleted in 13C relative to those of cv M82. Isotopic mass balance calculations for the four major alkanes (i-C31, n-C31, i-C33, and n-C33), which comprise 84 ± 0.2% of all alkane mass measured, indicate that the average δ13C values for carbon incorporated in the leaf waxes is −36.9 ± 0.9‰ for cv M82 and −39.9 ± 1.0‰ for S. pennellii.
During the IL growth period, the average daily CO2 δ13C values ranged from −18.0 to −14.7‰ (Supplemental Figure 2, Supplementary Dataset 3). We calculated the mean δ13CCO2 during this period as −16.4‰; this value was used to calculate apparent fractionation, ε, according to Equation 3.
From the plants of cv M82 grown simultaneously with the ILs, the ε-values of iso-alkanes (−16.4 ± 1.9‰ for i-C31, −16.2 ± 1.9‰ for i-C33) were enriched over the ε-values of n-alkanes (−18.1 ± 2.2‰ for n-C31 and −17.6 ± 2.1‰ for n-C33, Table 1). ε values from the ILs ranged from −21.6 to −12.9‰ (i-C31), −23.9 to −14.3‰ (n-C31), −21.3 to −13.2‰ (i-C33), and −23.7 to −13.8‰ (n-C33), maintaining the same pattern of iso- over n-alkane 13C enrichment. Among the ILs, the magnitude of this difference (δn–δiso) varies from −0.3 to −4.0‰ for C31 alkanes and from −0.2 to −3.3‰ for C33 alkanes.
Heritability
We modeled the suite of IL leaf wax trait values to estimate the influence of genetic factors over these traits in the population of the IL plants and cv M82. Broad-sense heritability values (H2; Table 1 and Figure 3) for the leaf wax traits ranged from low (H2 = 0.13) to intermediate (0.39). The percentage of anteiso- (H2 = 0.39) and iso-alkanes (0.37) were of intermediate heritability, as were the δn–δiso values for C31 (0.39) and C33 (0.32). The methylation index was also of intermediate heritability (H2 = 0.35). Traditional structural traits were also of intermediate heritability: CPI for n-alkanes (H2 = 0.31), anteiso-alkanes (0.27), and iso-alkanes (0.22), as well as ACL for n-alkanes (0.31), anteiso-alkanes (0.28), and iso-alkanes (0.26). The ε values of individual alkane molecules were of low heritability (H2 = 0.19 for i-C31, 0.18 for n-C31, 0.18 for n-C33, and 0.13 for i-C33).
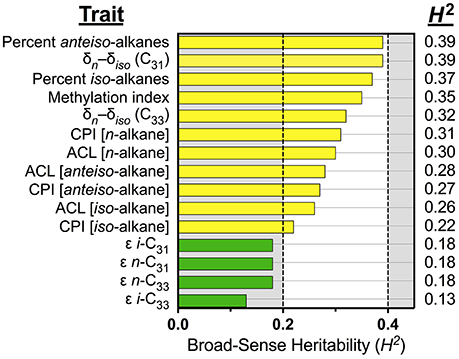
Figure 3. Broad-sense heritability for leaf wax traits. Colors denote traits with intermediate (yellow, 0.2 ≤ H2 < 0.4), and low (green, H2 < 0.2) heritability values. All traits were measured from plants grown under greenhouse conditions in early 2014, St. Louis MO. The majority of leaf wax traits have intermediate heritability values. The apparent fractionations of individual alkanes (ε values) have low heritability values.
Detected QTL
In order to detect QTL for each leaf wax trait, we determined which ILs had a trait value that was significantly different from the trait value of cv M82. We identified 156 QTL in which a distinction at a significance level of p < 0.05 was detected (Figure 4, Supplemental Table 1). Of these, 33 QTL were transgressive in the direction of S. pennellii (i.e., the trait value was outside of the range between cv M82 and S. pennellii in the direction of S. pennellii) and 30 were transgressive beyond cv M82. Some ILs have trait values outside of the range of the parents (i.e., are transgressive) due to epistasis, or non-linear interactions between genetic loci, which can lead to non-additive effects among the traits of the ILs. Epistasis manifests because of novel combinations of genes within the ILs. The remainder of the QTL had trait values that were intermediate between the bounds of the trait defined by the two parent strains. One trait, δn – δiso for C33, had no significant QTL.
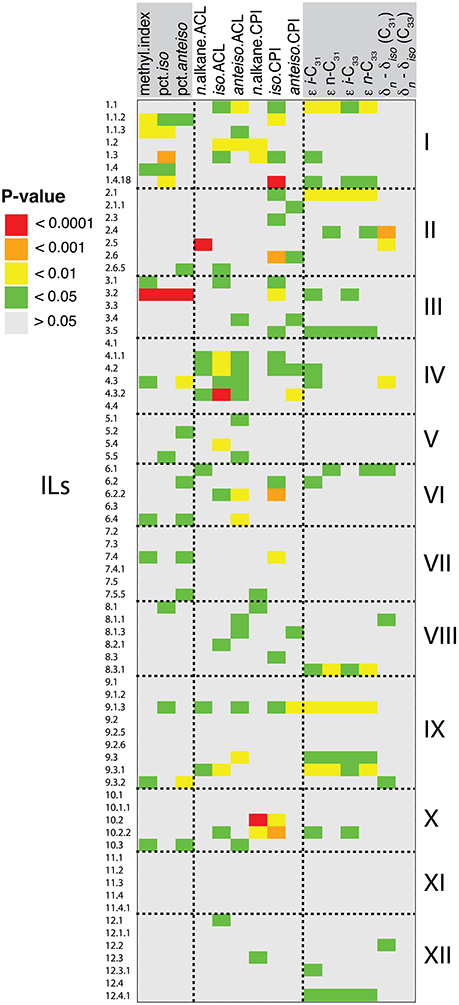
Figure 4. Detected leaf wax QTL. Shown are QTL with p < 0.05, as calculated from mixed-effect linear models for deviation of ILs from cv M82. In total, 139 QTL were detected. Traits are grouped by type: from left to right, methylation traits, structural traits, and carbon isotope traits.
QTL Regulating Alkane Methylation
Quantitative trait loci (QTL) analysis may help to explain the genetic basis of variation in alkane methylation between S. pennellii and cv M82. S. pennellii had a greater methylation index (0.50) than any IL (varied from 0.07 to 0.28; Table 1). Of the 11 QTL of methylation index, none were transgressive beyond S. pennellii or cv M82 (Figure 4, Supplemental Table 1, Supplemental Figure 4). Of the 9 QTL for percent of iso-alkanes (Figure 4, Supplemental Table 1), one QTL was transgressive beyond cv M82 (IL 8-1). For the percent of anteiso-alkanes, there were 10 QTL transgressive beyond S. pennellii and 1 QTL transgressive in the direction of S. lycopersicum (IL 7-5-5).
Some QTL were identified for multiple alkane methylation traits. IL 3-2 displayed the most significant increase in branched alkane production across three biological replicates, with an average methylation index of 0.26, 10.2% iso-alkanes, and 11.3% anteiso-alkanes. IL 1-1-2 had an average methylation index of 0.18, 8.9% iso-alkanes, and 9.3% anteiso-alkanes. From IL 1-1-3, we measured a methylation index of 0.20 and 10.5% iso-alkanes. IL 9-3-2 had a methylation index of 0.18 and 10.9% anteiso-alkanes. IL 7-4 had a methylation index of 0.18 and 9.7% anteiso-alkanes. ILs 4-3, 6-4, and 10-3 had identical methylation indices of 0.17, and 11.8, 9.0, and 9.5% anteiso-alkanes, respectively.
QTL Regulating CPI and ACL
Thirty-three QTL were identified for CPIs: 7 for n-alkane CPIs, 19 for iso-alkane CPIs, and 7 for anteiso-alkane CPIs (Figure 4, Supplemental Table 1). For n-alkanes, the 7 QTLs were transgressive beyond cv M82. For the iso-alkane and anteiso-alkanes CPIs, no QTL were transgressive beyond S. pennellii or cv M82.
Thirty-nine QTL were identified for the three types of ACL: 7 for n-alkane ACLs, 15 for iso-alkane ACLs, and 17 for anteiso-alkane ACLs (Figure 4, Supplemental Table 1). Among n-alkane ACLs, 1 QTL was transgressive beyond S. pennellii and four QTL were transgressive beyond cv M82. Fourteen of the QTL for iso-alkane ACLs were transgressive in the direction of S. pennellii. For the anteiso-alkane ACLs, 9 QTL were transgressive beyond cv M82.
QTL Regulating Carbon Isotopic Fractionation
We identified 54 QTL for the carbon isotope traits measured in this study: 16 for ε i-C31 values, 11 for ε i-C33, 10 for ε n-C31, 11 for ε n-C33, 6 for δn – δiso (C31), and 0 for δn – δiso (C33) (Figure 4, Supplemental Table 1). For all of the measured ε values, 1 common QTL was transgressive beyond S. pennellii: IL 2-1. For ε n-C31, 2 additional QTL were transgressive beyond S. pennellii. Multiple QTL overlapped across all ε values: IL 1-1, 2-1, 3-5, 8-3-1, 9-3, 9-3-1, and 12-4-1. For the 6 QTL of δn – δiso (C31), 2 were transgressive toward S. pennellii and 4 were transgressive toward S. lycopersicum.
Hierarchical Clustering
Clustering and Correlations among Leaf Wax Traits
The clustering of leaf wax traits reveals similarities between the sets of trait measurements (Figure 5; Supplemental Dataset 7). Hierarchical clustering of wax traits grouped the apparent fractionation values (ε) together. All of the ACL traits (n-, iso, and anteiso-alkanes) clustered together. CPIs for iso-alkanes clustered with the percent of iso-alkanes, which co-clustered with the CPI of n-alkanes. The carbon isotopic differences between n- and iso-alkanes (δn – δiso) clustered with each other. The methylation index and percent of anteiso-alkanes clustered together, and co-clustered with the CPI of anteiso-alkanes.
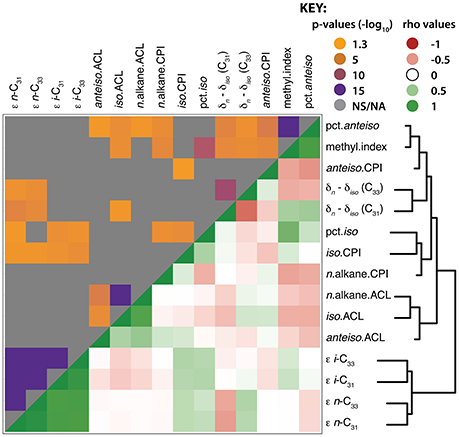
Figure 5. Hierarchical clustering and correlation of leaf wax traits. Hierarchical clustering and heat map of leaf wax traits measured in this study with each other. The upper quadrant shows correlation p-values; gray indicates non-significant p-values (p > 0.05), whereas the spectrum of orange to purple colors designate p-values ranging from less to more significant, respectively. The lower quadrant indicates Spearman's ρ values in red (negative), white (neutral), and green (positive). The p-values and ρ values used to generate this figure are available in Supplemental Dataset 7.
Numerous structural leaf wax traits were significantly correlated with each other based on multiple test-adjusted p-values and Spearman's ρ correlation coefficient. Among the CPIs, CPI of anteiso-alkanes correlated negatively with the CPI of iso-alkanes (p = 0.047, ρ = −0.28). The CPIs of iso-alkanes correlated positively with the percent of iso-alkanes (p = 0.002, ρ = 0.41). The CPIs of n-alkanes were negatively correlated with each of the methylation traits (methylation index, percent of iso- and anteiso-alkanes). The ACL of n-alkanes was positively correlated with iso- (p < 0.001, ρ = 0.82) and anteiso-alkanes (p < 0.001, ρ = 0.50). The ACL of iso- and anteiso-alkanes were negatively correlated with the percent of anteiso-alkanes. All ACL values were negatively correlated with the percent of anteiso-alkanes: with ACL values of n- (p = 0.025, ρ = −0.31), iso- (p = 0.003, ρ = -0.39), and anteiso-alkanes (p = 0.027, ρ = −0.30).
The methylation index was positively correlated with the percent of iso- and anteiso-alkanes and with the values of δn – δiso for both C31 and C33, but negatively correlated with ACL of iso-alkanes. The percent of anteiso-alkanes correlated positively with δn – δiso values of C31 and negatively with δn – δiso values of C33. The ε values of all alkanes correlated positively with the CPI of iso-alkanes, and the ε values of all alkanes except n-C33 correlated positively with the percent of iso-alkanes. Most of the carbon isotopic traits significantly correlated with each other, except for δn – δiso (C33) with ε i-C31 and ε i-C33. The ε values were positively correlated with each other; the ε values of n-C31 and n-C33 were positively correlated with the δn – δiso values of C31, but negatively correlated with the δn – δiso values of C33 (see Supplemental Dataset 7 for p and ρ values).
Clustering and Correlations of Leaf Wax Traits with Traits from Previous Studies
The traits measured in previous studies that clustered with WAX traits (Figure 6; Supplemental Figure 3) may contain information about the relevance of leaf wax traits to plant metabolism, yield, and developmental leaf traits. The CPIs for n-alkanes clustered with the enzymatic activity of succinyl-coenzyme A ligase in the fruit pericarp, and co-clustered with levels of uracil in the fruit pericarp and with activity levels of starch in the fruit pericarp (Schauer et al., 2006, 2008; Steinhauser et al., 2011). The percentage and CPI values of iso-alkanes co-clustered with enzymatic activity of invertase and glucokinase in the fruit pericarp (Steinhauser et al., 2011).
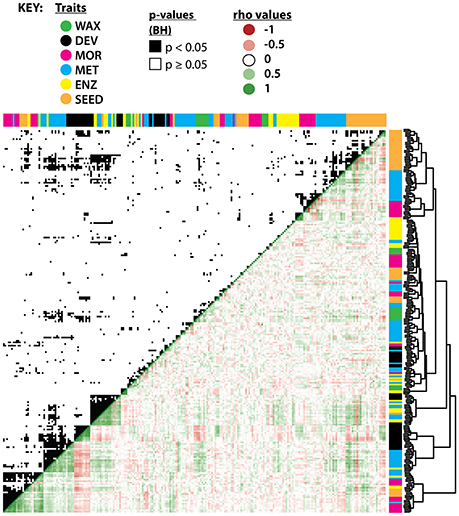
Figure 6. Hierarchical clustering and correlation of leaf wax traits with previously measured IL traits. Hierarchical clustering of leaf wax traits from this study with traits measured in previous studies (see close-up of the hierarchical clustering in Supplemental Figure 3). WAX (green) are leaf wax traits from this study; DEV (black), leaf developmental traits from Chitwood et al. (2013); MOR (pink), entire-plant, yield, and reproductive morphological traits from Schauer et al. (2006, 2008); MET (blue), metabolic traits from the two previous studies; ENZ (yellow), enzymatic activities from Steinhauser et al. (2011); SEED (orange), seed metabolites as measured by Toubiana et al. (2012). Hierarchical clustering is based on absolute correlation values. The upper quadrant shows significant correlations (p < 0.05) between traits after multiple test adjustment, shown in black. The lower quadrant indicates Spearman's ρ values in red (negative), white (neutral), and green (positive). The p-values and ρ values used to generate this figure are available in Supplemental Dataset 8.
Multiple leaf wax traits from this study correlated significantly with traits measured in previous S. pennellii IL studies based on multiple test-adjusted p-values and Spearman's ρ correlation coefficient (Figure 6; Supplemental Dataset 8); a few correlations are highlighted below. ACLs for anteiso-alkanes positively correlated with aconitase (p = 0.040, ρ = 0.34) enzymatic activity within the fruit pericarp (Steinhauser et al., 2011), which might be related to the synthesis of anteiso-alkanes (Grice et al., 2008). ACLs for n- and iso-alkanes positively correlated with enzymatic activities of glyceraldehyde 3-phosphate dehydrogenase (GADPH; for n-alkane ACL, p = 0.013, ρ = 0.39; for iso-alkane ACL, p = 0.039, ρ = 0.34; Steinhauser et al., 2011) within the fruit pericarp, which serves as a catalyst during glycolysis. iso-Alkane ACLs positively correlated with metabolite levels of glutamate within seeds (p = 0.033, ρ = 0.36; Toubiana et al., 2012), an amino acid used to synthesize proteins.
Discussion
Results from QTL analysis may help to explain the genetic basis of variation in leaf wax traits between S. pennellii and cv M82. As evidenced by the multiple QTL identified for nearly all leaf wax traits in this study (except for δn – δiso of C33; Figure 4, Supplemental Table 1), large portions of the genome contribute to natural variation in many leaf wax traits, suggesting that these traits are polygenic. This pattern is similar to that observed in leaflet serration (Chitwood et al., 2013), for example. Each of the loci affecting these traits contains a large number of genes; identifying these loci is a first step in identifying candidate genes that are involved in modulating these plant wax traits. The QTL mapping also provides a blueprint for identifying genetic mechanisms tied to variability in these plant wax traits, and the genetic basis of trait evolution (Conner and Hartl, 2004).
Alkane Methylation
Solanum pennellii had a far greater methylation index and percentage of iso-alkanes than any IL (Table 1). All methylation traits were of intermediate heritability (Figure 3), indicating that these traits are moderately influenced by genetic controls. ILs 1-1-2, 1-1-3, 1-4, and 3-2 contributed the largest effects to the alkane methylation phenotypes, with QTL for both methylation indices and percentages of iso-alkanes (Figure 4; Supplemental Table 1). The variation among the QTL for methylation traits may be attributed to the variation induced by the genetic loci of the ILs. The correlations in the QTL observed for methylation and for other leaf wax traits (Figure 5; Supplemental Dataset 7) may be informative in generating hypotheses about the physiological function of methylated alkanes. For example, the negative correlations between all methylation traits (i.e., methylation index and percentages of iso- and anteiso-alkanes) with CPI of n-alkanes might indicate a physiological connection between a lower odd-over-even predominance of n-alkanes (i.e., greater concentration of even-numbered n-alkanes) and a higher concentration of methylated alkanes.
Structural Traits
Numerous studies have revealed correlations between n-alkane chain lengths and climatic variables such as temperature and humidity, as well as to the plant sources of the n-alkanes (e.g., Bush and McInerney, 2013 and references therein). Given this correlation, one might expect ACLs to be different in plants that are adapted to different hydrological regimes (e.g., S. pennellii and cv M82) and for ACLs to be of low heritability. Instead, we observed nearly identical ACLs between S. pennellii and cv M82 (Table 1) and ACLs that are of intermediate heritability (Figure 3), suggesting a high degree of genetic control over their alkane chain-length distributions. Alkane distributions are potentially very conserved traits among these Solanum species. If this pattern generalizes to other groups, it suggests that variations in sedimentary ACLs may be due to the changes in plant assemblages rather than phenotypic plasticity of individual lineages.
Carbon Isotopes
The ε-values for the four primary alkanes in this study had low broad-sense heritability values (Figure 3). A previous study into the bulk carbon isotopic composition of Arabidopsis thaliana grown in controlled growth chambers measured high heritability for bulk leaf δ13C values (H2 = 0.67; Easlon et al., 2014). The lower heritability found among δ13C of wax in this study may reflect more variable environmental conditions in the greenhouse relative to a growth chamber, more variable response to the greenhouse environment, or a biological difference between Arabidopsis and Solanum. It may also reflect that waxes are a more environmentally sensitive phenotype than bulk leaf δ13C. Broad-sense heritability is specific to the population and environment, thus the difference between these two results is not unexpected.
We observed that alkanes derived from S. pennellii were more depleted in 13C than those from cv M82 (Figure 2), with a consistent offset in δ13C values of about 3‰. The average daily δ13CCO2 values within the greenhouse varied by 1.7‰ during the end of the growth period of the parent lines (December 19–January 3; Supplemental Figure 2, Supplemental Dataset 3). Our sampling procedure collected young leaf material simultaneously from all plants, minimizing potential differences imposed by timing of growth. The isotopic difference between the two parent strains is likely to derive from biological variables that are not yet quantified. Possibilities for this difference include timing of wax synthesis, differences in WUE, or other responses to light, water, or nutrients. Examination of differences among the ILs can be informative. For example, WUE relates to stomatal conductance (Farquhar et al., 1989; Easlon et al., 2014). However, we did not find any significant correlations between δ13C in this study and previous estimates of stomatal density (Chitwood et al., 2013).
Every plant in this study produced iso-alkanes that were enriched in 13C relative to n-alkanes, expressed here as δn–δiso. The enrichment of iso- over n-alkanes was treated as a quantitative trait, and was of intermediate heritability (H2 = 0.38 for C31 alkanes and H2 = 0.32 for C33 alkanes; Figure 3). The variability of isotopic enrichment of iso-alkanes was more heritable than the apparent fractionation. The stronger genetic control on the difference between alkanes suggests a mechanism that relates to biosynthesis. Reddy et al. (2000) noted no apparent differences in δ13C values between normal and branched alkanes in their study of four species of Micromeria. However, the enrichment pattern observed in this study is consistent with that reported by Grice et al. (2008), who recorded that iso-alkanes were enriched by 0–1.8‰ over n-alkanes in Nicotiana tabacum (tobacco) plants. This enrichment pattern is attributed to different biosynthetic precursors for iso- versus n-alkanes (i.e., valine for iso- and pyruvate for n-alkanes; Kolattukudy, 1969; Grice et al., 2008). Levels of valine and pyruvate have previously been measured from both the fruits (Schauer et al., 2006, 2008) and seeds (Toubiana et al., 2012) of the S. pennellii ILs; however, these traits do not significantly correlate with any WAX traits in this study.
Implications for Interpreting Sedimentary Plant Waxes
Carbon isotope values (δ13C) of plant materials from sediments have many applications: identifying ecosystems dominated by C3 versus C4 plants, distinguishing inputs from conifers and angiosperms, reflecting water availability, and reconstructing changes in the ancient carbon cycle. Within populations, δ13C is positively correlated with WUE of plants (e.g., Ehleringer and Cooper, 1988; Farquhar et al., 1989; Seibt et al., 2008; Easlon et al., 2014), which can plastically respond to changing local rainfall and humidity. An implicit assumption for using δ13C values to interpret changes in WUE is that the δ13C alkane signal is dominated by environmental rather than genetic information. By examining this assumption, we have quantified the degree to which the δ13C values of leaf waxes measured from plants in this study are influenced by environmental variance (H2 ranges from 0.13 to 0.19). Our study reveals that genetic variance plays a limited role in driving variation of leaf wax carbon isotopic values among Solanum plants, and is consistent with the interpretation that variation in the δ13C of wax compounds, as recorded in sediments, is largely driven by paleoenvironmental changes. These findings do not bear on ecosystem changes that substitute one strong genetic control for another—such as changes in the input of C3 versus C4 plants, or of conifers and angiosperms. Instead, this study places constraints on the extent to which the variance in δ13C in a group of plants is under genetic control. The QTL and statistical approaches we have used were developed by plant scientists to try to understand genetic signals in the presence of environmental noise. Geochemists implicitly take the opposite approach, attempting to extract environmental signals from the variance of continuously varying traits under both genetic and environmental control. In this environment and with this set of plants, genetics contributed up to 20% of the total variance observed from δ13C among leaf waxes. It remains to be determined whether other plants in other environments show similar amounts of variance, but this study represents the first attempt to constrain these sources of variance.
Variation in alkane methylation traits in this study was largely influenced by genetic variation. The presence of branched alkanes in the sedimentary record might lend itself to chemotaxonomic applications, but it is unlikely that any of the branched alkane-producing plants are significant global contributors to terrestrial soil organic matter. However, regional chemotaxonomic applications of branched alkanes have proved useful. For example, Pautler et al. (2014) identified that an Arctic chickweed contributed to sedimentary organic matter based on the presence of branched alkanes. Fukushima et al. (2005) used the presence of anteiso compounds to suggest a local proxy for lake acidification. Branched alkanes and the methylation index can be more useful for chemotaxonomic applications on a regional level. The fact that variation in these traits may be under strong genetic control may provide an opportunity for the deconvolution of genetic and environmental influences in the sedimentary record, in cases where branched alkanes are present.
Given the correlations between n-alkane chain lengths and climatic variables such as temperature and humidity, one might expect ACLs to be primarily influenced by environmental cues. Rather, we measured ACLs that were of intermediate heritability (0.30), suggesting a strong degree of genetic influence over alkane chain-length distributions. Within the Solanum plants of this study, we observed nearly constant ACLs. Strong genetic control implies that correlations of ACL in sedimentary alkanes with environmental variables may be a consequence of changing populations, rather than phenotypic changes within populations in response to environmental change.
The n-alkane hydrogen isotope proxy (δ2H) is assumed to record environmental information with minimal complications introduced from genetic variability. Thus, the environmental controls are assumed to be dominant over phenotypic variability. A future report will present results that examine this assumption under controlled conditions using this set of model organisms, and thus quantify the relative proportions of genetic and environmental influences over leaf wax δ2H values.
Author Contributions
ALDB and DHC planted the seeds; DHC coordinated plant maintenance in the greenhouse. All co-authors collected leaf samples. ALDB performed laboratory extractions and analysis. ALDB compiled and analyzed the data with the use of code provided by DHC; figures and tables were made by ALDB and ASB. All co-authors contributed to the study design. ALDB and ASB wrote the manuscript with the help of DHC.
Funding
Acknowledgment is made to the Donors of the American Chemical Society Petroleum Research Fund for partial support of this research through PRF grant #53417-DNI2. Partial funding for this work was provided by I-CARES, Washington University in Saint Louis. We also acknowledge the support of Washington University in St. Louis and the Donald Danforth Plant Science Center.
Conflict of Interest Statement
The authors declare that the research was conducted in the absence of any commercial or financial relationships that could be construed as a potential conflict of interest.
Acknowledgments
From assisting with plant collections to helping with isotopic analyses, laboratory manager Melanie Suess (Washington University in St. Louis) was instrumental to this project. We thank undergraduate researchers Jenny Zhang and Claire Ma (Washington University in St. Louis) for their contributions. We thank postdoctoral researchers Margaret Frank and Viktoriya Koneva (Donald Danforth Plant Science Center) and research scientist Jen Houghton (Washington University in St. Louis) for their assistance during leaf collection. We also thank David Fike and Dwight McCay (Washington University in St. Louis) for loaning and assisting with setup of the Picarro instrumentation. We thank Kevin Reilly (Donald Danforth Plant Science Center) for caring for the plants in the greenhouse, and Dani Zamir (Hebrew University, Rehovot, Israel), the Tomato Genetics Resource Center, and the lab of Neelima Sinha (University of California, Davis) for gifts of germplasm. We thank Francien Peterse and two reviewers for the comments that improved the manuscript.
Supplementary Material
The Supplementary Material for this article can be found online at: http://journal.frontiersin.org/article/10.3389/feart.2017.00047/full#supplementary-material
The R code and data sets used for modeling are available on GitHub at http://github.com/aldbender/13C-heritability.
References
Abràmoff, M. D., Hospitals, I., Magalhães, P. J., and Abràmoff, M. (2004). Image processing with Imagej. Biophotonics Int. 11, 36–42.
Benjamini, Y., and Hochberg, Y. (1995). Controlling the false discovery rate: a practical and powerful approach to multiple testing. J. R. Stat. Soc. Ser. B 57, 289–300.
Bush, R. T., and McInerney, F. A. (2013). Leaf wax n-alkane distributions in and across modern plants: implications for paleoecology and chemotaxonomy. Geochim. Cosmochim. Acta 117, 161–179. doi: 10.1016/j.gca.2013.04.016
Bush, R. T., and McInerney, F. A. (2015). Influence of temperature and C4 abundance on n-alkane chain length distributions across the central USA. Org. Geochem. 79, 65–73. doi: 10.1016/j.orggeochem.2014.12.003
Castañeda, I. S., Mulitza, S., Schefuss, E., dos Santos, R. A. L., Damste, J. S. S., and Schouten, S. (2009a). Wet phases in the Sahara/Sahel region and human migration patterns in North Africa. Proc. Natl. Acad. Sci. U. S. A. 106, 20159–20163. doi: 10.1073/pnas.0905771106
Castañeda, I. S., Werne, J. P., Johnson, T. C., and Filley, T. R. (2009b). Late Quaternary vegetation history of southeast Africa: the molecular isotopic record from Lake Malawi. Palaeogeogr. Palaeoclimatol. Palaeoecol. 275, 100–112. doi: 10.1016/j.palaeo.2009.02.008
Chitwood, D. H., Kumar, R., Headland, L. R., Ranjan, A., Covington, M. F., Ichihashi, Y., et al. (2013). A quantitative genetic basis for leaf morphology in a set of precisely defined tomato introgression lines. Plant Cell 25, 2465–2481. doi: 10.1105/tpc.113.112391
Conner, J. K., and Hartl, D. L. (2004). A Primer of Ecological Genetics. Sunderland, MA: Sinauer Associates, Inc.
Diefendorf, A. F., Freeman, K. H., Wing, S. L., and Graham, H. V. (2011). Production of n-alkyl lipids in living plants and implications for the geologic past. Geochim. Cosmochim. Acta 75, 7472–7485. doi: 10.1016/j.gca.2011.09.028
Diefendorf, A. F., and Freimuth, E. J. (2017). Extracting the most from terrestrial plant-derived n-alkyl lipids and their carbon isotopes from the sedimentary record: a review. Org. Geochem. 103, 1–21. doi: 10.1016/j.orggeochem.2016.10.016
Diefendorf, A. F., Leslie, A. B., and Wing, S. L. (2015). Leaf wax composition and carbon isotopes vary among major conifer groups. Geochim. Cosmochim. Acta 170, 145–156. doi: 10.1016/j.gca.2015.08.018
Diefendorf, A. F., Mueller, K. E., Wing, S. L., Koch, P. L., and Freeman, K. H. (2010). Global patterns in leaf 13C discrimination and implications for studies of past and future climate. Proc. Natl. Acad. Sci. U.S.A. 107, 5738–5743. doi: 10.1073/pnas.0910513107
Easlon, H. M., Nemali, K. S., Richards, J. H., Hanson, D. T., Juenger, T. E., and McKay, J. K. (2014). The physiological basis for genetic variation in water use efficiency and carbon isotope composition in Arabidopsis thaliana. Photosyn. Res. 119, 119–129. doi: 10.1007/s11120-013-9891-5
Eglinton, G., and Hamilton, R. J. (1967). Leaf Epicuticular Waxes,” Author (s): geoffrey Eglinton and Richard J. Hamilton Published by : American Association for the Advancement of Science Stable URL : http://www.jstor.org/stable/1721263. Science 156, 1322–1335.
Eglinton, T. I., Eglinton, G., Dupont, L. M., Sholkovitz, E. R., Montluçon, D., and Reddy, C. M. (2002). Composition, age, and provenance of organic matter in NW African dust over the Atlantic Ocean. Geochemistry, Geophys. Geosystems 3:27. doi: 10.1029/2001GC000269
Ehleringer, J. R., and Cooper, T. A. (1988). Correlations between carbon isotope ratio and microhabitat in desert plants. Oecologia 76, 562–566. doi: 10.1007/BF00397870
Eshed, Y., and Zamir, D. (1995). An Introgression Line Population of lycopersicon pennellii in the cultivated tomato enables the identification and fine mapping of yield-associated QTL. Genetics 141, 1147–1162.
Farquhar, G. D., Ehleringer, J. R., and Hubick, K. T. (1989). Carbon isotope discrimination and photosynthesis. Annu. Rev. Plant Physiol. Plant Mol. Biol. 40, 503–537. doi: 10.1146/annurev.pp.40.060189.002443
Feakins, S. J., Eglinton, T. I., and deMenocal, P. B. (2007). A comparison of biomarker records of northeast African vegetation from lacustrine and marine sediments (ca. 3.40 Ma). Org. Geochem. 38, 1607–1624. doi: 10.1016/j.orggeochem.2007.06.008
Feakins, S. J., Peter, B., and Eglinton, T. I. (2005). Biomarker records of late Neogene changes in northeast African vegetation. Geology 33, 977–980. doi: 10.1130/G21814.1
Fobes, J. F., Mudd, B. J., and Marsden, M. P. F. (1985). Epicuticular lipid accumulation on the leaves of lycopersicon pennellii (Corr.) D'Arcy and lycopersicon esculentum mill. Plant Physiol. 77, 567–570. doi: 10.1104/pp.77.3.567
Freeman, K. H., and Pancost, R. D. (2014). “Biomarkers for terrestrial plants and climate,” in Treatise on Geochemistry: 2nd Edn., eds H. Holland and K. Turekian (Oxford, UK: Jai-Elsevier Science Inc.), 395–416.
Fukushima, K., Yoda, A., Kayama, M., and Miki, S. (2005). Implications of long-chain anteiso compounds in acidic freshwater lake environments: inawashiro-ko in Fukushima Prefecture, Japan. Org. Geochem. 36, 311–323. doi: 10.1016/j.orggeochem.2004.07.014
Grice, K., Lu, H., Zhou, Y., Stuart-Williams, H., and Farquhar, G. D. (2008). Biosynthetic and environmental effects on the stable carbon isotopic compositions of anteiso- (3-methyl) and iso- (2-methyl) alkanes in tobacco leaves. Phytochemistry 69, 2807–2814. doi: 10.1016/j.phytochem.2008.08.024
Hou, J., D'Andrea, W. J., MacDonald, D., and Huang, Y. (2007). Evidence for water use efficiency as an important factor in determining the δD values of tree leaf waxes. Org. Geochem. 38, 1251–1255. doi: 10.1016/j.orggeochem.2007.03.011
Jetter, R., Kunst, L., and Samuels, L. (2006). “Composition of plant cuticular waxes,” in Annual Plant Reviews Volume 23: Biology of the Plant Cuticle, eds M. Riederer and C. Müller (Oxford, UK: Blackwell Publishing Ltd.), 145–181.
Lockheart, M. J., Van Bergen, P. F., and Evershed, R. P. (1997). Variations in the stable carbon isotope compositions of individual lipids from the leaves of modern angiosperms: implications for the study of higher land plant-derived sedimentary organic matter. Org. Geochem. 26, 137–153. doi: 10.1016/S0146-6380(96)00135-0
Marzi, R., Torkelson, B. E., and Olson, R. K. (1993). A revised carbon preference index. Org. Geochem. 20, 1303–1306. doi: 10.1016/0146-6380(93)90016-5
McInerney, F. A., and Wing, S. L. (2011). The Paleocene-eocene thermal maximum: a perturbation of carbon cycle, climate, and biosphere with implications for the future. Annu. Rev. Earth Planet. Sci. 39, 489–516. doi: 10.1146/annurev-earth-040610-133431
Naafs, B. D. A., Hefter, J., Acton, G., Haug, G. H., Martínez-Garcia, A., Pancost, R., et al. (2012). Strengthening of North American dust sources during the late Pliocene (2.7Ma). Earth Planet. Sci. Lett. 317–318, 8–19. doi: 10.1016/j.epsl.2011.11.026
Pautler, B. G., Austin, J., Otto, A., Stewart, K., Lamoureux, S. F., Simpson, M. J., et al. (2014). Biomarker assessment of organic matter sources and degradation in canadian high arctic littoral sediments. Biogeochemistry 100, 75–87. doi: 10.1007/s10533-009-9405-x
Pedentchouk, N., Sumner, W., Tipple, B., and Pagani, M. (2008). d13C and dD compositions of n-alkanes from modern angiosperms and conifers: an experimental set up in central Washington State, USA. Org. Geochem. 39, 1066–1071. doi: 10.1016/j.orggeochem.2008.02.005
Polissar, P. J., and D'Andrea, W. J. (2014). Uncertainty in paleohydrologic reconstructions from molecular δD values. Geochim. Cosmochim. Acta 129, 146–156. doi: 10.1016/j.gca.2013.12.021
Reddy, C. M., Eglinton, T. I., Palić, R., Benitez-Nelson, B. C., Stojanović, G., Palić, I., et al. (2000). Even carbon number predominance of plant wax n-alkanes: a correction. Org. Geochem. 31, 331–336. doi: 10.1016/S0146-6380(00)00025-5
Sachse, D., Billault, I., Bowen, G. J., Chikaraishi, Y., Dawson, T. E., Feakins, S. J., et al. (2012). Molecular paleohydrology: interpreting the hydrogen-isotopic composition of lipid biomarkers from photosynthesizing organisms. Annu. Rev. Earth Planet. Sci. 40, 221–249. doi: 10.1146/annurev-earth-042711-105535
Schauer, N., Semel, Y., Balbo, I., Steinfath, M., Repsilber, D., Selbig, J., et al. (2008). Mode of inheritance of primary metabolic traits in tomato. Plant Cell 20, 509–523. doi: 10.1105/tpc.107.056523
Schauer, N., Semel, Y., Roessner, U., Gur, A., Balbo, I., Carrari, F., et al. (2006). Comprehensive metabolic profiling and phenotyping of interspecific introgression lines for tomato improvement. Nat. Biotechnol. 24, 447–454. doi: 10.1038/nbt1192
Schubert, B. A., and Jahren, A. H. (2012). The effect of atmospheric CO2 concentration on carbon isotope fractionation in C3 land plants. Geochim. Cosmochim. Acta 96, 29–43. doi: 10.1016/j.gca.2012.08.003
Seibt, U., Rajabi, A., Griffiths, H., and Berry, J. A. (2008). Carbon isotopes and water use efficiency: sense and sensitivity. Oecologia 155, 441–454. doi: 10.1007/s00442-007-0932-7
Silverman, B. W. (1986). Density Estimation for Statistics and Data Analysis. Boca Raton, FL: Chapman & Hall/CRC.
Steinhauser, M.-C., Steinhauser, D., Gibon, Y., Bolger, M., Arrivault, S., Usadel, B., et al. (2011). Identification of enzyme activity quantitative trait loci in a Solanum lycopersicum x Solanum pennellii introgression line population. Plant Physiol. 157, 998–1014. doi: 10.1104/pp.111.181594
Tipple, B. J., and Pagani, M. (2010). A 35Myr North American leaf-wax compound-specific carbon and hydrogen isotope record: implications for C4 grasslands and hydrologic cycle dynamics. Earth Planet. Sci. Lett. 299, 250–262. doi: 10.1016/j.epsl.2010.09.006
Toubiana, D., Semel, Y., Tohge, T., Beleggia, R., Cattivelli, L., Rosental, L., et al. (2012). Metabolic profiling of a mapping population exposes new insights in the regulation of seed metabolism and seed, fruit, and plant relations. PLoS Genet. 8, 1–22. doi: 10.1371/journal.pgen.1002612
Yeats, T. H., Buda, G. J., Wang, Z., Chehanovsky, N., Moyle, L. C., Jetter, R., et al. (2012). The fruit cuticles of wild tomato species exhibit architectural and chemical diversity, providing a new model for studying the evolution of cuticle function. Plant J. 69, 655–666. doi: 10.1111/j.1365-313X.2011.04820.x
Keywords: n-alkanes, iso-alkanes, anteiso-alkanes, tomato, introgression line, QTL, stable carbon isotopes
Citation: Bender ALD, Chitwood DH and Bradley AS (2017) Heritability of the Structures and 13C Fractionation in Tomato Leaf Wax Alkanes: A Genetic Model System to Inform Paleoenvironmental Reconstructions. Front. Earth Sci. 5:47. doi: 10.3389/feart.2017.00047
Received: 21 February 2017; Accepted: 29 May 2017;
Published: 13 June 2017.
Edited by:
Francien Peterse, Utrecht University, NetherlandsReviewed by:
Marco Griepentrog, Ghent University, BelgiumAaron Diefendorf, University of Cincinnati, United States
Copyright © 2017 Bender, Chitwood and Bradley. This is an open-access article distributed under the terms of the Creative Commons Attribution License (CC BY). The use, distribution or reproduction in other forums is permitted, provided the original author(s) or licensor are credited and that the original publication in this journal is cited, in accordance with accepted academic practice. No use, distribution or reproduction is permitted which does not comply with these terms.
*Correspondence: Amanda L. D. Bender, YmVuZGVyQGxldmVlLnd1c3RsLmVkdQ==
†Present Address: Daniel H. Chitwood, Independent Researcher, Santa Rosa, CA, United States