 Chen Zhao
 Tim Li1,2*
 Tomoe Nasuno
- 1Key Laboratory of Meteorological Disaster, Ministry of Education, Joint International Research Laboratory of Climate and Environmental Change, Collaborative Innovation Center on Forecast and Evaluation of Meteorological Disasters, Nanjing University of Information Science and Technology, Nanjing, China
- 2International Pacific Research Center and Department of Atmospheric Sciences, School of Ocean and Earth Science and Technology, University of Hawaii at Manoa, Honolulu, HI, United States
- 3Application Laboratory, Japan Agency for Marine-Earth Science and Technology, Yokohama, Japan
- 4Department of Seamless Environmental Prediction Research, Japan Agency for Marine-Earth Science and Technology, Yokohama, Japan
The intraseasonal oscillation (ISO) of atmospheric temperature at 2 m over East Asia (EA) in boreal summer is investigated through NCEP-NCAR reanalysis data for the period of 1979–2013. It is found that the surface air temperature in EA propagates on a 10–30-day time scale and exhibits a southeastward propagation characteristic. The average zonal and meridional phase speed of the intraseasonal air temperature anomaly is about 2.6° longitude and 1.7° latitude per day, respectively. The advection by the mean wind and the advection of the summer mean temperature by the intraseasonal wind primarily contribute to the propagation of the intraseasonal temperature perturbation through the diagnosis of the temperature budget. An upper-tropospheric geopotential positive (negative) height anomaly is closely associated with a low-level warmer (cooler) air temperature anomaly and both anomalies propagate southeastward in a similar way. A wave activity flux analysis reveals that mid-latitude Rossby wave energy also propagates southeastward, consistent with the upper-tropospheric geopotential height propagation. This indicates that in addition to low-level advection mechanism, upper-tropospheric forcing through the hydrostatic relationship is another possible mechanism. A further statistical analysis indicates that heat waves in EA summer are modulated by the southeastward-propagating intraseasonal temperature mode.
Introduction
The Intraseasonal Oscillation (ISO) is one of the dominant modes in tropical atmosphere. In northern winter, tropical ISO is characterized by eastward-propagating Madden-Julian Oscillation (MJO), with the horizontal structure of a coupled Rossby-Kelvin wave couplet (Hendon and Salby, 1994; Li and Wang, 1994; Wang and Li, 1994; Maloney and Hartmann, 1998) and a westward tilting vertical structure in vertical velocity and specific humidity fields (Sperber, 2003; Kiladis et al., 2005; Hsu and Li, 2012). The initiation of MJO convection was often found in western Indian Ocean (IO) (Zhao et al., 2013; Li et al., 2015). In northern summer, on the other hand, tropical ISO is characterized by northward propagations in the Indian monsoon and South China Sea regions (Yasunari, 1979; Hartmann and Michelsen, 1989; Gadgil and Srinivasan, 1990; Jiang et al., 2004) and northwestward propagation over the western North Pacific (Hsu and Weng, 2001; Li and Wang, 2005). Besides its pronounced seasonality, tropical ISO also has a significant impact on tropical cyclone activities (e.g., Maloney and Hartmann, 1998, 2000a,b; Hall et al., 2001; Ho et al., 2006; Camargo et al., 2009; Chen et al., 2009; Klotzbach, 2010, 2014; Cao et al., 2014). High-frequency wind activity associated with ISO may help trigger El Nino–Southern Oscillation (ENSO) events (Lengaigne et al., 2004; Seiki and Takayabu, 2007).
The influence of tropical ISO is not only confined to the tropics. It can significantly modulate the ISO over the mid-high latitudes (Liebmann and Hartmann, 1984; Lau and Phillips, 1986; Kawamura et al., 1996; Pan and Li, 2008; Lin et al., 2009). Kawamura et al. (1996) suggested that with barotropic Rossby wave energy dispersion, tropical ISO convection near the Philippine Sea could remotely affect mid-latitude intraseasonal variability. Pan and Li (2008) found that the midlatitude low-frequency flow responded to the tropical ISO focing through the feedback of synoptic eddy. Lin et al. (2009) suggested that tropical ISO could affect the North Atlantic Oscillation (NAO) through northward momentum and energy transport by Rossby waves from tropical Pacific all the way to the mid-latitude North Atlantic.
In addition to the tropical forcing, the origin of the mid-latitude ISO may arise from local air-sea interaction (Wang et al., 2012) or local internal atmospheric dynamics (Terao, 1998; Wang et al., 2013; Yang et al., 2013; Yang and Li, 2016; Yao et al., 2016). For example, by examining the cause of intraseasonal SST variability over Kuroshio extension region, Wang et al. (2012) found that the intraseasonal SST variability arose from atmospheric forcing primarily through the change of surface heat fluxes, whereas the SST anomaly could further feed back to the atmospheric low-frequency mode through the modulation of atmospheric convective instability. Through the diagnosis of atmospheric reanalysis data and idealized numerical experiments, Wang et al. (2013) showed that local processes were the major source of mid-latitude ISO variability, while the tropical forcing could explain about 20% of the total intraseasonal variance in mid-latitudes. Yang and Li (2016) showed that the intraseasonal temperature perturbation in northern winter propagated southeastward in Eurasia Continent and ISO perturbations gained energy from the mean flow through the conversion between potential and kinetic energy. Yao et al. (2016) suggested that the Arctic Oscillation (AO) might influence the East Asian winter monsoon (EAWM) through the change of meridional circulation, and cause the intraseasonal temperature variation in East Asia.
It is likely that the intraseasonal variability of near surface temperature in boreal summer may have a strong impact on extreme weather events such as heat waves in the densely populated area of East Asia. For example, a persistent hot event in boreal summer can cause serious droughts and heat-related sickness and death (Semenza et al., 1996; Fouillet et al., 2006; Huang et al., 2010). Therefore, an accurate forecast of such a persistent extreme event is of great importance (Robertson et al., 2015; S2S Extreme Workshop, 20161). The ISO with its low-frequency period can provide an important precursor signal for extended-range (10–30-day) forecast (Lin, 2013; Hsu et al., 2015; Zhu and Li, 2017). Such extended-range forecast may fill a gap between short-range weather and seasonal prediction, and give valuable guidance on agricultural planning and disaster prevention and reduction. Motivated by this social need, the present study attempts to investigate processes that control the intraseasonal variability of surface air temperature over East Asia in boreal summer.
The remainder of this paper is structured as follows. Section Data and Method describes the data and methods utilized in this study. The structure and evolution features of intraseasonal near-surface temperature anomaly are examined in section Features of Structure and Evolution of Intraseasonal Temperature Anomaly. The causes of the southeastward propagation of the intraseasonal surface temperature signal are discussed in section Southeastward Propagation Mechanisms. The modulation of the ISO signal on the frequency of heat waves in eastern China is depicted in section Modulation of the Summer ISO Mode on Heat Waves. Finally, conclusions and discussions are given in section Conclusions and Discussions.
Data and Method
The National Centers for Environment Prediction (NECP)-National Center for Atmospheric Research (NCAR) reanalysis data (2.5° × 2.5°) are used for the years 1979–2013. Daily zonal wind (u), meridional wind (v), geopotential height (Z), and temperature (T) are utilized in this analysis.
The intraseasonal (10–30-day) signals was extracted by the Lanczos band-pass filter (Duchon, 1979). Before the band-pass filtering, the climatological annual cycle is first removed from the original data. The 10–30-day filtering is selected on the basis of the power spectrum analysis of the temperature at 2 m over EA in boreal summer (May–September). It is noted that the dominant spectral peak of the temperature anomaly appears in the 10–30-day band. An empirical orthogonal function (EOF) analysis is further used to examine the spacial and temporal patterns of the intraseasonal surface air temperature field.
To understand the cause of propagation of the low-level intraseasonal temperature anomaly, a heat budget analysis is conducted. The temperature tendency equations is written as
where V is horizontal wind vector, ω is p-vertical velocity, ∇ is the horizontal gradient operator, α is the specific volume of air, cp denotes the specific heat of air, and Q1 represents the rate of diabatic heating. A prime denotes a vertical integrated (1000–700 hPa) intraseasonal (10–30 day) component.
Features of Structure and Evolution of Intraseasonal Temperature Anomaly
The analysis of the raw temperature field at 2 m in the domain of 0°–60°N, 100°E–140°E during 1979–2013 was first conducted. The first EOF mode (Figure 1A) explains 20.2% of the total variance, and displays a positive center in Lake Baikal and a weak negative center in southeast of China. The second EOF mode (Figure 1B) explains 14.5% of the total variance, exhibiting a strong negative center in northern China and a positive center in the Lake Baikal. A spectral analysis displays that both the first and second principal components (PC1, PC2) with significant spectral peaks in the 10–30-day band (Figures 2A,B). Thus, we will center on examining the temperature variability on this timescale throughout the remainder of this paper.
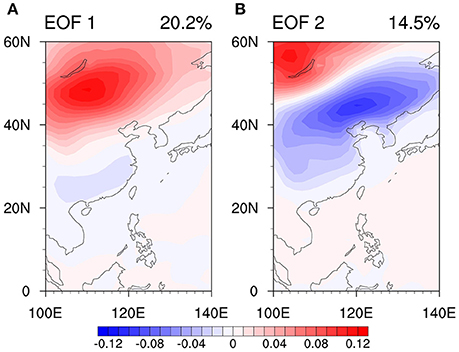
Figure 1. The first EOF mode (A) and second EOF mode (B) of raw air temperature field at 2 m (unit: K; with the annual cycle removed) in boreal summer.
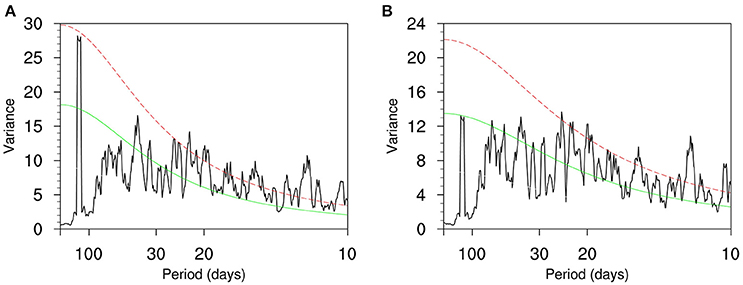
Figure 2. Power spectral of principal components of the EOF1 (A) and EOF2 (B) modes shown in Figure 1. The red and green lines represent spectral density of 0.05 significant level and red noise, respectively.
Figures 3A,B shows the EOF patterns of the 10–30-day filtered temperature at 2 m. As one can see, the patterns are same as those in Figure 1, indicating that indeed the 10–30-day mode is dominant. For the filtered data, the first two EOF modes explain 25.9% and 17.5% of the variance, which are larger than those of the raw data as expected. Lag correlations between PC1 and PC2 are presented in Figure 3C. PC2 tends to lead (lag) PC1 by about 4 days with a maximum positive (negative) correlation and the maximum correlations exceed a 95% confidence level. The result suggests that the first two EOF modes are two phases of the same propagating pattern.
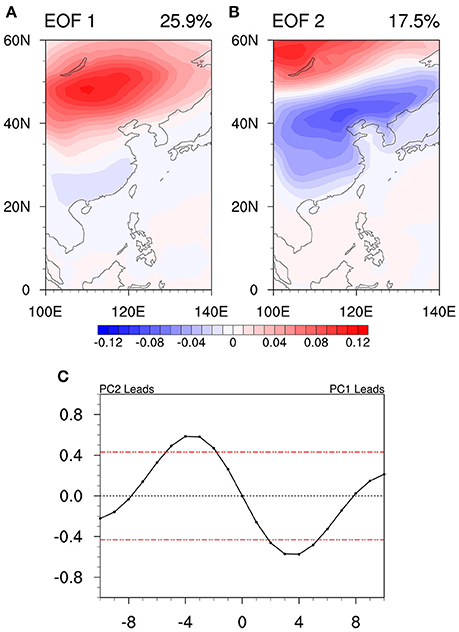
Figure 3. The first EOF mode (A) and the second EOF mode (B) of the 10–30-day filtered air temperature at 2 m in boreal summer (unit: K); (C) The lead-lag correlation coefficients between two leading EOF principal components PC1 and PC2. The red dashed line represents a 95% significance level.
Figure 4 shows the evolution pattern of the intraseasonal temperature field from day −8 to day +10 (with a 2-day interval). The evolution pattern is derived based on the difference between the strong positive ISO and strong negative ISO composites. Here the definition of a strong positive (negative) event is based on the standardized PC1 that exceeds +1.5 (−1.5). Day 0 denotes the day on which the distribution of the intraseasonal temperature anomaly is consistent with that in EOF1 (Figure 3A). During the 35-year period, a total of 119 positive events and 102 negative events are selected. At day −8, a warm center is located at the east of Ural Mountains. A black dot in Figure 4 represents the center of the maximum positive temperature anomaly. The warm center moves southeastward. At day −4 the warm center arrives to 52°N, 95°E, and the anomalous temperature pattern is similar to that of EOF2 (Figure 3B). The intraseasonal temperature anomaly reaches to its peak at day 0 when it arrives to 49°N, 112°E. After that, it decays as it continues propagating southward into southeastern China.
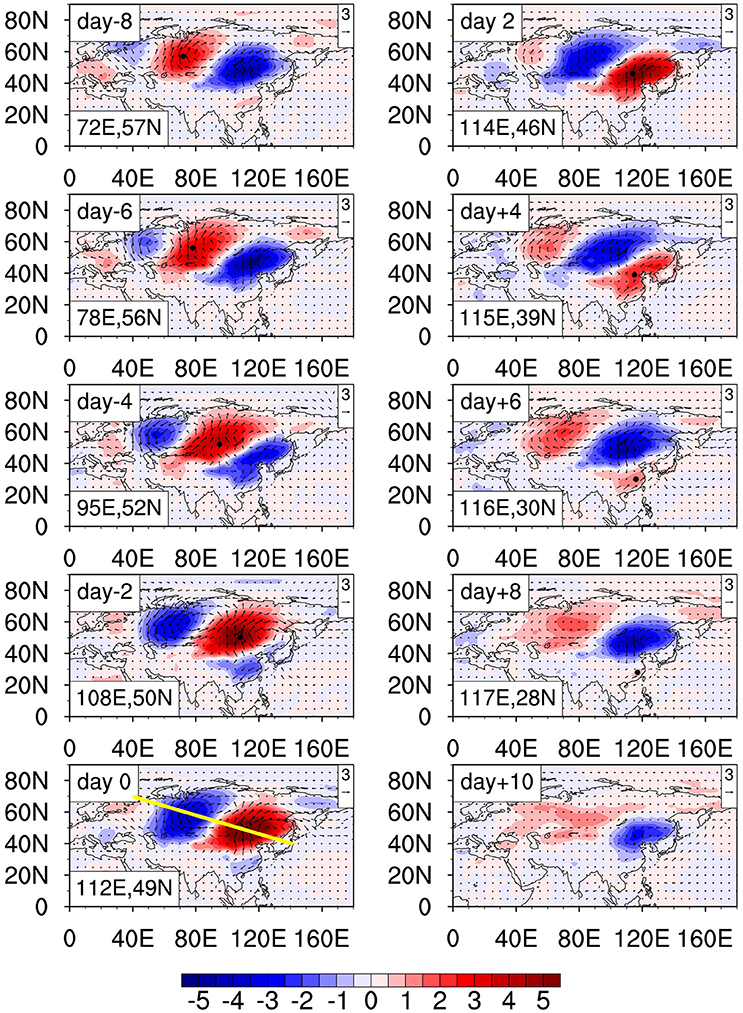
Figure 4. Evolution of the composite 10–30-day filtered air temperature at 2 m (shading, unit: K) and wind at 850 hPa (vector, unit: m s−1) from day −8 to day +10, with an interval of 2 days. The black dots represent the center of the maximum positive temperature anomalies associated with the southeastward propagation. The latitudinal and longitudinal values of the dots are shown at the left bottom corner of each panel. The yellow line is determined by a point (70°N, 40°E) and another point (40°N, 140°E).
It is interesting to note that at a given pressure level, southerly (northerly) anomalies are apparently in phase with the warm (cold) center. As a result, an anticyclone anomaly appears to the east of the warm center. From day −8 to day 8, an anticyclone anomaly moves from the north of Novosibirsk to southern China, closely associated with the temperature perturbation. To better estimate the propagation speed we plotted the maximum intraseasonal temperature center from day −8 to day 8 in Figure 5. The temperature centers exhibit a clear southeastward propagation feature, with primarily zonal (meridional) propagation in the first (second) half of the period. The cause of this southward turning track might be related to the topographic effect of the Tibet Plateau. The average zonal and meridional phase speed for the entire period is 2.6° longitude and 1.7° latitude per day, respectively.
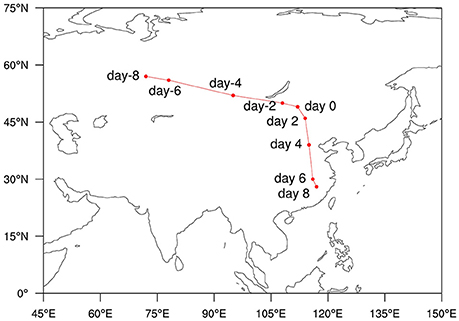
Figure 5. Tracks of the composite 10–30-day filtered maximum temperature centers at 2 m from day −8 to day +8, with an interval of 2 days. The red dots are same as the black dots shown in Figure 4.
Figure 6 displays the vertical profiles of the 10–30-day filtered geopotential height (Z′), temperature (T′) and vertical velocity fields along yellow line at day 0 in Figure 4. As shown (Figure 6), a maximum geopotential height anomaly located near 250 hPa and a warm (cold) anomaly center appears above (below) the negative height center. The Z′ field is northwestward tilted with height, with the surface low- (high-) pressure peaking to the quarter wavelength east of the 250 hPa trough (ridge). The tilted structure indicates poleward heat transport under the basic meridional temperature gradient, as typical mid-latitude wave disturbances. Upward motion is rooted around the southeastern part of the surface low pressure anomaly, where the southerly anomaly and westerly anomaly (Figure 4) are formed, and a positive correlation between the upward motion and warm anomalies is observed. This structure suggests energy conversion from available potential energy into kinetic energy and a self-maintaining mechanism of this wave-like mode. Considering the fact that precipitation often coexists with a westerly anomaly in the Asian monsoon region (Fu et al., 2002; Li and Wang, 2005), this is suggestive of diabatic heating with the upward motion in the southwestern part of the maximum surface warm anomaly.
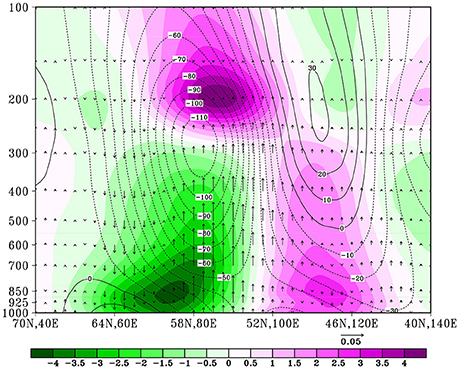
Figure 6. The vertical profiles of composite 10–30-day filtered geopotential height (contour; unit: gpm), temperature (shading; unit: K), and vertical velocity (vector; unit: Pa s−1) anomalies along yellow line at day 0 in Figure 4.
To examine whether or not the upper-tropospheric intraseasonal height signal is closely associated with the southeastward-propagating low-level temperature signal, we plotted the temporal evolutions of composite Z′ patterns at 250 hPa from day −8 to day 10 (Figure 7). It is interesting to note that Z′ displays a wave train pattern with a southeastward propagation characteristic, which closely resembles the surface temperature propagation characteristic. Such an upper-lower troposphere connection is physically through the hydrostatic relationship.
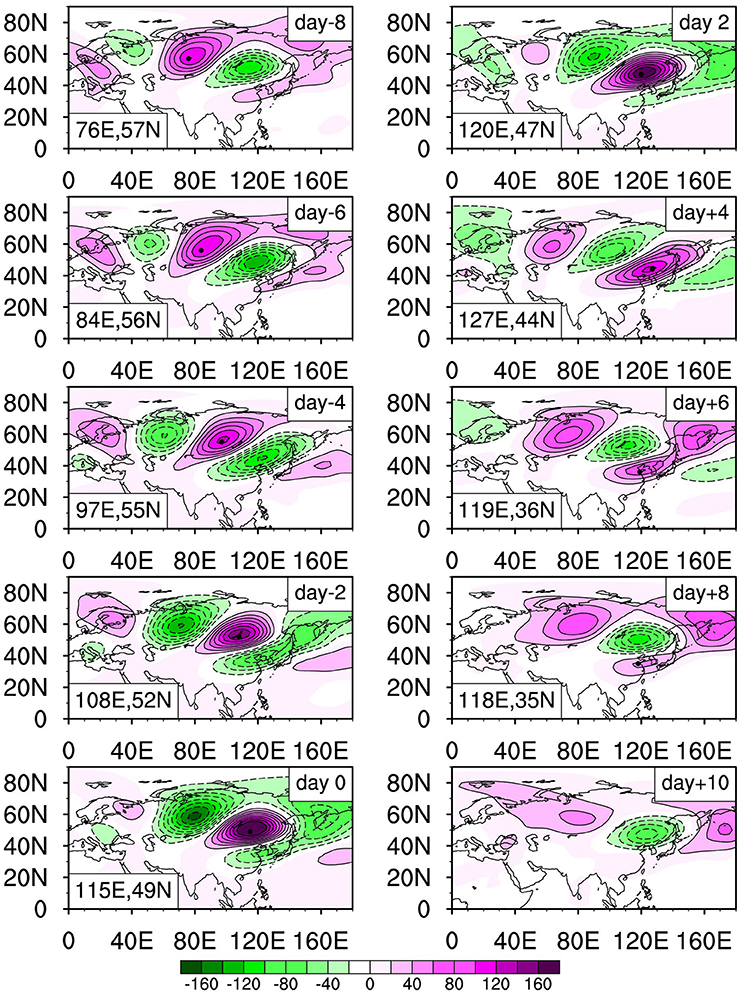
Figure 7. As in Figure 4, but for 10–30-day filtered geopotential height anomaly (shading; unit: gpm) at 250 hPa from day −8 to day +10.
Southeastward Propagation Mechanisms
To understand specific processes responsible for southeastward propagation of the intraseasonal temperature anomaly, we take two different approaches. Firstly, a heat budget analysis is performed to reveal the cause of southeastward tendency of the temperature anomaly at low-level.
Figure 8A illustrates the horizontal patterns of vertical (1000–700 hPa) integrated intraseasonal temperature anomaly field (T′) and the temperature tendency field (∂T′/∂t) at day −3. Note that a positive ∂T′/∂t center appears to the southeast of the positive center of T′. Physically, one may argue that the temperature perturbation tends to move southeastward because of this southeastward shift of ∂T′/∂t. To explore what causes this southeastward temperature tendency, we conduct a vertical (1000–700 hPa) integrated temperature budget analysis in the domain of 44°N–53°N, 105°E–120°E (red box in Figure 8). Figure 8B shows the contribution from each of the temperature budget terms. It is found that the largest positive contribution is anomalous horizontal temperature advection (−V·∇T)′ term.
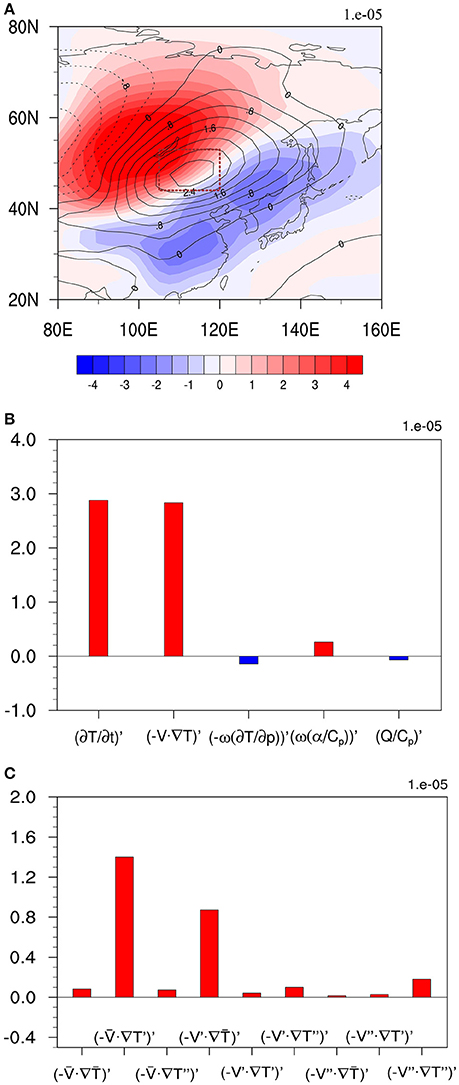
Figure 8. (A) The vertically (1000–700 hPa) integrated intraseasonal temperature anomaly (shading; unit: K) and ∂T′/∂t (contour; unit: K s−1) at day −3. A red dotted box (44°N–53°N, 105°E–120°E) is the key analysis region for ∂T′/∂t. (B) The temperature budget terms averaged in the red box region at day −3. (C) Individual components of the anomalous horizontal temperature advection.
To further reveal specific horizontal advection processes that give rise to the positive tendency, both temperature and wind fields are divided into low- (with a period longer than 30 days) and high (with a period less than 10 days) frequency component, and an intraseasonal (10–30-day) component,
where an bar, a single prime and a double prime denote the low-frequency, ISO and high-frequency component, respectively.
The anomalous horizontal advection term can be separated into 9 terms based on Equation (2). Figure 8C presents the contributions from the 9 terms. It is found that the maximum positive contribution arises from the advection of the temperature anomaly by the mean flow (−T′)′. The second-largest positive contribution is the advection of the mean temperature by the ISO flow (−)′.
Figure 9A shows the horizontal patterns of the temperature anomaly (T′), the mean wind field (), and (−)′averaged from 1000 to 700 hPa. The center of the positive T′ is located around Lake Baikal, whereas the mean wind is in general northwesterly over the key analysis region (44°N–53°N, 105°E–120°E). Thus, the mean northwesterly advects the positive temperature anomaly southeastward, leading to a positive ∂T′/∂t southeast of the positive T′ center. Whereas, the maximum center of term (−)′ is located at the red box region, which indicates its role in the propagation, another anomalous horizontal temperature advection term (−)′ is shifted slightly northwestward (Figure 9B), indicating that it contributes to both the propagation and amplification of the intraseasonal temperature anomaly. The mean temperature is high (low) to the south (north). The anomalous wind V′ at low level displays a wave train pattern, with a cyclonic center at 60°N, 80°E and an anticyclonic center at 53°N, 120°E. To the west of the anticyclonic center, the anomalous wind V′ is dominated by southerly. The positive tendency in Figure 9B is partially overlapped with the warm anomaly, indicating the amplification of the anomaly. This is consistent with westward tilting vertical structure in lower troposphere (Figure 6). This may account for the manifestation of this intraseasonal variation as a self-sustained mode.
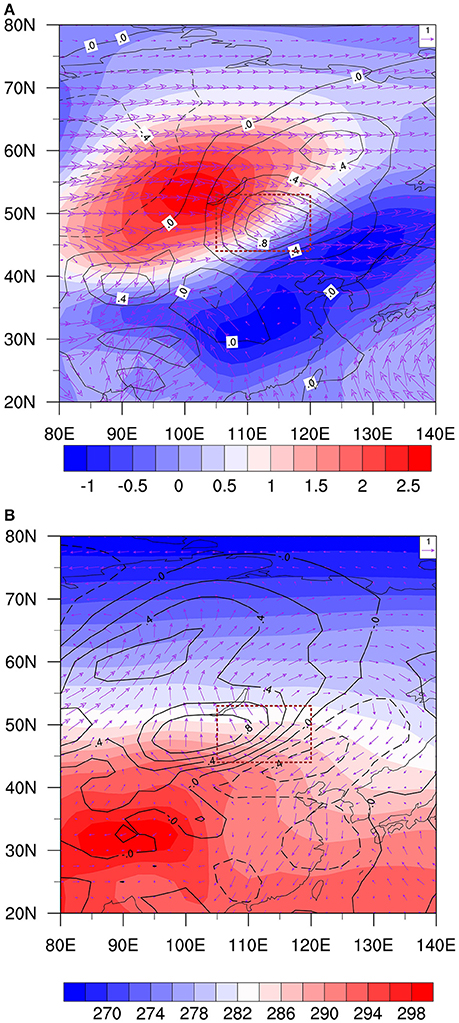
Figure 9. (A) Vertically integrated (1000–700 hPa) intraseasonal temperature T′ field (shading; unit: K), the mean wind field (vector, unit: m s−1) and the anomalous horizontal temperature advection term ()′ (contour; unit: K s−1). (B) Vertically integrated low-frequency temperature field (shading; unit: K), the intraseasonal wind field V′ (vector, unit: m s−1) and the anomalous temperature advection term )′(contour; unit: K s−1) for day −3 composite. The red box is same as in Figure 8A.
To illustrate how the low-level wave train pattern relates to the upper-level one, we plotted the composite geopotential height and wind fields at both 850 and 250 hPa in Figure 10. In upper-troposphere, a positive height center and its associated anticyclonic flow are located at Lake Baikal. The corresponding low-level positive height center and anticyclonic flow are located to the southeast of Lake Baikal (Figure 10B). Thus, the anomalous circulation field appears to tilt westward with height. While the positive height anomaly at 250 hPa and the positive surface temperature anomaly satisfy the hydrostatic relationship (Figures 8A,9A), the vertical tilting leads to an in phase relationship between the low-level southerly and warm anomalies (Figure 4). It is the low-level southerly anomalies that advect high mean temperature from south and cause the amplification and propagation of the temperature perturbation.
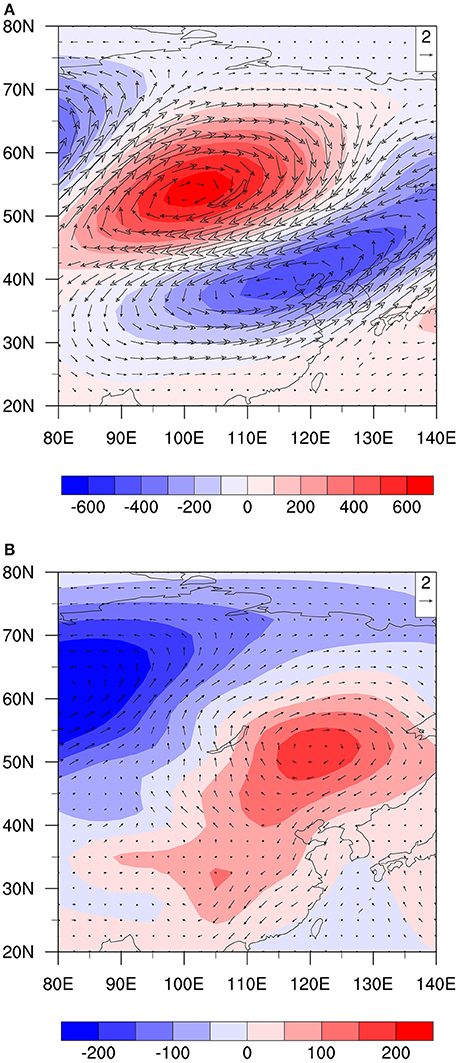
Figure 10. The composite intraseasonal wind field (vector, unit: m s−1) and geopotential height field (shading, unit: gpm) at 250 hPa (A) and 850 hPa (B) at day −3.
To sum up, the low-level temperature budget analysis above reveals that two low-level advection processes may be responsible for the southeastward propagation. In addition, the upper-tropospheric process may also play a role.
To understand the origin of the southeastward propagation of the upper-tropospheric wave train, a diagnosis of phase-independent wave activity flux based on Takaya and Nakamura (2001) is calculated.
where a bar and a prime represent the low-frequency and intraseasonal anomaly respectively. Ψ denotes the streamfuction field and U = (u, v) denotes the horizontal wind field, and W represents the 2D Rossby wave activity flux.
The horizontal wave activity flux field at 250 hPa from day −10 to day 0 is plotted in Figure 11. The wave activity flux calculated here represents Rossby wave energy propagation. It is interesting to note that there are pronounced southeastward wave activity fluxes over the mid-high latitude Eurasia. This suggests that the Rossby wave energy dispersion is a major source for the southeastward propagating geopotential height in the upper troposphere. In other words, the upper-tropospheric wave train shown in Figure 7 results from Rossby wave energy dispersion. Given the close relationship between the upper-level height anomaly and the low-level temperature anomaly (through the hydrostatic relationship), it is proposed that upper-tropospheric wave propagation may be regarded as an additional mechanism for the southeastward movement of near surface temperature perturbation.
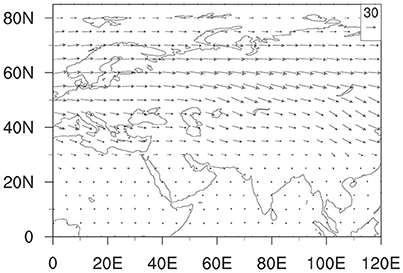
Figure 11. Horizontal distribution of the wave activity flux (vector; unit: m2s−2) field at 250 hPa averaged from day −10 to day 0.
Modulation of the Summer ISO Mode on Heat Waves
Heat waves associated with persistent high temperature events in summer are known to have notable effects on the human mortality and ecosystems. To define the occurrence of heat waves, a percentile-based threshold is adopted, following Meehl and Tebaldi (2004). A heat wave event is defined when daily temperature exceeds 97.5th percentile and prolongs for at least 3 days.
To elucidate the influences of the intraseasonal temperature variation on heat waves in eastern China (25°N–45°N, 110°E–120°E), the most populated region in China, the 10–30-day oscillation signals of the surface air temperature averaged over the eastern China domain is extracted again by the Lanczos band-pass filter. The active (inactive) phase of the intraseasonal temperature anomaly is defined based on the normalized temperature time series, with amplitude greater (less) than one standard deviation considered as an active (inactive) phase.
Two methods are used to define heat wave events. Firstly, the heat wave is defined by daily temperature above 97.5th percentile in the entire summer season with total 5355 days. With use of this method, 35 heat wave events are identified for 1979–2013. Among them 19 heat wave events occurred in active phase of ISO and none happened in inactive phase of ISO (see Table 1).

Table 1. Numbers of total heat wave events and heat wave events in the active and inactive phase of ISO in eastern China based on 97.5th percentile threshold for the entire summer season (May–September) during 1979–2013.
The second method is based on the 97.5th percentile of daily temperature in each month. A 5-day running mean is applied before calculating the 97.5th percentile threshold. The total heat wave events and their occurrence in the active (inactive) phase of ISO are shown in Table 2. There are total 57 heat waves identified with use of Method 2, among which there are 34 heat wave events in the active phase of ISO. Again no heat wave event is observed in the inactive phase of ISO.
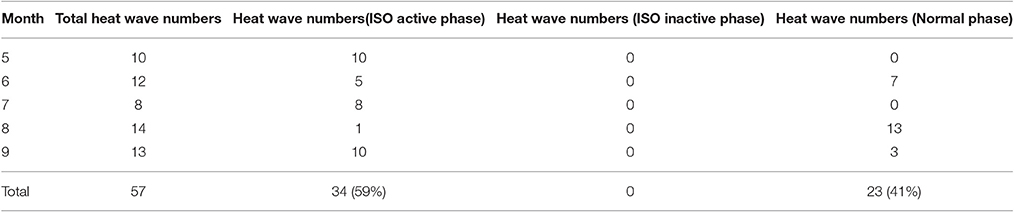
Table 2. Numbers of total heat wave events and heat wave events in the active and inactive phase of ISO in eastern China based on 97.5th percentile threshold for each month during 1979–2013.
The difference between two methods lies primarily in that the heat wave events identified in Method 1 are mostly confined in August while heat wave events identified in Method 2 may occur in other months. Both the methods indicate that more than 50% of total heat wave events occurred in the active phase of ISO, whereas none of the heat wave events appear in the inactive phase of ISO. This indicates that the intraseasonal temperature variation studied here greatly modulates the occurrence of heat wave events in eastern China. Given the precursory signals of the intraseasonal temperature mode, one may predict the active and inactive phases of the mode and thus potential occurrence of heat waves in advance, using either statistical or dynamical approaches.
Conclusions and Discussions
The structure and propagation features of temperature on an intraseasonal (10–30-day) time scale at 2 m over East Asia during the boreal summer are investigated using NCEP-NCAR reanalysis data. Based on EOF, lead-lag correlation, and composite analyses, we found that the intraseasonal temperature anomaly in East Asia exhibits a pronounced southeastward propagation. The temperature signal propagates southeastward at an averaged zonal and meridional speed phase of 2.6° longitude and 1.7° latitude per day, respectively.
Associated with the southeastward propagation of the intraseasonal surface temperature signal, the geopotential height anomaly also propagates southeastward. The low-level temperature and upper-level height anomalies are well-coupled due to the hydrostatic relationship, with a warm (cold) center associated with a positive (negative) height anomaly at 250 hPa.
The lower-tropospheric heat budget analysis is conducted to examine the mechanism of southeastward propagating intraseasonal temperature anomaly. It indicates that the southeastward temperature tendency is primarily attributed to anomalous horizontal advection. A further diagnosis shows that the anomalous horizontal advection is mainly induced by the advection of the intraseasonal temperature anomaly by the mean flow and the advection of the mean temperature by the ISO flow. The latter may also contribute to the amplification and maintenance of the intraseasonal temperature perturbation.
In addition to low-level advective processes, upper-tropospheric forcing also plays a role. A calculation of wave activity flux illustrates that the Rossby wave energy dispersion contributes to the set up of a northwest-southeast oriented wave train pattern and is responsible for the southeastward propagating geopotential height anomaly. The upper-tropospheric geopotential height anomaly may force a warm or cold anomaly below through the hydrostatic relationship. Thus, the upper-tropospheric forcing may serve as an additional mechanism for the southeastward propagation of the low-level temperature perturbation.
From a quasi-stationary Rossby wave points of view, the horizontal and vertical structures of the dominant ISO mode in this study are similar to those found in a case study by Terao (1998, 1999) and the “silk road pattern,” a dominant mode of interannual variability (Kosaka, 2011; Kosaka et al., 2011) of the quasi-stationary Rossby waves over the Eurasian Continent in the boreal summer. The wave activity flux convergence also suggests that the upper tropospheric Rossby wave packets are the origin of the eastward-propagating ISO mode. An interesting characteristic of this ISO mode is the in-phase relationship between the upper tropospheric height anomaly and the near surface temperature anomaly. Our analysis suggests that a self-sustaining mechanism with a northwestward tiled vertical structure similar to the mid-latitude synoptic wave disturbances plays a role in the manifestation of this ISO mode [e.g., (−)′]. Interestingly, a similar tilted structure was also found by Terao (1998) and Kosaka (2011). Given the manifestation of the wave-train like structure with an ISO time scale, the eastward advection of the temperature perturbation by the mean westerly [e.g., (−)′] accounts for a major tendency for the propagation. The selection of the ISO time scale is likely related to the slow phase propagation speed of the intraseasonal temperature mode.
The statistical relationship between the active phase of the aforementioned intraseasonal temperature mode and heat wave frequency in eastern China is analyzed. It is found that more than 50% heat wave events occurred in the active phase of the ISO, whereas no heat wave events occur in the inactive phase of the ISO. Thus, the intraseasonal temperature mode studied here does play an important role in regulating the occurrence of heat wave events in eastern China, making it possible for extended-range heat wave forecast in eastern China.
Author Contributions
TL designed this work; CZ wrote the manuscript; SY, TN, and SB revised it critically for important intellectual content.
Conflict of Interest Statement
The authors declare that the research was conducted in the absence of any commercial or financial relationships that could be construed as a potential conflict of interest.
Acknowledgments
This work is jointly supported by 973 projects 2015CB453200 and 2017YFA0603802, NSFC grants 41630423 and 41575043, NSF grant AGS-16-43297, NRL grant N00173-16-1-G906, JAMSTEC JIJI project, Jiangsu Shuang-Chuang Team (R2014SCT001), the priority academic program development of Jiangsu Higher Education institutions (PAPD), and Jiangsu project (BK20150062). This is SOEST contribution number 10078, IPRC contribution number 1277, and ESMC number 170.
Footnotes
1. ^S2S Extreme Workshop in 2016 (at Columbia University) http://iri.columbia.edu/s2s-extremes-workshop-2016/.
References
Camargo, S. J., Wheeler, M. C., and Sobel, A. H. (2009). Diagnosis of the MJO modulation of tropical cyclogenesis using an empirical index. J. Atmos. Sci. 66, 3061–3074. doi: 10.1175/2009JAS3101.1
Cao, X., Li, T., Peng, M., Chen, W., and Chen, G. (2014). Effects of monsoon trough intraseasonal oscillation on tropical cyclogenesis over the western North Pacific. J. Atmos. Sci. 71, 4639–4660. doi: 10.1175/JAS-D-13-0407.1
Chen, T.-C., Wang, S.-Y., Yen, M.-C., and Clark, A. J. (2009). Impact of the intraseasonal variability of the western north pacific large-scale circulation on tropical cyclone tracks. Weather Forecast. 24, 646–666. doi: 10.1175/2008WAF2222186.1
Duchon, C. E. (1979). Lanczos filtering in one and two dimensions. J. Appl. Meteorol. 18, 1016–1022. doi: 10.1175/1520-0450(1979)018<1016:LFIOAT>2.0.CO;2
Fouillet, A., Rey, G., Laurent, F., Pavillon, G., Bellec, S., Guihenneuc-Jouyaux, C., et al. (2006). Excess mortality related to the August 2003 heat wave in France. Int. Arch. Occup. Environ. Health 80, 16–24. doi: 10.1007/s00420-006-0089-4
Fu, X., Wang, B., and Li, T. (2002). Impacts of air–sea coupling on the simulation of mean Asian summer monsoon in the ECHAM4 model. Mon. Weather Rev. 130, 2889–2904. doi: 10.1175/1520-0493(2002)130<2889:IOASCO>2.0.CO;2
Gadgil, S., and Srinivasan, J. (1990). Low frequency variation of tropical convergence zones. Meteorol. Atmos. Phys. 44, 119–132. doi: 10.1007/BF01026814
Hall, J. D., Matthews, A. J., and Karoly, D. J. (2001). The modulation of tropical cyclone activity in the Australian region by the Madden–Julian Oscillation. Mon. Weather Rev. 129, 2970–2982. doi: 10.1175/1520-0493(2001)129<2970:TMOTCA>2.0.CO;2
Hartmann, D. L., and Michelsen, M. L. (1989). Intraseasonal periodicities in indian rainfall. J. Atmos. Sci. 46, 2838–2862. doi: 10.1175/1520-0469(1989)046<2838:IPIIR>2.0.CO;2
Hendon, H. H., and Salby, M. L. (1994). The life cycle of the Madden–Julian Oscillation. J. Atmos. Sci. 51, 2225–2237. doi: 10.1175/1520-0469(1994)051<2225:TLCOTM>2.0.CO;2
Ho, C.-H., Kim, J.-H., Jeong, J.-H., Kim, H.-S., and Chen, D. (2006). Variation of tropical cyclone activity in the South Indian Ocean: El Niño–Southern Oscillation and Madden-Julian Oscillation effects. J. Geophys. Res. 111:D22101. doi: 10.1029/2006JD007289
Hsu, H.-H., and Weng, C.-H. (2001). Northwestward propagation of the intraseasonal oscillation in the Western North Pacific during the boreal summer: structure and mechanism. J. Clim. 14, 3834–3850. doi: 10.1175/1520-0442(2001)014<3834:NPOTIO>2.0.CO;2
Hsu, P., and Li, T. (2012). Role of the boundary layer moisture asymmetry in causing the eastward propagation of the Madden–Julian Oscillation*. J. Clim. 25, 4914–4931. doi: 10.1175/JCLI-D-11-00310.1
Hsu, P.-C., Li, T., You, L., Gao, J., and Ren, H.-L. (2015). A spatial–temporal projection model for 10–30 day rainfall forecast in South China. Clim. Dyn. 44, 1227–1244. doi: 10.1007/s00382-014-2215-4
Huang, W., Kan, H., and Kovats, S. (2010). The impact of the 2003 heat wave on mortality in Shanghai, China. Sci. Tot. Environ. 408, 2418–2420. doi: 10.1016/j.scitotenv.2010.02.009
Jiang, X., Li, T., and Wang, B. (2004). Structures and mechanisms of the northward propagating boreal summer intraseasonal oscillation*. J. Clim. 17, 1022–1039. doi: 10.1175/1520-0442(2004)017<1022:SAMOTN>2.0.CO;2
Kawamura, R., Murakami, T., and Wang, B. (1996). Tropical and mid-latitude 45-DAY perturbations over the Western Pacific during the northern summer. J. Meteorol. Soc. Jpn. Ser. II 74, 867–890. doi: 10.2151/jmsj1965.74.6_867
Kiladis, G. N., Straub, K. H., and Haertel, P. T. (2005). Zonal and vertical structure of the Madden–Julian Oscillation. J. Atmos. Sci. 62, 2790–2809. doi: 10.1175/JAS3520.1
Klotzbach, P. J. (2010). On the Madden–Julian Oscillation–Atlantic Hurricane relationship. J. Clim. 23, 282–293. doi: 10.1175/2009JCLI2978.1
Klotzbach, P. J. (2014). The Madden–Julian oscillation's impacts on worldwide tropical cyclone activity. J. Clim. 27, 2317–2330. doi: 10.1175/JCLI-D-13-00483.1
Kosaka, Y. (2011). The silk road pattern revisited. Tenki 58, 519–531. Available online at: https://projects.repo.nii.ac.jp/?action=pages_view_main&active_action=repository_view_main_item_detail&item_id=73022&item_no=1&page_id=13&block_id=21
Kosaka, Y., Xie, S.-P., and Nakamura, H. (2011). Dynamics of interannual variability in summer precipitation over East Asia. J. Clim. 24, 5435–5453. doi: 10.1175/2011JCLI4099.1
Lau, K.-M., and Phillips, T. J. (1986). Coherent fluctuations of fxtratropical geopotential height and tropical convection in intraseasonal time scales. J. Atmos. Sci. 43, 1164–1181. doi: 10.1175/1520-0469(1986)043<1164:CFOFGH>2.0.CO;2
Lengaigne, M., Guilyardi, E., Boulanger, J.-P., Menkes, C., Delecluse, P., Inness, P., et al. (2004). Triggering of El Niño by westerly wind events in a coupled general circulation model. Clim. Dyn. 23, 601–620. doi: 10.1007/s00382-004-0457-2
Li, T., and Wang, B. (1994). The influence of sea surface temperature on the tropical intraseasonal oscillation: a numerical study. Mon. Wea. Rev. 122, 2349–2362. doi: 10.1175/1520-0493(1994)122<2349:TIOSST>2.0.CO;2
Li, T., and Wang, B. (2005). A review on the western North Pacific monsoon: synoptic-to-interannual variabilities. Terr. Atmos. Ocean Sci. 16, 285–314. doi: 10.3319/TAO.2005.16.2.285(A)
Li, T., Zhao, C., Hsu, P., and Nasuno, T. (2015). MJO initiation processes over the tropical Indian Ocean during DYNAMO/CINDY2011. J. Clim. 28, 2121–2135. doi: 10.1175/JCLI-D-14-00328.1
Liebmann, B., and Hartmann, D. L. (1984). An observational study of tropical–midlatitude interaction on intraseasonal time scales during winter. J. Atmos. Sci. 41, 3333–3350.
Lin, H. (2013). Monitoring and predicting the intraseasonal variability of the East Asian–western North Pacific summer monsoon. Mon. Weather Rev. 141, 1124–1138. doi: 10.1175/MWR-D-12-00087.1
Lin, H., Brunet, G., and Derome, J. (2009). An observed connection between the North Atlantic Oscillation and the Madden–Julian oscillation. J. Clim. 22, 364–380. doi: 10.1175/2008JCLI2515.1
Maloney, E. D., and Hartmann, D. L. (1998). Frictional moisture convergence in a composite life cycle of the Madden–Julian oscillation. J. Clim. 11, 2387–2403.
Maloney, E. D., and Hartmann, D. L. (2000a). Modulation of eastern North Pacific hurricanes by the Madden–Julian oscillation. J. Clim. 13, 1451–1460. doi: 10.1175/1520-0442(2000)013<1451:MOENPH>2.0.CO;2
Maloney, E. D., and Hartmann, D. L. (2000b). Modulation of hurricane activity in the Gulf of Mexico by the Madden-Julian oscillation. Science 287, 2002–2004. doi: 10.1126/science.287.5460.2002
Meehl, G. A., and Tebaldi, C. (2004). More intense, more frequent, and longer lasting heat waves in the 21st century. Science 305, 994–997. doi: 10.1126/science.1098704
Pan, L.-L., and Li, T. (2008). Interactions between the tropical ISO and midlatitude low-frequency flow. Clim. Dyn. 31, 375–388. doi: 10.1007/s00382-007-0272-7
Robertson, A. W., Kumar, A., Peña, M., and Vitart, F. (2015). Improving and promoting subseasonal to seasonal prediction. Bull. Am. Meteorol. Soc. 96, ES49–ES53. doi: 10.1175/BAMS-D-14-00139.1
Seiki, A., and Takayabu, Y. N. (2007). Westerly wind bursts and their relationship with intraseasonal variations and ENSO. Part I: statistics. Mon. Weather Rev. 135, 3325–3345. doi: 10.1175/MWR3477.1
Semenza, J. C., Rubin, C. H., Falter, K. H., Selanikio, J. D., Flanders, W. D., Howe, H. L., et al. (1996). Heat-related deaths during the July 1995 heat wave in Chicago. N. Engl. J. Med. 335, 84–90.
Sperber, K. R. (2003). Propagation and the vertical structure of the Madden–Julian oscillation. Mon. Weather Rev. 131, 3018–3037. doi: 10.1175/1520-0493(2003)131<3018:PATVSO>2.0.CO;2
Takaya, K., and Nakamura, H. (2001). A formulation of a phase-independent wave-activity flux for stationary and migratory quasigeostrophic eddies on a zonally varying basic flow. J. Atmos. Sci. 58, 608–627. doi: 10.1175/1520-0469(2001)058<0608:AFOAPI>2.0.CO;2
Terao, T. (1998). Barotropic disturbances on intraseasonal time scales observed in the midlatitudes over the Eurasian continent during the northern summer. J. Meteorol. Soc. Jpn. Ser. II 76, 419–436.
Terao, T. (1999). Relationships between the quasi-stationary Rossby waves in the subtropical jet and mass and heat transport in the northern periphery of the Tibetan high. J. Meteorol. Soc. Jpn. Ser II 77, 1271–1286.
Wang, B., and Li, T. (1994). Convective interaction with boundary-layer dynamics in the development of a tropical intraseasonal system. J. Atmos. Sci. 51, 1386–1400.
Wang, L., Li, T., and Zhou, T. (2012). Intraseasonal SST variability and air–sea interaction over the Kuroshio Extension region during boreal summer. J. Clim. 25, 1619–1634. doi: 10.1175/JCLI-D-11-00109.1
Wang, L., Li, T., Zhou, T., and Rong, X. (2013). Origin of the intraseasonal variability over the North Pacific in boreal summer. J. Clim. 26, 1211–1229. doi: 10.1175/JCLI-D-11-00704.1
Yang, S., and Li, T. (2016). Intraseasonal variability of air temperature over the mid-high latitude Eurasia in boreal winter. Clim. Dyn. 47, 2155–2175. doi: 10.1007/s00382-015-2956-8
Yang, S., Wu, B., Zhang, R., and Zhou, S. (2013). The zonal propagating characteristics of low-frequency oscillation over the Eurasian mid-high latitude in boreal summer. Sci. China Earth Sci. 56, 1566–1575. doi: 10.1007/s11430-012-4576-z
Yao, S., Sun, Q., Huang, Q., and Chu, P. (2016). The 10–30-day intraseasonal variation of the East Asian winter monsoon: the temperature mode. Dyn. Atmos. Oceans 75, 91–101. doi: 10.1016/j.dynatmoce.2016.07.001
Yasunari, T. (1979). Cloudiness fluctuations associated with the Northern Hemisphere summer monsoon. J. Meteorol. Soc. Jpn. Ser. II 57, 227–242.
Zhao, C., Li, T., and Zhou, T. (2013). Precursor signals and processes associated with MJO initiation over the tropical Indian Ocean. J. Clim. 26, 291–307. doi: 10.1175/JCLI-D-12-00113.1
Keywords: East Asia, intraseasonal oscillation, air temperature at 2 m, southeastward propagation, heat wave
Citation: Zhao C, Li T, Yao S, Behera SK and Nasuno T (2017) Intraseasonal Variability of Air Temperature Over East Asia in Boreal Summer. Front. Earth Sci. 5:63. doi: 10.3389/feart.2017.00063
Received: 15 May 2017; Accepted: 19 July 2017;
Published: 04 August 2017.
Edited by:
Vincent Moron, Aix-Marseille University, FranceReviewed by:
Eduardo Zorita, Helmholtz-Zentrum Geesthacht Centre for Materials and Coastal Research (HZ), GermanyDaoyi Gong, Beijing Normal University, China
Copyright © 2017 Zhao, Li, Yao, Behera and Nasuno. This is an open-access article distributed under the terms of the Creative Commons Attribution License (CC BY). The use, distribution or reproduction in other forums is permitted, provided the original author(s) or licensor are credited and that the original publication in this journal is cited, in accordance with accepted academic practice. No use, distribution or reproduction is permitted which does not comply with these terms.
*Correspondence: Tim Li, dGltbGlAaGF3YWlpLmVkdQ==