 Florian Steinbach1*
 Ernst-Jan N. Kuiper2,3
 Jan Eichler1,2
 Paul D. Bons1
 Martyn R. Drury3
 Albert Griera4Gill M. Pennock3
 Ilka Weikusat1,2
- 1Department of Geosciences, Eberhard Karls University Tübingen, Tübingen, Germany
- 2Alfred Wegener Institute Helmholtz Centre for Polar and Marine Research, Bremerhaven, Germany
- 3Department of Geosciences, Utrecht University, Utrecht, Netherlands
- 4Departament de Geologia, Universitat Autònoma de Barcelona, Barcelona, Spain
The flow of ice depends on the properties of the aggregate of individual ice crystals, such as grain size or lattice orientation distributions. Therefore, an understanding of the processes controlling ice micro-dynamics is needed to ultimately develop a physically based macroscopic ice flow law. We investigated the relevance of the process of grain dissection as a grain-size-modifying process in natural ice. For that purpose, we performed numerical multi-process microstructure modeling and analyzed microstructure and crystallographic orientation maps from natural deep ice-core samples from the North Greenland Eemian Ice Drilling (NEEM) project. Full crystallographic orientations measured by electron backscatter diffraction (EBSD) have been used together with c-axis orientations using an optical technique (Fabric Analyser). Grain dissection is a feature of strain-induced grain boundary migration. During grain dissection, grain boundaries bulge into a neighboring grain in an area of high dislocation energy and merge with the opposite grain boundary. This splits the high dislocation-energy grain into two parts, effectively decreasing the local grain size. Currently, grain size reduction in ice is thought to be achieved by either the progressive transformation from dislocation walls into new high-angle grain boundaries, called subgrain rotation or polygonisation, or bulging nucleation that is assisted by subgrain rotation. Both our time-resolved numerical modeling and NEEM ice core samples show that grain dissection is a common mechanism during ice deformation and can provide an efficient process to reduce grain sizes and counter-act dynamic grain-growth in addition to polygonisation or bulging nucleation. Thus, our results show that solely strain-induced boundary migration, in absence of subgrain rotation, can reduce grain sizes in polar ice, in particular if strain energy gradients are high. We describe the microstructural characteristics that can be used to identify grain dissection in natural microstructures.
Introduction
Knowledge of the properties and processes controlling the flow of ice is essential to understand ice sheet dynamics. Ice sheets creep under gravitational forces (Petrenko and Whitworth, 1999) and their macroscopic flow is affected by properties of individual ice crystals, such as crystallographic preferred orientation (CPO) and grain size (Bader, 1951; Steinemann, 1954; Budd and Jacka, 1989; Van Der Veen and Whillans, 1990; Mangeney et al., 1997; Ng and Jacka, 2014). Ice crystals in ice sheets are thought to mainly accommodate deformation by viscoplastic glide and climb of intracrystalline lattice defects, which is known as dislocation creep (Shoji and Higashi, 1978; Pimienta and Duval, 1987). On Earth, the only stable ice polymorph is hexagonal ice Ih, which has a significant viscoplastic anisotropy. The glide resistance on the basal plane, which is perpendicular to the c-axis, is at least 60 times lower than that on the prismatic and pyramidal glide planes (Duval et al., 1983). With deformation, c-axes align in the direction of maximum finite shortening (Azuma and Higashi, 1985) causing a macroscopic mechanical anisotropy of the polycrystalline aggregate (Gao and Jacka, 1987; Budd and Jacka, 1989).
Dislocation creep depends on the CPO and is grain size insensitive. However, other deformation mechanisms such as grain boundary sliding or diffusion creep are known to depend on grain sizes (Raj and Ashby, 1972; Shoji and Higashi, 1978) and may be strain rate controlling at low stresses (Goldsby and Kohlstedt, 1997, 2001; Pettit and Waddington, 2003). An understanding of grain size evolution in ice sheets including all relevant processes and proposed models (Durand et al., 2006; Ng and Jacka, 2014) is essential to include the full suite of deformation mechanisms into ice flow modeling.
In various deep ice cores, grain size is observed to increase with depth until a stable value is reached (Li et al., 1998; Montagnat et al., 2012; Fitzpatrick et al., 2014). Where drill cores penetrate the glacial to Holocene transition, a distinct decrease in grain size and increase in CPO strength is found (Faria et al., 2014a; Montagnat et al., 2014; Weikusat et al., 2017a and references therein). The North Greenland Eemian Ice Drilling (NEEM) ice core reflects this typical microstructural evolution. In NEEM, a relatively stable grain size of about 10 to 12 mm2 is observed below a depth of ca. 400 m, but the CPO progressively strengthens further down (Kipfstuhl, 2010; Weikusat and Kipfstuhl, 2010; Binder, 2014; Montagnat et al., 2014). A distinct change toward strongly aligned c-axes that form an elongated, vertical single maximum is observed at the transition from Holocene to glacial ice at 1,400 m depth (Binder, 2014; Montagnat et al., 2014). In the glacial ice, the grain sizes are smaller and more variable than in Holocene ice. This is observed to correlate with higher impurity load in glacial ice. However, the relation of grain size and CPO with impurities is still under discussion (Eichler et al., 2017).
The grain size in ice results from a combination of grain growth and grain-size-reducing mechanisms. The downward increase in grain size in shallow ice toward stable grain sizes implies a stronger relative contribution of grain-size-reducing mechanisms when stable grain sizes are achieved. As ice in ice sheets mostly deforms at temperatures close to its pressure melting point, recrystallization is expected to accompany viscoplastic deformation (Duval, 1979; Jacka and Li, 1994; Kipfstuhl et al., 2009). Recrystallization includes rotation of crystal lattices, as well as grain boundary migration and/or formation of new grain boundaries (Faria et al., 2014b).
The migration of grain boundaries during normal grain-growth (NGG) is driven by surface energy minimisation (Smith, 1964; Weaire and Rivier, 1984; Duval, 1985; Alley et al., 1986a,b; De La Chapelle et al., 1998). NGG leads to an increase of mean grain area with time and equidimensional grains with slightly curved grain boundaries forming 120° angles at grain boundary triple junctions. Strain-induced boundary migration (SIBM), however, is driven by strain energies that result from the elastic lattice distortion caused by dislocations (Humphreys and Hatherly, 2004, pp. 251–253). During SIBM, grain boundaries migrate toward highly strained areas in adjacent grains and leave behind dislocation-free regions. This usually causes irregular grain boundaries and bulges toward high-energy regions (Means, 1981). SIBM in ice is assumed to cause increasing grain sizes (Duval and Castelnau, 1995) and has been termed dynamic grain-growth when combined with NGG (Urai and Jessell, 2001; Faria et al., 2014a,b).
During recovery, dislocations arrange in lower energy configurations (White, 1977; Urai et al., 1986). This leads to the gradual transformation of low-angle dislocation walls into subgrain boundaries (Weikusat et al., 2017b) and eventually into new high-angle grain boundaries. This process of rotational recrystallization or polygonisation leads to a grain size reduction (Alley et al., 1995; Roessiger et al., 2011). The formation of new grains by spontaneous nucleation is a further mechanism of grain-size reduction, but is thought to be very unlikely in the absence of strong chemical driving forces, as is the case for ice (Drury and Urai, 1990; Humphreys and Hatherly, 2004; Faria et al., 2014b). During bulging nucleation, small grains separate from the serrated grain boundary formed by SIBM assisted by subgrain rotation. Bulging nucleation is suggested to reduce grain sizes in ice (Duval and Castelnau, 1995; De La Chapelle et al., 1998; Montagnat et al., 2015) and is observed in creep tests on columnar ice at high temperatures and stresses (Chauve et al., 2017). The deformation-induced recrystallization mechanisms (SIBM, polygonisation and nucleation) are together termed dynamic recrystallization. Of these mechanisms, SIBM and polygonisation are thought to be dominant in glaciers and ice sheets.
While bulging recrystallization driven by SIBM assisted by other processes can reduce grain sizes in ice, SIBM in isolation is generally assumed to result in a grain-size increase in glaciology. However, SIBM has been observed to decrease grain size in deformation experiments on rock analogs by Means (1983, cf. Figure 4 therein) and Urai (1983, cf. Figure 14 therein). Both studies observed SIBM with rapidly migrating bulges, eventually migrating through a grain and splitting it into two parts when reaching an opposite grain boundary. This causes an effective mean grain-size reduction by forming two “new” grains with similar CPO. Resulting groups of grains with similar orientation were called “orientation families” by Urai (1983). This process was termed grain dissection by Urai et al. (1986) and Urai (1987) is known as geometric dynamic recrystallization in metallurgy (Humphreys and Hatherly, 2004, pp. 461–465; De Meer et al., 2002; Figure 1). Grain dissection is readily observed, if time-resolved microstructure evolution is available, corresponding movies of grain dissection in rock analogs are presented by Urai and Humphreys (2000). Grain dissection is only effective when the grain size is similar to the size of grain-boundary bulges. At larger grain sizes, bulges cannot reach the other side of a grain and polygonisation or bulging nucleation would dominate. At smaller grain sizes, bulges sweep over a whole grain and thus remove it, which leads to a mean grain-size increase. It follows that grain dissection is most effective at a stable grain size, when polygonisation and grain dissection operate in conjunction.
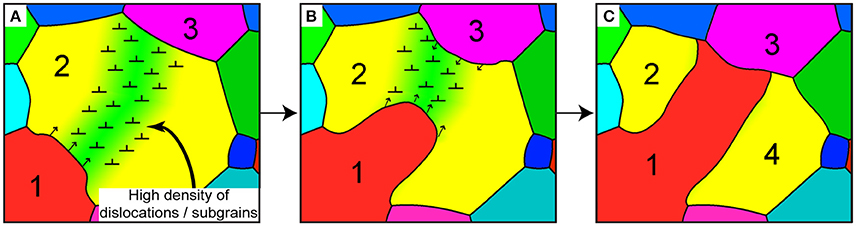
Figure 1. Schematic illustration of the grain dissection process according to Means (1983) and Urai (1983). (A) A bulge of grain 1 is migrating into a high dislocation-density area to reduce locally high strain energies in grain 2. (B) The bulge of grain 1 is migrating further through the high strain-energy area of grain 2. (C) The bulge ultimately reaches grain 3, dividing grain 2 into two grains. Bulging stops due to low energy gradients and driving forces between grain 1 and 3. The new grain 4 and grain 2 are characterized by a similar lattice orientation; an orientation family.
Grain dissection has not yet been explicitly observed in natural ice microstructures. Breton et al. (2016) report grain dissection in deformation experiments on laboratory-prepared ice and suspect a grain-size-reducing character. So far, it is assumed that stable grain sizes in ice are achieved by an interplay of dynamic grain-growth, polygonisation and potentially nucleation processes (Alley et al., 1995; De La Chapelle et al., 1998; Montagnat and Duval, 2000; Mathiesen et al., 2004; Roessiger et al., 2011; Chauve et al., 2017; Hidas et al., 2017). However, in rock analogs and bischofite, grain dissection is observed as an effective grain-size-reducing process, in particular at steady-state grain sizes (Jessell, 1986; Urai, 1987).
In this study, we investigate whether grain dissection is a relevant process during ice microdynamics. We consider the role of grain dissection in the grain size evolution in glacier/ice sheet ice and assess under which conditions it can potentially be an efficient grain-size-reducing mechanism. We use two approaches: (1) micro-dynamical modeling using the Elle microstructure-modeling platform coupled to a full-field crystal viscoplasticity code (VPFFT) and (2) microstructure and crystallographic orientation maps of natural ice. We use natural ice samples from NEEM ice core as it represents microstructural behavior typical for various other ice cores and a sufficiently large microstructural dataset from NEEM ice core is readily available. We denote ice deposited in the last glacial period, i.e. after Eemian, but before Holocene, “glacial ice” and ice deposited in the Holocene “Holocene ice.”
Methods
Microstructural Modeling
The Elle Modeling Platform
The open-source numerical modeling platform Elle (Jessell et al., 2001; Bons et al., 2008; Piazolo et al., 2010) is optimized to model coupled or interacting microstructural processes. Elle was applied in various studies on ice microstructures, such as single and polyphase grain-growth (Roessiger et al., 2011, 2014). The full-field crystal viscoplasticity code (VPFFT) by Lebensohn (2001) coupled to Elle was used to simulate strain localisation, dynamic recrystallization and folding in ice with and without air bubbles (Bons et al., 2016; Jansen et al., 2016; Llorens et al., 2016a,b; Steinbach et al., 2016).
Here, only the essentials of the modeling approaches for deformation and recrystallization are summarized. For more detail on the principles of Elle, the reader is referred to Jessell et al. (2001) and Bons et al. (2008), for the VPFFT code to Lebensohn (2001), and for the coupling of both codes to Griera et al. (2013). Details on the grain boundary migration and recovery codes are presented in Becker et al. (2008) and Borthwick et al. (2014), respectively. The Elle/VPFFT algorithms to model dynamic recrystallization can be found in Llorens et al. (2016a) and Steinbach et al. (2016). If not indicated differently, we used previously published input parameters for our numerical models (see Llorens et al., 2016a,b; Steinbach et al., 2016). The basic simulation setup is summarized in Table 1, whereas Table 2 contains more detailed information on the input parameters.
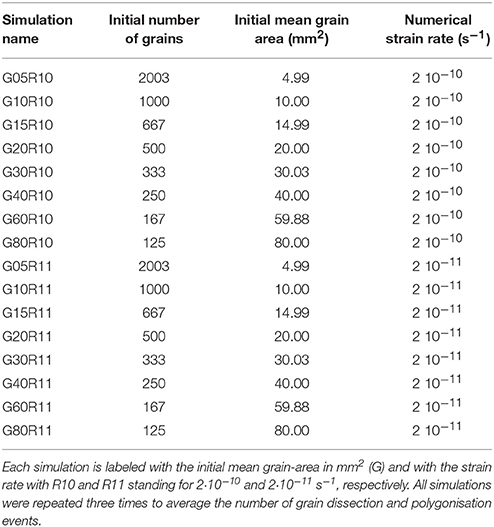
Table 1. Overview of the settings of the numerical simulations.
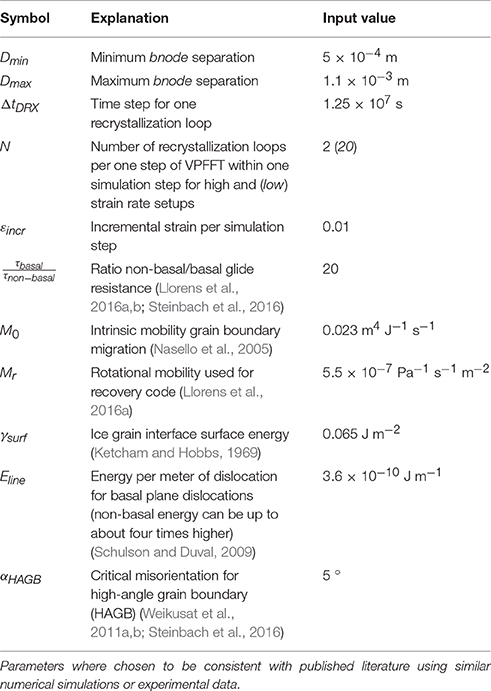
Table 2. Overview of crucial input parameters used for the numerical simulations.
Microstructure Discretisation
In Elle, the two-dimensional microstructure of polycrystalline ice is discretised in a set of contiguous polygons, called flynns, in a cell with fully wrapping and periodic boundaries. The flynns are defined by straight boundaries than link boundary nodes (bnodes) in either double- or triple junctions. The bnodes are successively moved to achieve grain boundary migration. During grain boundary migration, the development of quadruple or higher-order bnode junctions is not allowed, as well as island flynns with only one surrounding neighbor flynn. To store intracrystalline properties, such as crystal orientation, local stresses, strain rates or dislocation densities, a set of unconnected nodes (unodes) is superimposed on the flynn network. For our simulations, the unodes are arranged in a regular grid of 256 × 256 unodes, which is a requirement of VPFFT. Crystal orientations are mapped onto unodes using Euler triplet angles following the Bunge convention (Bunge, 1982).
Topology checks are carried out at all times during the simulations to ensure compliance with topological restrictions (see Figure 2). The topology checks maintain the resolution defined by the set minimum (0.5 mm) and maximum (1.1 mm) bnode separation. A new topological check allows for grain dissection: Two unconnected (non-neighboring) double-junction bnodes are merged if they approach closer than the set minimum separation (Figure 2, c). This effectively splits the flynn adjacent to both bnodes, into two daughter flynns, which constitutes a grain dissection event. A dissection is not performed if less than three bnodes are between the two non-neighboring bnodes, as this would lead to an unviable daughter flynn (Figure 2, d). The number of dissection events is tracked throughout the simulation.
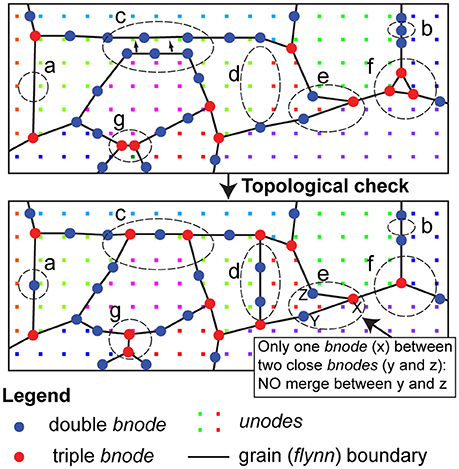
Figure 2. Microstructure discretisation and topological events necessary if bnodes move due to deformation or grain boundary migration. Insertion (a) and deletion (b) of a bnode to keep a constant resolution (c) Merging two non-neighboring bnodes, this numerically defines grain dissection (d) Insertion of new grain boundary by polygonisation between unode clusters above a critical misorientation (e) No merging of two non-neighboring bnodes as number of other bnodes between the two close bnodes is < 3 (f) Deletion of small flynn containing no unodes (g) Neighbor switch in triple bnodes.
Modeling Crystal Viscoplasticity and Dynamic Recrystallization
The full-field crystal viscoplasticity code (VPFFT) is based on calculating the stress field from kinematically admissible velocity fields that minimizes the average local work-rate under compatibility and equilibrium constraints (Lebensohn, 2001; Lebensohn et al., 2009; Griera et al., 2013). VPFFT assumes intracrystalline deformation in ice Ih accommodated by dislocation glide on basal, pyramidal and prismatic slip systems. The non-linear viscous, rate-dependent flow law predicts the strain rate and stress at each point in the computational grid defined by unodes. The non-basal slip resistance is set 20 times higher than for basal slip (Table 2) as a compromise between accuracy and computational efficiency. Systematic trial simulations for the studies by Llorens et al. (2016a,b, 2017) and Steinbach et al. (2016) showed that with the use a ratio of 20 instead of 60 does not significantly alter the microstructural evolution. A significant effect on the number of grain dissection events is therefore considered unlikely.
Since the strain rate and stress fields are initially unknown, VPFFT uses an iterative spectral solver based on the Fast Fourier Transformation. VPFFT computes the viscoplastic response for a short time-step during which velocities are assumed constant. The updated lattice orientations are remapped onto the rectangular unode grid and the displacement field is applied to all bnodes. Furthermore, geometrically necessary dislocation-densities are calculated by means of the plastic-strain gradient following Brinckmann et al. (2006). Following Gao et al. (1999), the plastic strain gradient is calculated from the partial derivatives of the plastic strain tensors, which are calculated by VPFFT.
The strain energy at a given position is a function of the dislocation density ρ and the dislocation line energy ED, which is proportional to square of the Burgers' vector length of the respective dislocation type (Humphreys and Hatherly, 2004, pp. 17–18). In ice Ih, the Burgers' vector of non-basal dislocations is approximately two times longer compared to basal ones (Hondoh, 2000). Hence, non-basal dislocations can provide about four times higher strain energies. Previous numerical models by Llorens et al. (2016a,b) and Steinbach et al. (2016) assume all dislocations are on basal planes and at constant Burgers' vector length, which underestimates strain energies. Here, we use an updated approach that scales the strain energies to the non-basal activity in each unode which is predicted by VPFFT to allow up to about four times higher strain energies due to the presence of non-basal dislocations.
Following each VPFFT step, recrystallization is modeled using Elle. Each recrystallization step comprises successive steps of discrete implementations of grain boundary migration, recovery and polygonisation. Each mechanism is modeled using a fixed numerical time step and temperature (see section Simulation Setup; Tables 1, 2 for input parameters). For numerical stability reasons, the order in which the discrete implementations are performed on the numerical microstructure is first polygonisation, followed by grain boundary migration and recovery. This loop is repeated until the numerical time for the recrystallization processes equals the one envisaged for one deformation increment by VPFFT, which determines the numerical strain rate (see Steinbach et al., 2016 and Figure 2 therein). As the numerical time steps and the resulting microstructural changes per step are low, we assume that the effective microstructural response is not significantly different from conditions during which the mechanisms operate concurrently.
Grain boundary migration is modeled using a front-tracking approach moving individual bnodes toward lower energy positions (cf. Becker et al., 2008; Llorens et al., 2016a). In this energy minimisation approach, the bnode displacement is calculated from multiplying its velocity with a fixed time step (section Simulation Setup; Table 2). The bnode velocity is proportional to the grain boundary mobility and driving force. The temperature dependant mobility is calculated following Nasello et al. (2005) by using an Arrhenius term with an experimentally derived intrinsic mobility and activation energy. The driving force is calculated from the change in local surface- and strain-energy that result from a change in position of that bnode. These energy fields are determined with four trial positions close to the actual bnode position. The change in surface energy is due to a change in length of the grain-boundary segments to neighboring bnodes. The change in strain energy results from reducing the strain energy to zero in the area swept by the bnode and its adjoining boundary segments.
For the recovery mechanism, an energy minimisation approach is used that, analogous to the grain-boundary migration approach, calculates the lattice re-orientation with a rotational mobility term (Moldovan et al., 2001; Borthwick et al., 2014; Llorens et al., 2016a). The approach is based on decreasing the lattice misorientation between two unodes toward a lower energy configuration (see Borthwick et al. (2014) and Llorens et al. (2016a) for details). Recovery reduces the local dislocation density proportional to the decrease in lattice misorientation and allows the development of subgrains. The subgrains are defined as unode clusters with a certain minimum misorientation with neighboring clusters. The polygonisation routine detects these clusters and adds new high-angle grain boundaries defined by bnodes, if the cluster misorientation is above a critical angle. This is done by Voronoi decomposition of the unode clusters using the Voronoi points surrounding the cluster as new bnodes (Steinbach et al., 2016). We use a critical angle of 5° to be consistent with both published numerical studies (Steinbach et al., 2016; Llorens et al., 2017) and subgrain boundary quantifications by Weikusat et al. (2011a,b), who report critical angles from 3° to 5° for ice Ih. A lower critical angle would slightly increase the amount of polygonisation. However, lower critical angles reduce numerical stability as the amount of topological errors is increased.
Simulation Setup
The simulation setup comprises two numerical strain rates applied to eight model setups with different initial mean grain-areas (Table 1). Each initial microstructure was discretised in a 14.14 × 7.07 cm box (ratio height/width = 2) and deformed under pure shear conditions to approximately 50% vertical shortening at incremental strains of 0.5% over 140 time-steps. Different strain rates were achieved by varying the number of recrystallization loops per strain increment. Two or 20 recrystallization loops, per 1.25 · 107s time, per VPFFT strain increment of 0.5%, achieved strain rates of 2 · 10−10s−1 or 2 · 10−11s−1, respectively. The time step was chosen as a compromise between numerical stability and computational efficiency. The achieved strain rates are higher than reported for the NEEM ice core, where the estimated mean vertical strain rate is 3.2 · 10−12 s−1 (Montagnat et al., 2014). Therefore, the numerical strain rates are only qualitatively comparable with natural strain rates (Steinbach et al., 2016). The temperature in the simulations was set to −30°C, which is comparable to Holocene ice conditions in NEEM ice core (Sheldon et al., 2014). The initial grain sizes were set by varying the initial number of grains in a foam texture (Table 1). The initial c-axis orientations were adjusted to be similar to measured second-order orientation tensor eigenvalues from NEEM ice core at approximately 700 m depth, defining a weak single maximum CPO which is realistic for many ice cores (see review by Faria et al., 2014a). As summarized in Table 1, the simulations are labeled using a terminology that indicates their mean initial grain area in mm2 (G) and the order of magnitude in strain rate (R). Hence, for instance the simulation starting with a grain area of 20 mm2 at a strain rate of 2 · 10−11 s−1 is named G20R11.
During the simulations, the numbers of split events by grain dissection and polygonisation is automatically counted for each time-step. As outlined in section Microstructure Discretisation, a grain dissection event during the simulation is defined as a topological event during which two non-neighboring bnodes are merged into one. This way, the number of grain dissection and polygonisation events is slightly overestimated. Technically, it is not a grain dissection event when two bnodes or grain boundaries close without splitting a grain. The same holds for polygonisation, where all events are counted, including those where a resulting grain is too small and is immediately deleted. Nevertheless, counting split events remains the most reproducible way to estimate the efficiency of grain dissection compared to polygonisation.
To improve statistics, each of the 16 simulations indicated in Table 1 was repeated three times. For each repetition the initial CPO was slightly varied to allow for some variation between the simulations. The numbers of both polygonisation and grain dissection events for each step were normalized to the actual number of grains at this simulation step. The resulting value can be regarded as the number of events per grain in the respective time-step of the simulation.
Microstructure Characterisation of NEEM Ice Core Samples
Microstructure and crystallographic-orientation mapping for this study is performed using both EBSD (electron backscatter diffraction) and the automated Fabric Analyser. Using cryo-EBSD, we study three ice core sections from Holocene ice at 442.7, 718.8, and 889.3 m depth and four ice core sections from the glacial ice at 1737.7, 1937.7, 1993.8, and 2103.8 m depth.
Each ice core section of approximately 90 × 55 mm was cut into 10 to 15 EBSD samples using the method of Weikusat et al. (2011a). The samples were imaged by optical microscopy at the Alfred Wegener Institute (AWI) in Bremerhaven before being transported to Utrecht University. All ice core sections, except the ice core section at 442.7 m depth, were mapped using the Nova Nanolab equipped with an EBSD detector (Oxford Instruments HKL Technology, Abingdon, UK) and a cryo-stage (Quorum Technologies Ltd. Ringmer, UK). These EBSD patterns were acquired, processed and indexed using the Channel 5 software of OI-HKL Technology. The ice core section at 442.7 m depth was mapped using a FEI Helios NanoLab G3 UC equipped with the same EBSD detector and cryo-stage. The EBSD patterns of this ice core section were indexed using the Aztec software (Oxford Instruments, High Wycombe, UK). The reader is referred to Weikusat et al. (2011a) for an extensive description of the EBSD sample preparation, sample transfer and the EBSD mapping conditions we used.
A total number of 216 EBSD maps is used for this study, 91 in the Holocene ice and 125 maps in the glacial ice. Depending on the grain size and the area of interest, the EBSD maps vary in area from 0.5 to 6 mm2. Each of these EBSD maps was visually checked for signs of grain dissection according to the schematic descriptions of grain dissection by Means (1983), Urai (1983) and Figure 1. A grain dissection event was counted only between second-neighbors with only one grain separating the two dissected grains and if the full orientation difference between the dissected parts was smaller than 3°. The number of grain dissection structures was counted with the area of the EBSD map and its mean grain area. This counting is intended as a qualitative estimate of the frequency of grain dissection in the NEEM ice core. The area of the EBSD map was divided by the observed number of grain dissection events in this map. This provides a measure for the average area necessary to observe one grain dissection event. Afterwards, the average grain size of the EBSD map was divided by this measure resulting in a corrected value. Essentially, this procedure is similar to simply dividing the number of dissection events by the number of grains, but allows correcting for the difference in average grain size, EBSD-map area and for the low number of grains in an EBSD map. We counted completed grain dissection in EBSD maps, which implies that the dissection itself may have occurred in the past and adds a “memory effect” that increases the relative occurrence values. Therefore, the resulting unit is “number of grain dissection events per grain” and can be regarded as the relative chance of a grain being dissected or having been dissected based on the EBSD dataset.
The automated Fabric Analyser (G50 by Russell-Head Instruments) provides high-resolution c-axis-orientation maps of ice thin sections (Wilson et al., 2003). The obtained “c-axis maps” are an essential addition, as they provide better statistics by covering a larger area and, thus, more grains than EBSD maps. Furthermore, more samples per depth can be analyzed (Weikusat and Kipfstuhl, 2010).
For our study, 13 c-axis maps (total area 1.15 m2 and 8392 grains) from the Holocene part of the NEEM ice core were reviewed to detect grain dissection. In contrast to the EBSD, the Fabric Analyser only provides orientations of the c-axes. This limitation has an effect on the identification of grain dissection events in c-axis maps. Therefore, c-axis maps from the glacial part are not suitable for the search for grain dissection events as c-axis misorientations are too low to identify high-angle boundaries. Furthermore, when 2 s-neighboring grains share the same crystallographic orientation, there is a high probability for them being a product of grain dissection. However, if the full orientation information is missing, such a conclusion may be erroneous.
To avoid erroneously counting grain dissection because of only using c-axis information, we added a grain-connectedness criterion and searched c-axis maps only for grains where grain dissection appeared imminent, but has not yet been completed. For each c-axis map, the number of imminent grain dissection events was counted and divided by the number of grains. Effectively, the result is the same statistical parameter that is derived from EBSD maps, but only for imminent grain dissection events, which results in lower values obtained from c-axis maps than from EBSD maps. One can envisage that more sophisticated ways of determining recent dissection events is possible even in c-axis maps only. However, we did not further explore these and, therefore, the EBSD and c-axis results can so far only be compared qualitatively.
Grain dissection observed in EBSD maps or c-axis maps can potentially be a sectioning effect of a 3D sample. Both methods only show a snapshot of a continuously evolving microstructure, hence an uncertainty remains whether a bulge would have completed the dissection in the third dimension. However, this stereological issue is unproblematic with respect to grain size evolution as grain sizes in ice are also determined from two-dimensional sections (see methods of Binder, 2014). Any interpretation of a natural microstructure is associated with some uncertainty, as it only provides a snapshot of the evolution. Although each counted (imminent) dissection event is not certain, we can assume that the number of interpreted events does correlate with the true number of events.
Results
Numerical Simulation Results
An overview of selected microstructures after 50% of vertical shortening is shown in Figure 3. The final microstructure is marked by curved grain boundaries and only a few equidimensional grains. The c-axes are mainly aligned toward a single maximum CPO as shown by stereographic projections and by common red colors in c-axis azimuth maps. Microstructural similarities are only observed between simulations with common strain rates, independent of initial grain area. As expected, the high strain-rate simulations show smaller final grain areas, whereas the low strain-rate simulations show larger final grain areas. Dislocation densities are higher and more homogeneously distributed at a high strain rate than at a low strain rate.
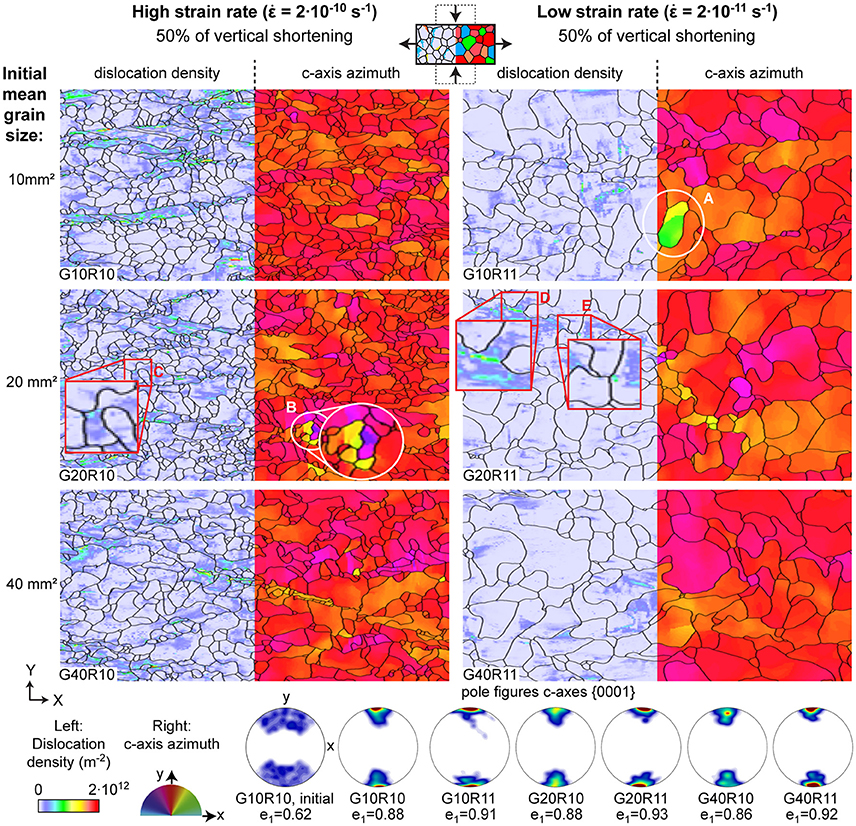
Figure 3. Overview of numerical microstructures after 50% of vertical shortening (i.e., final simulation step) with grain boundary networks (black lines) for the whole deformation box. The box is subdivided in the color code for dislocation density (left) and for the c-axes azimuths (right), where red colors indicate vertically oriented c-axes. The corresponding pole figures and first eigenvalues of the second order orientation tensor (e1) are shown below. The initial pole figure and first eigenvalue of G10R10 are provided as an example of the starting configuration. The squares indicate regions where grain dissection has either occurred or is most likely imminent, while the circles show subgrain boundaries likely to develop into new high-angle grain boundaries by polygonisation.
The circles in Figure 3 represent regions where a splitting of a grain by polygonisation appears imminent. In particular, the grain indicated by circle A in the final microstructure of simulation G10R11 contains two distinct regions with different c-axis azimuth. This grain is expected to split into two grains by polygonisation in the following numerical time-step. Red squares in Figure 3 indicate regions where grain dissection appears either completed (square E) or imminent (squares C and D). Especially square D provides information on the driving force for bulging. Here, two bulges migrate into an area of a grain that exhibits the highest dislocation densities in the microstructure. Close examination of the center of square D reveals high dislocation densities distributed in stripes. The dislocation densities vary strongly locally, also within regions with overall high dislocation densities.
All 16 numerical simulations show situations, during which strongly-bulging grain boundaries migrate through a grain and either merge with the opposite grain boundary or with another bulge (cf. Supplementary Material). Both situations cause splitting of a grain into two parts in the sense of grain dissection. Figure 4 illustrates several examples of grain dissection during the simulations. For example, simulation G15R10 shows a grain boundary bulging into an area of high variation in lattice orientation from step 74 to 84. Ultimately, this bulge migrates through the grain and merges with the opposite boundary. A similar situation is observed in results from simulation G60R10, where a rapidly migrating bulge merges with the opposite boundary, which dissects a grain into two parts. The example from G20R11 illustrates both an event of grain dissection and polygonisation. The bulge indicated by the square migrates toward- and finally merges with the opposite grain boundaries. This dissects the former grain into three parts. The small new grain in the upper left of the bulge shrinks and disappears within the following simulation steps. Furthermore, the bulging grain itself is dissected between simulation step 76 and 80, as visible on the right hand edge of the images. The white ellipse marks a subgrain boundary that develops into a high-angle grain boundary by polygonisation (Figure 4C). All bulges move toward high dislocation-density areas, leaving behind an area free of dislocations. The local dislocation-density field is highly heterogeneous.
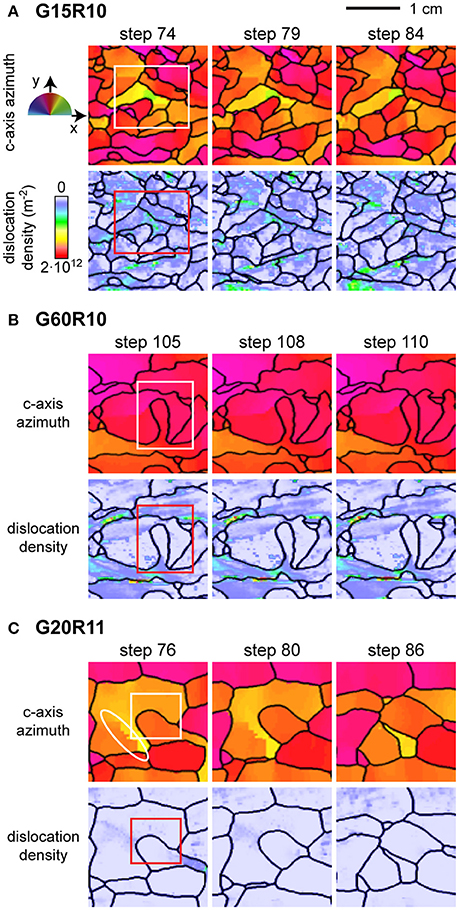
Figure 4. Detail of several examples of grain dissection events observed in the numerical simulations. The images are 1 by 1 cm snapshots and are color coded for c-axis azimuth and dislocation density. The squares indicate rapidly-migrating bulges merging with an opposite grain boundary (grain dissection). The white ellipse shows where a subgrain boundary develops into a high-angle grain boundary by polygonisation. (A) Simulation G15R10. (B) Simulation G60R10. (C) Simulation G20R11.
Both the low and the high strain-rate simulations with initial grain areas up to 15 mm2 are marked by mean grain-area increase (Figure 5A). Mean grain-area decrease is observed in high strain rate simulations with initial grain areas higher than 20 mm2. The mean grain-area evolutions can be classified in two stages. The first stage up to 30% of vertical shortening is characterized by a regular change in grain area, which either increases or decreases. In the following second stage, an approximate stable mean grain area of 17 ± 0.5 mm2 and 80 ± 2.1 mm is reached in the high and low strain-rate simulations, respectively. Some simulations appear not to have reached a steady state, even at 50% shortening (G80R10 and G60R10; dotted lines in Figure 5). Grain-area histograms (Figure 5B) show that the grain size distribution broadens with strain from the initial near log-normal distribution.
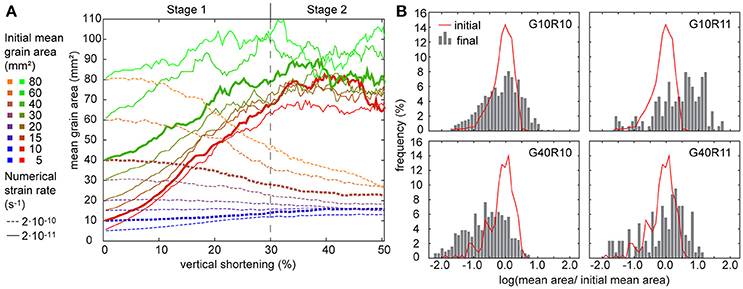
Figure 5. Overview of grain-area evolution in the numerical simulations. (A) Mean grain-area as a function of vertical shortening. In a first stage until approximately 30% shortening, mean grain areas either increase or decrease, which is followed by a second stage of more stable grain areas. Simulation results shown in detail in (B) (10 mm2 and 40 mm2) are highlighted as bold lines. (B) Grain area histograms of selected simulations at initial and final simulation step. Areas were normalized to initial mean values.
The number of polygonisation and grain dissection events (Figure 6) for each of the eight initial grain-sizes and two strain rates was averaged over the two stages observed in mean grain-area evolution (Figure 5). The first stage was taken from step one to 74 (0 to 31% of vertical shortening) and the second one from step 74 to 140 (31 to 50% of vertical shortening). The highest frequencies of both grain dissection and polygonisation events per grain are observed at the low strain rate (left y-axis, black and red symbols in Figure 6). Hence, a comparison of their relative frequency is necessary, which is illustrated in the blue curve of Figure 6 (right y-axis) that shows the percentage of mean grain dissection events from the total mean number of both grain dissection and polygonisation events per grain. Large errors (standard deviation) for the low strain-rate simulations are a result of the large grain sizes and, therefore small number of grains. In general, the highest fractions of grain dissection events are observed at the high strain rate, although polygonisation generally dominates over grain dissection. However, dissection events dominate when the grain size is close to equilibrium (green dotted lines in Figure 6) in the high strain rate experiments. This is observed for small initial mean grain-size simulations already from stage 1 and also for large initial mean grain-size simulations during stage 2. Here, we observe 50% or more split events by grain dissection.
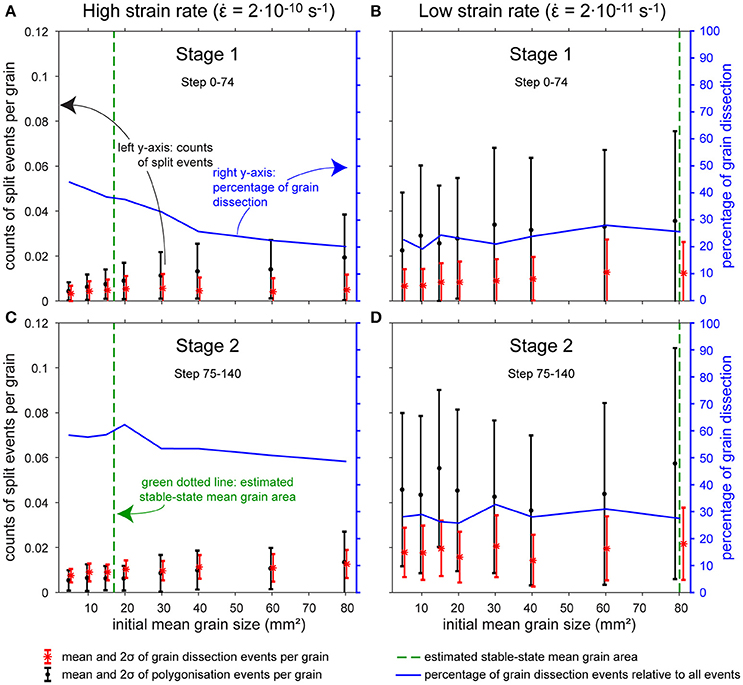
Figure 6. Statistics of grain-dissection and polygonisation events per grain. Data is sorted for the (A,B) first and (B,D) second stage of grain size evolution and (A,C) high and (B,D) low strain rate. The first stage was taken from step 0 to 74 (0–31% shortening) and the second one step from 75 to 140 (from 31% shortening). Error bars indicate two standard deviations (2σ) of the counting statistics. The dotted green line indicates approximate stable mean grain areas for the high and low strain-rate simulations. The blue line and right y-axis show the mean percentage of grain-dissection events per grain from the total number of splitting events by grain dissection and polygonisation.
EBSD and Fabric Analyser Results from NEEM Ice Core
Figure 7 shows an example of grain dissection in the NEEM core at 718.8m depth. The black spots in the optical microscopy image of Figure 7A are air bubbles at or just below the surface (Kipfstuhl et al., 2006). The comparison of this image with the SEM image (Figure 7B) shows that the bulge of grain I migrated slightly into grain II during the nine days of sample transport and storage. The map in Figure 7D shows a strong orientation gradient of approximately 10° in grain II. Most of this orientation gradient is accommodated by four parallel low-angle (< 2°) subgrain boundaries in grain II. The orientation gradient map indicates a comparatively low misorientation of about 2 to 3° between grain III and IV, which is also visible in the schematic illustrations of CPO at positions (a) and (d) in Figure 7E.
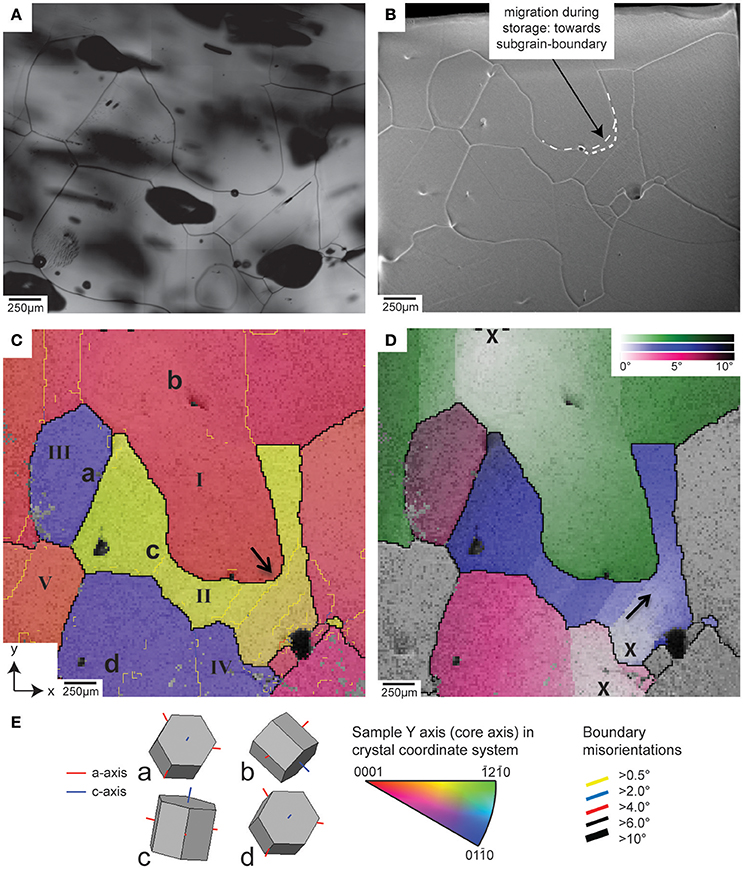
Figure 7. Optical-microscopy, SEM and EBSD maps of an ice core sample at 718.8 m depth in the NEEM ice core. (A) Part of the optical-microscopy image taken just after sample preparation. (B) SEM image of the mapped part of the EBSD sample with the edge of the EBSD sample in the upper part of the image. (C) EBSD map, with the y-axis parallel to the (vertical) core axis. (D) Map showing the orientation difference of up to 10° relative to the three spots marked with “X.” (E) Schematic illustration of measured full CPO (c- and a-axes) at positions (a–d), and color codes for CPO and boundary misorientation.
Figure 8 shows another example of grain dissection in Holocene ice at 442.7 m depth in the NEEM ice core. The comparison of the optical microscopy image with the SEM image (Figure 8B), which was taken eleven days after sample preparation, shows that the surface changed very little during transport and storage at Utrecht University. The EBSD map in Figure 8C shows a strong bulge in grain I between grains II and III. Grain II and III differ by about 3° in 3D crystallographic orientation (Figure 8D) showing that grain II and III have a very similar CPO (Figure 8E). Grain III shows a very low orientation gradient, except for the part close to the bulge of grain II as indicated by the arrow. This low orientation gradient is also reflected in the low misorientations along subgrain boundaries of about 0.5° in this area (Figure 8C).
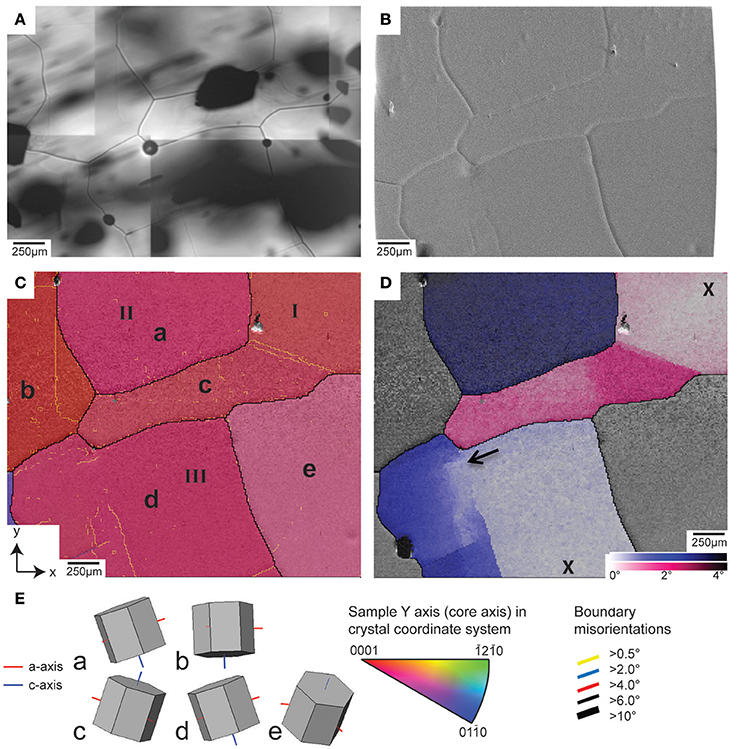
Figure 8. Optical-microscopy, SEM and EBSD maps of an ice core sample at 442.7 m depth in the NEEM ice core. (A) Part of the optical-microscopy image taken just after sample preparation. (B) SEM image of the mapped part of the EBSD sample. The curved edges are a result of the beam being blocked by the electron column. (C) EBSD map, with the y-axis parallel to the (vertical) core axis. (D) Map showing the orientation difference of up to 4° relative to the two spots marked with “X.” (E) Schematic illustration of measured full CPO (c- and a-axes) at positions (a–e), and color codes for CPO and boundary misorientation.
The c-axis maps obtained using the Fabric Analyser were processed manually to detect potential grain dissection events. As described in section 2.2, we selected only events where grain dissection appears imminent and the future fragments are still connected through a thin bridge. Figure 9 shows a 7 x 9 cm thin section from the NEEM ice core at 1211.7 m depth, grain dissection events are marked by white rectangles. As shown in Figure 9C, dissected grains often develop subgrain boundaries across the connecting bridge. This is in agreement with the EBSD data showing high orientation gradients and formation of subgrain boundaries within the dissected grains.
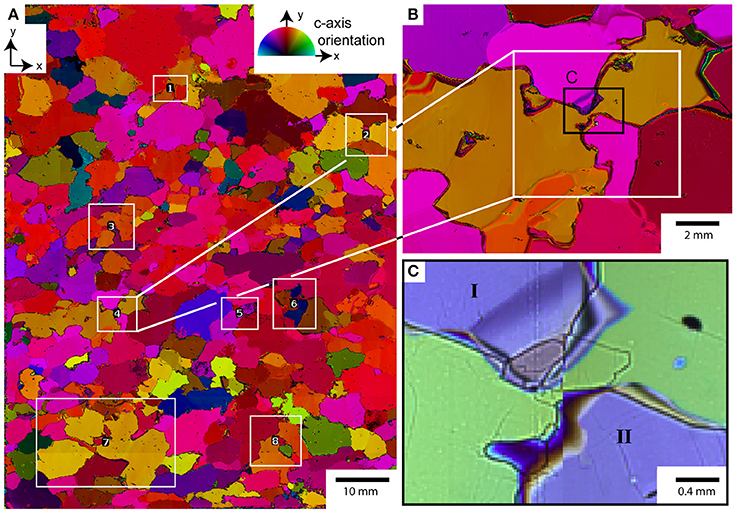
Figure 9. Grain dissection events in c-axis map, y-axis parallel to (vertical) core axis. (A) C-axis orientation map of a 7 × 9 cm thin section from the NEEM ice core at 1211.7 m. Colors indicate the azimuth of c-axes relative to the vertical y-axis. Imminent dissection events are marked with white rectangles. (B) Detail of a dissection event. Grain boundaries are highly irregular due to dynamic recrystallization. The orange grain is almost split in two grains that are still connected through a very narrow bridge. (C) Photomicrograph, with cross-polarized light, of the same spot showing the connecting bridge in detail. Dark lines are grain-boundary grooves at the surface. Subgrain-boundaries develop at the thin bridge between the dissected subgrains.
The frequencies of grain dissection events as a function of depth across the Holocene-glacial ice transition are shown in Figure 10. There appears a downward trend toward more dissection events, counted in EBSD images, in the Holocene ice, but with only three samples, this trend may not be significant (Figure 10A). There is, however, a significant decrease in dissection frequencies in the samples from glacial ice, from about one per grain to one per every four grains. Counts of imminent split events observed in c-axis maps are only available for Holocene ice down to 1279 m depth. The average number of imminent split events is much about one per one hundred grains (0.010 ± 0.003). This number is much lower than split events counted in EBSD images as only imminent events are counted in the c-axis maps. The frequencies of grain dissection in c-axis maps do not show a significant trend toward higher or lower grain-dissection frequencies with depth.
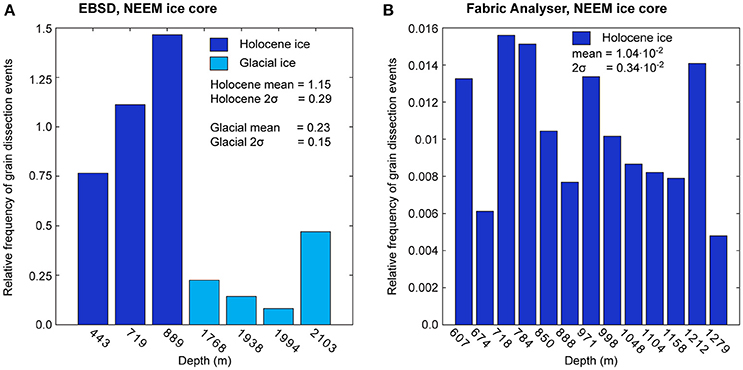
Figure 10. Frequency of grain dissection events. (A) Results obtained from EBSD maps plotted as a function of depth across the transition from Holocene to glacial ice. (B) Results from c-axis maps (Fabric Analyser). The generally lower frequencies for c-axis maps are a result of only counting imminent grain dissection events in c-axis maps and completed dissection events in EBSD maps.
Discussion
Time-Resolved Numerical Microstructure Evolution under the Influence of Grain Dissection
All simulations show situations that can be identified as grain dissection in the sense of the descriptions by Urai (1987) and Means (1983, 1989) (see movies, Supplementary Material). The simulations provide a time series to study the interaction of this process with polygonisation, recovery, grain boundary migration and viscoplastic deformation and their relative contribution to microstructure evolution. The numbers of grain dissection and polygonisation events are similar (Figure 6), which indicates that both mechanisms significantly contribute to microstructure evolution. Thus, grain dissection cannot be considered as a transient or negligible effect during the simulations, which underlines the necessity to assess its importance for ice micro- to macrodynamics. It needs to be assessed under which boundary conditions such as bulk grain size, strain rate, temperature or stress configuration, grain dissection is most efficient.
Significant numbers of dissection events, compared to the number of polygonisation events, can be seen in the high strain rate simulations (Figures 6A,C). Here, in five of eight simulations, the grain size evolution is marked by grain size decrease, which indicates the grain-size-decreasing character of grain dissection. Additionally, if the grain size does not change significantly from the start or has equilibrated to steady-state values during the second stage of grain size evolution (Figure 5A), grain dissection dominates over polygonisation (Figure 6). In particular, grain dissection is most effective during the second stage of the high strain-rate simulations (Figure 6C). The observation of efficient grain dissection at steady-state conditions is consistent with experimental results by Jessell (1986) and Urai (1987). When the mean grain size is larger than the equilibrium one and thus grain size decreases, polygonisation dominates over dissection, as is observed in the high strain-rate simulations and in rock analog experiments by Herwegh et al. (1997).
It remains questionable how suitable mean grain areas are to assess if a steady-state microstructure is reached. Although trending toward more steady values, the final mean grain-areas still vary significantly (Figure 5A). The grain area distributions are broadened and more heterogeneous toward the end of the simulations (Figure 5B), which is expected from observations of natural ice microstructures under dynamic recrystallization (Kipfstuhl et al., 2009). Obtaining mean grain areas from a broadened grain area distribution can be responsible for the observed variability in final grain areas. Furthermore, at low strain rates, the final number of grains is lowered, which additionally affects the mean grain-area calculation.
The numerical approach is currently limited to 2D simulations. The numerical modeling of processes such as SIBM leading to grain dissection or polygonisation in 3D remains a goal for future developments. In 3D, SIBM can either lead to amoeboidal grains or truly dissected grains (Urai et al., 1986; Figure 25 therein). True dissection in 3D requires bulging along a surface of high dislocation densities. With respect to this, the occurrence of grain dissection can still be expected in 3D. Also the process of 3D polygonisation requires gradients in lattice misorientations and dislocation densities along a surface to develop new high-angle grain boundaries. While the occurrence of polygonisation in natural ice is verified (Alley et al., 1995; De La Chapelle et al., 1998), similar initial structural conditions may as well lead to 3D grain dissection. However, 3D and 2D grain dissection remain slightly different processes. In 3D, grain dissection occurs not at point, but over a period in time during which two boundaries merge. This may cause an over- or underestimation of the frequency of grain dissection when being limited to 2D simulations, however, general and qualitative remain valid. For a more quantitative estimate of the frequency of 3D grain dissection in future research, either stereological corrections or 3D numerical simulations are required.
Experimentally observed bulging nucleation (Chauve et al., 2017) can theoretically be modeled with the current numerical resolution. The required processes such as SIBM and subgrain rotation are implemented. However, we do not observe significant bulging nucleation. This may be related to the model resolution, but more likely to the 2D nature of the simulations: With only two dimensions available, splitting off a bulge by necking is unlikely as the region left behind the bulge is strain-energy free. Furthermore, as surface energies tend to straighten the boundaries and can readily remove small, yet distinct bulges. For efficient bulging nucleation, small bulge widths relative to large grain sizes are required. Under such conditions, we estimate grain dissection less likely as small bulges likely cannot migrate through the whole of a large grain causing dissection, which is consistent with Means (1989). Hence, grain dissection would probably neither be inhibited nor fostered, if bulging nucleation was modeled using higher resolutions.
Compared to natural vertical strain rates at the NEEM ice core that are in the order of 10−12 s−1 (Montagnat et al., 2014), our numerical strain rates are about an order of magnitude higher and results in larger grain sizes than observations in the NEEM ice core (Binder, 2014). Using lower numerical strain rates is feasible, yet even larger grain sizes are produced. The grain size depends on the effective grain boundary mobility that is an Arrhenius-type function of an intrinsic mobility, activation energy and temperature (Nasello et al., 2005). As Steinbach et al. (2016) describe, the numerical setup currently uses literature values for intrinsic grain boundary mobility and activation energy from experimental studies by Nasello et al. (2005). We suggest that the mobility and activation energy are not sufficiently constrained to reproduce realistic grain sizes at natural strain rates. In particular, dissolved impurities are suspected to reduce mobilities (Alley et al., 1986b), but are currently not taken into account in the numerical routine. Further investigations of this issue are beyond the scope of this contribution and remains part of future research.
Grain Dissection along NEEM Ice Core
EBSD results on frequencies of grain dissection from Figure 10A imply that grain dissection in the NEEM ice core is most efficient in the Holocene ice and in particular around 700–900 meter depth (35–60% estimated finite shortening based on NEEM annual layer thicknesses by Rasmussen et al., 2013). However, whether this trend is real or a result of the limited number of processed samples is uncertain. In particular, this becomes obvious when comparing with results from c-axis maps (Figure 10B), where no evident trend in the number of imminent grain dissection events is visible.
The results in Figure 10 can be compared with mean grain-boundary curvature data from NEEM ice core presented by Binder (2014, Figures 7.1–7.8 therein). The study by Binder (2014) converts mean grain-boundary curvature to dislocation densities and observes highest curvatures from about 600 to 1300 m depth (30 to 75% estimated finite shortening based on Rasmussen et al., 2013). Our EBSD samples marked by highest relative numbers of grain dissection events are taken from this region of high mean grain-boundary curvature. This implies that strong grain boundary curvature may be indicative for the potential activity of grain dissection. Another characteristic of this region are stable grain sizes (Binder, 2014). The higher efficiency of grain dissection in Holocene ice of NEEM ice core (Figure 10A) is in accordance with the observations from simulations that grain dissection is most efficient relative to polygonisation, if the microstructure is in steady state (Figure 6C).
The deformation mode in NEEM ice core is interpreted to change from vertical shortening to simple shear at about the transition from Holocene to glacial ice, when c-axes in Holocene ice trend toward a vertical single maximum (Montagnat et al., 2014). As ice crystals in the Holocene part are mainly vertically shortened, a higher density of non-basal dislocations may be expected in Holocene ice, in particular toward the Holocene-glacial ice transition. The activation of non-basal planes is explicable with the single maximum CPO in which the basal planes are in an unfavorable orientation to accommodate vertical shortening. Alternatively, a constant non-basal activity would imply a strain rate decrease with depth as the ice becomes harder to deform. Non-basal dislocations provide higher line energies (Schulson and Duval, 2009, pp. 16-18), which in turn implies higher energy gradients driving SIBM and more grain dissection. This may be reflected in Figure 10A showing a trend toward more efficient grain dissection with depth in Holocene ice, but a significantly less grain dissection in glacial ice. Future research could further investigate, whether a change in deformation conditions from pure to simple shear during numerical simulations, will cause similar trends.
Characteristics of Grain Dissection in Simulation and Nature
Evidence that microstructures exhibit imminent or completed grain dissection events can be found in (1) a distinct distribution of orientation gradients, (2) heterogeneous strain-energy distribution leading to localized occurrence of SIBM, (3) irregular shape of grain boundaries and (4) equal orientations of next-neighbor grains, which Urai (1983) describes as equal orientation families (Figures 7–9). Typically, all characteristics (1) to (4) are observed together in natural samples and simulations. Another characteristic important for grain dissection could be (5) the relation of bulge width and mean grain size. The characteristics below can be used as microstructural indicators for the occurrence of grain dissection. However, we remark that direct evidence is only provided by a time-resolved microstructure evolution.
(1) Orientation differences indicate high stored strain-energies and can be observed as high densities of subgrain boundaries and orientation gradients. Both EBSD maps, c-axis maps and simulations reveal that grain dissection is accompanied by high orientation gradients (subgrain boundaries) in the dissected grain. The spatial distribution shows these high gradients as high densities of subgrain boundaries on the convex side of bulges (Figures 4A,C, 9C). The observation of grain dissection accompanied with subgrain boundaries can be seen as an indication that grain dissection and polygonisation are not completely independent processes but rather act simultaneously, possibly strengthening each other, and cause splitting of grains with high strain-energy gradients.
(2) Dislocations induce strain energies that drive SIBM. If the dislocation-density difference between the bulging and dissected grain is high, rapid bulge migration is possible (Figure 4, supplementary movies). The direction of grain boundary migration is indicated by locally high orientation gradients that are favorably consumed by the expanding grain (arrow in Figure 8C). In some cases, this direction could be verified using the observed migration of grain boundaries during storage of samples (see dotted line, from grain I in II, Figure 8B). SIBM causing grain dissection is a localized process as the dislocation energies can be highly heterogeneous within one grain (grain II, Figures 3, 4A,B, 8). Locally high strain energies lead to localized SIBM, which in turn causes directed bulging of grain boundaries and dissection instead of overgrowing of grains. Therefore, localized SIBM may be an essential feature of grain dissection. This assumption is consistent with simulation results, where grain dissection is observed when grain boundaries bulge in areas with locally high dislocation densities (simulation G15R10 in Figure 4). The combination of localized SIBM and grain dissection is further supported by geological studies. For instance, Tullis et al. (1990) observe increased bulging and less polygonisation if the dislocation density distribution is more heterogeneous. The heterogeneous distributions of dislocations in ice are expected, considering that strain localisation is suggested to be a common mechanism in ice micro-dynamics (Jansen et al., 2016; Llorens et al., 2016a; Steinbach et al., 2016). Although these studies describe strain localisation on the scale of polycrystals, their results also show intracrystalline localisation, which is required for localized SIBM and grain dissection. Additionally, Steinbach et al. (2016) indicate that strain localisation may occur over a range of different scales.
(3) The elongated shape of some bulges is caused by strong gradients in stored strain energy and accompanied by relatively high orientation gradients. This is reflected between grain I and grain II-III in Figure 7D and detail images of simulation G60R10 results (Figure 4B). When examining natural microstructures, an irregular grain boundary network and high orientation gradients reflecting strain energy gradients may be indicative for an increased influence of grain dissection.
(4) Equal orientation of next-neighbor grains or orientation families (grains III and IV, Figure 8C) can only serve as an indication for completed grain dissection if the full CPO (a-axes as well as c-axes) is known. This is the case for EBSD measurements and numerical simulations. However, as a-axes can also align (Miyamoto et al., 2005), even in EBSD-maps, the recognition of orientation families can become difficult when the CPO is very strong. Although an orientation family is clearly observed, other indicators for grain dissection such as an irregular grain boundary network should accompany the observation. Obbard et al. (2006) observed orientation families in GISP2 (Greenland ice sheet project 2) ice core samples. Orientation families may be produced by grain dissection, rather than by polygonisation. In fact, in the misorientation distribution data shown by Obbard et al. (2006), there was no difference between the correlated and un-correlated distributions. This implies that misorientations are controlled by the strong CPO (Fliervoet et al., 1999). In addition, there is a lack of 5°–15° misorientation boundaries, which would be expected if polygonisation was the main grain-size-reducing mechanism (Trimby et al., 1998, 2000). The occurrence of a relatively high amount of 5°–15° c-axis misorientations has been suggested as a signature of polygonisation in ice (Alley et al., 1995; Durand et al., 2008). However, the EBSD study of Obbard et al. (2006) shows that c-axis data can overestimate the occurrence of the 5°–15° boundaries.
(5) The prevalence of grain dissection could be related to grain size itself. Means (1989) shows that grain dissection is most frequent when mean grain size and bulge width are similar. We can identify three situations (a–c) to describe this dependency: (a) If the grain size is significantly larger, a bulge will remain close to the position of the original boundary and does not migrate through a grain. In this situation, grain dissection is not possible. (b) On the other hand, if the grain size is significantly smaller than the bulge width, the bulge shape itself cannot develop and the migrating boundary consumes a whole grain instead of dissecting it. (c) Dissection and resulting grain-size reduction is only possible when bulges are about half a grain diameter wide. Our results appear to support these dependencies. In NEEM glacial ice, the grain size is smaller and grain dissection is less common than in Holocene ice (Figure 10A). In our simulations, the frequency of grain dissection was higher for high strain rate simulations leading to smaller grain sizes (Figure 6). This may illustrate the two end-members of grain size being larger (NEEM glacial ice) or smaller than the bulge width (simulations at low strain rate). A further investigation and quantification of such dependencies should form part of future studies on grain dissection.
It was argued above that grain dissection is more important when the grain size is close to steady state than at either smaller or larger grain sizes. Although grain dissection is most significant at this grain size, polygonisation events may still outnumber grain dissection events. Therefore, we interpret that with such equilibrium conditions, suitable bulge width as described above (situation 5c) are achieved through a combination of polygonisation and SIBM. A steady state is only reached when deformation conditions are stable. High frequencies of dissection events can thus be regarded as indicators for relatively constant conditions. This appears to fit the observations in the NEEM ice core, where high frequencies of grain dissection are found at the base of the Holocene ice (Figure 10A). While microstructures stabilize downward in Holocene ice, both the CPO (Montagnat et al., 2014) and the grain size (Binder, 2014) change at the transition to glacial ice. According to the recrystallization diagram by Faria et al. (2014b), this change reflects a change in deformation conditions. In turn, this implies less grain dissection relative to polygonisation, which seems to fit our observation of low frequencies in grain dissection in glacial ice (Figure 10A).
The proposed mechanisms controlling grain sizes in ice are classically polygonisation (Alley et al., 1995; De La Chapelle et al., 1998) or bulging nucleation (Montagnat et al., 2015; Chauve et al., 2017) leading to decreasing grain sizes and grain boundary migration leading to a grain size increase (Duval and Castelnau, 1995; De La Chapelle et al., 1998). A mixture of both is suspected to cause steady grain sizes in the middle of ice-sheets columns. However, SIBM may provide an additional grain-size-reducing process, if grain dissection is initiated (Means, 1989). Therefore, equilibrium grain sizes may be achieved with only SIBM, whereas polygonisation or nucleation need additional grain-size-increasing mechanisms to achieve equilibrium.
Conclusions
In this study, we investigate the importance of grain dissection as a feature of strain-induced boundary migration (SIBM) in ice using numerical simulations and natural microstructures from the NEEM ice core. For the first time, we present evidence that grain dissection is a common mechanism during ice deformation. The efficiency of grain dissection is probably independent of depth and rather a function of the state of the microstructure and deformation conditions. In particular, grain dissection is most efficient in depths in the ice column where deformation conditions remained constant over time and microstructures approach steady state in terms of grain size or CPO. Here, grain dissection is an efficient mechanism in addition to polygonisation, to achieve grain size reduction and maintain a balance between grain-size-increasing and—decreasing mechanisms. In turn, this implies that SIBM not necessarily leads to grain size increase, but eventually to the dissection of grains, especially at high strain energy gradients.
Future models that describe grain-size evolution during ice deformation, should incorporate grain dissection and further investigate its frequency as a function of grain size, deformation mode, CPO or other microstructural properties. This should lead to a parameterisation of grain dissection, which forms the precursor for including the process in a grain-size sensitive ice flow law required to describe large-scale ice flow.
Author Contributions
Initial concept by FS and EK. FS performed numerical modeling with support from AG and PB. EK did electron backscatter diffraction analyses supported by MD and GP. JE processed the Fabric Analyser data. IW provided the glaciological input, samples and NEEM Fabric Analyser measurements. Major parts of the paper were written by FS, EK and JE with contributions of all co-authors.
Funding
We acknowledge funding by the DFG (SPP 1158) grant BO 1776/12-1 and the Helmholtz Junior Research group “The effect of deformation mechanisms for ice sheet dynamics” (VH-NG-802). We acknowledge support by the DFG and the Open Access Publishing Fund of the University of Tübingen.
Conflict of Interest Statement
The authors declare that the research was conducted in the absence of any commercial or financial relationships that could be construed as a potential conflict of interest.
Acknowledgments
We are thankful for the support of the Elle community and the discussions with Daniela Jansen, Maria-Gema Llorens and Johanna Kerch that helped improving the manuscript. We thank Sepp Kipfstuhl for the possibility to use microstructure images from NEEM ice core. NEEM is directed and organized by the Center of Ice and Climate at the Niels Bohr Institute and US NSF, Office of Polar Programs. It is supported by funding agencies and institutions in Belgium (FNRS-CFB and FWO), Canada (NRCan/GSC), China (CAS), Denmark (FIST), France (IPEV, CNRS/INSU, CEA and ANR), Germany (AWI), Iceland (RannIs), Japan (NIPR), Korea (KOPRI), The Netherlands (NWO/ALW), Sweden (VR), Switzerland (SNF), United Kingdom (NERC) and the USA (US NSF, Office of Polar Programs). We are grateful for the thoughtful reviews by Janos Urai and two reviewers.
Data Availability
The video supplement related to this article is available online on figshare.com: https://doi.org/10.6084/m9.figshare.5160997.v1 (Steinbach et al., 2017).
References
Alley, R. B., Gow, A. J., and Meese, D. A. (1995). Mapping c-axis fabrics to study physical processes in ice. J. Glaciol. 41, 197–203. doi: 10.1017/S0022143000017895
Alley, R. B., Perepezko, J. H., and Bentley, C. R. (1986a). Grain growth in polar ice: I. Theory J. Glaciol. 32, 415–424. doi: 10.1017/S0022143000012120
Alley, R. B., Perepezko, J. H., and Bentley, C. R. (1986b). Grain growth in polar ice: II. Appl. J. Glaciol. 32, 425–433. doi: 10.1017/S0022143000012132
Azuma, N., and Higashi, A. (1985). Formation processes of ice fabric pattern in ice sheets. Ann. Glaciol. 6, 130–134. doi: 10.1017/S0260305500010168
Becker, J. K., Bons, P. D., and Jessell, M. W. (2008). A new front-tracking method to model anisotropic grain and phase boundary motion in rocks. Comput. Geosci. 34, 201–212. doi: 10.1016/j.cageo.2007.03.013
Binder, T. (2014). Measurements of Grain Boundary Networks in Deep Polar Ice Cores-a Digital Image Processing Approach. Universitätsbibliothek Heidelberg.
Bons, P. D., Jansen, D., Mundel, F., Bauer, C. C., Binder, T., Eisen, O., et al. (2016). Converging flow and anisotropy cause large-scale folding in Greenland's ice sheet. Nat. Commun. 7:11427. doi: 10.1038/ncomms11427
Bons, P., Koehn, D., and Jessell, M. (2008). Microdynamics Simulation. Berlin; Heidelberg: Springer.
Borthwick, V. E., Piazolo, S., Evans, L., Griera, A., and Bons, P. D. (2014). What happens to deformed rocks after deformation? A refined model for recovery based on numerical simulations. Geo. Soc. Lond. Spec. Publ. 394, 215–234. doi: 10.1144/SP394.11
Breton, D. J., Baker, I., and Cole, D. M. (2016). Microstructural evolution of polycrystalline ice during confined creep testing. Cold Reg. Sci. Technol. 127, 25–36. doi: 10.1016/j.coldregions.2016.03.009
Brinckmann, S., Siegmund, T., and Huang, Y. (2006). A dislocation density based strain gradient model. Int. J. Plast. 22, 1784–1797. doi: 10.1016/j.ijplas.2006.01.005
Budd, W. F., and Jacka, T. H. (1989). A review of ice rheology for ice sheet modelling. Cold Reg. Sci. Technol. 16, 107–144. doi: 10.1016/0165-232X(89)90014-1
Bunge, H. J. (1982). Texture Analysis in Materials Science: Mathematical Methods. Butterworth-Heinemann.
Chauve, T., Montagnat, M., Barou, F., Hidas, K., Tommasi, A., and Mainprice, D. (2017). Investigation of nucleation processes during dynamic recrystallization of ice using cryo-EBSD. Philos. Trans. R. Soc. A 375:20150345. doi: 10.1098/rsta.2015.0345
De La Chapelle, S., Castelnau, O., Lipenkov, V., and Duval, P. (1998). Dynamic recrystallization and texture development in ice as revealed by the study of deep ice cores in Antarctica and Greenland. J. Geophys. Res. 103, 5091–5105. doi: 10.1029/97JB02621
De Meer, S., Drury, M. R., De Bresser, J. H. P., and Pennock, G. M. (2002). Current issues and new developments in deformation mechanisms, rheology and tectonics. Geo. Soc. Lond. Spec. Publ. 200, 1–27. doi: 10.1144/GSL.SP.2001.200.01.01
Drury, M. R., and Urai, J. L. (1990). Deformation-related recrystallization processes. Tectonophysics 172, 235–253. doi: 10.1016/0040-1951(90)90033-5
Durand, G., Persson, A., Samyn, D., and Svensson, A. (2008). Relation between neighbouring grains in the upper part of the NorthGRIP ice core - Implications for rotation recrystallization. Earth Planet. Sci. Lett. 265, 666–671. doi: 10.1016/j.epsl.2007.11.002
Durand, G., Weiss, J., Lipenkov, V., Barnola, J. M., Krinner, G., Parrenin, F., et al. (2006). Effect of impurities on grain growth in cold ice sheets. J. Geo. Res. Earth Surf. 111:F01015. doi: 10.1029/2005JF000320
Duval, P. (1979). Creep and recrystallization of polycrystalline ice. Bull. de Mineralogie 102, 80–85.
Duval, P. (1985). Grain growth and mechanical behaviour of polar ice. Ann. Glaciol. 6:82. doi: 10.1017/S0260305500010041
Duval, P., and Castelnau, O. (1995). Dynamic recrystallization of ice in polar ice sheets. J. Phys. IV 05, C3-197–C3-205. doi: 10.1051/jp4:1995317
Duval, P., Ashby, M. F., and Anderman, I. (1983). Rate-controlling processes in the creep of polycrystalline ice. J. Phys. Chem. 87, 4066–4074. doi: 10.1021/j100244a014
Eichler, J., Kleitz, I., Bayer-Giraldi, M., Jansen, D., Kipfstuhl, S., Shigeyama, W., et al. (2017). Location and distribution of micro-inclusions in the EDML and NEEM ice cores using optical microscopy and in-situ Raman spectroscopy. Cryosphere Dis. 11, 1075–1090. doi: 10.5194/tc-11-1075-2017
Faria, S. H., Weikusat, I., and Azuma, N. (2014a). The microstructure of polar ice. Part I: highlights from ice core research. J. Struct. Geo. 61, 2–20. doi: 10.1016/j.jsg.2013.09.010
Faria, S. H., Weikusat, I., and Azuma, N. (2014b). The microstructure of polar ice. Part II: State of the art. J. Struct. Geo. 61, 21–49. doi: 10.1016/j.jsg.2013.11.003
Fitzpatrick, J. J., Voigt, D. E., Fegyveresi, J. M., Stevens, N. T., Spencer, M. K., Cole-Dai, J., et al. (2014). Physical properties of the WAIS divide ice core. J. Glaciol. 60, 1181–1198. doi: 10.3189/2014JoG14J100
Fliervoet, T. F., Drury, M. R., and Chopra, P. N. (1999). Crystallographic preferred orientations and misorientations in some olivine rocks deformed by diffusion or dislocation creep. Tectonophysics 303, 1–27. doi: 10.1016/S0040-1951(98)00250-9
Gao, H., Huang, Y., Nix, W. D., and Hutchinson, J. W. (1999). Mechanism-based strain gradient plasticity-I. Theory J. Mech. Phys. Solids 47, 1239–1263. doi: 10.1016/S0022-5096(98)00103-3
Gao, X. Q., and Jacka, T. H. (1987). The approach to similar tertiary creep rates for Antarctic core ice and laboratory prepared ice. Le J. de Phys. Colloq. 48, C1–C289. doi: 10.1051/jphyscol:1987141
Goldsby, D. L., and Kohlstedt, D. L. (1997). “Flow of ice I by dislocation, grain boundary sliding, and diffusion processes,” in Lunar and Planetary Science Conference (Houston, TX), 429.
Goldsby, D. L., and Kohlstedt, D. L. (2001). Superplastic deformation of ice: experimental observations. J. Geophys. Res. 106, 11017–11030. doi: 10.1029/2000JB900336
Griera, A., Llorens, M.-G., Gomez-Rivas, E., Bons, P. D., Jessell, M. W., Evans, L. A., et al. (2013). Numerical modelling of porphyroclast and porphyroblast rotation in anisotropic rocks. Tectonophysics 587, 4–29. doi: 10.1016/j.tecto.2012.10.008
Herwegh, M., Handy, M. R., and Heilbronner, R. (1997). Temperature- and strain-rate-dependent microfabric evolution in monomineralic mylonite: evidence from in situ deformation of norcamphor. Tectonophysics 280, 83–106. doi: 10.1016/S0040-1951(97)00139-X
Hidas, K., Tommasi, A., Mainprice, D., Chauve, T., Barou, F., and Montagnat, M. (2017). Microstructural evolution during thermal annealing of ice-Ih. J. Struct. Geo. 99, 31–44. doi: 10.1016/j.jsg.2017.05.001
Hondoh, T. (2000). “Nature and behavior of dislocations in ice,” in International Symposium on Physics of Ice Core Records (Shikotsukohan: Hokkaido University Press), 3–24. Available online at: http://hdl.handle.net/2115/32459
Humphreys, F. J., and Hatherly, M. (2004). Recrystallization and Related Annealing Phenomena. Oxford: Elsevier.
Jacka, T. H., and Li, J. (1994). The steady-state crystal size of deforming ice. Ann. Glaciol. 20, 13–18. doi: 10.3189/172756494794587230
Jansen, D., Llorens, M. G., Westhoff, J., Steinbach, F., Kipfstuhl, S., Bons, P. D., et al. (2016). Small-scale disturbances in the stratigraphy of the NEEM ice core: observations and numerical model simulations. The Cryosphere 10, 359–370. doi: 10.5194/tc-10-359-2016
Jessell, M. W. (1986). Grain boundary migration and fabric development in experimentally deformed octachloropropane. J. Struct. Geo. 8, 527–542. doi: 10.1016/0191-8141(86)90003-9
Jessell, M., Bons, P. D., Evans, L., Barr, T., and Stüwe, K. (2001). Elle: the numerical simulation of metamorphic and deformation microstructures. Comput. Geosci. 27, 17–30. doi: 10.1016/S0098-3004(00)00061-3
Ketcham, W. M., and Hobbs, P. V. (1969). An experimental determination of the surface energies of ice. Philoso. Magaz. 19, 1161–1173. doi: 10.1080/14786436908228641
Kipfstuhl, S., Faria, S. H., Azuma, N., Freitag, J., Hamann, I., Kaufmann, P., et al. (2009). Evidence of dynamic recrystallization in polar firn. J. Geophys. Res. 114:B05204. doi: 10.1029/2008JB005583
Kipfstuhl, S., Hamann, I., Lambrecht, A., Freitag, J., Faria, S. H., Grigoriev, D., et al. (2006). Microstructure mapping: a new method for imaging deformation-induced microstructural features of ice on the grain scale. J. Glaciol. 52, 398–406. doi: 10.3189/172756506781828647
Kipfstuhl, S. (2010). Large Area Scan Macroscope Images from the NEEM Ice Core. Pangaea Data Publisher for Earth and Environmental Science. Available online at: http://doi.pangaea.de/10.1594/PANGAEA.743296
Lebensohn, R. A. (2001). N-site modeling of a 3D viscoplastic polycrystal using fast fourier transform. Acta Mater. 49, 2723–2737. doi: 10.1016/S1359-6454(01)00172-0
Lebensohn, R. A., Montagnat, M., Mansuy, P., Duval, P., Meysonnier, J., and Philip, A. (2009). Modeling viscoplastic behavior and heterogeneous intracrystalline deformation of columnar ice polycrystals. Acta Mater. 57, 1405–1415. doi: 10.1016/j.actamat.2008.10.057
Li, J., Jacka, T. H., and Morgan, V. (1998). Crystal-size and microparticle record in the ice core from Dome Summit South, Law Dome, East Antarctica. Ann. Glaciol. 27, 343–348.
Llorens, M.-G., Griera, A., Bons, P. D., Roessiger, J., Lebensohn, R., Evans, L., et al. (2016a). Dynamic recrystallization of ice aggregates during co-axial viscoplastic deformation: a numerical approach. J. Glaciol. 62, 359–377. doi: 10.1017/jog.2016.28
Llorens, M.-G., Griera, A., Bons, P. D., Lebensohn, R. A., Evans, L. A., Jansen, D., et al. (2016b). Full-field predictions of ice dynamic recrystallization under simple shear conditions. Earth Planet. Sci. Lett. 450, 233–242. doi: 10.1016/j.epsl.2016.06.045
Llorens, M.-G., Griera, A., Steinbach, F., Bons, P. D., Gomez-Rivas, E., Jansen, D., et al. (2017). Dynamic recrystallization during deformation of polycrystalline ice: insights from numerical simulations. Philos. Trans. R. Soc. A 375:20150346. doi: 10.1098/rsta.2015.0346
Mangeney, A., Califano, F., and Hutter, K. (1997). A numerical study of anisotropic, low reynolds number, free surface flow for ice sheet modeling. J. Geo. Res. Solid Earth 102, 22749–22764. doi: 10.1029/97JB01697
Mathiesen, J., Ferkinghoff-Borg, J., Jensen, M. H., Levinsen, M., Olesen, P., Dahl-Jensen, D., et al. (2004). Dynamics of crystal formation in the Greenland NorthGRIP ice core. J. Glaciol. 50, 325–328. doi: 10.3189/172756504781829873
Means, W. D. (1981). The concept of steady-state foliation. Tectonophysics 78, 179–199. doi: 10.1016/0040-1951(81)90013-5
Means, W. D. (1983). Microstructure and micromotion in recrystallization flow of octachloropropane: a first look. Geologische Rundschau 72, 511–528. doi: 10.1007/BF01822080
Means, W. D. (1989). Synkinematic microscopy of transparent polycrystals. J. Struct. Geo. 11, 163–174. doi: 10.1016/0191-8141(89)90041-2
Miyamoto, A., Shoji, H., Hori, A., Hondoh, T., Clausen, H. B., and Watanabe, O. (2005). Ice fabric evolution process understood from anisotropic distribution of a-axis orientation on the GRIP (Greenland) ice core. Ann. Glaciol. 42, 47–52. doi: 10.3189/172756405781812501
Moldovan, D., Wolf, D., and Phillpot, S. R. (2001). Theory of diffusion-accommodated grain rotation in columnar polycrystalline microstructures. Acta Mater. 49, 3521–3532. doi: 10.1016/S1359-6454(01)00240-3
Montagnat, M., Azuma, N., Dahl-Jensen, D., Eichler, J., Fujita, S., Gillet-Chaulet, F., et al. (2014). Fabric along the NEEM ice core, Greenland, and its comparison with GRIP and NGRIP ice cores. Cryosphere 8, 1129–1138. doi: 10.5194/tc-8-1129-2014
Montagnat, M., Buiron, D., Arnaud, L., Broquet, A., Schlitz, P., Jacob, R., et al. (2012). Measurements and numerical simulation of fabric evolution along the Talos Dome ice core, Antarctica. Earth Planet. Sci. Lett. 357–358, 168–178. doi: 10.1016/j.epsl.2012.09.025
Montagnat, M., Chauve, T., Barou, F., Tommasi, A., Beausir, B., and Fressengeas, C. (2015). Analysis of dynamic recrystallization of ice from EBSD orientation mapping. Front. Earth Sci. 3:81. doi: 10.3389/feart.2015.00081
Montagnat, M., and Duval, P. (2000). Rate controlling processes in the creep of polar ice, influence of grain boundary migration associated with recrystallization. Earth Planet. Sci. Lett. 183, 179–186. doi: 10.1016/S0012-821X(00)00262-4
Nasello, O. B., Prinzio, C. L. D., and Guzmán, P. G. (2005). Temperature dependence of “pure” ice grain boundary mobility. Acta Mater. 53, 4863–4869. doi: 10.1016/j.actamat.2005.06.022
Ng, F., and Jacka, T. H. (2014). A model of crystal-size evolution in polar ice masses. J. Glaciol. 60, 463–477. doi: 10.3189/2014JoG13J173
Obbard, R., Baker, I., and Sieg, K. (2006). Using electron backscatter diffraction patterns to examine recrystallization in polar ice sheets. J. Glaciol. 52, 546–557. doi: 10.3189/172756506781828458
Petrenko, V. F., and Whitworth, R. W. (1999). Physics of Ice. Oxford; New York, NY: Clarendon Press.
Pettit, E. C., and Waddington, E. D. (2003). Ice flow at low deviatoric stress. J. Glaciol. 49, 359–369. doi: 10.3189/172756503781830584
Piazolo, S., Jessell, M. W., Bons, P. D., Evans, L., and Becker, J. K. (2010). Numerical simulations of microstructures using the Elle platform: a modern research and teaching tool. J. Geo. Soc. India 75, 110–127. doi: 10.1007/s12594-010-0028-6
Pimienta, P., and Duval, P. (1987). Rate controlling processes in the creep of polar glacier ice. J. Phys. Colloq. 48, C1-243–C1-248. doi: 10.1051/jphyscol:1987134
Raj, R., and Ashby, M. F. (1972). Grain boundary sliding, and the effects of particles on its rate. Metallorgr. Trans. 3, 1937–1942. doi: 10.1007/BF02642582
Rasmussen, S. O., Abbott, P. M., Blunier, T., Bourne, A. J., Brook, E., Buchardt, S. L., et al. (2013). A first chronology for the North Greenland Eemian Ice Drilling (NEEM) ice core. Clim. Past 9, 2713–2730. doi: 10.5194/cp-9-2713-2013
Roessiger, J., Bons, P. D., and Faria, S. H. (2014). Influence of bubbles on grain growth in ice. J. Struct. Geo. 61, 123–132. doi: 10.1016/j.jsg.2012.11.003
Roessiger, J., Bons, P. D., Griera, A., Jessell, M. W., Evans, L., Montagnat, M., et al. (2011). Competition between grain growth and grain-size reduction in polar ice. J. Glaciol. 57, 942–948. doi: 10.3189/002214311798043690
Schulson, E. M., and Duval, P. (2009). Creep and Fracture of Ice. Cambridge: Cambridge University Press.
Sheldon, S. G., Steffensen, J. P., Hansen, S. B., Popp, T. J., and Johnsen, S. U. J. (2014). The investigation and experience of using ESTISOL 240 and COASOL for ice-core drilling. Ann. Glaciol. 55, 219–232. doi: 10.3189/2014AoG68A036
Shoji, H., and Higashi, A. (1978). A deformation mechanism map of ice. J. Glaciol. 21, 419–427. doi: 10.1017/S002214300003358X
Smith, C. S. (1964). Some elementary principles pf polycrystalline microstructure. Metallurgical Rev. 9, 1–48. doi: 10.1179/mtlr.1964.9.1.1
Steinbach, F., Bons, P. D., Griera, A., Jansen, D., Llorens, M. G., Roessiger, J., et al. (2016). Strain localization and dynamic recrystallization in the ice–air aggregate: a numerical study. Cryosphere 10, 3071–3089. doi: 10.5194/tc-10-3071-2016
Steinbach, F., Kuiper, E.-J. N., Eichler, J., Bons, P. D., Drury, M. R., Griera, A., et al. (2017). Numerical modelling on deformation and recrystallisation in ice. figshare. doi: 10.6084/m9.figshare.5160997.v1
Trimby, P. W., Drury, M. R., and Spiers, C. J. (2000). Misorientations across etched boundaries in deformed rocksalt: a study using electron backscatter diffraction. J. Struct. Geo. 22, 81–89. doi: 10.1016/S0191-8141(99)00126-1
Trimby, P. W., Prior, D. J., and Wheeler, J. (1998). Grain boundary hierarchy development in a quartz mylonite. J. Struct. Geo. 20, 917–935. doi: 10.1016/S0191-8141(98)00026-1
Tullis, J., Dell'Angelo, L., and Yund, R. A. (1990). “Ductile shear zones from brittle precursors in feldspathic rocks: the role of dynamic recrystallization,” in The Brittle-Ductile Transition in Rocks, eds A. G. Duba, W. B. Durham, J. W. Handin, and H. F. Wang (Washington, DC: American Geophysical Union), 67–81.
Urai, J. L. (1983). Water assisted dynamic recrystallization and weakening in polycrystalline bischofite. Tectonophysics 96, 125–157. doi: 10.1016/0040-1951(83)90247-0
Urai, J. L. (1987). Development of microstructure during deformation of carnallite and bischofite in transmitted light. Tectonophysics 135, 251–263. doi: 10.1016/0040-1951(87)90166-1
Urai, J. L., and Jessell, M. (2001). “Recrystallization and grain growth in minerals: recent developments,” in Recrystallization and Grain Growth, Proceedings of the first Joint International Conference, eds G. Gottstein and D. Molodov (Germany: Springer Verlag), 87–96.
Urai, J. L., Means, W. D., and Lister, G. S. (1986). “Dynamic recrystallization of minerals,” in Mineral and Rock Deformation Laboratory Studies: The Paterson Volume, eds B. E. Hobbs and H. C. Heard (Washington, DC: American Geophysical Union), 161–199.
Urai, J., and Humphreys, J. (2000). A collection of time-lapse movies from transmitted light deformation experiments. In: (Ed.) Mark Jessell, and Janos Urai, Stress, Structure and Strain: a volume in honour of Win D. Means. J. Virtual Explorer. 2:17. doi: 10.3809/jvirtex.2000.00020
Van Der Veen, C. J., and Whillans, I. (1990). Flow laws for glacier ice: comparison of numerical predictions and field measurements. J. Glaciol. 36, 324–339. doi: 10.3189/002214390793701372
Weaire, D., and Rivier, N. (1984). Soap, cells and statistics-random patterns in two dimensions. Contemp. Phys. 25, 59–99. doi: 10.1080/00107518408210979
Weikusat, I., and Kipfstuhl, J. (2010). Data from: Crystal C-Axes (fabric) of Ice Core Samples Collected from the NEEM Ice Core. Pangaea Data Publisher for Earth & Environmental Science. Available online at: http://doi.pangaea.de/10.1594/PANGAEA.744004
Weikusat, I., De Winter, D. A. M., Pennock, G. M., Hayles, M., Schneijdenberg, C. T. W. M., and Drury, M. R. (2011a). Cryogenic EBSD on ice: preserving a stable surface in a low pressure SEM: cryogenic EBSD on ice. J. Microsc. 242, 295–310. doi: 10.1111/j.1365-2818.2010.03471.x
Weikusat, I., Jansen, D., Binder, T., Eichler, J., Faria, S. H., Wilhelms, F., et al. (2017a). Physical analysis of an Antarctic ice core—towards an integration of micro- and macrodynamics of polar ice. Philos. Trans. R. Soc. A Math. Phys. Eng. Sci. 375:20150347. doi: 10.1098/rsta.2015.0347
Weikusat, I., Kuiper, E. J. N., Pennock, G. M., Kipfstuhl, S., and Drury, M. R. (2017b). EBSD in Antarctic and Greenland Ice. Solid Earth Discus. 2017, 1–35. doi: 10.5194/se-2017-12
Weikusat, I., Miyamoto, A., Faria, S. H., Kipfstuhl, S., Azuma, N., and Hondoh, T. (2011b). Subgrain boundaries in Antarctic ice quantified by X-ray Laue diffraction. J. Glaciol. 57, 111–120. doi: 10.3189/002214311795306628
White, S. (1977). Geological significance of recovery and recrystallization processes in quartz. Fabrics Microstruct. Microtectonics 39, 143–170. doi: 10.1016/0040-1951(77)90093-2
Keywords: ice microstructure modeling, cryo-ebsd, fabric analyser, ice deformation, dynamic recrystallization, grain size evolution, grain dissection, neem ice core
Citation: Steinbach F, Kuiper E-JN, Eichler J, Bons PD, Drury MR, Griera A, Pennock GM and Weikusat I (2017) The Relevance of Grain Dissection for Grain Size Reduction in Polar Ice: Insights from Numerical Models and Ice Core Microstructure Analysis. Front. Earth Sci. 5:66. doi: 10.3389/feart.2017.00066
Received: 28 March 2017; Accepted: 09 August 2017;
Published: 26 September 2017.
Edited by:
Maurine Montagnat, Centre National de la Recherche Scientifique (CNRS), FranceReviewed by:
Janos L. Urai, RWTH Aachen University, GermanyAndrea Tommasi, UMR5243 Géosciences Montpellier, France
Sébastien Merkel, Lille University of Science and Technology, France
Copyright © 2017 Steinbach, Kuiper, Eichler, Bons, Drury, Griera, Pennock and Weikusat. This is an open-access article distributed under the terms of the Creative Commons Attribution License (CC BY). The use, distribution or reproduction in other forums is permitted, provided the original author(s) or licensor are credited and that the original publication in this journal is cited, in accordance with accepted academic practice. No use, distribution or reproduction is permitted which does not comply with these terms.
*Correspondence: Florian Steinbach, Zmxvcmlhbi5zdGVpbmJhY2hAdW5pLXR1ZWJpbmdlbi5kZQ==; RmxvcmlhblN0ZWluYmFjaEBnbXguZGU=