Abstract
The Paris Agreement adopted in December 2015 during the COP21 conference stipulates that the increase in the global average temperature is to be kept well below 2°C above “pre-industrial levels” and that efforts are pursued to limit the temperature increase to 1.5°C above “pre-industrial levels.” In order to further increase public acceptance of these limits it is important to transparently place the target levels and their baselines in a paleoclimatic context of the past 150,000 years (Last Interglacial, LIG) and in particular of the last 10,000 years (Holocene; Present Interglacial, PIG). Intense paleoclimatological research of the past decade has firmed up that pre-industrial temperatures have been highly variable which needs to be reflected in the pre-industrial climate baseline definitions. The currently used reference level 1850–1900 represents the end of the Little Ice Age (LIA). The LIA represents the coldest phase of the last 10,000 years when mean temperatures deviated strongly negatively from the Holocene average and which therefore are hard to justify as a representative pre-industrial baseline. The temperature level reached during the interval 1940–1970 may serve as a better reference level as it appears to roughly correspond to the average pre-industrial temperature of the past two millennia. Placing the climate limits in an enlarged paleoclimatic context will help to demonstrate that the chosen climate targets are valid and represent dangerous extremes of the known natural range of Holocene temperature variability.
Introduction
Climate change is one of the most pressing issues for current political planners and requires effective international collaboration. At the Paris climate conference (COP21) on 12 December 2015, 195 countries adopted by consensus a universal, legally binding global climate deal. The agreement entered into force on 4 November 2016 after crossing the threshold of at least 55 countries, responsible for at least 55% of total global heat-trapping emissions, ratifying the Paris Agreement. As of December 2017, a total of 170 Parties have ratified the climate deal. The specific climate goal of the Paris Agreement (United Nations, 2015) is described in Article 2:
This Agreement, in enhancing the implementation of the Convention, including its objective, aims to strengthen the global response to the threat of climate change, in the context of sustainable development and efforts to eradicate poverty, including by:
(a) Holding the increase in the global average temperature to well below 2°C above pre-industrial levels and to pursue efforts to limit the temperature increase to 1.5°C above pre-industrial levels, recognizing that this would significantly reduce the risks and impacts of climate change;
The treaty does not include further definition of the term “above pre-industrial levels.” This is noteworthy, because pre-industrial climate has undergone significant natural fluctuations. The insufficient framing of the pre-industrial baseline in the Paris Agreement has already been highlighted by Knutti et al. (2016) and Hawkins et al. (2017) as an issue for clarification. In this contribution we aim to establish (a) which baseline definitions have been put forward in previous works on global climate targets, (b) discuss these baselines in the context of pre-industrial paleoclimate variability, and (c) evaluate the suitability of different baseline definitions.
Reference levels of the climate targets
The 2°C long-term temperature limit is one of the best known targets in global environmental governance. More recently a more ambitious 1.5°C limit has been added (e.g., Ranger et al., 2012; Schleussner et al., 2016). The objective is to keep global warming well below these limits in order to avoid dangerous climate disruption with consequences that may be uncontrollable. Limiting global warming to 2°C is a challenging goal and according to Iyer et al. (2015) entails a dramatic transformation of the global energy system, that needs to be largely complete by 2040.
William Nordhaus 1977
The two-degree climate change target was first formulated by the economist William Nordhaus in 1975 and refined in 1977 (Nordhaus, 1975, 1977a,b). Nordhaus published his concept at the beginning of the last major warming pulse which lasted from 1977–2000 and led to a rise in global temperature of nearly half a degree. The warming pulse was preceded by several decades of cooling and was followed by a marked slowdown in warming (Fyfe et al., 2016). At the time, Nordhaus (1977a) reasoned (Figure 1):
“One of the more carefully documented examples is the global mean temperature which over the last 100 years has shown a range of variation of five-year averages of about 0.6°C. […] It appears that the uncontrolled path will lead to very large increases in temperature in the coming decades, taking the climate outside of any temperature pattern observed in the last 100,000 years.”
Figure 1
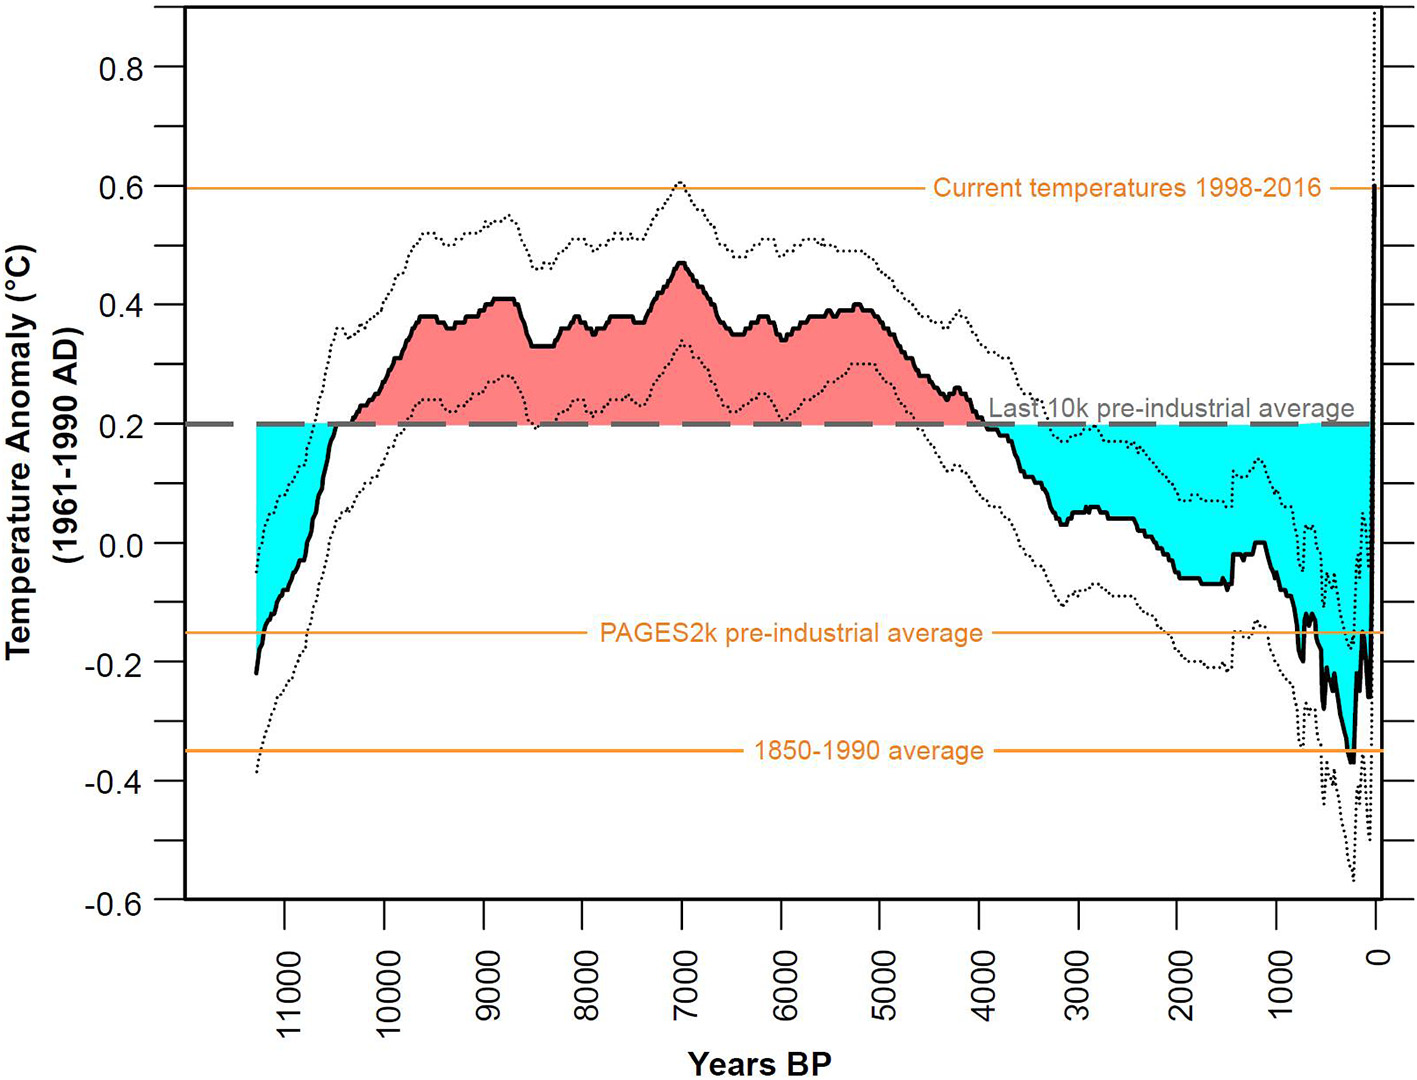
Holocene global average sea surface temperature (SST) reconstruction after Marcott et al. (2013). Dotted lines mark 1σ uncertainty. Gray dashed line represents approximate average SST of past 10,000 years. Other illustrated averages were taken from Figure 2 and refer to global combined land and sea temperatures, hence the greater amplitude.
In a second paper, Nordhaus (1977b) specified his concept:
“As a first approximation, it seems reasonable to argue that the climatic effects of carbon dioxide should be kept within the normal range of long-term climatic variation. According to most sources the range of variation between distinct climatic regimes is in the order of ±5°C, and at the present time the global climate is at the high end of this range. If there were global temperatures more than 2 or 3°C above the current average temperature, this would take the climate outside of the range of observations which have been made over the last several hundred thousand years.”
Jaeger and Jaeger (2011) commented that William Nordhaus just expressed a preliminary intuition and did not support his claims by data or references. In fact, Nordhaus himself admitted freely “that the process of setting standards used in this section is deeply unsatisfactory” (Nordhaus, 1977b, p. 41).
German advisory council for global change (WBGU, 1995)
The next attempt to define the baseline for the climate limit was undertaken in 1995 by the German Advisory Council for Global Change (Wissenschaftlicher Beirat der Bundesregierung Globale Umweltveränderungen, WBGU). In a report the Advisory Council explained (WBGU, 1995):
A tolerable temperature window
The first principle, preservation of Creation in its present form, is presented within this scenario in the form of a tolerable “temperature window.” This window is derived from the range of fluctuation for the Earth's mean temperature in the late Quaternary period. This geological epoch has shaped our present-day environment, with the lowest temperatures occurring in the last ice age (mean minimum around 10.4°C) and the highest temperatures during the last interglacial period (mean maximum around 16.1°C). If this temperature range is exceeded in either direction, dramatic changes in the composition and function of today's ecosystems can be expected. If we extend the tolerance range by a further 0.5°C at either end, then the tolerable temperature window extends from 9.9°C to 16.6°C. Today's global mean temperature is around 15.3°C, which means that the temperature span to the tolerable maximum is currently only 1.3°C.
In 1996, the European Council of environment ministers adopted the 2°C stabilization target and declared that “global average temperatures should not exceed 2 degrees above pre-industrial level and that therefore concentration levels lower than 550 ppm CO2 should guide global limitation and reduction efforts” (European Council, 1996; Randalls, 2010). Subsequently, the two degree target was also adopted by the G8 nations in 2009 and the Cancun Climate Change Conference in 2010. Morseletto et al. (2017) described the adoption process of the climate limits in different phases. Initially, “only a few activist and pioneering countries, notably the Netherlands and Germany, promoted the target.” It then became gradually accepted across the EU before it finally got adopted internationally.
World Bank 2014
In 2014 the World Bank published the report “Turn Down the Heat” which was prepared by the Potsdam Institute for Climate Impact Research (PIK) and the Berlin-based climate think-tank Climate Analytics (World Bank, 2014). The report states that temperatures at the time of publishing were 0.8°C “above pre-industrial levels,” defined through an 1850–1900 base period. Temperatures are averaged over 20 years to eliminate year-to-year variations and uncertainties in the data.
UNFCCC 2015
In a report from 2015, the United Nations Framework Convention on Climate Change (UNFCCC) cites the IPCC who reported an increase of 0.85°C since 1880 which UNFCCC (2015) considers “a good approximation for pre-industrial levels.” In the minutes of the “structured expert dialogue” it is discussed whether 1750 could form a better reference for the climate limit, a baseline that the Intergovernmental Panel on Climate Change (IPCC) has chosen in its 5th Assessment Report (AR5) to separate the pre-industrial from the industrial periods (IPCC, 2013). “Responding to this question, the expert answered that, due to absence of a data set, [IPCC AR5] WGI could not estimate the warming for the period since 1750 as reliably as the temperature changes for the period 1880–2012.”
Paleoclimatological context
The field of paleoclimatology has made major progress over the past decades. While in the times of William Nordhaus in the 1970s pre-industrial temperature development was only roughly known, modern studies have provided high-resolution climate reconstructions based on sophisticated paleontological, isotope and geochemical methods. In the following we will be reviewing the upper and lower limits of pre-industrial natural temperature change and compare these to the ranges defined in the above-mentioned papers and reports on the climate goal.
Furthermore, we will attempt to identify suitable zero lines, which is standard practice in many fields of science and economy, e.g., with regards to coastal tidal ranges. The comparison is subdivided into three different time-scales: (1) Last 150,000 years which include the last Interglacial warm phase, (2) the last 10,000 years (“Holocene”), and (3) the last 2,000 years which include the Roman and Medieval Warm Periods. Obviously, care must be taken when comparing decadally resolved temperatures with less well-resolved proxy data from earlier periods.
Last 150,000 years
The Pleistocene comprises of the last 2.6 million years and is characterized by an alternation of cold glacial and warm interglacial phases. A typical glacial/interglacial cycle lasts 100,000 years, whereby the cold phase usually takes 90% of the time while the interglacial phases make up only 10% of the cycle. The cyclicity is controlled by Milankovitch Earth's orbital cycles. The Last interglacial (LIG) is the Eemian (also known as Marine Isotope Stage 5e, MIS 5e) which occurred 126,000–115,000 years ago. The current Interglacial, i.e., the Holocene (MIS 1), commenced 11,700 years ago and is still ongoing.
Notably, the pre-industrial 100,000 years interval which Nordhaus (1977a,b) considered, does not reach back to the last Interglacial warm phase. In contrast, the WBGU (1995) specifically referred to the LIG as an important historical calibration interval. The IPCC has summarized the global reconstructions and estimates that the LIG global mean annual surface temperature was 1–2°C warmer than “pre-industrial,” i.e., 1850 (IPCC, 2013: Chapter 5, p. 408). Turney and Jones (2010) calculated that global temperatures were on average 1.5°C higher relative to the AD 1961–1990 period. Taking into account that the world has warmed another 0.3°C after 1990, LIG temperatures have likely been 1.2°C above the most recent temperatures averaged over 1998–2016.
How does this compare to the 1.5 and 2.0°C temperature targets? Considering that 0.8°C of warming has already occurred since 1880, the two current climate limits allow only 0.7°C and 1.2°C of future warming, respectively. The comparison shows that natural warming during the LIG already exceeded the 1.5°C climate limit by 0.5°C while it just about reached the upper limit of the 2°C temperature target. LIG temperatures correspond roughly with the upper end of the tolerable temperature window cited by the WBGU (1995). Notably, Pleistocene temperature comparisons are absent in the World Bank (2014) and UNFCCC (2015) reports.
Recent work has focused on sea surface temperatures (SST) which provide an important contribution to global temperatures but generally show much smaller temperature changes than land locations because of the significantly higher heat capacity of water. According to a global SST reconstruction of Hoffman et al. (2017) peak LIG global mean annual SSTs were 0.5 warmer than the climatological mean from 1870 to 1889 and indistinguishable from the 1995 to 2014 mean. Following the LIG, global sea surface temperatures dropped by about 3.5°C (Shakun et al., 2015: their Figure 7a), with even greater cooling occurring on the combined global land and sea area due to temperature change amplification on the continents. A reconstruction by Annan and Hargreaves (2013) suggests that temperatures during the Last Glacial Maximum (LGM) were 4.0°C below a “pre-industrial” reference level that roughly corresponds to 1950s climate (pers. comm. J. Annan, January 2017).
Last 10,000 years
After the end of the last glacial period, temperatures during the early Holocene started to increase again and reached a maximum during the mid-Holocene Thermal Maximum (HTM), an exceptionally warm period 8,000 to 5,000 years before present (BP). Alternative names for this phase are Holocene Climate Optimum (HCO) and Atlantic Period. The warm period is considered a result of Milankovitch Earth's orbital effects, in particular changes in earth axial tilt and distance to the sun (e.g., Otto-Bliesner et al., 2016).
Global average temperature during the HTM was generally warmer than today. An exact quantification of the HTM warming and its comparison to modern temperatures has unfortunately not yet been achieved and requires additional data and detailed correlation effort. An important first step has been made by Ljungqvist (2011) who reviewed the spatio-temporal pattern of the HTM in 60 different reconstructions of annual mean temperature from locations around the globe. The study found a rather coherent period of elevated HTM global mean temperatures exceeding the pre-industrial ones (~1750 AD) by at least 1°C and possibly even more. Notably, one third of the records showed warming of >2°C during peak HTM times.
Two years later Marcott et al. (2013) published a Holocene global temperature reconstruction from 73 globally distributed records (Figure 1). The resulting curve showed the HTM to be 0.4°C warmer than the average period 1961–1990. The authors concluded that modern global mean temperature have not yet exceeded the warmest temperatures of the HTM. As most of the records used by Marcott et al. (2013) originate from marine archives (see Figure S1 in Supplement to their paper), the reconstructed values likely underestimate global HTM temperatures because land locations typically show higher warming rates than ocean sites. Furthermore, fully quantitative proxy comparison of multi-decadal to centennial resolution with annual instrumental temperatures remains challenging due to averaging effects which tend to lower the resulting temperatures.
Based on the temperature reconstructions, it appears that average HTM temperatures have been slightly higher than today. While the exact amount of warming is still unclear, it cannot be ruled out that HTM temperatures have already occasionally exceeded the 1880 pre-industrial level by 1.5°C or more. Accordingly, temperatures in 1977 were not at the high end of natural variability as thought by William Nordhaus. Additional research efforts are clearly needed to compile a robust and globally representative temperature reconstruction for the last 10,000 years, reconciling modeling and reconstruction data (see e.g., “12. Data-Model Comparison” in Supplement to Marcott et al., 2013). This would also enable the definition of a true Holocene “pre-industrial” reference level that takes the significant natural climate variability during this time into account. In the case of the temperature reconstruction of Marcott et al. (2013), the Holocene pre-industrial average of the past 10,000 years—excluding the anthropogenically influenced last 150 years—lies nearly 0.6°C above the 1850–1900 mean (Figure 2).
Figure 2
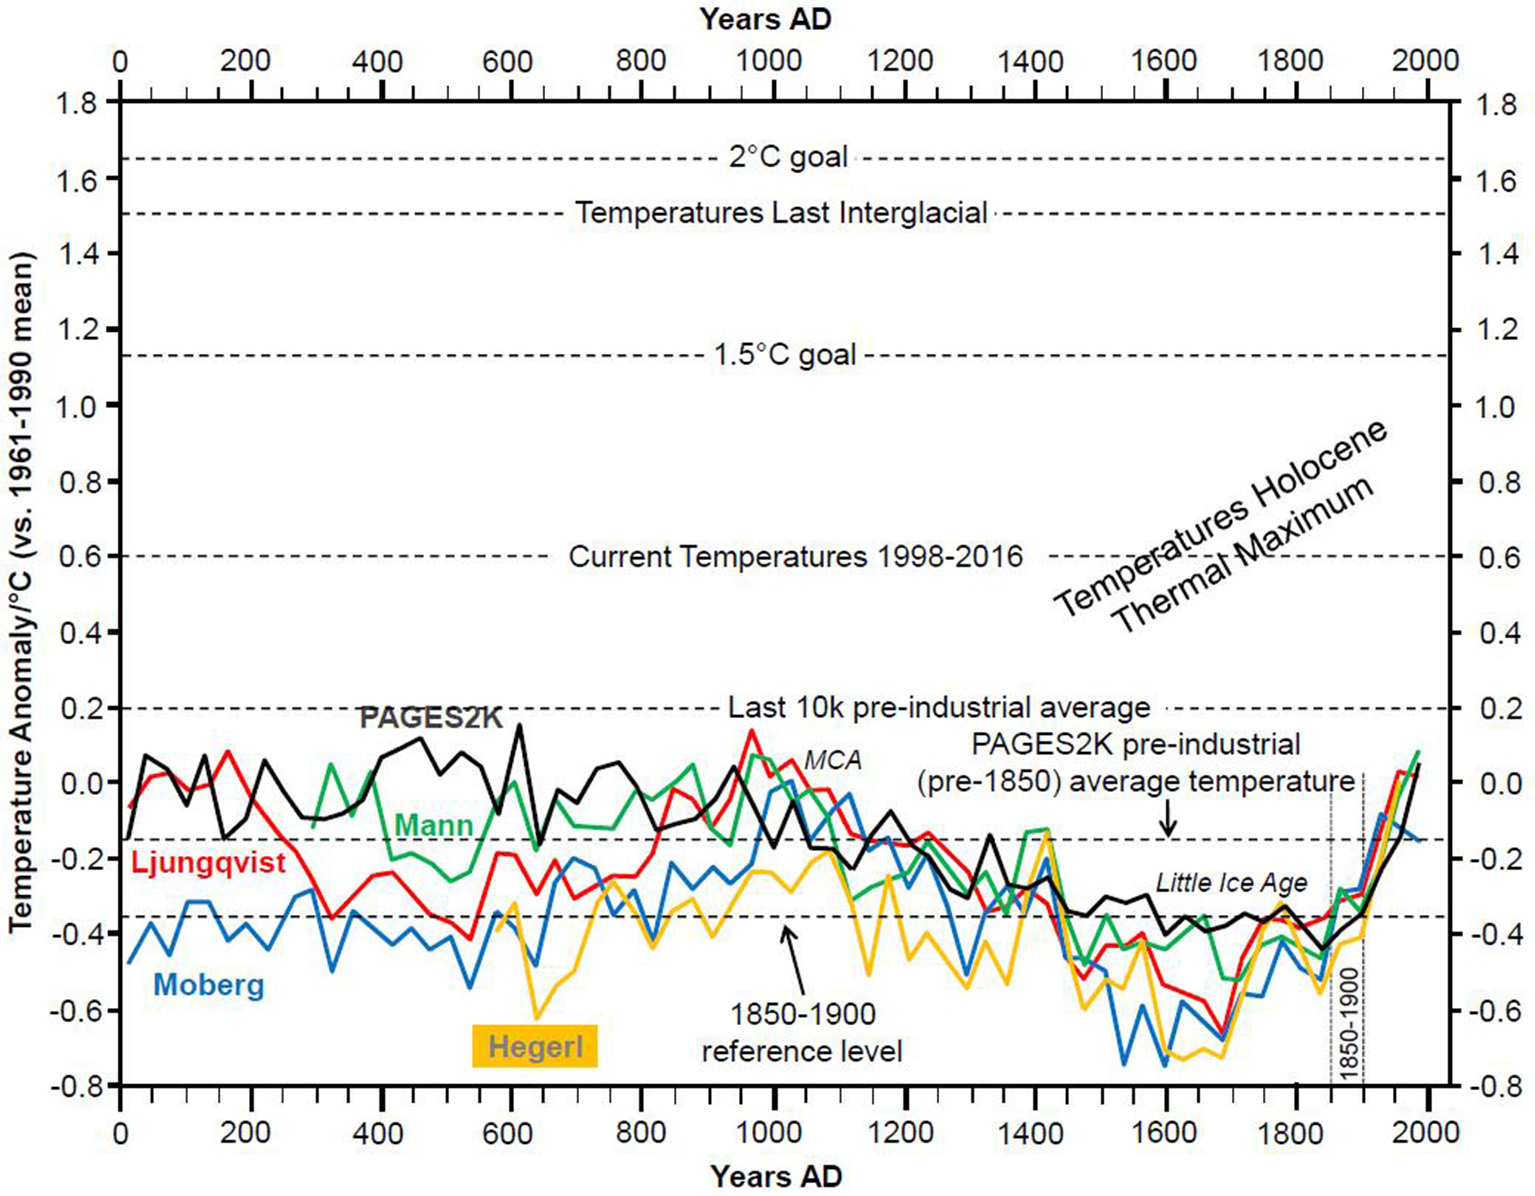
Temperature reconstructions for the past 2,000 years (Moberg et al., 2005; Hegerl et al., 2007; Mann et al., 2008; Ljungqvist, 2010; PAGES 2k Consortium, 2013: area-weighted averages) compared to important reference levels. Average pre-industrial temperature for last 10,000 years (“last 10 k”) after Marcott et al. (2013). Average temperatures of Last Interglacial after Turney and Jones (2010). MCA, Medieval Climate Anomaly. Main temperature curves illustration adapted from PAGES 2k Consortium (2013), used with permission from Nature Publishing Group.
Last 2000 years
Following the HTM, long-term cooling commenced around 4,000 years BP, representing the onset of the Neoglaciation which culminated in the Little Ice Age 1400–1850 AD. Superimposed on the long-term cooling trend are natural temperature fluctuations, which differ somewhat in the various global reconstructions (Moberg et al., 2005; Hegerl et al., 2007; Mann et al., 2008; Ljungqvist, 2010; PAGES 2k Consortium, 2013; McGregor et al., 2015; Figure 2). In several of these reconstructions pre-industrial phases occur during which temperatures have reached a similar intensity as today. Likewise, the pre-industrial average temperature for the period 0–1850 AD varies in the different reconstructions (Figure 2).
Discussion
Pre-industrial temperature variability
Pre-industrial temperatures have undergone marked natural variations at every possible time-scale. Definition of an 1850–1900 “pre-industrial” reference level is therefore simplistic and does not do justice to the significant natural dynamics of the pre-industrial temperature development. Unfortunately, key reports on the climate limits refer to the pre-industrial temperature as if it had been static during past millennia (WBGU, 2009; World Bank, 2014; UNFCCC, 2015). For example, the WBGU (2009) in figure 10 of their report show a monotonously flat temperature curve for the period 1600–1900 AD which is not supported by any of the major global temperature reconstructions. Published curves show fluctuations of 0.2–0.4°C over this period (Moberg et al., 2005; Hegerl et al., 2007; Mann et al., 2008; Ljungqvist, 2010; PAGES 2k Consortium, 2013; Abram et al., 2016).
Choice and paleoclimatic context of chosen baseline value
The baseline of the climate limit was defined by World Bank (2014) and UNFCCC (2015) as the temperature average 1850–1900. Notably, this period marks the end of the Little Ice Age, the latter representing the coldest phase of the entire last 10,000 years (Figures 1, 2). More recently, Hawkins et al. (2017) suggested 1720–1800 as pre-industrial baseline period, which however lies even closer to the coldest phase of the Little Ice Age (Figure 2). The choice of a baseline near the lower extreme of a variable parameter is uncommon in science. An average over a longer pre-industrial interval capturing several natural temperature fluctuations appears more adequate. Suitable averaging time windows may be e.g., the last 1000 years, 2000 years or 10,000 years, always excluding the last 150 years due to anthropogenic influence. Such baselines are more representative of the pre-industrial Holocene climate and avoid bias by natural extremes. For example, the pre-industrial (pre-1850) average temperature of the PAGES2 K (PAGES 2k Consortium, 2013) reconstruction for the past 2000 years lies about 0.2°C above the 1850–1900 temperature mean that has been traditionally chosen as reference level for the climate limits (Figure 2). Notably, re-definition of the temperature baseline does not affect the upper temperature ceiling of the 2° target because it corresponds to the high temperatures of the last interglacial. An upward shift of the previous 1850–1990 reference level by 0.2°C (last 2000 years context) or nearly 0.6°C (Holocene context) to true pre-industrial baselines would result in respective reductions of the 1.5°C/2.0°C numerical values of the temperature targets.
Conclusions
Pre-industrial temperatures have been more variable than previously thought which needs to be reflected in the baseline definitions of climate targets as part of the Paris Agreement. The currently used reference level represents the end of the Little Ice Age, the coldest phase of the entire last 10,000 years. The temperature value of this reference level deviates strongly negatively from the Holocene average temperature and therefore is hard to justify as a pre-industrial baseline. A better reference level may be equivalent to 1940–1970, when temperatures were reached that correspond to the pre-industrial global mean temperature of the past two millennia.
Honoring the findings and guidance of the IPCC AR5, it needs to be made clearer in the climate limit narrative that part of the 0.8°C warming that has already occurred with regards to the 1850–1900 mean is of natural origin, representing the expected temperature rebound after the unusually cold Little Ice Age. Furthermore, the climate limits need to be systematically compared to peak temperatures of key pre-industrial natural warm phases. Temperature reconstructions indicate that pre-industrial temperatures of the past 10,000 years have repeatedly reached a similar or even higher intensity as present-day climate.
Placing the climate limit in an enlarged paleoclimatic context will help to demonstrate that the chosen climate targets are valid and represent dangerous extremes of the known natural range of Holocene temperature variability. It would be important that these issues are openly addressed in the planned IPCC Special Report on the climate limits (IPCC, 2018).
Statements
Author contributions
SL studied the palaeo-temperature reconstructions. FV analyzed the definition and history of the 2-degrees-target. The discussion and conclusion was written jointly.
Acknowledgments
We are grateful to Selvaraj Kandasamy and Xander Wang whose reviews helped to greatly improve the manuscript. Thank you also to Jens Kröger for his valuable project support.
Conflict of interest
SL is a geoscientist with many years of academic experience and solid publication track record. His scientific training enables him to work effectively with interdisciplinary datasets and interpret their respective implications. The research presented here was carried out as a member of the Institute for Hydrography, Geoecology and Climate Sciences, Switzerland. The study is fully independent from SL's current daytime employment in the Conventional Energy sector. The project did not receive any funding, nor was it commissioned or supported by industry. In line with the IPCC policy, it is important in the climate and associated policy discussion that all views are heard and are fairly represented. FV has been employed in the Renewables Energy sector.
References
1
AbramN. J.McGregorH. V.TierneyJ. E.EvansM. N.McKayN. P.KaufmanD. S.et al. (2016). Early onset of industrial-era warming across the oceans and continents. Nature536, 411–418. 10.1038/nature19082
2
AnnanJ. D.HargreavesJ. C. (2013). A new global reconstruction of temperature changes at the Last Glacial Maximum. Clim. Past9, 367–376. 10.5194/cp-9-367-2013
3
European Council (1996). Community Strategy on Climate Change - Council Conclusions. Available online at: http://europa.eu/rapid/press-release_PRES-96-188_en.htm?locale=en
4
FyfeJ. C.MeehlG. A.EnglandM. H.MannM. E.SanterB. B.FlatoG. M.et al. (2016). Making sense of the early-2000s warming slowdown. Nat. Clim. Change6, 224–228. 10.1038/nclimate2938
5
HawkinsE.OrtegaP.SucklingE.SchurerA.HegerlG.JonesP.et al. (2017). Estimating changes in global temperature since the pre-industrial period. Bull. Am. Meteorol. Soc.98, 1841–1856. 10.1175/BAMS-D-16-0007.1
6
HegerlG. C.CrowleyT. J.AllenM.HydeW. T.PollackH. P.SmerdonJet al. (2007). Detection of human influence on a new, validated 1500-year temperature reconstruction. J. Clim.20, 650–666. 10.1175/JCLI4011.1
7
HoffmanJ. S.ClarkP. U.ParnellA. C.HeF. (2017). Regional and global sea-surface temperatures during the last interglaciation. Science355, 276–279. 10.1126/science.aai8464
8
IPCC (2013). Climate Change 2013: The Physical Science Basis. Contribution of Working Group I to the Fifth Assessment Report of the Intergovernmental Panel on Climate Change. Cambridge University Press, Cambridge, United Kingdom; New York, NY, 1535.
9
IPCC (2018). Special Report on Global Warming of 1.5°C Above Pre-Industrial Levels and Related Global Greenhouse Gas Emission Pathways. Available online at: http://www.ipcc.ch/report/sr15/
10
IyerG. C.EdmondsJ. A.FawcettA. A.HultmanN. E.AlsalamJ.AsrarG. R.et al. (2015). The contribution of Paris to limit global warming to 2°C. Environ. Res. Lett.10:125002. 10.1088/1748-9326/10/12/125002
11
JaegerC. C.JaegerJ. (2011). Three views of two degrees. Reg. Environ. Change11, 15–26. 10.1007/s10113-010-0190-9
12
KnuttiR.RogeljJ.SedlacekJ.FischerE. M. (2016). A scientific critique of the two-degree climate change target. Nat. Geosci. 9, 13–18. 10.1038/ngeo2595
13
LjungqvistF. C. (2010). A new reconstruction of temperature variability in the extra-tropical northern hemisphere during the last two millennia. Geogr. Ann. A92, 339–351. 10.1111/j.1468-0459.2010.00399.x
14
LjungqvistF. C. (2011). The spatio-temporal pattern of the mid-Holocene Thermal Maximum. Geografie–Sborník C. G. S. 116, 91–110.
15
MannM. E.ZhangZ.HughesM. K.BradleyR. S.MillerS. K.RutherfordS.et al. (2008). Proxy-based reconstructions of hemispheric and global surface temperature variations over the past two millennia. Proc. Natl. Acad. Sci. U.S.A.105, 13252–13257. 10.1073/pnas.0805721105
16
MarcottS. A.ShakunJ. D.ClarkP. U.MixA. C. (2013). A reconstruction of regional and global temperature for the past 11,300 years. Science339, 1198–1201. 10.1126/science.1228026
17
McGregorH. V.EvansM. N.GoosseH.LeducG.MartratB.AddisonJ. A.et al. (2015). Robust global ocean cooling trend for the pre-industrial Common Era. Nat. Geosci. 8, 671–677. 10.1038/ngeo2510
18
MobergA.SonechkinD. M.HolmgrenK.DatsenkoN. M.KarlénW.LauritzenS. E. (2005). Highly variable Northern Hemisphere temperatures reconstructed from low- and high-resolution proxy data. Nature433, 613–617. 10.1038/nature03265
19
MorselettoP.BiermannF.PattbergP. (2017). Governing by targets: reductio ad unum and evolution of the two-degree climate target. Int. Environ. Agreements Politics Law Econ.17, 655–676. 10.1007/s10784-016-9336-7
20
NordhausW. D. (1975). Can We Control Carbon Dioxide? IIASA Working, Paper WP-75-63. 1–47. Available online at: http://www.iiasa.ac.at/Admin/PUB/Documents/WP-75-063.pdf
21
NordhausW. D. (1977a). Economic growth and climate: the carbon dioxide problem. Am. Econ. Rev.67, 341–346.
22
NordhausW. D. (1977b). Strategies for the Control of Carbon Dioxide. Cowles Foundation Discussion Paper No. 443. Cowles Foundation, New Haven, CT. 1–78. Available online at: https://cowles.yale.edu/sites/default/files/files/pub/d04/d0443.pdf
23
Otto-BliesnerB. L.BraconnotP.HarrisonS. P.LuntD. J.Abe-OuchiA.AlbaniS.et al. (2016). The PMIP4 contribution to CMIP6 - Part 2: two interglacials, scientific objective and experimental design for holocene and last interglacial simulations. Geosci. Model Dev. Discuss. 2016, 1–36. 10.5194/gmd-2016-279
24
PAGES 2k Consortium (2013). Continental-scale temperature variability during the past two millennia. Nat. Geosci. 6, 339–346. 10.1038/ngeo1797
25
RandallsS. (2010). History of the 2°C climate target. Wiley Interd. Rev. Clim. Change1, 598–605. 10.1002/wcc.62
26
RangerN.GoharL. K.LoweJ. A.RaperS. C. B.BowenA.WardzsfR. E.et al. (2012). Is it possible to limit global warming to no more than 1.5°C?Clim. Change111, 973–981. 10.1007/s10584-012-0414-8
27
SchleussnerC. F.LissnerT. K.FischerE. M.WohlandJ.PerretteM.GollyA.et al. (2016). Differential climate impacts for policy-relevant limits to global warming: the case of 1.5 °C and 2 °C. Earth Syst. Dynam. 7, 327–351. 10.5194/esd-7-327-2016
28
ShakunJ. D.LeaD. W.LisieckiL. E.RaymoM. E. (2015). An 800-kyr record of global surface ocean and implications for ice volume-temperature coupling. Earth Planet. Sci. Lett.426, 58–68. 10.1016/j.epsl.2015.05.042
29
TurneyC. S. M.JonesR. T. (2010). Does the Agulhas Current amplify global temperatures during super-interglacials?J. Q. Sci.25, 839–843. 10.1002/jqs.1423
30
UNFCCC (2015). Report on the structured expert dialogue on the 2013–2015 Review. FCCC/SB/2015/INF.1. Available online at: http://unfccc.int/resource/docs/2015/sb/eng/inf01.pdf
31
United Nations (2015). Paris Agreement. Available online at: http://unfccc.int/files/essential_background/convention/application/pdf/english_paris_agreement.pdf
32
World Bank (2014). Turn Down the Heat: Confronting the New Climate Normal.Washington, DC: World Bank.
33
WBGU (1995). Scenario for the Derivation of Global CO2 Reduction Targets and Implementation Strategies. Available online at: https://tinyurl.com/y9updved
34
WBGU (2009). Solving the Climate Dilemma: The Budget Approach. Special Report, Berlin. Available online at: http://www.wbgu.de/fileadmin/user_upload/wbgu.de/templates/dateien/veroeffentlichungen/sondergutachten/sn2009/wbgu_sn2009_en.pdf
Summary
Keywords
Paris agreement, temperature reconstructions, palaeoclimates, little ice age, global warming
Citation
Lüning S and Vahrenholt F (2017) Paleoclimatological Context and Reference Level of the 2°C and 1.5°C Paris Agreement Long-Term Temperature Limits. Front. Earth Sci. 5:104. doi: 10.3389/feart.2017.00104
Received
06 October 2017
Accepted
30 November 2017
Published
12 December 2017
Volume
5 - 2017
Edited by
Mohammad Mofizur Rahman Jahangir, Bangladesh Agricultural University, Bangladesh
Reviewed by
Selvaraj Kandasamy, Xiamen University, China; Xander Wang, University of Louisiana at Lafayette, United States
Updates
Copyright
© 2017 Lüning and Vahrenholt.
This is an open-access article distributed under the terms of the Creative Commons Attribution License (CC BY). The use, distribution or reproduction in other forums is permitted, provided the original author(s) or licensor are credited and that the original publication in this journal is cited, in accordance with accepted academic practice. No use, distribution or reproduction is permitted which does not comply with these terms.
*Correspondence: Sebastian Lüning luening@ifhgk.org
This article was submitted to Interdisciplinary Climate Studies, a section of the journal Frontiers in Earth Science
Disclaimer
All claims expressed in this article are solely those of the authors and do not necessarily represent those of their affiliated organizations, or those of the publisher, the editors and the reviewers. Any product that may be evaluated in this article or claim that may be made by its manufacturer is not guaranteed or endorsed by the publisher.