 Frank Guldstrand
 Olivier Galland1
 Erwan Hallot
 Steffi Burchardt
- 1Physics of Geological Processes (PGP), The NJORD Centre, Department of Geosciences, University of Oslo, Oslo, Norway
- 2Univ Rennes, CNRS, Géosciences Rennes - UMR 6118, Rennes, France
- 3Department of Earth Sciences, Uppsala University, Uppsala, Sweden
- 4Centre for Natural Hazards and Disaster Science, Department of Earth Sciences, Uppsala University, Uppsala, Sweden
Volcanic eruptions pose a threat to lives and property when volcano flanks and surroundings are densely populated. The local impact of an eruption depends firstly on its location, whether it occurs near a volcano summit, or down on the flanks. Then forecasting, with a defined accuracy, the location of a potential, imminent eruption would significantly improve the assessment and mitigation of volcanic hazards. Currently, the conventional volcano monitoring methods based on the analysis of surface deformation assesses whether a volcano may erupt but are not implemented to locate imminent eruptions in real time. Here we show how surface deformation induced by ascending eruptive feeders can be used to forecast the eruption location through a simple geometrical analysis. Our analysis builds on the results of 33 scaled laboratory experiments simulating the emplacement of viscous magma intrusions in a brittle, cohesive Coulomb crust under lithostatic stress conditions. The intrusion-induced surface deformation was systematically monitored at high spatial and temporal resolution. In all the experiments, surface deformation preceding the eruptions resulted in systematic uplift, regardless of the intrusion shape. The analysis of the surface deformation patterns leads to the definition of a vector between the center of the uplifted area and the point of maximum uplift, which systematically acted as a precursor to the eruption's location. The temporal evolution of this vector indicated the direction in which the subsequent eruption would occur and ultimately the location itself, irrespective of the feeder shapes. Our findings represent a new approach on how surface deformation on active volcanoes that are not in active rifts could be analysed and used prior to an eruption with a real potential to improve hazard mitigation.
Key Points
• We quantitatively analyse pre-eruptive intrusion-induced surface deformation from 33 scaled laboratory experiments resulting in eruptions.
• A robust proxy extracted from surface deformation geometry enables systematic predictions of the locations of a subsurface intrusion and imminent eruption.
• Forecasting an eruption location is possible without geodetic modeling but requires volcano monitoring at high spatiotemporal resolution.
Introduction
Preceding any potential volcanic eruption, the propagation of magma at shallow depth induces deformation of the Earth's surface (Dzurisin, 2007). During the last decade, geodetic measurements of ground deformation due to such magmatic intrusions have become a standard tool in monitoring active volcanic systems (Amelung et al., 2000; Wright et al., 2006; Sigmundsson et al., 2010, 2015). These tools commonly include tiltmeters (Toutain et al., 1992), Global Navigation Satellite Systems (GNSS; Bonforte and Guglielmino, 2015; Lee et al., 2015), Interferometry Synthetic Aperture Radar (InSAR; Massonnet et al., 1995; Lanari et al., 1998; Fukushima et al., 2005), and photogrammetry (Cayol and Cornet, 1998; Hollingsworth et al., 2013; Hibert et al., 2015).
Surface deformation is one of the several routinely monitored observables from active volcanic regions that are used to assess the volcano's behavior and eruption probability. However, pre-eruptive geodetic data from active volcanoes that were acquired at high frequency suggest that they contain some precursory signals useful to track the pre-eruptive propagation of volcanic feeders (e.g., Toutain et al., 1992; Cannavò et al., 2015). Thus, they may have the potential to be used to forecast the location of subsurface magma in real time. Nevertheless, systematic and robust surface deformation precursors for volcanic eruption locations have not been identified yet.
Here we present results from 33 scaled laboratory models of shallow intrusions that ultimately fed eruptions (Figure 1). During each experiment we periodically monitored the surface deformation caused by the subsurface propagation of the feeder. A simple geometrical analysis of the surface deformation data reveals that the eruption locations were systematically forecastable without performing any geodetic modeling. We also observe that distinct shapes of the eruptive feeders, here dykes and cone sheets, exhibit distinct, characteristic surface deformation signatures. We conclude that geodetic surface deformation data, if acquired at high enough spatial and temporal resolutions, do have the potential to be used to follow magma pathways at shallow depth and to forecast the locations of imminent volcanic eruptions without any modeling.
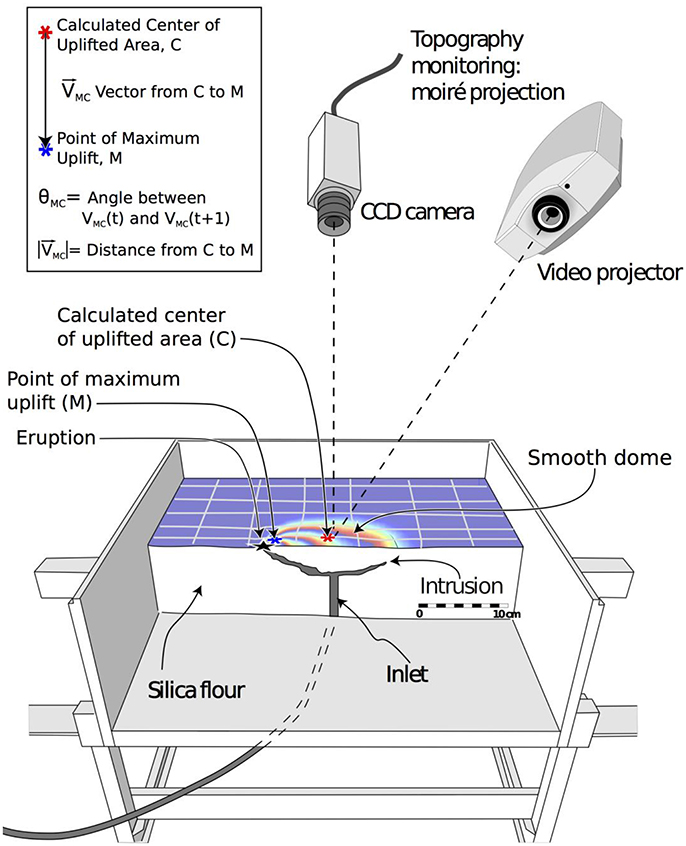
Figure 1. Experimental device used to simulate shallow intrusions of oil into silica flour (adapted from (Galland, 2012) with permission, Galland et al., 2006, 2014), which induced uplift of the surface of the models that were periodically monitored (1.5 s time steps) using a moiré projection system (Bréque et al., 2004; Galland, 2012), and fed eruptions (black star). At each time step of a given experiment, simple geometrical parameters (see legend box) were calculated from the surface uplift map. This study shows that their evolution with time represents a precursor for the location of the next eruption.
Method
Experimental Protocol
All the experiments were performed in the experimental apparatus of, and using the experimental protocol described by Galland et al. (2009), Galland (2012), Galland et al. (2014), and Guldstrand et al. (2017). Galland et al. (2006) describe in detail the mechanical properties of the model materials and the scaling of the models. Below, we briefly summarize the experimental materials and protocol.
The model materials are fine-grained silica flour and molten vegetable oil, to simulate brittle rocks and magma, respectively. The flour consists of fine (~15 μm), angular grains of crystalline silica flour. It has a cohesive strength of 369 ± 44 Pa, a friction coefficient of 0.81 ± 0.06 (corresponding to an angle of internal friction of ~39°) and a tensile strength of 100 Pa (Galland et al., 2006, 2009). As 1 cm in the models represents 100–1,000 m in nature, the resulting stress ratio indicates that the model crust should be 13 × 103-250 × 103 times weaker than its geological prototype (Abdelmalak et al., 2016). The silica flour fulfills this criterion. It reproduces the brittle Coulomb behavior of the Earth's crust (Abdelmalak et al., 2016). Additionally, the flour is cohesive and has the ability to stand non-negligible elastic stresses along stable vertical walls (Abdelmalak et al., 2016). However, the elastic properties of silica flour remain poorly constrained, as is the case for granular materials in general. It is therefore challenging to address how the elastic stresses in our models scale with those in geological systems (Galland et al., 2017).
The model magma consists of a vegetable oil that is solid at room temperature and melts at ~31°C (Galland et al., 2006). Molten, it is a Newtonian fluid with a weak temperature-dependent viscosity (Galland et al., 2006). Using these materials, a generic experiment consists in injecting hot oil into the flour at room temperature to generate an intrusion. At the injection temperature of ~50°C, the oil exhibits a viscosity of 2 × 10⁻² Pa s and a density of 890 kg m−3. Oil percolation within the flour during injection is inhibited as silica is chemically incompatible with the oil and an oil intrusion is dominantly accommodated by deformation of the flour (Galland et al., 2006). During an experiment, the effects of cooling of the oil against the flour can be neglected, as intrusion durations are shorter than conductive cooling timescales. Our model scales through assuming that the ratio of viscous stresses in the oil/magma to the cohesion of the flour/host rock are identical in the model and nature (Galland et al., 2014). In nature, magma velocities can be of the order of 1–10−2 m s−1 (Toutain et al., 1992). The experimental device allows for oil velocities of 10−3-10−1 m s−1. As magma viscosities cover a wide range (10–107 Pa s), relevant model viscosities fall in the range 4 × 10⁻⁹-75 Pa s, which the oil fulfills. To simplify, the oil at 50°C dominantly represents a rather viscous magma of intermediate to felsic composition.
For a generic experiment, the experimental setup consists of a 40 cm wide square box with a circular inlet pipe at its center, into which a known mass of silica flour is poured. Then a high-frequency vibrator shakes the box to compact the flour until a bulk density of 1,050 kg m−3 is reached. A flat metal plate is placed onto the model surface during compaction to ensure repeatable experiment preparation and an initial flat and horizontal surface of the models; the metal plate is removed after compaction. A volumetric pump injects the molten oil at constant flow rate through the circular inlet. With such a setup, it is possible to vary, among other parameters, the injection depth, the diameter of the inlet, and the flow rate. Depending on these parameter settings, the models systematically produce various geometries of intrusions, such as vertical sheet intrusions (dykes) and cone sheets (Figure 2; Galland et al., 2014). The vertical sheet intrusions initiated at the inlet and propagated to the surface. They often split to form a hull-shaped termination or turned into inclined sheets before reaching the surface (Galland et al., 2014).
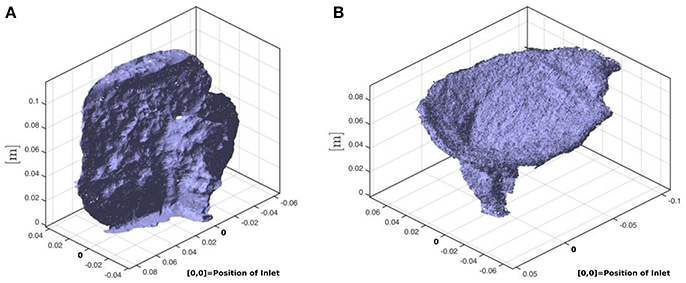
Figure 2. Typical intrusions produced using our experimental setup, (A) vertical sheet intrusion classified as dyke and (B) cone sheet (reprinted with permission from Guldstrand et al., 2017).
Surface Data
The surface deformation data used in the present study were acquired during 33 out of the 51 experiments from Galland et al. (2014). Note that although surface deformation was monitored during all their experiments, Galland et al. (2014) focused on the dynamics of the intrusion processes at depth and on the resulting intrusion shapes, only. The resulting surface deformation dataset has subsequently been analyzed by Guldstrand et al. (2017), who focused on mechanical interpretations associated with the intrusion mechanisms at depth. The present analysis of the dataset is different and discusses the implications for volcanic hazards assessment. The 33 experiments considered here correspond to those for which enough surface deformation data were available during the entire duration of the experiments. They are representative of the full ranges of the parameters explored by Galland et al. (2014).
During the experiments, surface data were monitored using a moiré projection apparatus. The moiré monitoring (Bréque et al., 2004; Galland, 2012) was performed through projecting sets of illuminated straight fringes onto the model surface. The fringes remain straight on a flat surface but deform when projected on a surface with topography, producing curved fringe patterns. A video camera perpendicular to the surface captured the evolving fringe patterns on the model surface periodically (by successive scans starting at time step intervals of 1.5 s), which were subsequently analyzed to compute time series of digital elevation models (DEMs; Bréque et al., 2004). The duration of a scan for the acquisition of an individual DEM was ~1 s and we chose to set the time of each DEM at the beginning of each scan. Focussing on surface deformation induced by the intrusions, we have analyzed differential digital elevation models (ΔDEMs) obtained from the difference between the DEMs at given time steps and the DEM of the initial model surface. To limit noise effects, ΔDEM data were smoothed. The lateral resolution of the ΔDEMs is <1 mm, and the vertical precision of the smoothed ΔDEMs is ~0.1 mm (Guldstrand et al., 2017). As only uplifts were observed for both dyke and cone sheet experiments, for each ΔDEM we have defined the group of pixels corresponding to the uplifted area using an uplift threshold criterion of 0.1 mm. We have then calculated the location of the mean center (C) of the uplifted area by averaging the positions of each pixel in the uplifted area, giving the same weight to each pixel (Figure 1). The locations of the centers of the uplifted areas were then known for each time step of each experiment in a consistent way. The uplifted areas never extended further than about 15 cm from the box walls, so that sidewall effects are assumed to be negligible. This is confirmed by the random location of the eruption sites in our experimental series.
The experiments lasted between a few seconds up to about 1 min, from the time at which the injection started up to the time at which the oil erupted. The second and the last scans of moiré projections started at about the same times, within errors of 1.5 s, as the injection started and the eruption occurred, respectively. To compare experiments of varying durations, we have normalized the time t at a given time step by the experiment duration, te. Therefore, for each experiment, the dimensionless time, t/te, which varied from 0 to 1, approximately represents the relative duration of the intrusion up to the eruption.
Results
The 33 experiments that produced suitable surface deformation data lasted from ~6 to ~53 s. They produced 16 dykes and 17 cone sheets depending on the values of depth and diameter of the injection inlet, as well as the injection velocity of the oil (Galland et al., 2014; Guldstrand et al., 2017).
All the experiments, i.e., both those producing dykes and cone sheets, displayed an initial symmetrical bell-shaped uplift of the surface followed by the development of an uplift asymmetry that grew until the oil erupted in the immediate vicinity of the point of maximum uplift (Figure 3; Guldstrand et al., 2017). The dykes systematically triggered uplift, regardless of their final shapes, i.e., vertical sheets with or without, split or inclined terminations. To quantify the uplift asymmetry, we have calculated the positions of (1) the center of the uplifted area and (2) the point of maximum uplift at each time step (points C and M, respectively, Figure 1). We defined a vector, , connecting these points.
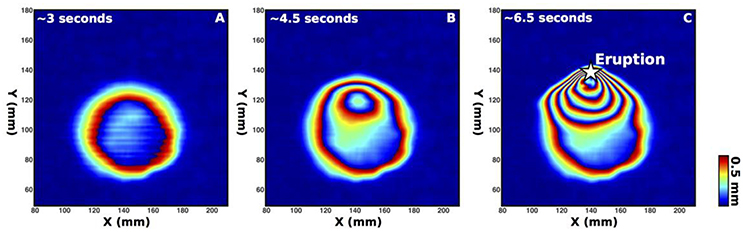
Figure 3. Differential digital elevation models (ΔDEMs) at early (A), intermediate (B) and ultimate (C) time steps measured during a representative dyke experiment. ΔDEM is displayed as fringes, each fringe series corresponding to an uplift of 0.5 mm.
During the early stages of uplift, in all the experiments, points C and M closely clustered, as illustrated by the short vectors (Figures 4C,D), the orientation of which strongly varied with time. The points of maximum uplift (M) then migrated away from the center (C), as shown by the lengthening of (Figures 4C,D). Concomitantly, the orientation of focused and stabilized in azimuth with time. Importantly, in all the experiments, ultimately pointed toward the subsequent eruption location (Figures 4C,D). The eruptions systematically initiated at the intersection between the ultimate direction and the marginal border-zone of the uplifted area.
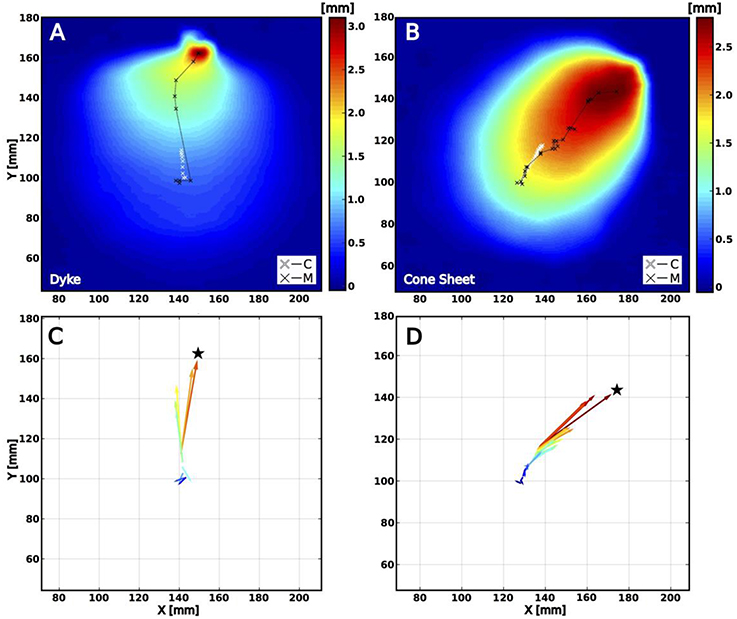
Figure 4. (A,B) ΔDEM before eruption for a representative dyke (A) and cone sheet (B) experiment (uplift in mm). White and black crosses show the successive locations of the centers (C) of the uplifted area, and of the maximum uplifts (M), respectively. (C,D) Plots of the successive vectors computed from the respective maps, (A,B), from the early (dark blue) to the final stages (dark red). A black star locates the eruption points. Final points of maximum uplifts almost locate the eruptions.
We also calculated (1) the evolution of scaled by the injection depth (d) and (2) the rotation angle (θMC) of the vectors between two successive time steps (Figures 5, 6). For each experiment, the evolution of quantifies how point M moved away from C, and θMC indicates the stability of the direction of VMC. We arbitrarily consider that θMC was stable once it remained <20°.
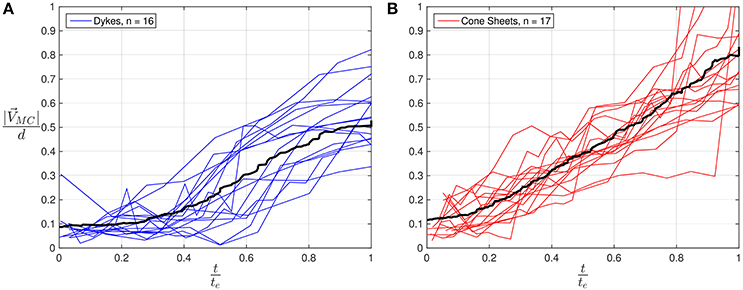
Figure 5. Plots of scaled by the injection depth (d) against dimensionless time, t/te for dyke (A) and cone sheet (B) experiments. Black lines mark the respective moving averages.
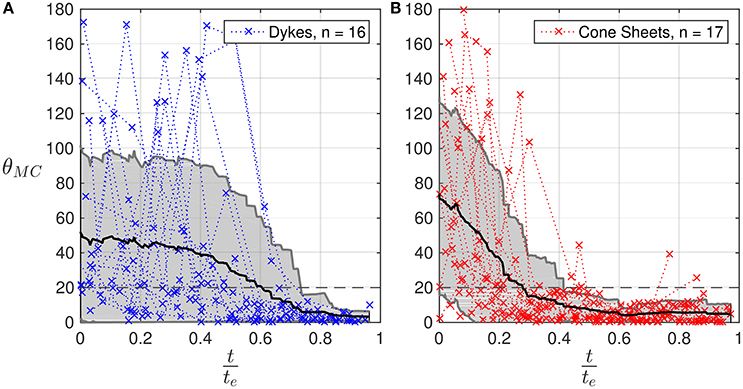
Figure 6. Plots of the rotation angles θMC between two successive vectors VMC as a function of dimensionless time, t/te, for the dyke (A) and cone sheet (B) experiments. Each graph displays the corresponding θMC moving mean (black line) and standard deviation (gray area). For cone sheets, the orientation of the vector generally stabilizes (θMC decreases below 20°, gray dashed line) earlier (t/te ~0.3) than for dykes (t/te~0.6).
There are systematic differences in the evolution of and θMC for dykes and cone sheets (Figures 5, 6). During dyke experiments, on average, remained small until t/te~0.4, from which increased rapidly before stabilizing again at t/te~0.8 (Figure 5A), displaying an overall stepwise or two-phase evolution. In detail for each individual experiment, the rapid increase started at different times (t/te~0.2 to 0.8; Figure 5A) and was often relatively short in time. In contrast, for cone sheets, exhibited a gradual, progressive, quasi-linear increase (Figure 5B). In addition, for most of the dykes, θMC was highly variable for more than half of the experiment durations (up to t/te~0.6; Figure 6A) before decreasing and stabilizing, whereas for cone sheets, θMC generally stabilized earlier (t/te ~ 0.3; Figure 6B).
Interpretation and Discussion
During the 33 experiments, the vector systematically pointed toward the location of the subsequent eruption once approximately stabilized in azimuth (± 20°; Figures 4, 6). As is a parameter that was directly extracted from surface deformation data using only minimal calculations, real-time measurements of are potentially achievable in natural systems. Therefore, the evolution of represents a robust geometrical precursor that could be useful in forecasting where a real eruption should occur, with substantial implications for hazard mitigation in active volcanic areas.
Consistent with our observations, previous two-dimensional (Abdelmalak et al., 2012) and three-dimensional (Galland, 2012) experiments, as well as theoretical models of surface uplift due to sheet intrusions (Pollard and Holzhausen, 1979; Okada, 1985), have also shown that the points of maximum uplift roughly locate the shallowest parts of intrusive feeders, such as dyke tips, at depth. Hence, the migration of a point of maximum uplift at the Earth's surface in volcanic areas likely represents a relevant geometric proxy to locate where magma is the shallowest and is ascending underground.
The distinct surface deformation signatures associated with the experimental dykes and cone sheets likely reflect contrasting emplacement dynamics (cf. Guldstrand et al., 2017). The progressive increase of from the earliest stages of subsurface propagation reflects the gradual asymmetrical propagation of a cone sheet (Figure 5B). Conversely, the stepwise or two-phase increase of is interpreted to indicate a two-stage evolution with (1) an initial vertical ascent of a dyke at depth, followed by (2) the interaction with the free surface and possible splitting of the dyke tip or oblique propagation toward the surface from a shallower depth (Mathieu et al., 2008; Abdelmalak et al., 2012; Galland et al., 2014). The stabilization of the orientation of (Figure 6B) may coincide with this second phase. In addition, the contrasting signatures of the experimental dykes and cone sheets suggest that real-time analysis of the deformation of natural surfaces can be useful to infer the geometry of a propagating intrusion prior to an eruption.
Our model uses an initial flat surface and does not include the effect of an initial topography or slope, often relevant for volcanic systems. Additionally, our model crust material is homogeneous and does not account for any heterogeneity that may also influence surface deformation signatures due to intrusions. Whether or not our method applies for shallow intrusions that develop elsewhere than under flat volcanic fields or calderas and in stratified and/or fractured crusts has not been tested. However, we expect that any magma-induced surface deformation will reflect the underlying developing asymmetry of the intrusion, in which case the method proposed here should still be applicable from a non-flat initial surface and a heterogeneous crust.
The surface deformation above our experimental dykes differs from that associated with dykes emplaced in rifts (e.g., Wright et al., 2006; Biggs et al., 2009; Sigmundsson et al., 2015) and the expected deformation predicted by static elastic analytical models of dykes (e.g., Okada, 1985). The latter display two prominent lobes of uplift separated by a trough aligned above the dyke apex. In contrast, our experimental dykes only triggered surface uplift, regardless of whether the intrusions propagated vertically up to the surface or deviated into inclined sheets. Guldstrand et al. (2017) attributed the difference with the static elastic models to the use of a weakly elastic, cohesive Mohr-Coulomb flour, in which the experimental dykes likely propagated as viscous indenters instead of resulting in pure elastic tensile fractures. In addition, the experiments account for magma flow and intrusion propagation, whereas elastic models are static. They are thus likely relevant for volcanic systems where the shallow crust is weak (e.g., Thun et al., 2016) and/or in which the intruding magma is relatively viscous (Galland et al., 2014; Guldstrand et al., 2017). Guldstrand et al. (2017) also attributed the difference with surface deformation measured in rifts to the absence of far-field tectonic extension in the experiments, thus making them relevant for volcanic systems that are not located in rifts.
Uplifting in the form of doming is commonly measured in active volcanic areas and models of inflating/pressurized spherical sources or horizontal sheet-intrusions generally fits such uplifts (e.g., Pedersen and Sigmundsson, 2006; Walter and Motagh, 2014). From our results, an alternative interpretation may consist in propagating vertical sheet intrusions through a Mohr-Coulomb crust (Guldstrand et al., 2017). Moreover, as our experiments produced inclined sheets on top of some vertical dykes, and cone sheets, our analysis may also be relevant for interpreting surface deformation in volcanic areas prone to forming inclined sheets and cone sheets (e.g., Bagnardi et al., 2013).
As mentioned above, the relevance of using points of maximum uplift has been proposed earlier. Such points have been recorded among geodetic data measured on active volcanoes, e.g., at Piton de la Fournaise, Réunion Island (Toutain et al., 1992). The data and interpretation of Toutain et al. (1992) satisfactorily compare to those from our experiments. Indeed, the correlation between the zone of maximum uplift and the eruption location, as well as the two-stage behavior of the surface deformation due to an intrusive feeder that was interpreted as a dyke, exhibit encouraging similarities with our experimental results. Another famous example was the prominent asymmetrical bulging preceding the 1980 eruption of Mount Saint Helens (Dzurisin, 2007, and references therein). The bulging flank of the volcano happened to be the location of the 1980 explosion, and laboratory experiments demonstrated that the asymmetry of the bulging reflected the asymmetrical shallow growth of the underlying cryptodome (Donnadieu and Merle, 1998; Merle and Donnadieu, 2000). These examples suggest that the precursors identified in the laboratory may also be applied to active volcanoes. Consequently, monitoring surface deformation on active volcanoes with both high temporal and spatial resolution has the potential to constrain, in real-time, simple geometrical parameters, such as and θMC, to forecast the location of both shallow intrusions and imminent eruptions. To make such forecasts possible requires implementing high frequency monitoring methods, such as GNSS and/or tiltmeter, and fast data processing. However, the lack in spatial resolution does not ensure accurate identification of the locations of uplift center and maximum, which conversely can easily be identified using InSAR data.
Notably, our results show that the location of most of the experimental eruptions could have been accurately predicted to occur within an angular sector of about 20° from approximately half of the experiment duration (Figure 6). Transposed to nature, where enough time is required to take suitable societal measures before an eruption occurs, such a forecast could be achieved up to several weeks to days before the eruptions. Indeed, the very first signs of pre-eruptive deformation on volcanoes have been documented to occur approximately up to 3 months prior to the eruptions (Froger et al., 2004; Peltier et al., 2006; Poland et al., 2008; Chadwick et al., 2012; Langmann et al., 2012). As some intrusions may also propagate underground over shorter timescales (dykes may propagate as fast as several tens of cm/s; Toutain et al., 1992), the predictions would be accurate enough within just a few hours before a potential eruption, which may be inadequate for hazard mitigation. Nonetheless, in adequate situations, our results indicate that the accuracy in predicting the location of an imminent eruption increases as time proceeds and that the first predictions could be given earlier when the feeder is a cone sheet. Moreover, our analysis allows for excluding a large part of the deforming area depending on the early direction . Efforts can then be made to focus analysis on the area highlighted by
Our modeling approach and results highlight the dynamic nature of surface deformation associated with shallow magma emplacement. Resolving surface deformation both at high spatial and temporal resolutions is relevant to follow the evolution of simple geometric parameters, such as the point of maximum uplift, which constitute proxies for the location of on-going magma ascent. In addition, as long as changes in the evolution of parameters, such as the focus in azimuth of the points of maximum uplift, develop a significant time prior to an eruption, they have the potential to be used as precursors, indicative of the approximate location of an imminent volcanic eruption. Extracted only from the direct observation of surface data, these precursors are purely geometrical and are not derived from any mechanical criteria or hypothesis. Yet they are relevant for various magma feeder geometries. Our analysis illustrates that time-consuming computational surface data modeling, as commonly used to analyse geodetic data, may not be necessary for the purpose of forecasting eruption locations.
Conclusion
In this study, we analyse the surface deformation monitored during 33 scaled laboratory experiments simulating magma emplacement in a brittle crust under lithostatic stress conditions, i.e., not subjected to regional or local extensional tectonic stresses. Depending on the parameter sets, the experiments simulated the emplacement of dykes or cone sheets (Galland et al., 2014); the associated surface deformation systematically exhibit surface uplift. Our main results are the following:
• We define a vector joining the center of the uplifted area to the point of maximum uplift.
• During the experiments, the final vectors systematically point toward the locations of the forthcoming eruptions, regardless of whether the feeder is a dyke or a cone sheet. This result shows that the vector is a robust geometric precursor for forecasting imminent volcanic eruptions.
• The surface deformation patterns and associated vectors are drastically different for dykes and cone sheets; for cone sheet intrusions the surface vectors elongate gradually and stabilize in direction within angular sectors of about 20° as early as less than half of the intrusion duration; in contrast, when dykes intrude, the surface vectors exhibit a two-stage evolution with sudden elongation and direction stabilization at about half of the intrusion duration. This result shows that the time evolution of the vector is a good proxy for identifying the nature of the sub-surface volcanic feeder.
• The real-time tracking and identification surface vector evolution could be used on active volcanic systems as robust proxies for determining the shape and location of the sub-surface propagating feeders and locating the area of imminent volcanic eruptions.
• Our study shows that forecasting eruption locations using surface deformation data may be achievable without using geodetic modeling, assuming that the surface data are captured at both high spatial and temporal resolution.
Author Contributions
FG produced the data analysis, figures and wrote most of the text. OG contributed with the concept and scaling of the laboratory model, experiments, discussions and interpretations. EH performed experiments and contributed with discussion and analysis. SB performed experiments and provided comments and discussion.
Conflict of Interest Statement
The authors declare that the research was conducted in the absence of any commercial or financial relationships that could be construed as a potential conflict of interest.
Acknowledgments
Guldstrand's doctoral position is funded by the Norwegian Research Council (DIPS project, grant no. 240467). Part of the work was performed in the MeMoVolc Networking Programme from the European Science Foundation (exchange grant no. 4251). F. Bjugger and A. Souche are acknowledged for assistance and discussions with the Volcano Plumbing Systems group at PGP. Burchardt acknowledges financial support Uppsala University and the Swedish Research Council for a research visit to PGP. Hallot acknowledges his welcome to PGP thanks to a half-year sabbatical from Université de Rennes 1. The authors acknowledge the constructive reviews of two reviewers, the associate editor, Nicolas Fournier and chief editor, Valerio Acocella, whose comments improved the manuscript.
References
Abdelmalak, M., Bulois, C., Mourgues, R., Galland, O., Legland, J.-B., and Gruber, C. (2016). Description of new dry granular materials of variable cohesion and friction coefficient: implications for laboratory modeling of the brittle crust. Tectonophysics 684, 39–51. doi: 10.1016/j.tecto.2016.03.003
Abdelmalak, M., Mourgues, R., Galland, O., and Bureau, D. (2012). Fracture mode analysis and related surface deformation during dyke intrusion: results from 2D experimental modelling. Earth Planet. Sci. Lett. 359, 93–105. doi: 10.1016/j.epsl.2012.10.008
Amelung, F., Jónsson, S., Zebker, H., and Segall, P. (2000). Widespread uplift and “trapdoor” faulting on Galapagos volcanoes observed with radar interferometry. Nature 407, 993–996. doi: 10.1038/35039604
Bagnardi, M., Amelung, F., and Poland, M. P. (2013). A new model for the growth of basaltic shields based on deformation of Fernandina volcano, Galápagos Islands. Earth Planet. Sci. Lett. 377, 358–366. doi: 10.1016/j.epsl.2013.07.016
Biggs, J., Amelung, F., Gourmelen, N., Dixon, T. H., and Kim, S.-W. (2009). InSAR observations of 2007 Tanzania rifting episode reveal mixed fault and dyke extension in an immature continental rift. Geophys. J. Int. 179, 549–558. doi: 10.1111/j.1365-246X.2009.04262.x
Bonforte, A., and Guglielmino, F. (2015). Very shallow dyke intrusion and potential slope failure imaged by ground deformation: the 28 December 2014 eruption on Mount Etna. Geophys. Res. Lett. 42, 2727–2733. doi: 10.1002/2015GL063462
Bréque, C., Dupre, J.-C., and Bremand, F. (2004). Calibration of a system of projection moiré for relief measuring: biomechanical applications. Opt. Lasers Eng. 41, 241–260. doi: 10.1016/S0143-8166(02)00198-7
Cannavò, F., Camacho, A. G., González, P. J., Mattia, M., Puglisi, G., and Fernández, J. (2015). Real time tracking of magmatic intrusions by means of ground deformation modeling during volcanic crises. Sci. Rep. 5:10970. doi: 10.1038/srep10970
Cayol, V., and Cornet, F. H. (1998). Three-dimensional modeling of the 1983–1984 eruption at Piton de la Fournaise Volcano, Réunion Island. J. Geophys. Res. 103, 18025–18037. doi: 10.1029/98JB00201
Chadwick, W. W. Jr., Nooner, S. L., Butterfield, D. A., and Lilley, M. D. (2012). Seafloor deformation and forecasts of the April 2011 eruption at Axial Seamount. Nat. Geosci. 5, 474–477. doi: 10.1038/ngeo1464
Donnadieu, F., and Merle, O. (1998). Experiments on the indentation process during cryptodome intrusions: new insights into Mount St. Helens deformation. Geology 26, 79–82. doi: 10.1130/0091-7613(1998)026<0079:EOTIPD>2.3.CO
Froger, J.-L., Fukushima, Y., Briole, P., Staudacher, T., Souriot, T., and Villeneuve, N. (2004). The deformation field of the August 2003 eruption at Piton de la Fournaise, Reunion Island, mapped by ASAR interferometry. Geophys. Res. Lett. 31:L14601. doi: 10.1029/2004GL020479
Fukushima, Y., Cayol, V., and Durand, P. (2005). Finding realistic dike models from interferometric synthetic aperture radar data: the February 2000 eruption at Piton de la Fournaise. J. Geophys. Res. 110:B03206. doi: 10.1029/2004JB003268
Galland, O. (2012). Experimental modelling of ground deformation associated with shallow magma intrusions. Earth Planet. Sci. Lett. 317, 145–156. doi: 10.1016/j.epsl.2011.10.017
Galland, O., Burchardt, S., Hallot, E., Mourgues, R., and Bulois, C. (2014). Dynamics of dikes versus cone sheets in volcanic systems. J. Geophys. Res. 119, 6178–6192. doi: 10.1002/2014JB011059
Galland, O., Cobbold, P. R., Hallot, E., de Bremond d'Ars, J., and Delavaud, G. (2006). Use of vegetable oil and silica powder for scale modelling of magmatic intrusion in a deforming brittle crust. Earth Planet. Sci. Lett. 243, 786–804. doi: 10.1016/j.epsl.2006.01.014
Galland, O., Holohan, E., van Wyk de Vries, B., and Burchardt, S. (2017). “Laboratory modelling of volcano plumbing systems: a review,” in Advances in Volcanology, ed K. Nemeth (Berlin; Heidelberg: Springer), 1–68. doi: 10.1007/11157_2015_9
Galland, O., Planke, S., Neumann, E.-R., and Malthe-Sørenssen, A. (2009). Experimental modelling of shallow magma emplacement: application to saucer-shaped intrusions. Earth Planet. Sci. Lett. 277, 373–383. doi: 10.1016/j.epsl.2008.11.003
Guldstrand, F., Burchardt, S., Hallot, E., and Galland, O. (2017). Dynamics of surface deformation induced by dikes and cone sheets in a cohesive Coulomb Brittle Crust. J. Geophys. Res. 122, 8511–8524. doi: 10.1002/2017JB014346
Hibert, C., Mangeney, A., Polacci, M., Muro, A. D., Vergniolle, S., Ferrazzini, V., et al. (2015). Toward continuous quantification of lava extrusion rate: Results from the multidisciplinary analysis of the 2 January 2010 eruption of Piton de la Fournaise volcano, La Réunion. J. Geophys. Res. 120, 3026–3047. doi: 10.1002/2014JB011769
Hollingsworth, J., Leprince, S., Ayoub, F., and Avouac, J. P. (2013). New constraints on dike injection and fault slip during the 1975–1984 Krafla rift crisis, NE Iceland. J. Geophys. Res. 118, 3707–3727. doi: 10.1002/jgrb.50223
Lanari, R., Lundgren, P., and Sansosti, E. (1998). Dynamic deformation of Etna volcano observed by satellite radar interferometry. Geophys. Res. Lett. 25, 1541–1544. doi: 10.1029/98GL00642
Langmann, B., Folch, A., Hensch, M., and Matthias, V. (2012). Volcanic ash over Europe during the eruption of Eyjafjallajökull on Iceland, April–May 2010. Atmos. Environ. 48, 1–8. doi: 10.1016/j.atmosenv.2011.03.054
Lee, S. W., Yun, S. H., Kim, D. H., Lee, D., Lee, Y. J., and Schutz, B. E. (2015). Real-time volcano monitoring using GNSS single-frequency receivers. J. Geophys. Res. 120, 8551–8569. doi: 10.1002/2014JB011648
Massonnet, D., Briole, P., and Arnaud, A. (1995). Deflation of Mount Etna monitored by spaceborne radar interferometry. Nature 375, 567–570. doi: 10.1038/375567a0
Mathieu, L., de Vries, B. v. W., Holohan, E. P., and Troll, V. R. (2008). Dykes, cups, saucers and sills: analogue experiments on magma intrusion into brittle rocks. Earth Planet. Sci. Lett. 271, 1–13. doi: 10.1016/j.epsl.2008.02.020
Merle, O., and Donnadieu, F. (2000). Indentation of volcanic edifices by the ascending magma. Geol. Soc. Lond. Spec. Publ. 174, 43–53. doi: 10.1144/GSL.SP.1999.174.01.03
Okada, Y. (1985). Surface deformation due to shear and tensile faults in a half-space. Bull. Seismol. Soc. Am. 75, 1135–1154.
Pedersen, R., and Sigmundsson, F. (2006). Temporal development of the 1999 intrusive episode in the Eyjafjallajökull volcano, Iceland, derived from InSAR images. Bull. Volcanol. 68, 377–393. doi: 10.1007/s00445-005-0020-y
Peltier, A., Staudacher, T., Catherine, P., Ricard, L.-P., Kowalski, P., and Bachèlery, P. (2006). Subtle precursors of volcanic eruptions at Piton de la Fournaise detected by extensometers. Geophys. Res. Lett. 33:L06315. doi: 10.1029/2005GL025495
Poland, M., Miklius, A., Orr, T., Sutton, J., Thornber, C., and Wilson, D. (2008). New episodes of volcanism at Kilauea Volcano, Hawaii. Eos, Trans. Am. Geophys. Union 89, 37–38. doi: 10.1029/2008EO050001
Pollard, D. D., and Holzhausen, G. (1979). On the mechanical interaction between a fluid-filled fracture and the earth's surface. Tectonophysics 53, 27–57. doi: 10.1016/0040-1951(79)90353-6
Sigmundsson, F., Hooper, A., Hreinsdóttir, S., Vogfjörd, K. S., Ófeigsson, B. G., Heimisson, E. R., et al. (2015). Segmented lateral dyke growth in a rifting event at Bar [eth] arbunga volcanic system, Iceland. Nature 517, 191–195. doi: 10.1038/nature14111
Sigmundsson, F., Hreinsdóttir, S., Hooper, A., Arnadóttir, T., Pedersen, R., Roberts, M. J., et al. (2010). Intrusion triggering of the 2010 Eyjafjallajokull explosive eruption. Nature 468, 426–430. doi: 10.1038/nature09558
Thun, J., Lokmer, I., Bean, C. J., Eibl, E. P., Bergsson, B. H., and Braiden, A. (2016). Micrometre-scale deformation observations reveal fundamental controls on geological rifting. Sci. Rep. 6:36676. doi: 10.1038/srep36676
Toutain, J. P., Bachelery, P., Blum, P. A., Cheminee, J. L., Delorme, H., Fontaine, L., et al. (1992). Real time monitoring of vertical ground deformations during eruptions at Piton de la Fournaise. Geophys. Res. Lett. 19, 553–556. doi: 10.1029/91GL00438
Walter, T. R., and Motagh, M. (2014). Deflation and inflation of a large magma body beneath Uturuncu volcano, Bolivia? Insights from InSAR data, surface lineaments and stress modelling. Geophys. J. Int. 198, 462–473. doi: 10.1093/gji/ggu080
Keywords: surface deformation, laboratory modeling, cone sheets, dykes, eruption forecasting
Citation: Guldstrand F, Galland O, Hallot E and Burchardt S (2018) Experimental Constraints on Forecasting the Location of Volcanic Eruptions from Pre-eruptive Surface Deformation. Front. Earth Sci. 6:7. doi: 10.3389/feart.2018.00007
Received: 09 October 2017; Accepted: 22 January 2018;
Published: 20 February 2018.
Edited by:
Nicolas Fournier, GNS Science, New ZealandReviewed by:
Alessandro Bonforte, Istituto Nazionale di Geofisica e Vulcanologia, ItalyLuca Caricchi, Université de Genève, Switzerland
Copyright © 2018 Guldstrand, Galland, Hallot and Burchardt. This is an open-access article distributed under the terms of the Creative Commons Attribution License (CC BY). The use, distribution or reproduction in other forums is permitted, provided the original author(s) and the copyright owner are credited and that the original publication in this journal is cited, in accordance with accepted academic practice. No use, distribution or reproduction is permitted which does not comply with these terms.
*Correspondence: Frank Guldstrand, Zi5iLmIuZ3VsZHN0cmFuZEBnZW8udWlvLm5v