 Caitlyn Florentine
 Joel Harper
 Jesse Johnson
 Toby Meierbachtol
- 1Department of Geosciences, University of Montana, Missoula, MT, United States
- 2Department of Computer Sciences, University of Montana, Missoula, MT, United States
Englacial radar reflectors in the ablation zone of the Greenland Ice Sheet are derived from layering deposited in the accumulation zone over past millennia. The original layer structure is distorted by ice flow toward the margin. In a simplified case, shear and normal strain incurred between the ice divide and terminus should align depositional layers such that they closely approximate particle paths through the ablation zone where horizontal motion dominates. It is unclear, however, if this relationship holds in western Greenland where complex bed topography, three dimensional ice flow, and historical changes to ice sheet mass and geometry since layer deposition may promote a misalignment between present-day layer orientation and the modern ice flow field. We investigate this problem using a suite of analyses that leverage ice sheet models and observational datasets. Our findings suggest that across a study sector of western Greenland, the radiostratigraphy of the ablation zone is closely aligned with englacial particle paths, and is not far departed from a state of balance. The englacial radiostratigraphy thus provides insight into the modern, local, internal flow field, and may serve to further constrain ice sheet models that simulate ice dynamics in this region.
Introduction
As ice sheets accumulate mass, surfaces are buried which then define discrete internal layers. Layer geometry is initially controlled by rates of surface accumulation, and further altered by internal deformation as ice flows away from the source. Buried surfaces have contrasting dielectric permittivity, which are revealed by ice penetrating radar due to discrete acid layers from volcanic aerosol deposition (Millar, 1981; Hempel et al., 2000), density contrasts, and differing crystal fabric orientation (Fujita et al., 1999). The hundreds of thousands of kilometers of airborne radar data collected over the Greenland Ice Sheet (GrIS) (Leuschen, 2011), document this internal architecture, the radiostratigraphy, thus providing insights into historical and current ice sheet conditions.
Radiostratigraphy has proven useful for a variety of glaciological investigations. For example, radargrams have been used to calculate historical accumulation rates (Waddington et al., 2007; Karlsson et al., 2014), illuminate strain history (MacGregor et al., 2016), characterize englacial drainage (Catania et al., 2008), quantify geothermal heat flux (Fahnestock et al., 2001) and constrain model estimates of basal motion (Holschuh et al., 2017). Studies utilizing radiostratigraphy for investigations of ice sheet dynamics have focused nearly exclusively on accumulation zones. This is in part because a small fractional area of the Greenland and Antarctic ice sheets experience net ablation, but is also because the continuity of radar reflectors tends to be poor near the margin where ice is thin, the surface is rough (Sime et al., 2014), and in the case of the GrIS, the steep and high relief basal topography (e.g., Lindbäck et al., 2014) often complicates radar reflections. Nevertheless, radiostratigraphy has potential to provide unique constraint on ice dynamics in the ablation zone of the GrIS.
Prior work suggests that original depositional layering becomes aligned with internal particle paths in the ablation zone of Barnes Ice Cap (Hudleston and Hooke, 1980), where the ice residence times are relatively short, i.e., thousands of years. Similarly, internal layers have been shown to be closely aligned with englacial streamlines in a numerical model of a synthetic accumulation zone, as long as horizontal ice flow is fast relative to vertical flow, and the ice is thick relative to the spacing of underlying bedrock peaks and troughs, i.e., the wavelength of bed roughness (Hindmarsh et al., 2006). The GrIS ablation zone indeed has a dominant component of horizontal motion, which is due to flow mainly by sliding (Ryser et al., 2014). Therefore, internal radar reflectors potentially reveal the englacial flow field of the GrIS ablation zone. Where radargrams are oriented tangent to the direction of ice flow, radar layers perhaps even approximate englacial streamlines.
Alternatively, the long residence time of ice in the GrIS implies that the climate, the ice geometry, and the flow field have all undergone substantial adjustments since ice now in the ablation zone was originally deposited near the divide. Layering in the ablation zone may be remnant structure, more related to the integration of transient historical conditions and upstream ice flow than to the present-day, local flow field. For example, we know that the southwest GrIS underwent km-scale retreat and thinning at the margins during the mid-Holocene (van Tatenhove et al., 1996; Simpson et al., 2009). Additionally, the bed topography and thinning ice in the ablation zone may further complicate the relationship between layering and ice flow. Uncertainty regarding the alignment between ablation zone radiostratigraphy and the englacial flow field casts doubt on the utility of these data as an observational constraint on local, present-day ice dynamics.
Here we address the question of differences between englacial stratigraphy and the internal flow field by investigating the relationship between radar-detected layers in the western GrIS ablation zone and modern ice sheet conditions. A true comparison requires particle paths within the ice to be defined with perfect fidelity, but this is an unobservable entity. To manage this dilemma, we take the following approach to our analysis: (1) analyze the deformation field along a flowline to test for a characteristic pattern of strain that reorients depositional layering as it flows to the ablation zone; (2) compare model simulated isochrones and model simulated ice flow particle paths along a GrIS flowline; (3) compare particle paths and isochrones from ice flow simulations to observations of emergent radar layers documented in radiostratigraphy data; and finally, (4) employ an observation-based test for alignment between radar-detected internal geometry and the modern ice flow field using principles of mass conservation.
Methods
Study Area
We focus on the ablation zone of the Kangerlussuaq sector, a land-terminating section of the GrIS (Figure 1). The study region includes the widest ablation zone of the ice sheet, which extends ~100 km inland from the ice margin. The equilibrium line altitude (ELA) is at ~1,530 m. a.s.l. according to recent in situ surface mass balance measurements (van de Wal et al., 2012). Below the ELA, surface mass balance is increasingly negative, with ablation at low elevations removing up to 4 m year−1 (van de Wal et al., 2012). Recent surface elevation lowering rates documented by 1992–2012 laser altimetry measurements are <0.5 m year−1 and are attributed predominantly to increasing melt rather than to changes in ice dynamics (Csatho et al., 2014). Ice velocity is variable in both space and time below the ELA, with spatial and seasonal patterns near the terminus roughly mirroring complex underlying bedrock topography (Palmer et al., 2011; Jezek et al., 2013). The seasonal and spatial mean speed of ice near the margin is ~100 m year−1 (Joughin et al., 2010). Ice is roughly 1,500 m thick near the ELA, but the region is incised by several deep bedrock troughs (Lindbäck et al., 2014). Thus the characteristic ice thickness near the margin is ~1,000 m over bedrock troughs, and ~700 m over bedrock ridges.
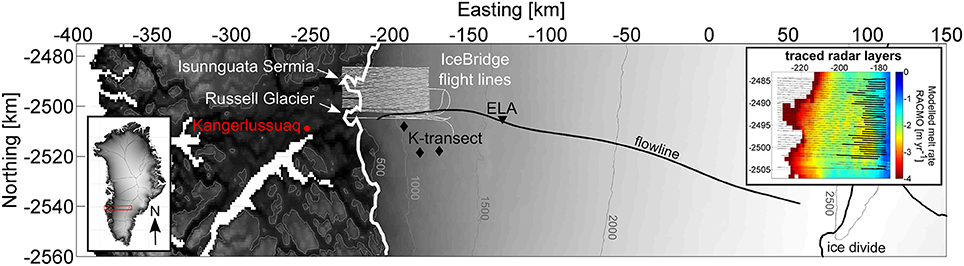
Figure 1. Study area in western Greenland. Shown with ice surface elevation contours in meters above sea level (gray lines and shading; data by Bamber et al., 2013) and the ice divide (thick white line; data by Zwally et al., 2012). Inset shows the location of the study area (red) within context of the entire Greenland Ice Sheet. This and all subsequent figures use geographic coordinates in polar stereographic projection (true latitude 70°, central meridian −45°). The outlet glaciers Isunnguata Sermia and Russell Glacier are indicated (white arrows). Location of IceBridge flightlines (thin white lines), K-transect surface mass balance sites (black diamonds), the modeled ice flowline (black line), and the Equilibrium Line Altitude (ELA; black triangle), are also shown. The extents of traced radar layers used to calculate radar-derived mass conserving (rMC) ablation rates are shown on the zoomed inset of IceBridge flightlines (bold black lines), plotted over surface mass balance output from the regional climate model RACMO (gridded, colored cells; data by Noël et al., 2016).
Radiostratigraphy
A dense array of 40+ IceBridge flight lines was flown along this sector of the GrIS in 2011, providing radiostratigraphy data (Leuschen, 2011) for more than 2,000 km within the study area (Figure 1). The flight lines are oriented approximately along-flow. To represent radar data in geographic space we converted two-way travel time data to depth assuming that the wave speed in air and ice are 300 and 168 m μs−1 respectively. No firn correction was necessary as the data analyzed were within the ablation zone. In addition to the data processing already applied by Leuschen (2011), we further processed radar data by applying a logarithmic transformation, removing background noise, and applying a Hilbert transform to the raw power return data. This additional processing aided radiostratigraphy visualization.
Our observation-based test (described in section Mass-conserving Ablation: An Observation-based Test) required englacial geometry provided by internal layers, so we digitally traced radar layers. Automated tracing methods do not perform well in our near-margin study area (Legarsky and Gao, 2006). Nonetheless, we were able to successfully trace internal layers using a semi-automated method which combined visual inspection, user-defined picks, and data-driven interpolation. The interpolation algorithm matched user-defined picks to the nearest sample of the nearest radar trace. Vertical error (discerned by repeat picking along the same layer) was 16 m, which is comparable to the reported radar data depth accuracy of 13.6 m (Leuschen, 2011). Average horizontal error on traced layers was much larger (250 m), because the aspect ratio necessary for visualizing and tracing emergent layers favored vertical over horizontal resolution. We used the IceBridge ice surface and bed picks provided by Leuschen (2011).
Alignment Analyses
No single measure can reveal the relationship between radiostratigraphy and ice flow, because an observationally validated description of the internal flow field does not exist. We therefore investigate the geometry of the radiostratigraphy with regard to four separate aspects of the internal flow field, each described individually below.
Ice Deformation
To quantify ice deformation between the present-day ice divide and ablation zone, we analyzed the cumulative strain along a flowline (Figure 1). We define cumulative strain as time-integrated strain along a particle path. By computing cumulative strain, we assess the stretching and rotation of primary layering due to deformational processes. The deformation field was derived from a three dimensional, thermomechanically-coupled, higher-order ice sheet model, representing a steady state instance of the model that is consistent with modern ice sheet geometry and velocity (Meierbachtol et al., 2015). The model assimilated surface velocity observations (Joughin et al., 2010), and used a numerical mesh shaped by high-resolution (1 km2) bedrock and ice surface data (Bamber et al., 2013). We calculated the cumulative strain rotating and elongating ice as it moves englacially from point of deposition in the interior, to emergence near the margin.
To visualize the accumulated strain, we considered a deforming unit ellipsoid that travels along a representative particle path. The unit ellipsoid started with equal length, width, and height at deposition. Subsequently, its dimensions and orientation were deformed by the magnitude and direction of cumulative principal strain. To assess the overall magnitude of total strain along particle path P1, we compute the natural octahedral unit shear (see Supplementary Material for computation details).
Simulating Isochrones and Particle Paths
To assess how the modeled internal ice flow field relates to englacial layers in the ablation zone, we simulated isochrones and particle paths using the same ice flow model (Meierbachtol et al., 2015) of the study region. The simulation reveals the geometric relationship between internal layers and streamlines in a flow field that is consistent with present-day ice sheet geometry and velocity. To simulate englacial particle paths, we followed a collection of particles through the modeled flow field, from deposition in the accumulation zone to emergence in the ablation zone. We employed a simple Lagrangian approach to particle tracking. This avoids the conditional instabilities associated with pure advection equations (Pattyn, 2002). In a Lagrangian coordinate system, particle position is given by a set of simple ordinary differential equations, i.e., , where east-west longitudinal ice velocity is u, north-south transverse ice velocity is v, and vertical ice velocity is w. Each component of the velocity field (u,v,w) was defined by a thermomechanically-coupled model solution of ice flow, which accounted for higher order stresses and represented a steady state instance of ice dynamics (Meierbachtol et al., 2015). After applying a Gaussian filter to ensure smooth integration, we integrated velocity () to solve for particle position given by northing, easting, and elevation. Although the velocity field fed to the ode integrator was defined on a finite element mesh, particles were tracked in a pure Cartesian space. Particle paths were defined by particle positions at one year time steps through the ice flow field.
In order to simulate isochrones, we tracked particle age (A) by solving the simple ordinary differential equation , using the odeint solver from the scipy library (adapted from Hindmarsh, 1983). Particles were initiated with an age of zero years at the ice surface, so the surface boundary condition was A(z = s) = 0. The age solution was therefore very simple: with each 1 year time step the ice particle was 1 year older (Pattyn, 2003). Finally, to quantify the spatial alignment of simulated isochrones and particle paths, we calculated the three-dimensional angle between short (~5 km long) isochrone and particle path segments.
Comparing Radiostratigraphy to Simulated Isochrones
To test for alignment between the observed and modeled internal ice flow field, we compare the pattern and geometry of radar-detected layers against simulated isochrones. The comparison shows whether or not observed internal layers (which have been subjected to real world transience) agree with modeled layers (which are the product of a simulation with no transience). This comparison did not involve exact target matching of specific layers; such an exercise is precluded by simplification to the modeled domain. Furthermore, small errors in the modeled velocity field propagate during isochrone simulation, which does not compromise layer orientation and slope (e.g., Holschuh et al., 2017), but which can result in large errors on the absolute location of internal layers (Hindmarsh et al., 2009). We circumvent these issues by qualitatively comparing modeled isochrones to radiostratigraphy. The purpose of this comparison is to test of whether or not the structural pattern of layers produced by the modeled ice flow field reflects the englacial layers documented by radiostratigraphy.
Mass-Conserving Ablation: An Observation-Based Test
Lastly, we run a strictly observation-based test of the hypothesis that radar layers are parallel to englacial particle paths, independent of ice sheet model assumptions and parameters. This final analysis considers the relationship between observations of ice flow, surface melt, and internal layer geometry in the ablation zone. It assesses whether or not observed layers are consistent with the local flow field and present-day surface mass balance. The test involves the calculation of mass-conserving ablation rates. To explain the test, we first must inspect the ablation zone system.
Figure 2 depicts an along-flow cross section through an ice sheet ablation zone. In this dynamic system, ice is advected toward the margin. Meanwhile, ablation removes mass at the ice surface, increasing in magnitude as the surface elevation decreases. Englacial particles therefore travel pathways that eventually intersect the ice surface. Vertical strain due to flux divergence will also remove (or add) ice between the particle and the ice surface along this emergent, englacial particle path. Because mass is conserved, ablation and ice flow may be related as:
where the overbars denote horizontal averages, and is the average rate at which mass is lost along the emergent particle path. Within this term, Δt is a time step, defined by the length of the englacial particle path (dx) and the average ice speed along the layer (), and η is a fraction of the ice column. This rate of mass loss is attributable to the average rate of ablation along the layer () and the average flux divergence, i.e., the average rate of component thickness change due to vertical strain (). Basal melt is negligible compared to surface melt (Harper et al., 2016), and would only act to shift the entire near surface domain downward, so it is neglected. The formulation assumes a state of balance between modern velocity, geometry, and ablation, which is justified by laser altimetry measurements (Csatho et al., 2014) that show small surface elevation lowering rates (<0.5 m year−1) in our study area. Equation 1 is merely a rearranged expression of the conservation of mass equation commonly used in glaciology (see Supplementary Material), which involves only a fraction of the ice column as opposed to the full ice thickness.
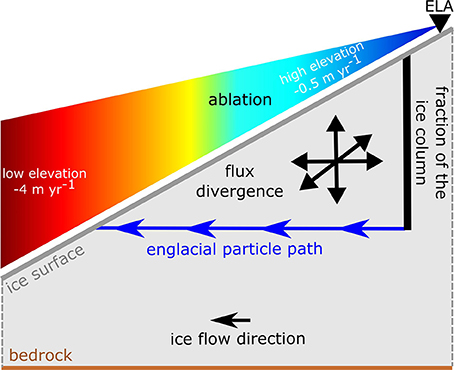
Figure 2. Schematic shows an along-flow cross section of the ablation zone, illustrating mass conservation below the ELA.
IceBridge radiostratigraphy data document emergent internal layers that mimic the conceptualized englacial particle path depicted in Figure 2. If these radar layers do indeed approximate englacial particle paths, then the layers should provide geometry that balances with the ice flow field and local surface mass balance. To test this, we used satellite-derived velocity data and vertical strain rates derived therein (see Supplementary Material) to define ice flow components (, ), and traced emergent radar layers to define geometric components (dx, η) of Equation (1). We then solved for the ablation rate required to conserve mass. Finally, we compared this radar-derived, mass-conserving (rMC) ablation rate to independent metrics of ablation provided by the regional climate model RACMO (see Supplementary Material) and K-transect measurements (van de Wal et al., 2012). We traced 113 along-flow emergent radar layer segments, used them to define geometry and ice flow terms, calculated rMC ablation rates, and finally compared rMC to RACMO and K-transect ablation.
In this system, mass is conserved on some characteristic time scale that is neither too short nor too long. For example, on the seasonal to interannual time step (too short), the ice geometry varies with winter snow accumulation and summer ablation, and velocity fields vary between days, seasons, and years (Bartholomew et al., 2011; Sundal et al., 2011; Sole et al., 2013). On a millennial time step (too long) the ice geometry varies due to climate-driven changes in ice volume (e.g., Alley et al., 2010). The critical averaging time step (Δt) is therefore many decades up to a century or two. This defines the time step of interest for our testing. We accordingly limit calculation of mass-conserving ablation rates to radar layers that define a time step of at least a century.
Solving for ablation enables us to leverage the obvious and simple relationship between elevation and ablation. Ablation rates derived from Equation (1) should be high magnitude at low elevation, and low magnitude at high elevation. Therefore, to vet radar-derived results, we analyzed the linear relationship between rMC ablation and elevation. If the magnitude and elevation trend of rMC ablation agrees well with independent metrics of melt (K-transect, MAR), then this would be evidence that radar layers act as proxies of englacial particle paths (i.e., Figure 2). To explore the effect of using englacial particle paths that are instead departed from radiostratigraphy, we also solved for rMC ablation rates using hypothetical particle paths that dipped up to 3° from the radar layer.
Results
Ice Deformation
Strain ellipsoids (Figure 3) illustrate englacial deformation along particle path P1 at 400 year snapshots. The pattern of principle strain for current ice sheet conditions is characterized predominantly by longitudinal (east-west) stretching and rotation onto horizontal. Englacial layers that start off as vertically stacked and equidimensional at the ice divide rotate and collapse 84° onto horizontal in the east-west direction, stretch in the east-west direction by 150%, compress in the north-south direction by 84%, and compress vertically by 67%. To uphold conservation of mass given the incompressibility of ice, the residual of principal strain components (i.e., R = ε1 + ε2 + ε3) should be zero. The calculated principal strain along P1 had a mean residual of = −8.39 × 10⁻⁶. See Supplementary Material for visualizations of the deformed strain ellipsoid in the transverse vertical plane and map view, which further emphasize how ice deformation yields structures aligned with ice flow near the margin (Supplementary Figure 1). By 2,800 year the total strain was 2.84. The subhorizontal layers of the ablation zone therefore correspond to initially subhorizontal layering in the accumulation zone, but elements reaching the ablation zone have been rotated counter-clockwise (along flow) by nearly 90° and stretched out one and a half times.
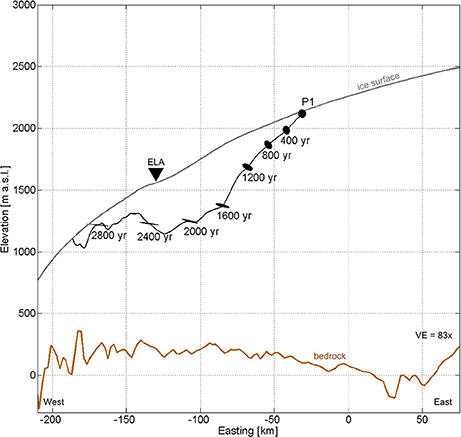
Figure 3. Ice deformation results. The deforming strain ellipsoids are shown along particle path P1 (black line) at 400 year snapshots. The ice surface (gray line), bed (brown line), and the ELA (black triangle) are also shown.
Simulated Isochrones and Particle Paths
Although we solved for 100 particle paths overall, here we focus our results on five representative particles spaced 30–120 km from the ice divide (Table 1, Figure 4). These particles travel pathways from different points of burial in the accumulation zone to emergence in the ablation zone. Particle P5 originates highest in the accumulation zone (30 km from the ice divide), and P1 starts lowest in the accumulation zone (120 km from the ice divide). P5 travels a path that extends deeper than that traveled by P1, and emerges at the ice surface at a lower elevation (<500 m a.s.l.). P1 travels a shallower path, and emerges at a higher elevation (1,103 m a.s.l.).
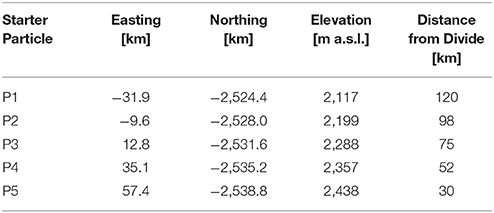
Table 1. Initial coordinates, elevation, and distance from the ice divide of simulated particles.
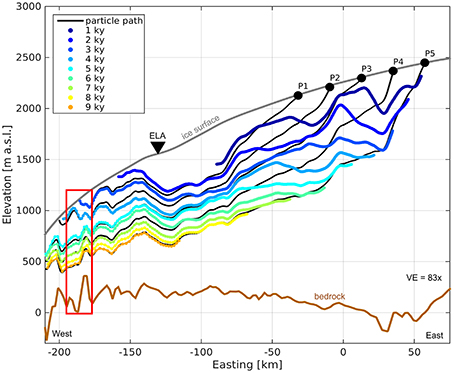
Figure 4. Simulation results. Simulated isochrones (colored lines: blue to orange, youngest to oldest) and particle paths (black lines) are shown from burial in the accumulation zone to emergence in the ablation zone. Note that due to the aspect ratio, vertical motion is exaggerated 83x. Ice surface (gray line), bed (brown line), and the ELA (black triangle) are also shown. The extent of Figure 7 is indicated (red box). There is a third dimension (Northing) to these results which is not shown here.
In the accumulation zone, the ratio between vertical and horizontal flow is non-uniform with progressively more vertical dominated flow toward the divide. Yet, as all particles approach the ELA (from Easting ~75–125 km), travel paths are dominated by horizontal flow. At the ELA, particles begin to experience complex flow, as the bed roughens and the ice thins. The ratio between vertical and horizontal flow varies from 1 to 10% in the ablation zone; in some sections the dominance of horizontal motion is disrupted as particles are advected hundreds of meters (i.e., 200–350 m) up and over bedrock peaks and ridges and then hundreds of meters down into bedrock troughs.
The age of ice at emergence across the ablation zone ranges from as young as 2 kyr to as old as 9 kyr. Ice that is 2 kyr old emerges at the surface about 30 km below the ELA. By 70 km below the ELA, about mid-way across the ablation zone, the ice is 4 kyr old at emergence. Here, ice that is at roughly three quarters ice depth, or ~500 m below the surface, is 9 kyr old.
High above the ELA, simulated isochrones and particle paths intersect. Yet, toward the ice sheet margin, the two align as the ice rotates, stretches laterally, and assumes mainly horizontal displacement. Quantitative assessment of this alignment is shown by the angles between linear segments of each (Figure 5). The initial angle between each particle path and the first isochrone (1 kyr) is variable. P5 is closely aligned (0.8°) with isochrone 1 kyr right away, while P2 is oriented more obliquely (5°). The final angle is also variable. P1 is only within 1.5° of alignment with the final isochrone it intersects (isochrone 3 kyr), while P2-P5 are within 1° of parallel (of isochrones 4–9 kyr). Yet overall, the angle between simulated isochrones and particle paths decreases from the point of deposition to the point of emergence along P1, P2, P3, P4, and P5. Alignment only increases with distance from the divide, and time since deposition. By the 4 kyr time step, particle paths are misaligned by less than 1° from isochrones. The spatial relationship between internal layers and streamlines varies from sub-perpendicular near the ice divide to sub-parallel near the ice margin. In a flow field consistent with present-day ice sheet geometry and velocity, layers near the margin are aligned with the englacial flow field.
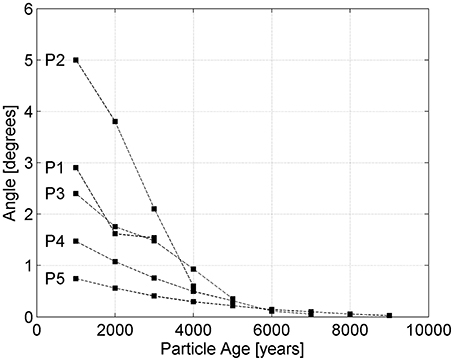
Figure 5. The angle between simulated isochrones and particle paths P1-P5. Results are shown as particles age from deposition near the ice divide (age 0), to emergence near the ice sheet margin.
Isochrones and Radiostratigraphy
IceBridge radar data reveal clear internal layers that intersect the ice surface at elevations ranging from 900 to 1,300 m a.s.l (e.g., Figure 6). Layering is easily observed in the upper half of the ice column. In the lower third of the ice column, and within ~20 km of the ice margin (i.e., Easting −228 km), virtually no layering is observed. This could be due to any combination of the following: (a) layering has been distorted by complex ice flow beyond recognition; (b) much or all of the ice near the margin is temperate (Harrington et al., 2015); (c) signal scattering and off-nadir reflections are caused by complex bed topography; and/or (d) radar waves are attenuated by water in streams and the rotten cryoconite layer at the surface, so that low power returns associated with basal layer reflectors are lost.
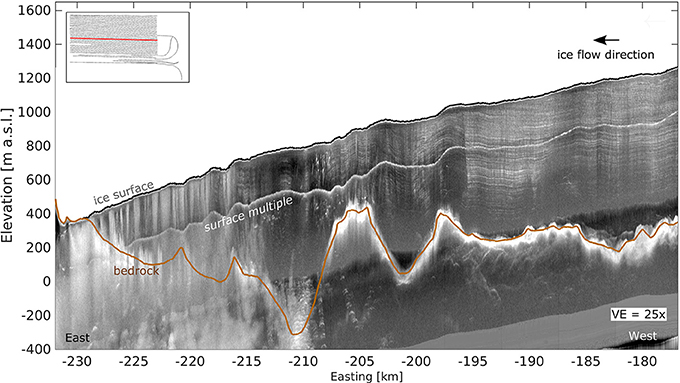
Figure 6. IceBridge radargram showing internal layers along an ablation zone cross section. Ice flow is West to East. Ice surface (thin black line) and bed (brown line) picked from the radar data are shown. The thick bold white reflector at ~1/3 ice depth is a surface multiple, an artifact of airborne radar depth sounding (data by Leuschen, 2011). Inset shows map view of IceBridge flight lines, with the extent of this radargram highlighted (red).
Modeled isochrones show good agreement with radar layers in terms of orientation and relative position (Figure 7). Both show emergent layers between elevations of 900 and 1,300 m a.s.l., and between Eastings of −177 km and −195 km. Both show layers that drape topography. This qualitative agreement indicates that real-world internal layers are consistent with the modeled internal flow field. Layers depicted in IceBridge radiostratigraphy that have been shaped by past transience are comparable to layers that have been shaped by a simulation of present-day ice flow.
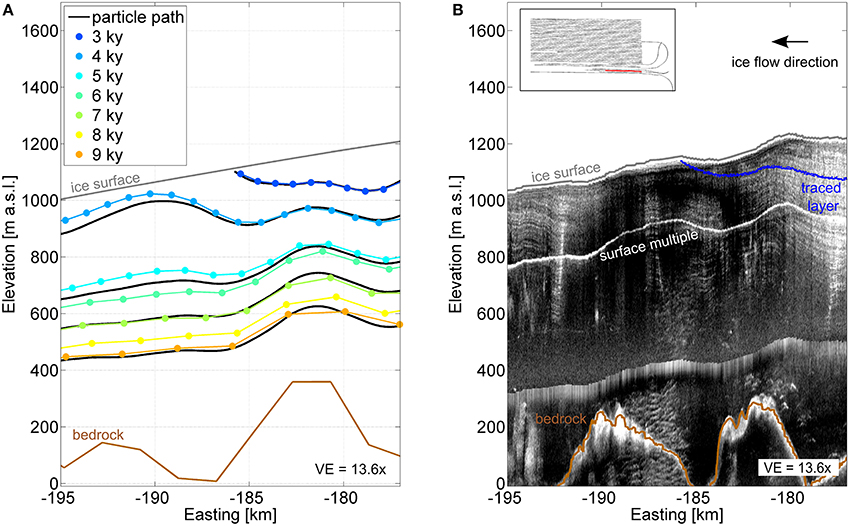
Figure 7. Comparison between simulation and observation. (A) Simulated isochrones (colored lines: blue to orange, youngest to oldest) and englacial particle paths (black lines), and (B) observed internal layers in IceBridge radiostratigraphy (Leuschen, 2011), with one traced radar layer shown (blue line). The ice surface (gray line), bed (brown line), and surface multiple are as in Figure 6. Inset shows map view of IceBridge flight lines, with the extent of this radargram segment highlighted (red).
Mass-Conserving Ablation
IceBridge flight lines are oriented within 1° of the mean ice flow direction up glacier of Easting −210 km. Down-glacier of this cutoff an obliquely-oriented bedrock trough and the Russell Glacier outlet divert ice flow. However, the easternmost sections of IceBridge radargams (e.g., Figure 6) document two dimensional cross sections of ice flow. Radar flight lines essentially follow flowlines above 800 m a.s.l. and thereby can be used for the mass conservation analysis outlined by Figure 2 and in section Mass-conserving Ablation: An Observation-based Test. Particle path lengths delineated by the 113 traced radar layers are tens of kilometers (i.e., 8.20–34.3 km). The average ice velocity along these layers ranges from 59.3 to 120 m yr−1, so that the characteristic time steps are century-scale (100 years to 327 years). The average vertical strain rates are on the order of 10−3 yr−1 (i.e., −2.2 × 10⁻³ to +2.4 × 10⁻³ yr−1), and the fractions of the ice column are hundreds of meters, so that flux divergence along the particle path adds and subtracts tens of centimeters. Median values are shown in Table 2.
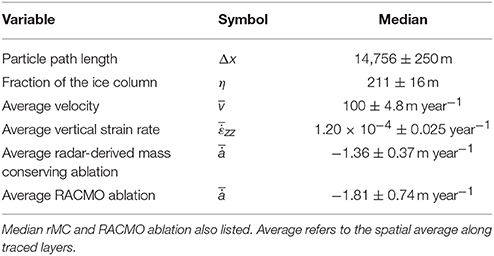
Table 2. Median of observational data used to calculate radar-derived, mass conserving (rMC) ablation rates.
Mass-conserving ablation rates, derived from radar layers and observational data on ice flow, increased with decreasing elevation (Figure 8). The rMC ablation showed a statistically significant trend with elevation (p < 0.01, r2 = 0.952), consistent with RACMO (p < 0.01, r2 = 0.958). The median of rMC ablation was −1.36 ± 0.37 m yr−1 (n = 113), also consistent with RACMO (median = −1.81 ± 0.74 m yr−1, n = 113). The magnitude of rMC ablation rates were furthermore consistent with in situ measurements of ablation from the K-transect at similar elevations (mean = −1.16 ± 0.55 m yr−1, n = 3).
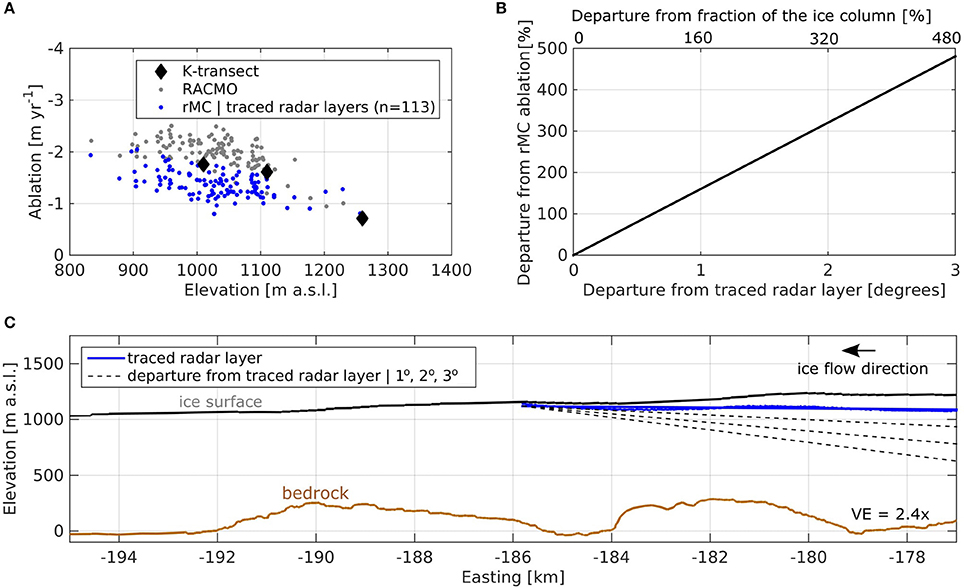
Figure 8. Mass-conserving ablation. (A) Radar-derived, mass-conserving (rMC) ablation rates (blue dots), K-transect in situ observations (black diamonds), and regional climate model RACMO output (gray dots) plotted against elevation. (B) Plot shows the effect of using englacial particle paths that are departed from radar layers. The fraction of the ice column (top x-axis) increases as departure from the traced radar layer (bottom x-axis) increases. Increased fractions of the ice column result in increased ablation rates (y-axis). Departures are expressed relative to the traced radar layer shown in (C). (C) Along-flow cross section showing IceBridge ice surface (black line), bed (brown line), and traced radar layer (blue line), presented the same as in Figure 6 but without the complete radiostratigraphy and with less vertical exaggeration. Hypothetical particle paths dipping 1°, 2°, and 3° from the traced radar layer (dashed black lines) are also shown.
In contrast, our analysis shows that if particle path slopes were just a few degrees off from radar layers, then the corresponding rMC ablation rates would overestimate comparable RACMO melt. Figure 8C demonstrates how a particle path dipping 1°, 2°, and 3° from the traced radar layer would result in substantial increases in the fraction of the ice column used to calculated rMC ablation. As Equation (1) and Figure 8B show, rMC ablation and the fraction of the ice column are linearly related. Particle paths merely a few degrees departed from the radar layer yield mass conserving ablation rates that are more than 100% off from ablation reported by RACMO and the K-transect. Layers imaged by ablation zone radiostratigraphy balanced optimally with present-day data on ice flow and surface mass balance when treated as direct proxies of englacial particle paths.
Discussion
The salient result of our analyses is that the flow field along our western GrIS transect transforms primary layer structures deposited in the accumulation zone into a layer structure in the ablation zone that is aligned with the horizontal direction of ice flow. The depositional layer spacing is not necessarily preserved, however, due to flux divergence during margin-ward flow. Particle flow paths are normal to layering at the divide, oblique to layering along the flanks of the accumulation zone, and parallel to layering below the equilibrium line. A cross section of the radiostratigraphy in the ablation zone that is oriented parallel to the direction of ice flow therefore reveals layer orientation that is representative of local englacial streamlines. This contrasts with other ice sheet circumstances, where folded (Siegert et al., 2004) and disturbed (Rippin et al., 2006) layers are inconsistent with present-day conditions, and have been shown to be remnant structures of past flow that have little relation to the local, modern flow field.
Each of our analyses relies upon modern instances of ice sheet mass balance, geometry, and velocity. We have not explicitly accounted for past or ongoing transience. However, on the time scale of recent years to decades this region has thinned on the order of tens of centimeters per year (Csatho et al., 2014; Helm et al., 2014), likely due to increased surface melt (Fettweis et al., 2011). On the millennial time scale, geologic (van Tatenhove et al., 1996) and modeling (Simpson et al., 2009) studies imply that the ice margin retreated on the order of tens of kilometers ~4 kyr ago, which was assumed to be accompanied by changes to the geometry of the remaining ice sheet. In fact, the scale of mid-Holocene retreat in this area is seemingly greater than other marginal areas (Simpson et al., 2009). This apparent discrepancy between past transience in ice sheet geometry, and our analyses that imply the radiostratigraphy is consistent with a modern snapshot of the ablation zone, must somehow be reconciled.
Why do these modern ablation and velocity datasets balance against the emergent layer structure? The answer likely is in the characteristic length scale used in our mass conservation analysis. It is associated with a displacement time constant of centuries. Decadal period imbalances therefore could have been lost to centennial-scale diffusion, which would imply that the recently measured 0.5 m yr−1 rate of surface elevation lowering (Csatho et al., 2014) has not been constant over recent decades. Alternatively, sustained ablation changes on the century time scale could have been compensated by velocity changes, e.g., more melt accompanied by more ice delivered from up-stream would dampen the rate of ice sheet thinning and geometric change. It seems that transience on the millennial time scale, including the readvance and thickening of ice in this region (Huybrechts, 1994), has achieved a geometry that is representative of a balanced condition.
Our findings suggest that model solutions that assimilate modern data and assume balance between those fields (e.g., Brinkerhoff et al., 2011; Meierbachtol et al., 2015) could perhaps also utilize radiostratigraphy as an observational constraint on ice dynamics. In particular, layer structure perhaps serves as a unique indicator of local basal boundary conditions. For example, layers that steepen down flow that are not draping underlying bed bumps may indicate that the ice is flowing over a slippery then sticky spot on the bed (Holschuh et al., 2017). Provided that the challenges posed by poor radar data continuity near the ice sheet margin are overcome, radar layers parallel to ice flow may aid modeling efforts, by, as cited in this example, constraining estimates of frictional anomalies at the bed (Holschuh et al., 2017). However, the isochrones associated with a steady state model solution of this region are not necessarily representative of the true age of the ice, since the ice sheet has not likely maintained its current geometry for as long as residence times associated with the current geometry. Furthermore, it is important to note that our analysis focused on a study area where modern transience is small, i.e., <0.5 m yr−1 surface elevation lowering, relative to other areas, such as GrIS marine-terminating outlet glaciers, where ice thinning up to many meters per year has been recorded (Csatho et al., 2014). The treatment of radar layers as consistent with present-day, local conditions is not necessarily supported for those areas.
Our analysis reduces the uncertainty surrounding ablation zone radiostratigraphy and its relationship to the englacial flow field within the analyzed reach, but has not eliminated the need for scrutiny interpreting radar geometry elsewhere in the GrIS ablation zone. Within the analyzed, western GrIS study area, we reject the hypothesis that internal layers reflect past transience and distal conditions strongly enough to disrupt alignment with the modern, local ice flow field. Our results point to local bed topography as being a primary driver of layer slope in the ablation zone, and imply that climate change impacts on the ice sheet have much less effect on these englacial structures. The flow field representativeness of the radiostratigraphy in the ablation zone will be maintained under a changing climate as long as the ice traveling below the ELA has undergone sufficient elongation with ~90° of rotation; conditions that are apparently difficult to disrupt. However, we did not formally probe the sensitivity of this result. Doing so would require an experiment wherein surface mass balance and ice flow fields were perturbed and resultant transience in internal structure and geometry tracked. Questions regarding exactly what magnitude and character of transience are required to interrupt this alignment remain open, to be addressed by future work.
Conclusions
Ice in the GrIS ablation zone was initially deposited millennia ago, and since has traveled englacially through a complex and three dimensional flow field. We knew that in an idealized setting, and for the smaller and simpler Barnes Ice Cap (Hudleston and Hooke, 1980), emergent englacial layers, viewed parallel to the direction of ice flow, were closely aligned with local englacial streamlines. However, given the transience associated with GrIS long residence times, and the uncertain deformation associated with GrIS complex flow, it was unclear whether the internal layers imaged along the flanks of the GrIS were indicative of local and modern ice flow conditions, or of conditions up-ice or from millennia ago.
We used a multifaceted approach to address this problem, employing four distinct analyses of ice dynamics and englacial layer structure along western GrIS flowline. Each of our analyses, simulation and observation alike, supports the conclusion that radiostratigraphy in this southwest sector of the GrIS reveal englacial streamlines. Furthermore, our analyses suggest that radar layers may be interpreted as reflecting the present-day, local flow field rather than transient conditions inherited from past ice flow. This is a somewhat counterintuitive conclusion, given the imbalanced state of mass loss of the GrIS overall (Hanna et al., 2013), the likely history of retreat and readvance of this area of the GrIS in particular (van Tatenhove et al., 1996; Simpson et al., 2009), and the ongoing surface elevation thinning in this region due to increasing surface melt (Csatho et al., 2014; Helm et al., 2014). Yet, promisingly, the radiostratigraphy we analyzed seems to have the potential to serve as a unique and powerful observational constraint on ice sheet models that simulate modern ice dynamics.
Author Contributions
CF: Conceptualized and executed all calculations and analyses; JH, JJ, and TM: Guided project development through discussion. All authors contributed to writing the manuscript.
Funding
This work is funded by the NSF grant number PP-ANS 0909495 and NASA grant number NNX11AM12A. CF was supported by a grant from the Montana Space Grant Consortium.
Conflict of Interest Statement
The authors declare that the research was conducted in the absence of any commercial or financial relationships that could be construed as a potential conflict of interest.
The reviewer, TH, and handling editor declared their shared affiliation.
Supplementary Material
The Supplementary Material for this article can be found online at: https://www.frontiersin.org/articles/10.3389/feart.2018.00044/full#supplementary-material
References
Alley, R. B., Andrews, J. T., Brigham-Grette, J., Clarke, G. K. C., Cuffey, K. M., Fitzpatrick, J. J., et al. (2010). History of the Greenland Ice Sheet: paleoclimatic insights. Quat. Sci. Rev. 29, 1728–1756. doi: 10.1016/j.quascirev.2010.02.007
Bamber, J. L., Griggs, J. A., Hurkmans, R. T. W. L., Dowdeswell, J. A., Gogineni, S. P., Howat, I., et al. (2013). A new bed elevation dataset for Greenland. Cryosphere 7, 499–510. doi: 10.5194/tc-7-499-2013
Bartholomew, I. D., Nienow, P., Sole, A., Mair, D., Cowton, T., King, M. A., et al. (2011). Seasonal variations in Greenland Ice sheet motion: inland extent and behaviour at higher elevations. Earth Planet. Sci. Lett. 307, 271–278. doi: 10.1016/j.epsl.2011.04.014
Brinkerhoff, D. J., Meierbachtol, T. W., Johnson, J. V., and Harper, J. T. (2011). Sensitivity of the frozen/melted basal boundary to perturbations of basal traction and geothermal heat flux: Isunnguata Sermia, Western Greenland. Ann. Glaciol. 52, 43–50. doi: 10.3189/172756411799096330
Catania, G. A., Neumann, T. A., and Price, S. F. (2008). Characterizing englacial drainage in the ablation zone of the Greenland ice sheet. J. Glaciol. 54, 567–578. doi: 10.3189/002214308786570854
Csatho, B. M., Schenk, A. F., van der Veen, C. J., Babonis, G., Duncan, K., Rezvanbehbahani, S., et al. (2014). Laser altimetry reveals complex pattern of Greenland Ice Sheet dynamics. Proc. Natl. Acad. Sci. U.S.A. 111, 18478–18483. doi: 10.1073/pnas.1411680112
Fahnestock, M., Abdalati, W., Joughin, I., Brozena, J., Gogineni, P., and Adbalati, W. (2001). High geothermal heat flow, basal melt, and the origin of rapid ice flow in central Greenland. Science 294, 2338–2342. doi: 10.1126/science.1065370
Fettweis, X., Tedesco, M., van den Broeke, M., and Ettema, J. (2011). Melting trends over the Greenland ice sheet (1958–2009) from spaceborne microwave data and regional climate models. Cryosphhere 5, 359–375. doi: 10.5194/tc-5-359-2011
Fujita, S., Maeno, H., Uratsuka, S., Furukawa, T., Mae, S., Fujii, Y., et al. (1999). Nature of radio echo layering in the Antarctic Ice Sheet detected by a two-frequency experiment. J. Geophys. Res. Solid Earth 104, 13013–13024. doi: 10.1029/1999JB900034
Hanna, E., Navarro, F. J., Pattyn, F., Domingues, C. M., Fettweis, X., Ivins, E. R., et al. (2013). Ice-sheet mass balance and climate change. Nature 498, 51–59. doi: 10.1038/nature12238
Harper, J. T., Hubbard, A., Ruskeeniemi, T., Claesson Liljedahl, L., Kontula, A., Hobbs, M., et al. (2016). The Greenland Analogue Project?: Data and Processes. Swedish Nuclear Waste Management Company Report R-14-13, 1–387.
Harrington, J. A., Humphrey, N. F., and Harper, J. T. (2015). Temperature distribution and thermal anomalies along a flowline of the Greenland ice sheet. Ann. Glaciol. 56, 98–104. doi: 10.3189/2015AoG70A945
Helm, V., Humbert, A., and Miller, H. (2014). Elevation and elevation change of Greenland and Antarctica derived from CryoSat-2. Cryosphere 8, 1539–1559. doi: 10.5194/tc-8-1539-2014
Hempel, L., Thyssen, F., Gundestrup, N., Clausen, H. B., and Miller, H. (2000). A comparison of radio-echo sounding data and electrical conductivity of the GRIP ice core. J. Glaciol. 46, 369–374. doi: 10.3189/172756500781833070
Hindmarsh, A. (1983). “ODEPACK, a Systematized Collection of ODE Solvers,” in Scientific Computing, ed R. Stepleman (Amsterdam: Elsevier), 55–64.
Hindmarsh, R. C. A., Leysinger Vieli, G. J. M. C., and Parrenin, F. (2009). A large-scale numerical model for computing isochrone geometry. Ann. Glaciol. 50, 130–140. doi: 10.3189/172756409789097450
Hindmarsh, R. C. A., Leysinger Vieli, G. J. M. C., Raymond, M. J., and Gudmundsson, G. H. (2006). Draping or overriding: the effect of horizontal stress gradients on internal layer architecture in ice sheets. J. Geophys. Res. Earth Surf. 111:F02018. doi: 10.1029/2005JF000309
Holschuh, N., Parizek, B. R., Alley, R. B., and Anandakrishnan, S. (2017). Decoding ice sheet behavior using englacial layer slopes. Geophys. Res. Lett. 44, 5561–5570. doi: 10.1002/2017GL073417
Hudleston, P. J., and Hooke, R. L. (1980). Cumulative deformation in the Barnes ice cap and implications for the development of foliation. Tectonophysics 66, 127–146. doi: 10.1016/0040-1951(80)90042-6
Huybrechts, P. (1994). The present evolution of the greenland ice sheet: an assessment by modelling. Glob. Planet. Change 9, 39–51. doi: 10.1016/0921-8181(94)90006-X
Jezek, K., Wu, X., Paden, J., and Leuschen, C. (2013). Radar mapping of Isunnguata Sermia, Greenland. J. Glaciol. 59, 1135–1146. doi: 10.3189/2013JoG12J248
Joughin, I., Smith, B. E., Howat, I. M., Scambos, T., and Moon, T. (2010). Greenland flow variability from ice-sheet-wide velocity mapping. J. Glaciol. 56, 415–430. doi: 10.3189/002214310792447734
Karlsson, N. B., Bingham, R. G., Rippin, D. M., Hindmarsh, R. C. A., Corr, H. F. J., and Vaughan, D. G. (2014). Constraining past accumulation in the central Pine Island Glacier basin, West Antarctica, using radio-echo sounding. J. Glaciol. 60, 553–562. doi: 10.3189/2014JoG13J180
Legarsky, J. J., and Gao, X. (2006). Internal layer tracing and age-depth relationship from the ice divide toward Jakobshavn, Greenland. IEEE Geosci. Remote Sens. Lett. 3, 471–475. doi: 10.1109/LGRS.2006.877749
Leuschen, C. (2011). IceBridge MCoRDS L1B Geolocated Radar Echo Strength Profiles, Version 2. Boulder, CO: NASA Snow and Ice Data Center Distributed Active Archive Center.
Lindbäck, K., Pettersson, R., Doyle, S. H., Helanow, C., Jansson, P., Savstrup Kristensen, S., et al. (2014). High-resolution ice thickness and bed topography of a land-terminating section of the Greenland Ice Sheet. Earth Syst. Sci. Data Discuss. 7, 129–148. doi: 10.5194/essdd-7-129-2014
MacGregor, J. A., Colgan, W. T., Fahnestock, M. A., Morlighem, M., Catania, G. A., Paden, J. D., et al. (2016). Holocene deceleration of the Greenland ice sheet. Science 351, 590–593. doi: 10.1126/science.aab1702
Meierbachtol, T. W., Harper, J. T., Johnson, J. V., Humphrey, N. F., and Brinkerhoff, D. J. (2015). Thermal boundary conditions on western Greenland: observational constraints and impacts on the modeled thermomechanical state. J. Geophys. Res. Earth Surf. 120, 623–636. doi: 10.1002/2014JF003375
Millar, D. H. M. (1981). Radio-echo layering in polar ice sheets and past volcanic activity. Nature 292, 441–443. doi: 10.1038/292441a0
Noël, B., Jan Van De Berg, W., MacHguth, H., Lhermitte, S., Howat, I., Fettweis, X., et al. (2016). A daily, 1 km resolution data set of downscaled Greenland ice sheet surface mass balance (1958–2015). Cryosphere 10, 2361–2377. doi: 10.5194/tc-10-2361-2016
Palmer, S., Shepherd, A., Nienow, P., and Joughin, I. (2011). Seasonal speedup of the Greenland Ice Sheet linked to routing of surface water. Earth Planet. Sci. Lett. 302, 423–428. doi: 10.1016/j.epsl.2010.12.037
Pattyn, F. (2002). Ice-flow characteristics over a rough bedrock: implications for ice-core interpretation. Polar Meteorol. Glaciol. 16, 42–52.
Pattyn, F. (2003). A new three-dimensional higher-order thermomechanical ice sheet model: basic sensitivity, ice stream development, and ice flow across subglacial lakes. J. Geophys. Res. 108:2382. doi: 10.1029/2002JB002329
Rippin, D. M., Siegert, M. J., Bamber, J. L., Vaughan, D. G., and Corr, H. F. J. (2006). Switch-off of a major enhanced ice flow unit in East Antarctica. Geophys. Res. Lett. 33:L15501. doi: 10.1029/2006GL026648
Ryser, C., Lhi, M. P., Andrews, L. C., Hoffman, M. J., Catania, G. A., Hawley, R. L., et al. (2014). Sustained high basal motion of the Greenland ice sheet revealed by borehole deformation. J. Glaciol. 60, 647–660. doi: 10.3189/2014JoG13J196
Siegert, M. J., Welch, B., Morse, D., Vieli, A., Blankenship, D. D., Joughin, I., et al. (2004). Ice flow direction change in interior West Antarctica. Science 305, 1948–1951. doi: 10.1126/science.1101072
Sime, L. C., Karlsson, N. B., Paden, J. D., and Prasad Gogineni, S. (2014). Isochronous information in a Greenland ice sheet radio echo sounding data set. Geophys. Res. Lett. 41, 1593–1599. doi: 10.1002/2013GL057928
Simpson, M. J. R., Milne, G. A., Huybrechts, P., and Long, A. J. (2009). Calibrating a glaciological model of the Greenland ice sheet from the Last Glacial Maximum to present-day using field observations of relative sea level and ice extent. Quat. Sci. Rev. 28, 1631–1657. doi: 10.1016/j.quascirev.2009.03.004
Sole, A., Nienow, P., Bartholomew, I., Mair, D., Cowton, T., Tedstone, A., et al. (2013). Winter motion mediates dynamic response of the Greenland Ice Sheet to warmer summers. Geophys. Res. Lett. 40, 3940–3944. doi: 10.1002/grl.50764
Sundal, A. V., Shepherd, A., Nienow, P., Hanna, E., Palmer, S., and Huybrechts, P. (2011). Melt-induced speed-up of Greenland ice sheet offset by efficient subglacial drainage. Nature 469, 521–524. doi: 10.1038/nature09740
van de Wal, R. S. W., Boot, W., Smeets, C. J. P. P., Snellen, H., van den Broeke, M. R., and Oerlemans, J. (2012). Twenty-one years of mass balance observations along the K-transect, West Greenland. Earth Syst. Sci. Data 4, 31–35. doi: 10.5194/essd-4-31-2012
van Tatenhove, F. G., van Der Meer, J. J., and Koster, E. A. (1996). Implications for deglaciation chronology from new AMS age determinations in Central West Greenland. Quat. Res. 45, 245–253. doi: 10.1006/qres.1996.0025
Waddington, E. D., Neumann, T. A., Koutnik, M. R., Marshall, H. P., and Morse, D. L. (2007). Inference of accumulation-rate patterns from deep layers in glaciers and ice sheets. J. Glaciol. 53, 694–712. doi: 10.3189/002214307784409351
Zwally, H. J., Giovinetto, M. B., Beckley, M. A., and Saba, J. L. (2012). Antarctic and Greenland Drainage Systems, GSFC Cryospheric Sciences Laboratory. Available online at: http://icesat4.gsfc.nasa.gov/cryo_data/ant_grn_drainage_systems.php
Keywords: ice sheet dynamics, radiostratigraphy, ice deformation, ablation zone, Greenland ice sheet
Citation: Florentine C, Harper J, Johnson J and Meierbachtol T (2018) Radiostratigraphy Reflects the Present-Day, Internal Ice Flow Field in the Ablation Zone of Western Greenland. Front. Earth Sci. 6:44. doi: 10.3389/feart.2018.00044
Received: 08 November 2017; Accepted: 11 April 2018;
Published: 26 April 2018.
Edited by:
Alun Hubbard, Aberystwyth University, United KingdomReviewed by:
Andrew John Sole, University of Sheffield, United KingdomTom Holt, Aberystwyth University, United Kingdom
Joseph Andrew MacGregor, Goddard Space Flight Center (NASA), United States
Copyright © 2018 Florentine, Harper, Johnson and Meierbachtol. This is an open-access article distributed under the terms of the Creative Commons Attribution License (CC BY). The use, distribution or reproduction in other forums is permitted, provided the original author(s) and the copyright owner are credited and that the original publication in this journal is cited, in accordance with accepted academic practice. No use, distribution or reproduction is permitted which does not comply with these terms.
*Correspondence: Caitlyn Florentine, Y2FpdGx5bi5mbG9yZW50aW5lQHVtb250YW5hLmVkdQ==