 John A. Power
 Cheryl E. Cameron
- 1Alaska Volcano Observatory, U.S. Geological Survey, Anchorage, AK, United States
- 2Alaska Volcano Observatory, Alaska Division of Geological and Geophysical Surveys, Fairbanks, AK, United States
A major goal of volcano monitoring is the rapid identification of volcanic explosions and subsequent warning of associated hazards. Between 1988 and 2016 the Alaska Volcano Observatory (AVO) responded to at least 54 separate volcanic eruptions. During this period, AVO's monitoring program relied principally on seismic and satellite remote sensing data, supplemented with geodetic, gas, and visual observations to track volcanic unrest. In this study we focus on AVO's response time, or the time required for AVO to (1) identify seismic signals associated with large ash-producing volcanic explosions and (2) initiate public warnings. We restrict this analysis to volcanoes monitored by a local seismic network and explosive in character. We focus on the 1989–90 eruption of Redoubt Volcano (VEI 3), the 1992 eruption of Mount Spurr (VEI 4), the 1999 eruption of Shishaldin Volcano (VEI 3), the 2006 eruption of Augustine Volcano (VEI 3) and the 2016 eruption of Pavlof Volcano (VEI 2) as detailed records of the timing of formal warnings are preserved. These eruption sequences allow us to evaluate AVO's response time under a number of monitoring scenarios, including both expected (those with recognized precursory unrest) and surprise eruptions (those without identified precursory unrest) as well as individual and repetitive sequences of explosive events. Recorded response time ranges from ~1 to 86 min. The shorter response times (~1–13 min) were achieved during sequences of explosive events at Redoubt (1989–90), Spurr (1992) and Augustine (2006). The longer response times (31– 86 min) are recorded for unexpected or surprise explosions such as Spurr (August 18, 1992) and Pavlof (2016) and the only or first explosions in an eruptive sequence such as Shishaldin (1999) and Augustine (2006).
Introduction
The Alaska Volcano Observatory (AVO) is responsible for monitoring active volcanoes in Alaska and providing warnings of hazards associated with volcanic activity. The observatory was founded in 1988 and is a cooperative program of the U.S. Geological Survey, the University of Alaska Fairbanks Geophysical Institute, and the Alaska Division of Geological and Geophysical Surveys. Since 1988, AVO has responded to 54 eruptions in Alaska at 18 volcanic centers as well as numerous episodes of volcanic unrest that did not result in eruption. The principal hazard from explosive eruptions of Alaska volcanoes is airborne volcanic ash to aircraft, and ashfall on local communities (Casadevall, 1994b).
During this time, AVO principally relied on seismic observations for real-time monitoring and eruption forecasting. From 1988 to 1995, AVO seismic instrumentation was focused on just Mount Spurr, Redoubt Volcano, Iliamna Volcano, and Augustine Volcano. These four volcanoes are in the Cook Inlet region, and are closest to the major population centers in south-central Alaska. In 1995, AVO began to expand seismic monitoring to volcanic centers further to the west, and currently networks of 4–15 seismometers are in operation on 32 of the 54 historically active volcanoes in Alaska. Seismic monitoring is supplemented with geodetic measurements (Cervelli et al., 2010), measurements of gas emission such as SO2 and CO2 (Werner et al., 2013) and Satellite Radar Interferometry (InSAR) (Lu and Dzurisin, 2014). Additional data streams from infrasound, web cams, lightning, remote sensing, and visual observations serve principally for eruption detection and confirmation. Geologic studies are used to define eruptive history and character and identify hazardous areas.
AVO's response to volcanic unrest includes increasing surveillance of real-time monitoring of seismic activity, and near-real-time remote sensing data, up to and including round-the-clock staffing at offices in Anchorage and/or Fairbanks. AVO also increases other monitoring data streams if possible. When large ash-producing explosions are detected, AVO conducts a “call down” and communicates warnings immediately by telephone, using an ordered list. Entities on the list include relevant government agencies such as the Federal Aviation Administration (FAA), the Division of Homeland Security (DHS), the National Weather Service (NWS), the Alaska Governor's Office, and others. When sufficient staffing is available, warnings are transmitted simultaneously through a call down from both the Anchorage and Fairbanks offices of AVO. Either office could complete the entire call down if the other office was not staffed (Neal et al., 2010). During the later years of this study call downs could be made from remote locations as the monitoring data was more widely available through computer networks. The amount of time required to identify and warn of a volcanic explosion is critical as delays in warning increase the chance of an encounter between and aircraft and a volcanic ash cloud and decreases the amount of time that communities have to prepare for ash fall. Once other government agencies such as the FAA, NWS, and DHS receive information from AVO they produce and disseminate additional warning products specific to the current volcanic activity and hazard (Neal et al., 2010).
During the 1989–90 eruption of Redoubt Volcano, AVO developed a four-step Volcano Alert Level, called the “Color Code,” that used four colors to reflect both the level of volcanic unrest and associated hazards and as well as expected activity (Brantley, 1990). In 2006 the U.S. Geological Survey expanded the Alert-Notification system used for volcanic hazards to a dual system to more effectively communicate hazards on the ground (lahars, pyroclastic flows, lava flows, ash fall, and others) and to aircraft (airborne volcanic ash). Ground based hazards are communicated through four alert levels: normal, advisory, watch, and warning, and the aviation Color Code remained four colors, green, yellow, orange, and red, but with slightly different definitions. The new alert-notification system (Gardner and Guffanti, 2006) communicates current hazards and unrest as well as forecasts anticipated activity. This standardized system is now in use at the five volcano observatories in the United States. Immediate warnings are still communicated by a telephone call down to affected government agencies and these are followed by several forms of written communication that include Volcanic Activity Notice (VAN), Volcano Observatory Notice for Aviation (VONA), Status Report, and Information Statement (Neal et al., 2010). These notifications are transmitted by email, web posting, Facebook, FAX, and shorter statements may be released through Twitter (Schaefer et al., 2012).
In this study we evaluate the time required for AVO to identify a large ash producing explosion and initiate a call down to appropriate authorities. We restrict this analysis to those volcanoes that were monitored by a local seismic network, were explosive in character and produced large high-altitude ash plumes. We use the call down initiation time as earliest warning that AVO issues. It often takes a longer period of time to formulate and distribute a VAN, VONA or Information Statement. For this analysis we focus on explosions that occurred at Redoubt (1989–90), Spurr (1992), Shishaldin (1999), Augustine (2006), and Pavlof (2016), as each of these eruptions were characterized by explosive activity that produced large ash plumes, and because we retained accurate records of call down timing. All times in this manuscript are reported in Coordinated Universal Time (UTC). We generally do not consider small explosive events that may have preceded larger eruptions unless those events played a role in changing AVO's level of monitoring. Fortunately, this suite of volcanoes covers a range in type and intensity of precursory unrest and eruptive style and allows us to evaluate AVO's response time in a variety of monitoring situations such as the expected onset of eruptive activity (Spurr, 1992, Shishaldin, 1999, Augustine, 2006), sequences of successive explosive events (Redoubt 1989–90, Spurr, 1992, Augustine, 2006) and unexpected or surprise eruptions (Pavlof, 2016). A review of AVO's efforts to forecast eruptions and provide advance warning of hazards during the 1988–2016 time period is given by Cameron et al. (2018).
Redoubt Volcano, 1989–90
Redoubt Volcano is a stratovolcano located in south-central Alaska on the western side of Cook Inlet (Figure 1) that erupts andesitic magma (Coombs et al., 2013). The volcano has erupted four times in recorded history in 1902, 1966, 1989–90, and 2009. The 1989–90 and 2009 eruptions are characterized by explosive events that are often separated by periods of lava extrusion in the summit crater that form domes (Miller, 1994; Schaefer et al., 2012). Explosive events produce high altitude ash plumes that endanger overflying aircraft, regional aircraft transiting to other communities, and traffic landing at Anchorage International Airport (Casadevall, 1994a). A network of 5–12 seismic stations has monitored Redoubt since 1988. Figure 2 is a map of the seismic stations operating at the end of the 1989–90 eruption.
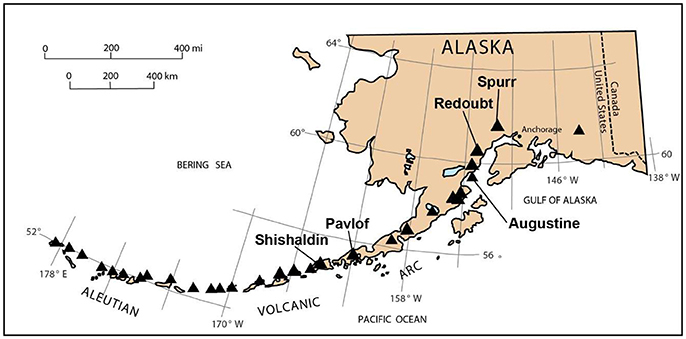
Figure 1. Map showing locations of historically active volcanoes in Alaska as triangles. Labels indicate locations of volcanoes discussed in this report.
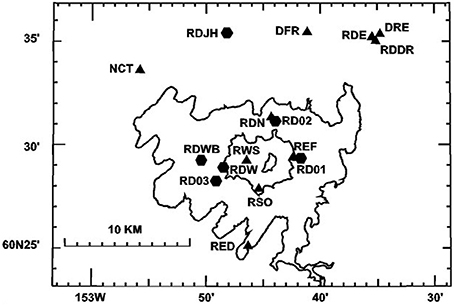
Figure 2. Map showing locations of seismic stations that operated surrounding Redoubt Volcano, Alaska between 1989 and 2010 from Power et al. (2013). Triangles correspond to short-period vertical seismometers while hexagons reflect 3-componet broadband instruments. Contours reflect 3,000, 6,000, and 9,000 foot elevations.
A subtle increase in seismic events beneath the volcano and observations of increased steaming preceded the eruption by several weeks and an intense 23-h swarm of long-period seismic events occurred immediately prior to the onset of eruptive activity on December 14, 1989 (Power et al., 1994). In response to the increase in seismicity, AVO began 24-h on site monitoring on December 13, 1989 and continued until June of 1990. The eruption began with a small explosive event at 18:47 on December 14, followed by a sequence of 24 additional explosive events. These explosive events were often separated by periods of lava extrusion, which formed short-lived domes in the volcano's summit crater. Dome growth ceased in June 1990. The explosions are considered to be Volcano Explosivity Index (VEI) 3 and were often associated with dome collapse and destruction (Miller, 1994). Many of the explosions during the 1989–90 eruption were preceded by short swarms of Long-Period seismic events that lasted from 1 to 170 h (Stephens et al., 1994) and were used to forecast the individual explosive events (Chouet et al., 1994). Seismic data were transmitted to AVO offices in Fairbanks and Anchorage in real-time, and during the 1989–90 eruption the principal method of real-time analysis was drum recorders. Figure 3 shows the drum record from the February 21, 1990 explosion at Redoubt from station RED. The 1989–90 eruption of Redoubt allows us to evaluate the time required for AVO to identify and respond to individual explosive eruptions while 24-h staffing and analysis was in place and the volcano was generating explosive events that were similar in character and relatively repetitive.
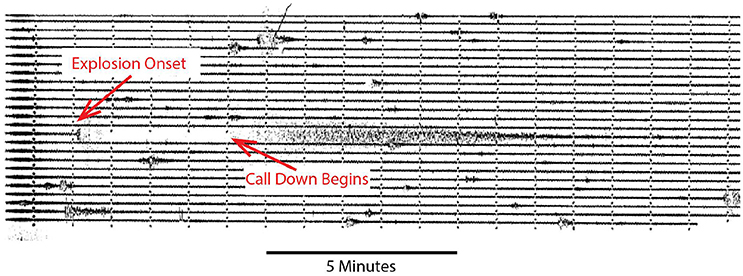
Figure 3. A portion of a drum record for station RED (Figure 2) from February 21, 1990 showing explosion at Redoubt Volcano at 09:32 UTC. Labels note relative onset time of explosion and recorded time AVO call down began. Time marks represent 1 min intervals. In this case, response time was 4 min after the explosions onset.
For this eruption the response time was the difference between the explosion onset time and the recorded time of the call to the FAA, made from AVO offices in Fairbanks (Table 1). The onset time of the explosion was taken as the time when the seismic signal exceeded twice the normal background on seismic station SPU (located near Mount Spurr) and was rounded to the nearest minute (Power et al., 1994). The call down time in Fairbanks was manually recorded in a logbook. Unfortunately, records of call down times do not exist for the first 11 explosions that occurred before January 11, 1990, and the explosive event on January 17, 1990 (Table 1). The range of recorded response times was 1–9 min and the average was 3.5 min with a standard deviation of 2.0. For this calculation we have not considered smaller explosive events that either did not create a seismic signal detectible on station SPU or produce a large ash plume.
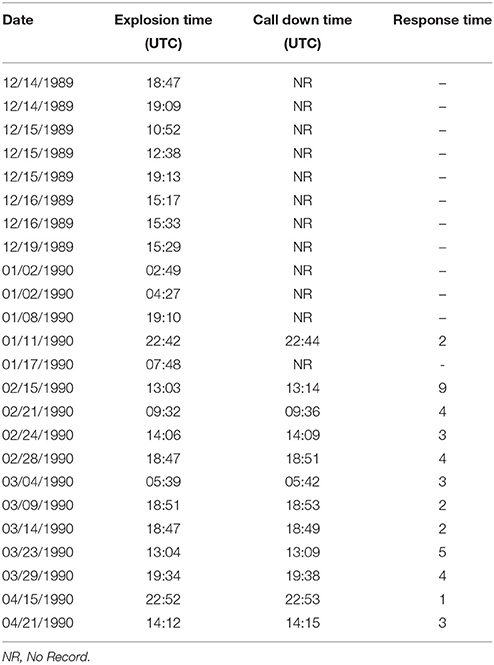
Table 1. Explosions onset, call down, and response time for explosive events that occurred at Redoubt Volcano in 1989 and 1990.
Mount Spurr, 1992
Mount Spurr is a large composite volcano on the western side of Cook Inlet about 80 km west of the city of Anchorage Alaska (Figure 1). Spurr has erupted twice in historic time from the Crater Peak vent, a single explosive event on July 9, 1953 (Juhle and Coulter, 1955) and a series of three sub-plinian explosions (VEI 4) in the summer of 1992. Eruptive products from the 1992 eruptions of Mount Spurr's Crater Peak vent are andesites (Nye et al., 1995). A network of 11 short-period seismic stations monitored the 1992 eruption (Power et al., 1995) and data were telemetered to Anchorage and Fairbanks in real-time. During the 1992 eruptions, the principal means of real-time review of seismic data was drum recorders. For response analysis during the 1992 Spurr eruption sequence we used the onset times of explosive events and the time call downs reported by Eichelberger et al. (1995).
The 1992 explosions occurred on June 27, August 18–19 and September 17, 1992 and each lasted 3–4 h and produced large plumes of volcanic ash that reached altitudes of 14,000–15,000 m above sea level (Eichelberger et al., 1995). The June 27 explosion was preceded by a long-term sequence of earthquakes that began in August of 1991 and increased in rate in November of 1991 and April 1992 (Power et al., 1995). In the weeks prior to the June 27 explosion, increased steaming from Crater Peak and changes in lake color attributed to SO2 scrubbing, and geysering were observed in the lake area (Doukas and Gerlach, 1995). Strong tremor began at 20:04 on June 26 and a shallow swarm of earthquakes preceded the onset of explosive activity by just 4 h (McNutt et al., 1995; Power et al., 1995). In response to this activity AVO raised the Color Code to yellow on the evening of June 26 and began 24-h monitoring from both Fairbanks and Anchorage. The June 27 eruption began at 15:04 and the first warning that an eruption was in progress was issued 12 min later at 15:16, following receipt of a confirming report from an aircraft pilot. The June 27 explosion was followed by relative seismic quiescence at shallow depths, although the deeper portions of the magmatic system in the lower crust remained seismically active (Power et al., 2002). The Color Code was lowered to Green and 24-h monitoring was suspended on July 8.
The August 19, 1992 main explosion was preceded by a small “premonitory explosion” at 23:41 on August 18 that was observed by passing aircraft. It produced a small plume of steam and ash to 300–600 m above the Crater Peak vent. In response to this small explosion, AVO began a call down and raised the Color Code to Yellow at 00:25, 44 min after the premonitory explosion, and began close review of drum records in both Anchorage and Fairbanks. This small explosive event was unexpected, but occurred during the normal workday so the repose time was relatively short. The major explosion on August 19 began at 00:42 and AVO issued a warning 5 min after the onset at 00:47 raising the Color Code first to Orange and then to Red (at 00:58) as the eruption grew in strength (Eichelberger et al., 1995). Figure 4 shows drum records from 00:05 UTC August 18 to 02:25 UTC on August 19, 1992 for station CRP that show the onset of both the premonitory and main explosions as well as the time of the call down following these explosions. A map showing the location of station CRP can be seen in Figure 1 of Power et al. (1995).
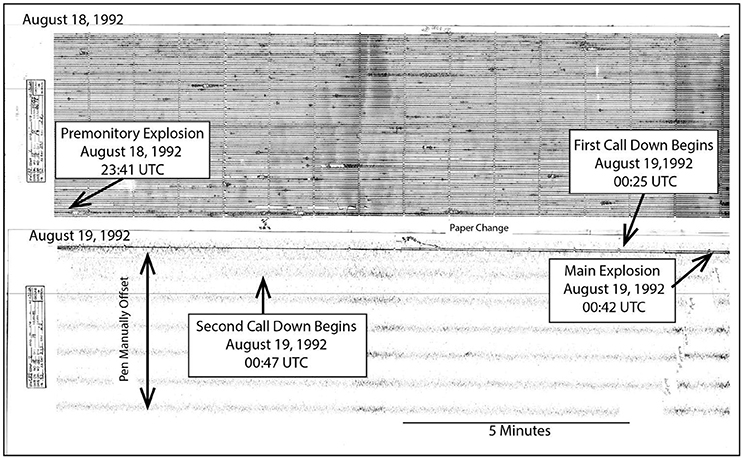
Figure 4. Drum records from station CRP between 00:05 UTC August 18 and 02:25 UTC on August 19, 1992 that show both the premonitory explosion at 23:41 on August 18 and the main explosion at 00:42 on August 19. Time marks represent 1 min intervals. These records show 26 h and 20 min of seismic data and the paper on the drum was changed between 00:16 and 00:21 UTC on August 19. Times of call downs at 00:25 and 00:47 UTC are also noted and followed the explosions onset by 44 and 5 min, respectively. Following the onset of the main explosion at 00:42 the drum recorder pen was manually offset to prevent the high amplitude explosion signal from over writing the record on the drum.
The September 17 explosion was preceded by 3 h of increasing tremor and a small premonitory explosion at 06:36. AVO issued a warning for the premonitory explosion at 06:45, raising the Color Code to Red. A strong seismic signal beginning at 08:03 is attributed to the start of the main eruption on September 17. Eichelberger et al. (1995) did not record the time of a call down following the onset of this major explosion, however a warning was issued when the Color Code was raised to Red 9 min after the smaller premonitory explosion at 6:36.
The three major explosive events during the 1992 eruption sequence at Mount Spurr all exhibited strong precursory activity that was easily captured by the seismic network, complementary visual observations of the volcano, and gas measurements. The 1992 Spurr eruption sequence allows us to analyze AVO's response capability when the AVO offices were staffed 24-h per day and close monitoring was taking place as well as a surprise explosion while the office was fully staffed. The response times of the 1992 eruptions of Mount Spurr were 12 and 5 min for the major explosive events on June 27 and August 19, and 44 and 9 min for the premonitory explosions on August 18 and September 17 respectively (Eichelberger et al., 1995). These warnings result in an average response time of 17.5 min with a standard deviation of 17.8.
Shishaldin Volcano, 1999
Shishaldin Volcano, located in the central portion of Unimak Island (Figure 1), is highly active, with 31 recorded eruptions since 1775 (McGimsey et al., 2004). The volcano typically erupts products that are basaltic andesite in composition, and its eruptions are often characterized by activity ranging from extrusive with occasional strombolian fountaining to large explosive events that reach VEI 3 or 4 and produce large, high-altitude ash plumes (Nye et al., 2002). The VEI 4 1999 Shishaldin eruption sequence was monitored by a network of six seismometers surrounding the volcano that had been in operation since the summer of 1997 (Jolly et al., 2001). The primary medium for real-time recording and analysis during this eruption was drum recorders.
The 1999 eruption sequence was preceded by months of unrest that included Deep Long-Period events (Power et al., 2004), small repetitive seismic events that were first noted on February 2 (Moran et al., 2002), and increased steaming and thermal output from the volcanoes summit that began on February 12 (Nye et al., 2002). Volcanic tremor was first observed on February 18, prompting AVO to raise the Color Code to Yellow. A shallow magnitude 5.2 earthquake located 10–15 km west of Shishaldin occurred on March 4, followed by numerous aftershocks (Moran et al., 2002). On April 7 the strength of tremor increased further and AVO raised the level of Concern Color Code to Orange and began 24-h monitoring that would continue until June 18. Strombolian explosions were observed by AVO staff members from an aircraft using a Forward Looking Infrared Radiometer (FLIR) on April 17 (McGimsey et al., 2004). Rasmussen et al. (2018) provide a multidisciplinary analysis of unrest and volcanic processes that proceeded the 1999 Shishaldin eruption.
The 1999 Shishaldin eruption sequence had only one large explosive event that took place at 20:33 on April 19, 1999, and was associated with a large increase in seismic tremor. This explosion continued for 7 h, and eventually the ash cloud reached an estimated altitude of 17,000 m (Nye et al., 2002). The April 19 eruption of Shishaldin allows us to evaluate AVO's response time for a large explosive eruption at a volcano that was the subject of heightened monitoring 24-h per day. Records indicate that the call down from the AVO Fairbanks Office to the Alaska Governor's office occurred at 21:04 UTC. The Alaska Governor's office is the second notification in the Fairbanks call down and consequently we surmise that the first warning was issued to the FAA in just under 31 min after the onset of explosive activity.
Augustine Volcano, 2006
Augustine Volcano is a stratovolcano located on a small island in lower Cook Inlet (Figure 1). The volcano erupts frequently with recorded eruptions in 1812, 1882, 1902, 1935, 1963–64, 1971, 1976, 1986, and 2006. The Augustine volcanic cone has experienced frequent sector collapse events in the recent past and the 1882 eruption generated a small tsunami in Cook Inlet (Waitt and Beget, 2009). Augustine magmas are typically andesitic in composition (Larsen et al., 2010) and eruptions are characterized by an explosive onset followed by sequences of explosive events that are often separated by the extrusion of lava from the volcano's summit, forming lava domes and lava flows. Seismic monitoring of Augustine began in 1970 and the 1976, 1986, and 2006 eruptions have remarkably similar precursory seismic sequences that allowed AVO to very accurately forecast the onset and style of the 2006 eruption (Power et al., 2006). The VEI 3 2006 eruption consisted of 13 larger magmatic explosions that occurred between January 11 and January 28, separated by the extrusion of magma within the summit crater. Magma extrusion continued until mid-March 2006 (Coombs et al., 2010).
During the 2006 eruption of Augustine, the volcano had a network of 8 permanent seismometers (Figure 5) and seismic data were transmitted in real-time to both the Anchorage and Fairbanks offices where staff monitored the incoming seismic data 24 h per day. Seismic waveforms were displayed using a variety of computerized techniques that included the capability to view the seismic signals in both the time and frequency domain (Cervelli et al., 2004; Thompson and Reyes, 2017). The onset times of explosions were determined at seismic station OPT, located 16 km north of Augustine's summit, and were rounded to the nearest minute (Power and Lalla, 2010).
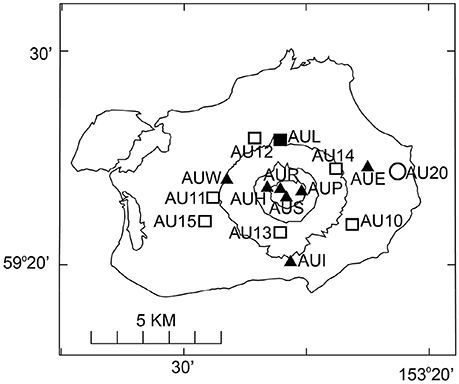
Figure 5. Map showing the location of seismic stations on Augustine Volcano in 2006 from Power and Lalla (2010). Solid triangles represent short-period stations, the solid square is a permanent broadband station at AUL, open squares represent temporary broadband stations, and the circle is a strong motion instrument at AU20.
The 2006 eruption of Augustine provides a good opportunity to evaluate AVO's response time to both the initial onset of explosive activity for an eruption that had well-recognized precursory seismicity and 24-h staffing in place, as well as a sequence of similar explosive events. For this eruption, the recorded response time reflects the time at which the call down was initiated in Fairbanks to the Alaska State Division of Homeland Security, which is the first number in the Fairbanks call down (Table 2). Both the Anchorage and Fairbanks offices of AVO were staffed 24-h per day, so this time is comparable to the time the Anchorage office called the FAA (records for the Anchorage call downs have not been recovered).
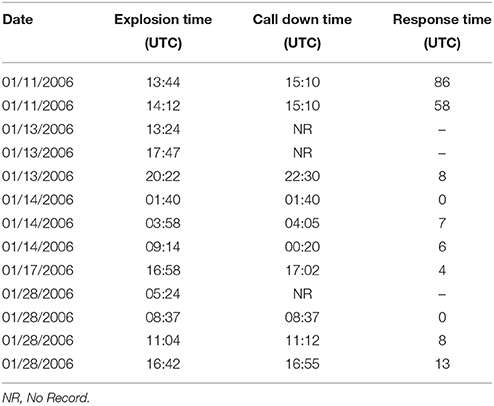
Table 2. Times of explosions onset, call down time, and response time for explosive events that occurred at Augustine Volcano in 2006.
Response times during the 2006 Augustine eruption ranged from ~1 to 86 min. The average response time was 20.7 min with a standard deviation of 30.2. Unfortunately, records of the call times for the first two explosions on January 13, the explosion on January 17, and the first explosion on January 28, have been lost (Table 2). For the remaining explosions the comparatively longer average response time is because the first two explosions in the sequence were small (durations of 3.5 and 7 min whereas later explosions had durations in excess of 10 min), with indistinct seismic waveforms, and were not immediately recognized (Figure 6). A formal call down was not initiated for these two explosions until 15:10 (86 and 56 min after the first and second explosions, respectively), when satellite data could confirm the presence of an ash plume (Table 2). If we do not consider the response times for these two explosions and consider only those later in the sequence where we have records, the average response time decreases to 6.0 min with a standard deviation of 4.6.
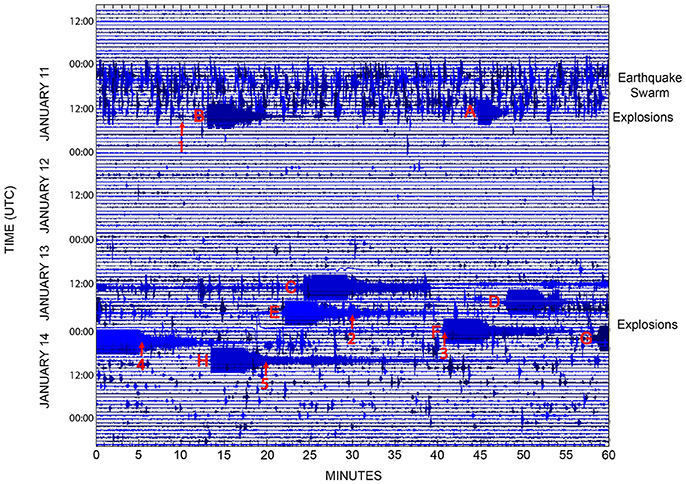
Figure 6. A 5-day velocity seismic record from station AU13 (Figure 4) that shows the eight explosive events that occurred at Augustine Volcano between January 11 and January 14, 2006. Labeled events are explosions that occurred at A, 13:44, B, 14:12, January 11, C, 13:24, D, 17:47, E, 20:22 January 13, F, 03:58, G, 9:14 January 14, 2006. Arrows correspond to time of AVO call down 1, 15:10, January 11, 2, 20:30, January 13, 3, 01:40, 4, 4:05, 5, 00:20 January 14, 2016. Records of call downs do not exist for explosions at 13:24 and 17:47 UTC on January 13, 2016.
Pavlof Volcano, 2016
Pavlof Volcano has had more than 40 eruptions since 1817 and is generally considered to be the most active volcano in North America (Waythomas et al., 2006). Eruptions at Pavlof are characterized by Strombolian activity that produces minor amounts of volcanic ash and small lava flows from the summit crater. Pavlof magmas are typically basaltic andesites (Waythomas et al., 2017). Occasionally Pavlof erupts more explosively, producing ash plumes reaching altitudes higher than 15,000 m and vigorous lava fountaining (McNutt et al., 1991; Waythomas et al., 2006). Eruptions at Pavlof typically occur with little observed precursory unrest and is often described as an open-conduit system (Lu and Dzurisin, 2014; Cameron et al., 2018). AVO has operated a six-station seismic network on the volcano since 1996 (Dixon et al., 2013), and an earlier seismic network monitored the volcano from 1973 to 1990 (McNutt and Beavan, 1987). During the March 2016 eruption of Pavlof, seismic data were transmitted to AVO offices in Anchorage and Fairbanks in real-time and a variety of computerized real-time displays allowed the data to be reviewed in both the time and frequency domain.
The March 2016 eruption of Pavlof began unexpectedly on the afternoon of Sunday March 27, with a relatively small increase in tremor at 23:55 (Figure 7). A pilot from a passing aircraft reported the volcano in eruption with an ash cloud reaching 6,000 m at 00:18 on March 28. AVO initiated a full call down at 00:55, raising the Color Code from Green to Red 60 min after the onset of tremor that marks the start of explosive activity. At 01:33, satellite imagery revealed an ash plume rising to an altitude of 9,000 m. The tremor signal intensified at about 02:23 (Figure 7) and strong ash emission continued on March 28 with a plume reaching as high as 11,000 m. Lava fountaining was observed from the town of Cold Bay. Lower altitude ash plumes were observed for several days and activity then subsided and AVO lowered the Color Code to Orange on March 28, Yellow on April 6 and Green on April 22.
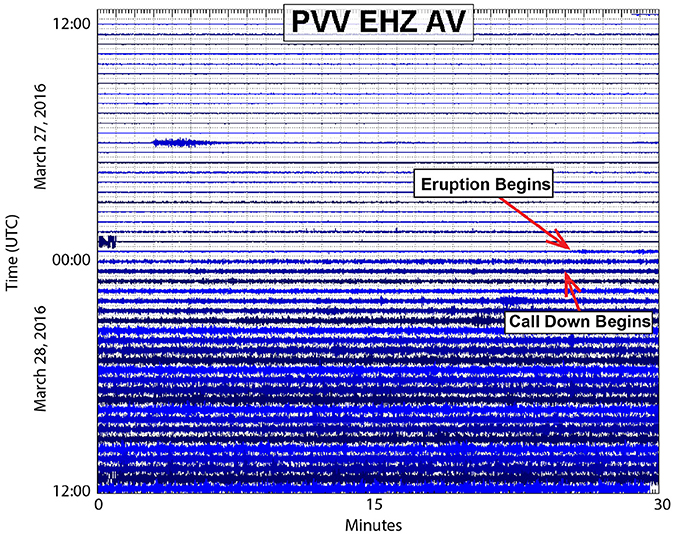
Figure 7. A 24-h velocity seismic record from station PVV that shows the onset of the 2016 eruption of Pavlof Volcano. The eruption began with the subtle increase in volcanic tremor at 23:55 on March 27 and the AVO call down occurred at 00:55 on March 28.
The March 2016 eruption of Pavlof provides an opportunity to review AVO's response time at a volcano that had no recognized precursory activity and on-site monitoring of real-time seismic data was not in place at the onset of activity. For this eruption, the first warning phone call to the FAA from AVO Anchorage office was made 60 min following the onset of explosive activity at 00:55.
Discussion
The review of AVO's response times from eruptions at Redoubt Volcano (1989–90), Mount Spurr (1992), Shishaldin (1999), Augustine (2006), and Pavlof (2016) allows us to evaluate the time required to produce a warning under a number of monitoring scenarios including: repetitive sequences of explosive events that occurred over months to days (Redoubt, 1989–90, Spurr, 1992, Augustine, 2006), single explosions with clear seismic precursors (Shishaldin, 1999), and unexpected explosions (Spurr, August 18, 1992; Pavlof, 2016). All of these volcanoes were monitored by local seismic networks of 5–12 individual stations that ranged in distance from < 1 to 28 km in distance (Dixon et al., 2013). Response times at these five volcanoes range from ~1 to 86 min for the 28 explosions where records of the call down times are preserved.
The shortest response times were from Redoubt and Augustine when the volcanoes were producing sequences of explosions with well-known similar seismic characteristics. For these sequences of repetitive explosive events, response times ranged from ~1 to 13 min (Tables 1, 2). Faster response times were also observed at volcanoes with strong precursory activity that prompted AVO to move to 24-h continuous monitoring, such as Spurr in 1992 where response times ranged from 5 to 12 min. Of the 28 volcanic explosions considered in this study 23 had response times of < 13 min.
The longest response times occurred for either the first or opening explosions in an eruptive sequence or for unexpected or surprise explosions when heightened review of incoming seismic data was not in place and ranged from 31 to 86 min. Only five of the 28 response times considered in this study took longer than 13 min. Many times the desire to confirm the presence of an ash cloud using alternative monitoring data such as satellite imagery or reports from aircraft pilots contributed to the longer response times. The 41-min response time for the premonitory explosion on August 18, 1992 at Spurr results from a smaller and less distinct seismic signal and the time to receive a confirming pilot report (Figure 4). The 2016 Pavlof eruption was not expected and 24-h monitoring was not in place. The 60-min response time results from time spent to contact and organize AVO staff, evaluate the incoming seismic data, and review other monitoring data to confirm the explosive character of the event and the presence of an ash plume. The 86-min response time for Augustine in 2006 occurred because the explosion was relatively small and the seismic envelope resembled a larger earthquake (Figure 6). The single call down for the first two explosions in 2006 was not made until satellite data could confirm an ash cloud.
The style and amount of precursory unrest is also a determinant in the response time. Many of the explosions at Redoubt in 1989–90 were preceded by swarms of Long-Period events (Stephens et al., 1994) and response times were all < 10 min. The June 27, August 19 and premonitory explosion on September 16 at Spurr in 1992 all had well recognized seismic precursors and notifications were issued 12, 5, and 9 min after the explosion's seismic signal began. Given that the April 19, 1999 explosion at Shishaldin had well-recognized precursory activity and 24-h monitoring, the response time of 31-min is long. However, eruptions at Shishaldin are often characterized by extrusive and strombolian activity, and the April 19th explosion was the only explosive event during the 1999 eruption sequence. Consequently, the longer response time for a single explosion, which is identical to the first explosion in an eruptive sequence, is somewhat expected.
Many of the longer response times at the start of an eruptive sequence or for single explosive events often result from a desire to confirm the presence of an ash cloud using monitoring data independent from seismic observations, such as satellite imagery or reports from aircraft pilots. During the period of this study, satellite imagery used to identify and track ash clouds (GOES) can have a lag time of 15–30 min (Dave Schneider, Pers. Comm, 2017). Once the seismic waveform character of explosive events is established, AVO's confidence in issuing warnings based only on a seismic interpretation increases, as demonstrated for Redoubt 1989–90 and Augustine 2006. It may be that the best method of reducing response time would be to develop automated software tools that would identify and characterize the seismic signature of explosions and the incorporation of additional data streams to assist with confirmation of explosive activity and identification of large ash plumes. These techniques include infrasound (DeAngelis et al., 2012), lightning (Behnke et al., 2013), and radar (Schneider and Hoblitt, 2013). AVO has recently made efforts to incorporate these data streams into real-time use in developing warnings (Coombs et al., in preparation) and this may lead to shorter response times.
The observed response times do not seem to change significantly through the 28-year period of this study. The response times from sequences of events during the 1989–90 eruption of Redoubt, displayed on drum recorders, are not significantly different than the response times during the 2006 eruption of Augustine when computerized display and analysis packages were used. This is a surprising result, as we would have expected response times to shorten, given the additional analytical capability in the computerized displays.
Summary and Conclusions
Based on our analysis of 40 explosive events with available historical records: Redoubt Volcano 1989–90, Mount Spurr 1992, Shishaldin 1999, Augustine 2006, and Pavlof Volcano 2016, we can offer the following observations on AVO's ability to seismically recognize and provide warnings of volcanic explosions.
The response time for AVO to provide notification—here defined as a telephone call to the FAA—of a major volcanic explosion ranges from ~1 to 86 min.
Shorter response times ranging from ~1 to 13 min were achieved during eruptive sequences at Redoubt 1989–90, Spurr 1992, and Augustine 2006 that contained numerous explosive events with seismic waveforms that were similar in character and occurred when AVO offices were staffed 24-h per day.
The response times for unheralded volcanic explosions that lacked recognizable precursory unrest ranged from 44 to 60 min. Examples are the August 18, 1992 premonitory explosion at Spurr and that on March 27, 2016 at Pavlof.
Longer response times were also recorded for a single or first explosive event in an eruption sequence. The response time for the single explosive event at Shishaldin in 1999 was just under 31 min. The response time for the first two explosive events at Augustine in 2006 were 58 and 86 min, respectively.
The response times to volcanic explosions are similar throughout the period of study (1989–2016) and do not seem to be affected by a move from drum recorders to computerized seismic display and analysis tools that provide the capability to view waveform data in both the time and frequency domain.
Data Availability Statement
The datasets generated and analyzed for this study can be found in text and the tables contained within the manuscript.
Author Contributions
JP assembled data on explosion and response times. JP and CC worked jointly on text. JP prepared the figures.
Funding
Funding for this project was provided by the U.S. Geological Survey Volcano Hazards Program and cooperative agreements with the USGS Volcano Hazards Program Cooperative Agreements to ADGGS (grant numbers G16AC00054 and G16AC00165).
Conflict of Interest Statement
The authors declare that the research was conducted in the absence of any commercial or financial relationships that could be construed as a potential conflict of interest.
Acknowledgments
We thank the many individuals who contributed to volcanic eruption response efforts in Alaska between 1989 and 2017. The text and figures were improved through formal reviews by Jacob Lowenstern, Christina Neal, and two reviewers.
References
Behnke, S. A., Thomas, R. J., McNutt, S. R., Schneider, D. J., Krehbiel, P. R., Rison, W., et al. (2013). Observations of volcanic lightning during the 2009 eruption of Redoubt Volcano. J. Volcanol. Geotherm. Res. 259, 214–234. doi: 10.1016/j.jvolgeores.2011.12.010
Brantley, S. R. (1990). The Eruption of Redoubt Volcano, Alaska, December 14, 1989-August 31, 1990. U.S. Geol. Surv. Circular. C, 33.
Cameron, C. E., Prejean, S. G., Coombs, M. L., Wallace, K. L., Power, J. A., and Roman, D. C. (2018). Alaska Volcano Observatory Alert and Forecasting Timeliness. doi: 10.3389/feart.2018.00086
Casadevall, T. J. (1994a). The 1989-1990 eruption of Redoubt Volcano, Alaska: impacts on aircraft operations. J. Volcanol. Geotherm. Res. 62, 301–316.
Casadevall, T. J. (1994b). “Volcanic ash and aviation safety,” in Proceedings of the First International Symposium (Seattle, WA: U.S. Geological Survey Bulletin).
Cervelli, D. P., Cervelli, P. F., and Murray, T. L. (2004). New Software for Long-Term Storage and Analysis of Seismic Wave Data (Abstract). EOS.
Cervelli, P. F., Fournier, T. J., Freymueller, J. T., Power, J. A., Lisowski, M., and Pauk, B. A. (2010). “Geodetic constraints on magma movement and withdrawal during the 2006 eruption of Augustine Volcano,” in The 2006 Eruptionof Augustine Volcano, U.S. Geological Survey Professional Paper 1769, eds J. A. Power, M. L. Coombs, and J. T. Freymueller, (Alaska), 427–452.
Chouet, B. A., Page, R. A., Stephens, C. D., Lahr, J. C., and Power, J. A. (1994). Precursory swarms of long-period events at Redoubt Volcano (1989-1990), Alaska: their origin and use as a forecasting tool. J. Volcanol. Geotherm. Res. 62, 95–136. doi: 10.1016/0377-0273(94)90030-2
Coombs, M. L., Bull, K. F., Vallance, J. W., Schneider, D. J., Thoms, E. E., Wessels, R. L., et al. (2010). “Timing, distribution, and volume of proximal products of the 2006 eruption of Augustine Volcano,” in The 2006 Eruption of Augustine Volcano, U.S. Geol. Surv. Prof. Paper 1769, eds J. A. Power, M. L. Coombs, and J. T. Freymueller, 145–186.
Coombs, M. L., Sisson, T. W., Bleick, H. A., Henton, S. M., Nye, C. J., Payne, A. L., et al. (2013). Andesites of the 2009 eruption of Redoubt Volcano. J. Volcanol. Geotherm. Res., 259, 349–372. doi: 10.1016/j.jvolgeores.2012.01.002
DeAngelis, S., Fee, D., Haney, M. M., and Schneider, D. J. (2012). Detecting hidden volcanic explosions from Mt. Cleveland Volcano, Alaska with infrasound and ground coupled airwaves. Geophys. Res Lett. 39. doi: 10.1029/2012GL05635
Dixon, J. P., Stihler, S. D., Power, J. A., Haney, M. M., Parker, T., Searcy, C. K., et al. (2013). Catalog of Earthquake Hypocenters at Alaskan Volcanoes: January 1 through December 31, 2012. U.S Geological Survey Data Series Report 789: 84. Available online at: https://pubs.usgs.gov/ds/789
Doukas, M. P., and Gerlach, T. M. (1995). “Sulfur dioxide scrubbing during the 1992 eruptions of Crater Peak, Mount Spurr Volcano, Alaska,” in The 1992 Eruptions of Crater Peak Vent, Mount Spurr Volcano, Alaska, ed T. E. C. Keith (U.S. Geol. Surv. Bull. 2139), 47–58.
Eichelberger, J. C., Keith, T. E. C., Miller, T. P., and Nye, C. J. (1995). “The 1992 eruptions of Crater Peak vent, Mount Spurr Volcano, Alaska: chronology and summary,” in The 1992 Eruptions of Crater Peak Vent, Mount Spurr Volcano, Alaska, ed T. E. C. Keith (U.S. Geol. Surv. Bull), 1–18.
Gardner, C. A., and Guffanti, M. C. (2006). U.S. Geological Survey's Alert Notification System for Volcanic Activity, U.S. Geol. Surv. Fact Sheet 2006-3139. Available online at: https://pubs.usgs.gov/fs/3139.
Jolly, A. D., Stihler, S. D., Power, J. A., Lahr, J. C., Paskievitch, J. F., Tytgat, G., et al. (2001). Catalog of Earthquake Hypocenters at Alaskan Volcanoes: January 1, 1994 through December 31, 1999. U.S. Geol. Surv. Open-File Report 01-189, 22. Available online at: https://pubs.usgs.gov/of/2001/0189/pdf/of01-189.pdf
Juhle, W., and Coulter, H. (1955). The Mount Spurr eruption, July 9, 1953. EOS Trans. Am. Geophys. Union 36, 199–202. doi: 10.1029/TR036i002p00199
Larsen, J. F., Nye, C. J., Coombs, M. L., Tilman, M., Izbekov, P., and Cameron, C. (2010). “Petrology and geochemistry of the 2006 eruption of Augustine Volcano,” in The 2006 Eruption of Augustine Volcano, U.S. Geol. Surv. Prof. Paper 1769, eds J. A. Power, M. L. Coombs, and J. T. Freymueller, 335–382.
Lu, Z., and Dzurisin, D. (2014). InSar Imaging of Aleutian Volcanoes, Monitoring a Volcanic Arc From Space. Springer Verlag.
McGimsey, R. G., Neal, C. A., and Grina, O. (2004). 1999 Volcanic activity in Alaska and Kamchatka: Summary of events and response of the Alaska Volcano Observatory. U.S. Geol. Surv. Open-file Report 2004–1033, 49. Available online at: https://pubs.usgs.gov/of/2004/1033/1999VolcanicActivityAlaska.pdf
McNutt, S. R., and Beavan, R. J. (1987). Eruptions of Pavlof Volcano and their possible modulation by ocean load and tectonic stresses. J. Geophys. Res. 92, 11509–11523. doi: 10.1029/JB092iB11p11509
McNutt, S. R., Miller, T. P., and Taber, J. J. (1991). Pavlof Volcano: seismological and geological evidence for increased exclusivity during the 1986 eruptions. Bull. Volcanol. 55, 86–98. doi: 10.1007/BF00265414
McNutt, S. R., Tytgat, G., and Power, J. A. (1995). “Preliminary analyses of volcanic tremor associated with the 1992 eruptions of Crater Peak, Mount Spurr Volcano, Alaska,” in The 1992 Eruptions of Crater Peak Vent, Mount Spurr Volcano, Alaska, ed T. E. C. Keith (U.S. Geol. Surv. Bulletin), 161–178.
Miller, T. P. (1994). Dome growth and destruction during the 1989-1990 eruption of Redoubt Volcano. J. Volcanol. Geotherm. Res. 62, 197–212. doi: 10.1016/0377-0273(94)90034-5
Moran, S. C., Stihler, S. D., and Power, J. A. (2002). A tectonic earthquake sequence preceding the April-May 1999 eruption of Shishaldin Volcano, Alaska. Bull. Volcanol. 64, 520–524. doi: 10.1007/s00445-002-0226-1
Neal, C. A., Murray, T. L., Power, J. A., Adleman, J. N., Whitmore, P. M., and Osiensky, J. M. (2010). “Hazard information management, interagency coordination, and impacts of the 2005-2006 eruption of Augustine Volcano,” in The 2006 Eruption of Augustine Volcano, eds J. A. Power, M. L. Coombs, and J. T. Freymueller (U.S. Geol. Surv. Prof. Paper), 645–667.
Nye, C. J., Harbin, M. L., Miller, T. P., Swanson, S. E., and Neal, C. A. (1995). “Whole-rock Major- and trace-element chemistry of 1992 ejecta from Crater Peak, Mount Spurr, Alaska,” in The 1992 Eruptions of Crater Peak Vent, Mount Spurr Volcano, Alaska, ed T. E. C. Keith (U.S. Geol. Surv. Bull. 2139), 119–128.
Nye, C. J., Keith, T. E. C., Eichelberger, J. C., Miller, T. P., McNutt, S. R., Moran, S. C., et al. (2002). The 1999 eruption of Shishaldin Volcano, Alaska: monitoring a distant eruption. Bull. Volcanol. 64, 507–519. doi: 10.1007/s00445-002-0225-2
Power, J. A., Jolly, A. D., Nye, C. J., and Harbin, M. (2002). A conceptual model of the Mount Spurr magmatic system from seismic and geochemical observations of the 1992 Crater Peak eruption sequence. Bull. Volcanol. 64, 206–218. doi: 10.1007/s00445-002-0201-x
Power, J. A., Jolly, A. D., Page, R. A., and McNutt, S. R. (1995). “Seismicity and forecasting of the 1992 eruptions of Crater Peak vent, Mount Spurr Volcano Alaska: an overview,” in The 1992 Eruptions of Crater Peak Vent, Mount Spurr Volcano, Alaska, ed T. E. C. Keith(U.S. Geol. Surv. Bull. 2139), 149–159.
Power, J. A., Lahr, J. C., Page, R. A., Chouet, B. A., Stephens, C. D., Harlow, D. H., et al. (1994). Seismic evolution of the 1989-1990 eruption sequence of Redoubt Volcano, Alaska. J. Volcanol. Geotherm. Res. 62, 69–94. doi: 10.1016/0377-0273(94)90029-9
Power, J. A., and Lalla, D. J. (2010). “Seismic observations of Augustine Volcano, 1970–2007,” in The 2006 Eruption of Augustine Volcano, U.S. Geol. Surv. Prof. Paper 1769, eds J. A. Power, M. L. Coombs, and J. T. Freymueller, 3–40.
Power, J. A., Nye, C. J., Coombs, M. L., Wessels, R. L., Cervelli, P. F., Dehn, J., et al. (2006). The reawakening of Alaska's Augustine Volcano. EOS (American Geophysical Union Transactions), 373–377.
Power, J. A., Stihler, S. D., White, R. A., and Moran, S. C. (2004). Observations of deep long-period (DLP) seismic events beneath Aleutian Arc volcanoes, 1989-2002. J. Volcanol. Geotherm. Res. 259, 31–44. doi: 10.1016/j.jvolgeores.2004.07.005
Power, J. A., Stihler, S. D., Chouet, B. A., Haney, M. M., and Ketner, D. M. (2013). Seismic observations of Redoubt Volcano, Alaska–1989–2010 and a conceptual model of the Redoubt magmatic system. J. Volcanol. Geotherm. Res. 259, 31–44. doi: 10.1016/jvolgeores.2012.10.007
Rasmussen, D. J., Plank, T. A., Roman, D. C., Power, J. A., Bodnar, R. J., and Hauri, E. H. (2018). When does eruption run-up begin? Multidisciplinary insight from the 1999 eruption of Shishaldin Volcano. Earth Planet. Sci. Lett. 486. 1–14. doi: 10.1016/j.epsl.2018.01.001
Schaefer, J. R., Bull, K., Cameron, C., Coombs, M., Diefenbach, A., Lopez, T., et al. (2012). The 2009 Eruption of Redoubt Volcano, Alaska. Alaska Division of Geological & Geophysical Surveys Report of Investigation 2011-5, 45. Available online at: http://www.dggs.alaska.gov/pubs/id/23123
Schneider, D. J., and Hoblitt, R. P. (2013). Doppler weather radar observations of the 2009 eruption of Redoubt Volcano, Alaska. J. Volcanol. Geotherm. Res. 259. 133–144. doi: 10.1016/j.jvolgeores.2012.11.004
Stephens, C. D., Chouet, B. A., Page, R. A., Lahr, J. C., and Power, J. A. (1994). Seismological aspects of the 1989-1990 eruptions at Redoubt Volcano, Alaska: the SSAM perspective. J. Volcanol. Geotherm. Res. 62, 153–182. doi: 10.1016/0377-0273(94)90032-9
Thompson, G., and Reyes, C. (2017). GISMO - A Seismic Data Analysis Toolbox for MATLAB [Software Package]. Available online at: http://geoscience-community-codes.github.io/GISMO/ (Accessed December, 2017).
Waitt, R. B., and Beget, J. E. (2009). Volcanic Processes and Geology of Augustine Volcano, Alaska. U.S. Geol. Surv. Prof. Paper 1762.
Waythomas, C. F., Haney, M. M., Wallace, K. L., Cameron, C. E., and Schneider, D. J. (2017). The 2014 Eruption of Pavlof Volcano, Alaska. U.S. Geol. Surv. Sci. Invest. Rept. 2017-5129.
Waythomas, C. F., Miller, T. P., and Mangan, M. T. (2006). Preliminary volcano-hazard assessment for the Emmons Lake Volcanic Center, Alaska. U.S. Geol. Surv. Scientific Investigations Report 2006-5248. Available online at: https://pubs.usgs.gov/sir/2006/5248/
Keywords: volcanic explosion, response time, Alaska, aleutian, warning
Citation: Power JA and Cameron CE (2018) Analysis of the Alaska Volcano Observatory's Response Time to Volcanic Explosions-1989 to 2016. Front. Earth Sci. 6:72. doi: 10.3389/feart.2018.00072
Received: 14 February 2018; Accepted: 22 May 2018;
Published: 20 June 2018.
Edited by:
Nicolas Fournier, GNS Science, New ZealandReviewed by:
Pablo Samaniego, UMR6524 Laboratoire Magmas et Volcans (LMV), FranceEisuke Fujita, National Research Institute for Earth Science and Disaster Prevention, Japan
Copyright © 2018 Power and Cameron. This is an open-access article distributed under the terms of the Creative Commons Attribution License (CC BY). The use, distribution or reproduction in other forums is permitted, provided the original author(s) and the copyright owner are credited and that the original publication in this journal is cited, in accordance with accepted academic practice. No use, distribution or reproduction is permitted which does not comply with these terms.
*Correspondence: John A. Power, anBvd2VyQHVzZ3MuZ292