 Jeremy D. Pesicek
 John J. Wellik II
 Stephanie G. Prejean
 Sarah E. Ogburn
- 1Volcano Disaster Assistance Program, Volcano Science Center, U.S. Geological Survey, Vancouver, WA, United States
- 2Volcano Disaster Assistance Program, Volcano Science Center, U.S. Geological Survey, Anchorage, AK, United States
Seismic rate increases often precede eruptions at volcanoes worldwide. However, many eruptions occur without such precursors. Additionally, identifying seismic rate increases near volcanoes with high levels of background seismicity is non-trivial and many periods of elevated seismicity occur without ensuing eruptions, limiting their usefulness for forecasting in some cases. Although these issues are commonly known, efforts to quantify them are limited. In this study, we consistently apply a common statistical tool, the β-statistic, to seismically monitored eruptions in Alaska of various styles to determine the overall prevalence of seismic rate anomalies immediately preceding eruptions. We find that 6 out of 20 (30%) eruptions have statistically significant precursory seismic rate increases. Of these 6 eruptions, 3 of them occur at volcanoes with relatively felsic compositions, repose periods >15 years, and VEI ≥ 3. Overall, our results confirm that seismic rate increases are common prior to larger eruptions at long dormant, “closed-system” volcanoes, but uncommon preceding smaller eruptions at more frequently active, “open-system” volcanoes with more mafic magmas. We also explore the rate of other anomalies not precursory to eruptions and investigate their origins. Some of these non-eruptive anomalies can be explained by aftershocks of regional seismic events, magmatic activity that did not lead to eruption, or unrest at other nearby volcanoes. Some open-system volcanoes have high non-eruptive anomaly rates and low pre-eruptive anomaly rates and are thus not amenable to forecasting based on earthquake catalogs. In this study, we find that 31% of anomalies lead to eruption. With continued calibration at more volcanoes, the β-statistic that we apply may be used more broadly to analyze future periods of seismic unrest at other volcanoes, properly placing such episodes into the context of the long-term background rate. These results may be useful for informing future eruption forecasts around the world, and the statistical tool may aid volcano observatories in identifying future seismic rate anomalies under changing network conditions.
Introduction
Earthquake swarms are common occurrences at volcanoes worldwide and are often associated with periods of increased volcanic unrest. The widespread prevalence of swarm activity preceding eruptions has led to their common use in eruption forecasting (e.g., Minakami, 1961; Shimozuru, 1971; McNutt, 1996; Chastin and Main, 2003; Kilburn, 2003; Boué et al., 2015), and volcano-tectonic (VT) swarms have been recognized as the earliest precursor to eruptions at long-dormant volcanoes in many cases (White and McCausland, 2016). However, not all eruptions are preceded by precursory seismicity and others have precursors that are too brief or subtle for effective warning (Larsen et al., 2009; Waythomas et al., 2014; van Eaton et al., 2016; Cameron et al., 2018). Furthermore, although earthquakes often precede eruptions, swarms also commonly occur due to stalled intrusions, high pressure fluid migration, or other non-eruptive activity (Benoit and McNutt, 1996; Farrell et al., 2009; Moran et al., 2011; Shelly et al., 2015). Therefore, some degree of VT swarm seismicity may be considered normal at many volcanoes. Thus, the onset of earthquake swarms near a volcano does not necessarily herald an oncoming eruption, nor does the lack of seismicity preclude an eruption from occurring. The presence or absence of earthquake swarms at a volcano is but one factor to be considered when forecasting eruptions, and the seismic signature of intrusion can vary widely by volcano.
Further complicating the use of VT swarms for forecasting is their similarity to tectonic seismicity unrelated to volcanism. Both types of earthquakes result from the same fundamental source process—brittle fracture of the crust—and VTs are often only differentiated from tectonic seismicity based on the proximity of an event to a volcano. However, location of an event alone is a poor measure of causal mechanism, as tectonically active faults are common in volcanic arcs (e.g., Ruppert et al., 2012), and VT swarms have been convincingly associated with magmatic activity as far as 45 km away from eruption sites (White and McCausland, 2016). These issues make truly magmatic VT seismicity difficult to distinguish from crustal tectonic seismicity unrelated to volcanism. This is especially true for events far from the volcanic center or in sparsely monitored yet tectonically active areas like Alaska. The challenge then becomes separating “normal,” or background seismicity from anomalous seismicity potentially indicative of a coming eruption.
To help distinguish VT swarm seismicity from tectonic seismicity, simple tests for “swarminess” of earthquake sequences have been applied, yet none of them are completely diagnostic. Volcanic earthquake swarms often have large b-values and no clear mainshock (McNutt, 1996, 2005), potentially distinguishing them from tectonic mainshock-aftershock sequences. Yet many counter-examples exist (Mori et al., 1996; Roman et al., 2004; Pesicek et al., 2008; Garza-Giron et al., 2018). Other general characteristics of pre-eruptive VT swarms are (1) the number of events and average energy increases over time, (2) the largest events occur in the middle of the swarm, and (3) the swarm includes several events within 1/2 magnitude unit of the largest event (White and McCausland, 2016). However, these rules of thumb might also be true for tectonic earthquake swarms unrelated to volcanism (e.g., Vidale et al., 2006; Holtkamp and Brudzinski, 2011). In addition, at the onset of an earthquake sequence, it may be difficult to know which of these traits will hold true, if any. Conclusively attributing crustal seismicity near volcanoes to magmatic processes remains difficult, especially early in an unrest sequence before gas, heat, deformation, or other anomalies are detectable at the surface.
Despite these challenges, seismic monitoring remains the cornerstone of eruption forecasting. Volcano observatories commonly must decide at what point a seismicity increase is “anomalous” in comparison to background seismicity and at what point it is concerning enough to notify authorities. These decisions are complicated by seismic network outages, leading to earthquake catalogs with time variable completeness thresholds. Automated tools assist in this effort, and additional insights may be gained by more formally investigating the relationship between seismicity and subsequent eruptions at many volcanoes.
In this paper, we search for anomalous seismicity (dominantly VT) preceding seismically monitored eruptions to identify the circumstances under which seismicity may be most useful for eruption forecasting. To do so, we detect statistically significant seismic rate anomalies above a volcano-specific, empirically-derived threshold using a variation of a common statistical test (the β-statistic; Matthews and Reasenberg, 1988). In order to determine whether anomalous rate increases occur or do not occur prior to eruptions, we require a catalog of eruptions of various sizes and styles that were seismically monitored during both inter-eruptive and eruptive periods. Specifically, we require the ability to determine long-term background seismicity rates. Although seismic monitoring of eruptions is now routine worldwide, few places on Earth have had seismic monitoring operating consistently for long enough to properly estimate a volcano's long-term background seismicity rate. Even fewer have this type of monitoring consistently at many volcanoes with multiple, well documented eruptions of various styles and sizes. One place where this type of monitoring exists is Alaska.
We use earthquake catalog data from Alaska and the record of eruptions seismically monitored by the Alaska Volcano Observatory (AVO) to statistically identify periods of seismicity exceeding background levels, and then associate these anomalies spatially and temporally with subsequent volcanic eruptions. We attempt to determine how often and under what circumstances seismic rate anomalies occur before eruptions in Alaska. Once identified, we search for patterns among the results that might prove useful for eruption forecasting in the future. We also investigate other non-eruptive seismicity increases and their causes and compare those to pre-eruptive seismicity. We take a quantitative approach using the β-statistic and specific temporal and spatial parameters to identify seismic rate anomalies. We vary these parameters over reasonable ranges and then use these results as a whole to infer when such anomalies might be useful for forecasting in the future. The findings presented herein should prove valuable for interpreting future seismicity, both in Alaska and at analogous volcanoes worldwide.
Data
The data used in this study are composed primarily of Alaska earthquake catalogs and eruptive chronologies beginning with the June 1992 eruption of Mt. Spurr volcano and ending with the March 2016 eruption of Pavlof volcano (see Cameron et al., 2018). The chronology data (Ogburn et al., 2016) come from a variety of sources, including specific eruption literature and the Geologic Database of Information on Volcanoes in Alaska (GeoDIVA, Cameron and AVO staff, 2014). To define eruptive periods (Table 1), we consider the start of an eruption to be the first magmatic or major phreatic explosion (distinct from normal, background fumarolic activity, or steam plumes). Ends of eruptions are more difficult to determine but are based on the return to background levels of activity, the cessation of unrest, and/or the lowering of alert levels, depending on the specific eruption. We analyze 20 eruptions with Volcanic Explosivity Indices (VEI; Newhall and Self, 1982) ranging from 1 to 4 at 8 volcanoes (Figure 1, Table 1).
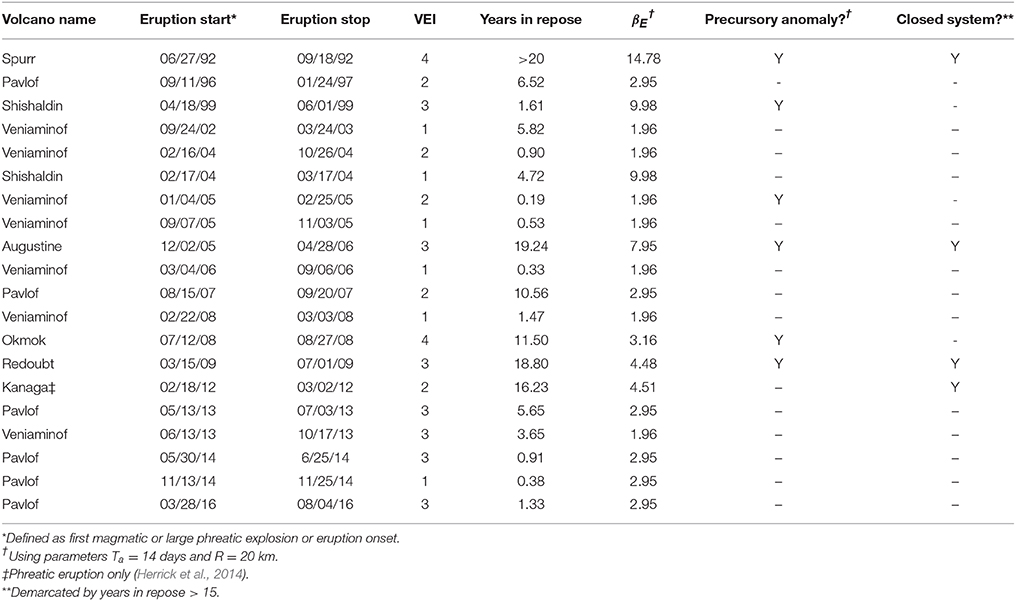
Table 1. Eruption data.
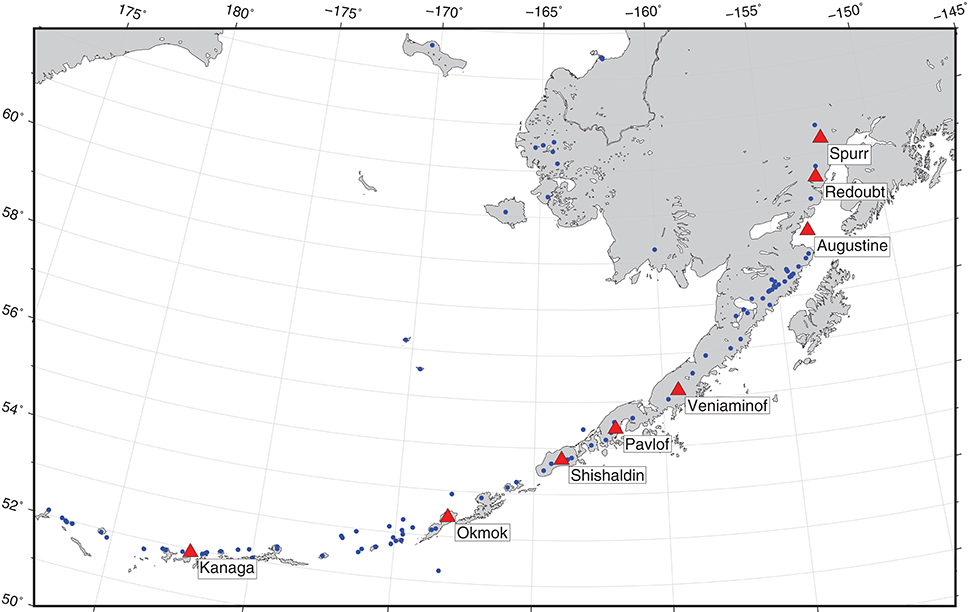
Figure 1. Location of seismically monitored Alaskan volcanoes (red triangles) with eruptions analyzed in this study. Holocene eruptive centers are shown as blue circles.
Although AVO produces its own earthquake catalog for seismically monitored volcanoes (e.g., Dixon et al., 2013), we use the Advanced National Seismic System (ANSS) composite catalog, which contains those events located by the Alaska Earthquake Center (AEC) and the USGS National Earthquake Information Center (NEIC), in addition to those located by AVO. The combined catalog allows us to analyze distal earthquakes that are potentially outside of the AVO network and thus not directly linked to a particular volcano. However, the composite nature of the ANSS catalog results in the loss of some useful event attributes, such as location uncertainty and source type descriptions, which limits our analysis to some degree (see section Discussion).
The background time period for each volcano is defined by the number of days of seismic monitoring minus eruptive periods and network outages. To determine seismic network outages, we use the results of the AVO network health analysis by Buurman et al. (2014) for the period October 2002 through December 2011 and perform our own similar analysis of the continuous seismic data to define outages since 2012. Network outages are defined as periods when less than four stations within 30 km of a volcano were transmitting data. Thus, our definition of background seismicity rate (T) is limited to years where network health can be readily determined from consistently archived continuous seismic recordings, which corresponds to the time period beginning in 2002 through early 2016.
Finally, we construct specific background earthquake catalogs for each volcano spatially. The catalogs contain all shallow (<=30 km) crustal events from the ANSS catalog since 1990 within a specified search radius (R) from the volcanic center, minus events that occurred during eruptive periods. We further limit the catalogs to events with magnitudes greater than each network's magnitude of completeness (Mc) over T, which we approximate as Mc = 0 for all eight volcanoes studied (Dixon et al., 2013).
Methods
A primary goal of this study is to quantitatively identify seismic rate anomalies near Alaska volcanoes and to associate these anomalies temporally with subsequent eruptions or lack thereof. Accordingly, we seek to determine when a particular period of seismicity is statistically above the background rate. To do so, we use the β-statistic (Matthews and Reasenberg, 1988), which detects changes in earthquake rates by comparing the difference between the number of events in a given time period to the expected number of events in that time period (assuming the seismicity is Poissonian), normalized by the standard deviation of the expected number. This common statistical test has been used successfully in many tectonic environments to identify subtle changes in seismicity rates, such as identification of dynamically triggered seismicity and stress shadows following large earthquakes (e.g., Reasenberg and Matthews, 1988; Gomberg et al., 2001). Following Aron and Hardebeck (2009) and Aiken and Peng (2014), the β-statistic is defined as
where N is the number of events in the background time period (T) and Na is the number of events in a specific time period (Ta) of interest (Table 2). As the null distribution for β is approximately Gaussian (Matthews and Reasenberg, 1988), absolute values of the resultant β ≥ 2.57 (1.96, 1.64) are statistically significant at 99% (95, 90%) confidence (Aron and Hardebeck 2009), and positive (negative) β values denote seismicity increases (decreases).
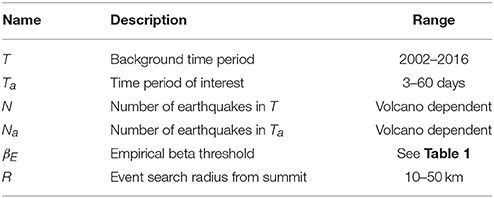
Table 2. β-statistic symbols.
We compare long-term background seismicity rates to short-term windows of interest and search for statistically significant differences at a 95% confidence level. This should occur when β exceeds a threshold of 1.96. However, because volcanic seismicity may not be strictly Poissonian, we additionally seek an objective empirical threshold (βE) for β, following Prejean and Hill (2018), to determine if seismicity in the time and crustal volume of interest is truly anomalous compared to background rates. To define this threshold for each volcano, we calculate the β-statistic every day over T for specific values of Ta and select a βE that is exceeded only 5% of the time. With few exceptions, the resulting βE values are larger than 1.96 (Table 1). Where βE < 1.96, we use the significance threshold at the 95% confidence level (1.96) rather than the lower, empirically-derived βE threshold.
In Alaska, we seek all β above βE (hereafter “anomalies”) and examine whether or not these rate increases are temporally associated with subsequent eruptions. Specifically, we search for all β anomalies preceding Alaskan eruptions of VEI 1 or greater since 1990. Because the β-statistic was designed to detect subtle divergences in seismicity from background rates and because volcanoes often have non-eruptive swarms, we do not expect every β-statistic anomaly to result in eruption. Nonetheless, this technique allows us to explore and quantify subtle precursors, including any that may have been missed previously for eruptions not forecast (see Cameron et al., 2018). In order to incorporate all events occurring prior to an eruption onset, we specify Ta windows that end at the eruption start time. Thus, Ta windows are necessarily defined backward in time based on the eruption onset. This retrospective approach is applied in order to maximize the identified anomalies. However, we also illustrate the potential use of the tool for real-time forecasting later in the discussion section using forward moving overlapping windows. Figure 2 shows an example of the test as applied to Augustine volcano, which erupted most recently in 2006.
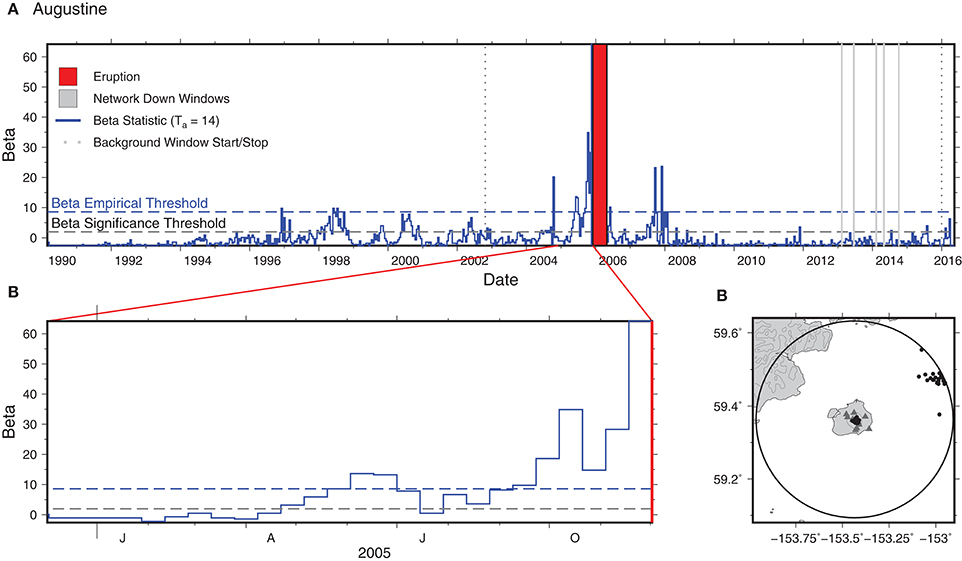
Figure 2. Example of the β-statistic as applied to Augustine volcano. (A) Results (Ta = 14 days) over the entire time period of analysis. (B) Zoomed version of (A) beginning 1 year before the 2006 eruption. (C) Locations for events (black dots) within Ta = 14 days of the eruption. Dark gray triangles show locations of nearby seismic stations. Black circle shows search radius (R = 30 km) from the volcanic center. Topography contours (300 m interval) are shown in gray.
Results and Sensitivity
The identification of seismic rate anomalies preceding eruptions in Alaska depends on the particular parameters chosen for the test, in particular on Ta and R (Table 2). We explored a range of reasonable values for these parameters based on our study goals and prior knowledge of seismic sequences preceding past eruptions. For the radial earthquake search, we used R-values from 10 to 50 km from the volcanic centers. Although seismicity directly preceding eruptions generally occurs close to the eruptive vent, VTs >45 km distal of volcanoes have been associated with subsequent eruptions (White and McCausland, 2016). Thus, we allow for the possibility that precursory VT seismicity may occur as far as 50 km distal of the volcano, outside the AVO local monitoring networks. However, searching out this far from the volcanoes likely incorporates more tectonic seismicity, which may result in the inclusion of anomalies unrelated to magmatic activity and also affects our measurement of “background” seismicity rate.
The parameter Ta defines the length of the time window over which to define an anomaly, and its choice is guided by the goals of a particular study. In this study, the choice of Ta should be based on typical time spans of precursory sequences of seismicity leading into eruptions. However, the choice of Ta also affects the resulting βE threshold and the size and number of detected anomalies. The design of our βE empirical threshold is such that the largest 5% of all possible Ta windows are by definition anomalous. As a result, larger Ta windows generally produce fewer anomalies and lower βE values than smaller windows, and vice versa. In addition, the length of Ta need not be directly related to the time duration of anomalous seismicity and does not necessarily relate to eruption run-up time. Brief but sufficiently intense periods of seismicity can produce anomalies even when the size of Ta is much longer than the event sequence. In contrast, longer but less intense periods of variably elevated seismicity tend to create multiple separate anomalies for small values of Ta and may not produce anomalies at all for larger choices of Ta. It is the overall number of events (Na) occurring in Ta that is important. Thus, the value of Ta should be sufficiently long so as to encompass significant rate increases but not so long as to minimize their significance. In this study, we search a range of values for the Ta window length (3–60 days), initially seeking the value that will identify as many precursory anomalies as possible, then varying the value to explore its effects on the results.
Searching all combinations of Ta and R, we have identified 6 seismic rate anomalies preceding seismically monitored eruptions in Alaska for eruptions at Spurr (1992), Shishaldin (1999), Veniaminof (2005), Augustine (2005), Okmok (2008), and Redoubt (2009) volcanoes (Figure 3, Table 1). Of these eruptions, only Veniaminof (2005) and Okmok (2008) were not forecast by AVO (Power et al., 1995; Power and Lalla, 2010; Buurman et al., 2013; Cameron et al., 2018). In the case of Okmok (2008), the pre-eruptive seismicity was too brief (~2 h) for AVO to publish a notification (Larsen et al., 2009). In the case of Veniaminof (2005), the seismicity increase consisted of only 13 events none of which were near the summit (Figure 3). For the remaining 14 eruptions at 3 volcanoes, we do not identify precursory seismic rate anomalies for any combination of Ta and R. Figure 3 shows the 6 precursory anomalies using Ta = 14 days and R = 20 km, which are the maximum values for these parameters over which all 6 anomalies are identified. However, these pre-eruptive rate anomalies are identified over various combinations of Ta and R, depending on the volcano, and no overall optimal values are illuminated by our analysis. In Figure 4, we keep Ta = 14 days and explore how variations in R affect the results. Conversely, in Figure 5, we vary Ta while keeping R = 20 km. With few exceptions, these figures show that the identified precursory anomalies are generally stable with respect to these variations in Ta and R. Figure 4 shows that precursory anomalies are identified at Augustine, Okmok, Shishaldin, and Redoubt no matter the choice of radius (Ta = 14), whereas anomalies at Spurr and Veniaminof are dependent on the specific choice of R. At Spurr, only radii ≤20 km produce a precursory anomaly, while at Veniaminof, only radii ≥10 km produce anomalies. Figure 5 shows precursory anomalies identified at Okmok, Redoubt, and Augustine for all choices of Ta. However, the β value of the anomalies varies in relation to the specific timing of seismic rate peaks. For instance, at Augustine, β correlates with window length, reflecting the extended nature of the precursory ramp up in seismicity. In contrast, β is anti-correlated with window length at Okmok, reflecting the short duration of the ~2 h precursory sequence (Larsen et al., 2009). Anomalies preceding the eruption at Spurr are only identified when Ta = 3, 7, 14, and 60 days, but not 30 days. At Veniaminof, precursory anomalies are not identified when Ta = 60 days. The variations in anomaly detection due to R and Ta reflect the spatio-temporal variability of the seismic catalogs that likely results from volcano- or intrusion-specific factors such as the local stress field and/or intrusion size and rate.
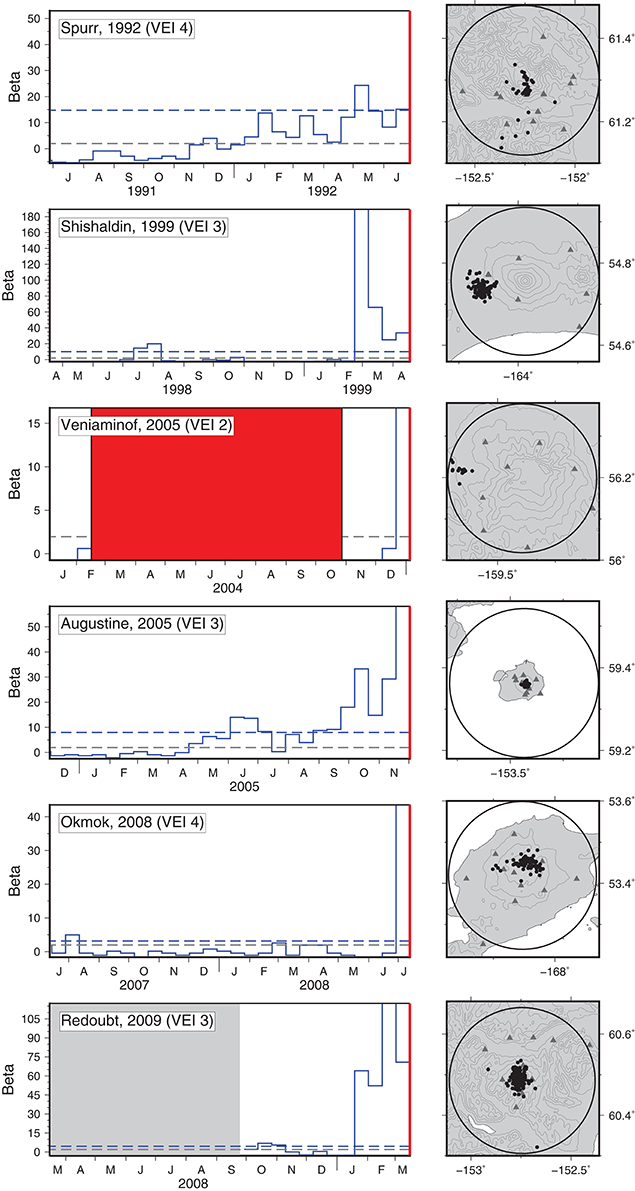
Figure 3. Results of the β-statistic test for Ta = 14 days and R = 20 km, which corresponds to the maximum values for these parameters for which all 6 anomalies are identified. X-axes show the year prior to the eruption, similar to Figure 1B. Y-axes are scaled by the maximum anomaly seen over the entire time period analyzed (see Figure 7). Maps show events within Ta = 14 days of eruption. See Figure 2 and text for additional details.
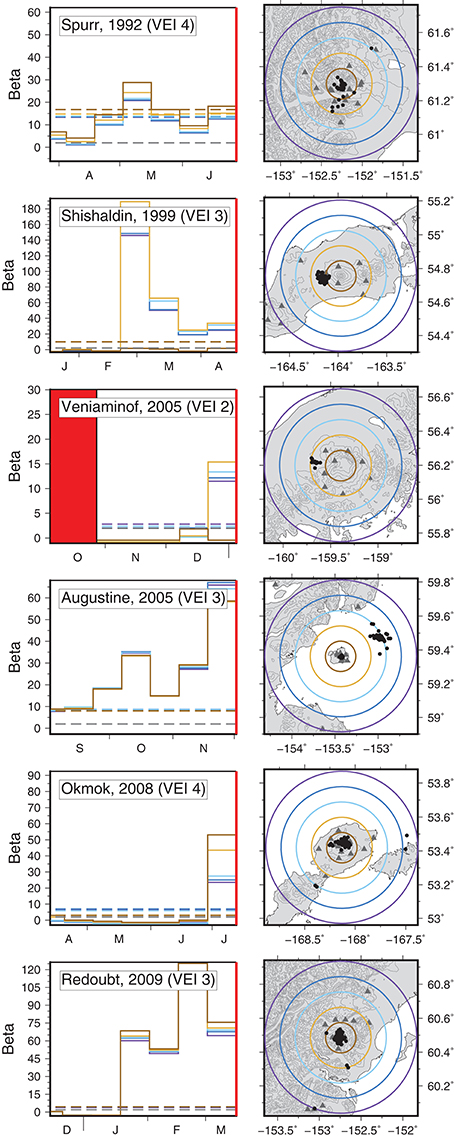
Figure 4. Results of the β-statistic test for radial (R) values = 10, 20, 30, 40, and 50 km (brown, yellow, light blue, dark blue, purple). Ta = 14 days for all results shown. X-axes show the 3 months prior to the eruption. Y-axes are scaled by the maximum anomaly seen over the entire time period analyzed (see Figure 7). Maps show earthquakes within Ta = 14 days of eruption. See Figure 2 and text for additional details.
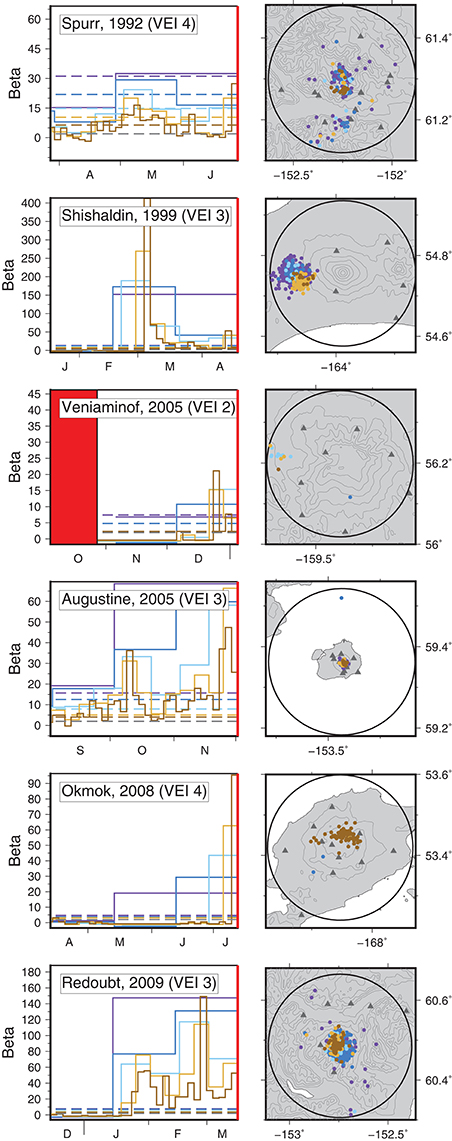
Figure 5. Results of the β-statistic test for a range of Ta day values = 3, 7, 14, 30, 60 (brown, yellow, light blue, dark blue, purple). R = 20 km for all results shown. X-axes show the 3 months prior to the eruption. Y-axes are scaled by the maximum anomaly seen over the entire time period analyzed (see Figure 7). Maps show events within Ta days of eruption. See Figure 2 and text for additional details.
Although Ta and R are the most influential parameters on the identification of anomalies, the results may also be affected by other factors, such as the filtering of the volcano catalogs in order to remove events during eruptive periods. Although most eruption start dates are well-defined, the subjective demarcation of eruptive versus pre- and post-eruptive seismicity in some cases may introduce uncertainty into our results. In rare cases, visual confirmation of eruption onsets may be lacking, introducing uncertainty into the estimated start times. In Alaska, onsets of small eruptions at remote but frequently active volcanoes are often difficult to determine (e.g., 2004 and 2005 Veniaminof eruptions). The prime example of eruption onset uncertainty is the 1999 eruption of Shishaldin volcano, for which considerable uncertainty exists in the start date. Herein we consider the eruption to have started on 18 April 1999 (UTC), when visual confirmation of magmatic eruption was received, 2 days prior to the large explosive paroxysm of 19 April (Moran et al., 2002; Nye et al., 2002). However, vigorous and anomalous steam venting with possible ash, tremor, and a hot spot were detected as early as 9 February, followed by a 2 month pause in activity (Nye et al., 2002; McGimsey et al., 2004b). The uncertainty in this start date is important because on 4 March, a M5.2 earthquake occurred on the west flank, over a month before the April eruption start date. Using a February start date, the M5.2 and its aftershocks would be excluded from the analyzed catalog, and the event would be considered syn-eruptive, occurring after the eruption onset. Thus, in this particular case, the choice of start date determines whether this unusually large event and its aftershocks are included or omitted. Preferring 18 April as our start date, we identify and include a precursory anomaly for this eruption in our results (Figure 3). In effect, there is a clear seismicity rate precursor before the eruption paroxysm, but no precursor for a subtle eruption onset that may have occurred earlier.
With the exception of the Shishaldin and Veniaminof eruptions, most of the remaining eruption start dates have visual confirmation of the onset and thus minimal uncertainty. In contrast, eruption end dates are not well defined in Alaska or globally, even for well-monitored volcanoes (Siebert et al., 2011). Changes to eruption end dates may affect the categorization of significant periods of seismicity as either syn- or post-eruptive, potentially modifying our results. For some eruptions, seismicity remained elevated in the weeks following the defined end of the eruption (e.g., 2008 Okmok). Extending the eruption end date to include these events would exclude them from the analyzed catalog, potentially altering the computed βE threshold. In order to assess this potential issue, we modified the eruption end dates (Table 1) such that the eruption durations would change by ±20% and recomputed the results. We find that varying the eruption end dates in this manner does not change the number of identified anomalies. Thus, our results are stable with respect to small changes in eruption end dates.
Discussion
Our results statistically identify seismic rate anomalies preceding the eruptions at Spurr (1992), Shishaldin (1999), Veniaminof (2005), Augustine (2005), Okmok (2008), and Redoubt (2009) volcanoes (Figure 3). Using this method, 30% (6/20) of all eruptions analyzed and 43% (6/14) of VEI ≥ 2 eruptions have pre-eruptive seismic rate anomalies (Table 1). All magmatic eruptions (3/3) at closed-system volcanoes (repose > 15 years) have seismic rate anomalies (the phreatic eruption at Kanaga was not preceded by an anomaly). Further, 56% (5/9) of VEI ≥ 3 eruptions are preceded by seismic rate anomalies, including all 3 eruptions analyzed at long dormant, closed-system volcanoes. In contrast, eruptions at open-system volcanoes were rarely (13%; 2/16) preceded by seismic rate anomalies. Overall, the results support the widely held view that seismic rate anomalies are more common preceding eruptions at long dormant, felsic, closed-system volcanoes than at more frequently active, mafic, open-system volcanoes. In fact, Cameron et al. (2018) found similar relationships between VEI, composition, and open vs. closed systems and the success rates of AVO in forecasting eruptions of different types (Cameron et al., 2018), which is not surprising given that these eruptions were forecast based primarily on seismicity (e.g., Power et al., 1994, 1995; Nye et al., 2002; Power and Lalla, 2010; Buurman et al., 2013).
In evaluating the success rate of any forecasting tool, it is also important to quantify the number of false-positives, or herein, non-eruptive anomalies. We cannot completely quantify the number of seismic rate anomalies that are not followed by eruptions because we cannot apply our test to all seismically monitored volcanoes in Alaska, rather only those that have erupted at least once since 1992. We can, however, evaluate the number of non-eruptive anomalies produced by this particular method at those volcanoes that have erupted since 1992 (Table 1). Figure 6 shows the complete time series for all 8 volcanoes analyzed, using Ta = 14 days and R = 20 km. In addition to the 6 pre-eruptive anomalies (Figure 3), we have also identified a number of non-eruptive anomalies (69 for Ta = 14 days and R = 20 km). Most of these non-eruptive anomalies are short-lived and represent brief increases in seismicity at volcanoes with high background noise or small numbers of earthquakes at seismically quiet volcanoes. Many of these short-lived anomalies are also small in amplitude, implying lower confidence (Figure 6). Some of the anomalies, however, are more sustained, and have known origins. The long duration, non-eruptive anomaly at Shishaldin in 2002 may represent shallow proximal unrest related to ongoing phreatic activity (Neal et al., 2005). The long period of multiple anomalies at Spurr in 2004 has been clearly associated with a magmatic intrusion, or “failed eruption,” where magma stalled before reaching the surface (Power et al., 2004; Moran et al., 2011). The 2008 anomaly at Kanaga is related to aftershocks of a distal M6.6 earthquake, that is presumably tectonically driven. The sustained non-eruptive anomaly at Pavlof in 2002 is actually related to unrest at nearby Mount Hague, part of the Emmons Lake caldera system (Neal et al., 2005), illustrating one difficulty with using large radii to search for seismicity in areas with multiple, closely-spaced volcanoes. Several other non-eruptive anomalies occur in the days to months following after eruptions. The non-eruptive anomaly at Spurr following the 1992 eruption could be considered as post-eruptive unrest related to continued intrusion or crustal adjustment (Cameron et al., 2018). In fact, many of the other non-eruptive anomalies (e.g., Augustine, 2007; Okmok, 2009) could also be considered post-eruptive unrest (Cameron et al., 2018). The Okmok, 2009 non-eruptive anomaly, for example, coincides with a thermal anomaly, tremor-like events, and shallow slope failure in late February to early March 2009, followed by tremor bursts in May 2009 (McGimsey et al., 2014). Applying a post-eruptive window of 1-year eliminates 16% of these non-eruptive anomalies. However, because of the close spacing of Veniaminof eruptions, application of such a post-eruptive window would eliminate the precursory anomaly before the 2005 eruption. Finally, other non-eruptive anomalies could also be related to post-eruptive mass-wasting processes; for example, the small non-eruptive anomaly at Augustine in 1998 is related to the collapse of the 1986 spine (McGimsey et al., 2004a).
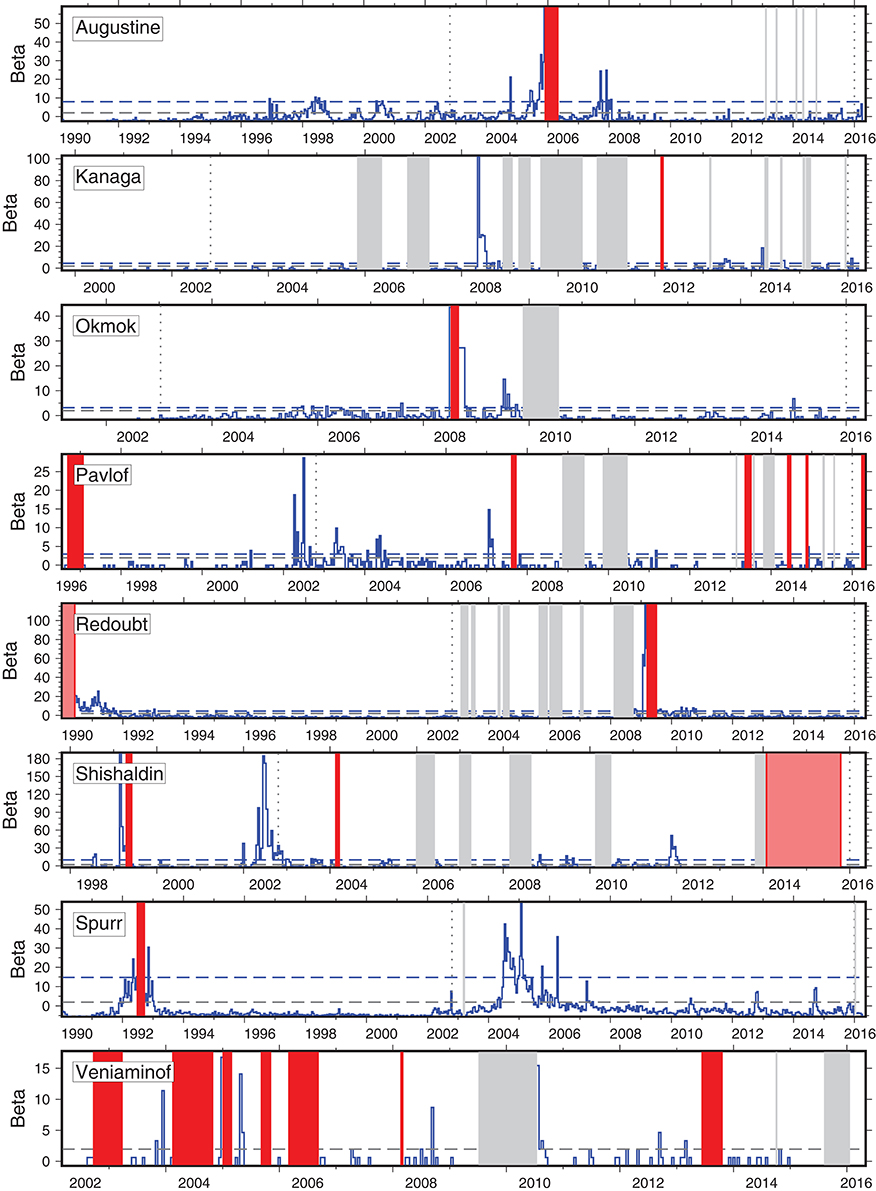
Figure 6. Complete results for all nine volcanoes with eruptions analyzed for Ta = 14 days and R = 20 km, similar to Figure 3. Note that the 1989 Redoubt and 2014 Veniaminof eruptions (light red) were not analyzed in this study due to lack of sufficient seismic monitoring. See Figure 2 for additional details.
Although applying a post-eruptive window reduces the number of non-eruptive anomalies, some volcanoes still have high numbers of non-eruptive anomalies. For example, many short-lived non-eruptive anomalies are identified at Veniaminof, yet only one of the 7 eruptions shows a precursory anomaly (Figure 6). Thus, although an anomaly was identified before the 2005 Veniaminof eruption, AVO could not have confidently forecast the eruption based solely on seismicity rates because of the high non-eruptive anomaly rate. In general, open-system volcanoes like Pavlof and Veniaminof have high numbers of non-eruptive anomalies and low numbers of pre-eruptive anomalies and thus do not appear to be amenable to reliable eruption forecasting based only on seismicity rates. Other data streams, such as gas or deformation data may be necessary to improve forecasting at such open-system volcanoes (e.g., de Moor et al., 2016). In general, the lack of precursory seismic anomalies at these volcanoes, despite the choice of Ta and R, confirms that AVO did not miss any subtle or distal pre-eruptive seismicity and could not have forecast them based on seismicity (see also Cameron et al., 2018).
Unlike the anomalies that precede the eruptions, the number of non-eruptive anomalies varies significantly depending on the choice of parameters used for detection, and it is useful to investigate which parameter values minimize the overall number of non-eruptive anomalies. By fixing Ta = 14 and varying R as in Figure 4, we find R = 30 km to produce the fewest non-eruptive anomalies. However, changes in counts of non-eruptive anomalies due to variations in radius are small, and there is no clear trend that would identify a clear optimal value for minimizing non-eruptive anomalies overall. In contrast, the size of the Ta window has a clear impact on the non-eruptive anomaly count because the length of Ta is directly correlated with the number of anomalies and the βE empirical threshold, as discussed above. For example, when using Ta = 60 days, the non-eruptive anomaly rate is reduced from 69 to 16. Although a window of this length may be less useful for real-time forecasting purposes, it does allow us to more easily investigate how often the most significant periods of unrest detected by this method lead to eruption. Overall, when implementing a post-eruptive window of 1 year, using R = 20 km and Ta = 60 days, we find that 31% of anomalies lead to eruption. This rate is partially confounded by other factors mentioned earlier, (e.g., close proximity of other restless volcanoes), and the fact that we do not consider non-eruptive anomalies at volcanoes with no eruptions since 1992. However, Cameron et al. (2018) find a similar rate of unrest without eruption when evaluating AVO color code changes (29% of unrest led to eruption, 71% did not). Some studies find roughly similar ratios (30–38% of unrest led to eruption) using a variety of methods and proxies for unrest (e.g., Newhall and Dzurisin, 1988; Gudmundsson, 2006; Biggs et al., 2014), while other studies find higher rates of unrest leading to eruption (Klein, 1982; Phillipson et al., 2013; Winson et al., 2014; 60–67%). Quantifying the probability that unrest will lead to an eruption is a crucial open question for forecasting, and in fact forms an early (often first) node in many event trees used for eruption forecasting (e.g., Newhall and Hoblitt, 2002; Wright et al., in press).
Toward the overriding goal of further improving eruption forecasting, the methods and results presented herein represent progress toward better understanding the relationships between precursory seismicity and eruptive activity. Our results confirm that we can expect, with a relatively high degree of confidence, anomalously high seismicity rates preceding large (VEI ≥ 3) explosive eruptions at closed-system volcanoes. However, this method confirms that seismicity rate changes have a relatively low predictive power for smaller eruptions at open system volcanoes. These results help to weigh the significance of seismic anomalies detected relative to other monitoring data streams when evaluating unrest and formulating a forecast at volcanoes of different types, and are already being used by VDAP and many volcano observatories for forecasting around the world. However, we can go further and apply a slightly modified β-statistic test to make the method more directly applicable to future forecasting in Alaska. Figure 7 shows how we might apply this test to volcanoes included in this study in near real-time, when eruption times are unknown. For this figure, we re-computed the β-statistic every day using seismicity from the preceding Ta days, in contrast to previous figures where Ta windows ended at the eruption start times (see section Methods). Due to the dependency of the results on the particular choice of Ta (Figure 5), we simultaneously computed the results for different values of Ta, defining anomalies once the predetermined βE threshold (which could also be regularly updated) is exceeded. Although such anomalous seismicity would likely be noted by observatory staff, this approach would automatically confirm the anomaly rather than relying solely on human recognition, quantify its significance, and quickly place it in context of previous seismicity at the volcano. A quantitative approach such as this can properly account for factors changing with time (e.g., network upgrades) that may be missed by more qualitative or ad hoc assessments of seismicity. In this way, seemingly anomalous seismicity can be better and more quickly assessed with respect to the long-term background rate and previous episodes of unrest. Outside of Alaska, this tool could also be applied in near real-time to aid in quantifying anomalous seismicity in comparison to background. Even when no prior eruptive activity has been seismically observed (and thus no useful βE threshold can be computed), we can still apply the test to more quantitatively compare current periods of unrest to previous unrest, provided that long-term catalogs of seismicity (ideally before and after historical eruptions) and information about the long-term monitoring history is available.
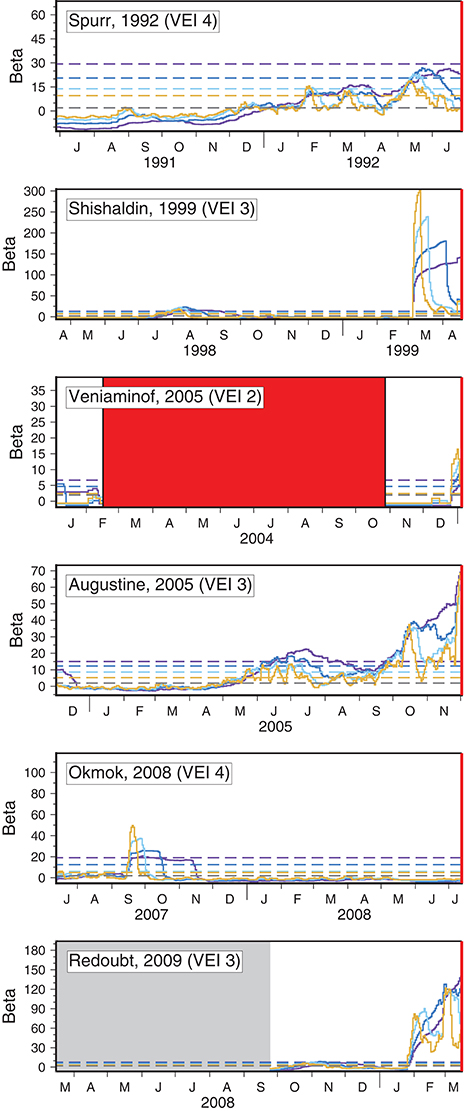
Figure 7. Forward-computed β-statistic results for the 12 months prior to the eruptions shown in Figures 3–5. In this case, the β-statistic was recomputed every day using R = 30 km and events from the preceding Ta = 7, 14, 30, and 60 days (brown, yellow, light blue, dark blue, purple; c.f. Figure 5). Note that no precursory anomaly is identifiable at Okmok because the computation occurs at the end of each day. Thus anomalies confined to the day of the eruption are not included. See Figures 3, 5 and text for additional details.
Although we have shown them to be useful, this tool and our results are imperfect attempts to address complex physical phenomena in a consistent way. We are not attempting to model or explain any physical volcanic process but rather are searching for commonalities in eruptive behavior despite important differences between and within the various volcanic systems. With this statistical tool, we seek to aid volcano observatories in identifying seismic rate anomalies above background when seismic network health and earthquake detection rates fluctuate. Toward this goal, we have made specific decisions because they allow us to consistently apply the test despite known shortcomings. For example, in our analysis we have not considered two event attributes usually included in earthquake catalogs for volcanoes: magnitude and event type. Although precursory patterns in event magnitude and overall energy release are quite important for forecasting (e.g., Murray and Endo, 1992; Cornelius and Voight, 1994), they are beyond the scope of the statistical test presented herein, which is concerned only with event rate. Similarly, we have not considered event type because the ANSS catalog does not retain this attribute in their combined catalog. As a result, we are including LP events in our analysis in addition to VTs. Although these events are relatively infrequent in most of the volcano catalogs included in this study (e.g., 12% of 2012 AVO catalog overall; Dixon et al., 2013), they are likely contributing to the identified rate anomalies in some cases, particularly the frequently active open system volcanoes, like Pavlof, which has a higher than average % of LPs. Finally, we have not formally considered location uncertainty in our analysis, which is also unavailable from the ANSS catalog. In general, AVO volcano catalogs have average uncertainties ≤ ~2 km (Dixon et al., 2013), while AEC and NEIC location uncertainties are generally larger. However, we have implicitly incorporated epicenter uncertainty by varying the radial (R) search and exploring its effects on our results (Figure 4). Similarly, we found that small changes (±5 km) in the depth threshold we applied (30 km) did not affect the number of pre-eruptive anomalies identified.
Despite these limitations, our work contributes to improving eruption forecasting in several ways. Although seismic rate anomalies are commonly observed globally, most previous work has been focused on increases in seismic activity in the immediate vicinity of volcanic vents (e.g., Kilburn, 2003). In fact, definitions of “volcanic earthquakes” are often limited to those within 10 km of the summit (Shimozuru, 1971; McNutt, 1996). In addition, many studies rely only on LP events for forecasting instead of VTs (e.g., Chouet et al., 1994; Boué et al., 2015). Although effective, such efforts are focused proximally, and there is the potential to miss earlier distal precursors, which may occur long before run-ups in vent related seismicity at long-dormant volcanoes (White and McCausland, 2016). For example, at Shishaldin volcano, distal seismicity between 10 and 20 km from the summit peaked more than 2 months before the 1999 eruption (Rasmussen et al., 2018; Figures 3–5); and distal seismicity (20–40 km from the summit) occurred at Augustine roughly 2 months before the start of the 2005–2006 eruption (Fisher et al., 2010; Figure 4). Finally, while retrospective deterministic eruption forecasts based on near vent seismicity continue to show promise in forecasting, they depend critically on rigorous independent calibration at each new volcano where they are applied (e.g., Boué et al., 2015, 2016; Chardot et al., 2015; Salvage and Neuberg, 2016). In contrast, our approach is to seek temporal seismic patterns that apply broadly to a set of volcanoes or a particular type of volcanic activity. The set could be the global set of eruptions, an ideal but lofty goal, or some specific subset, such as “eruptions at long-dormant volcanoes in Alaska.” However, our approach leaves several outstanding questions unanswered regarding the extent of the utility of our work. For instance, what utility might the β-statistic have when applied to more frequently erupting volcanoes such as Veniaminof? We've shown that seismic rate anomalies are rare preceding such eruptions in Alaska (Figure 6, Table 1), but we have not investigated why they occur in some cases (e.g., Veniaminof 2005; Shishaldin, 1999) and not others (e.g., all other Veniaminof eruptions). There might still be some correlation between VT swarms and certain types of eruptive activity that we could decipher if we had a larger statistical population to analyze, or if we incorporate other factors beyond event rate. We have not investigated correlations between seismicity rate and other variables, such as magma composition, run up times, or energy release (e.g., Thelen et al., 2010; Passarelli and Brodsky, 2012). These and other important correlations may also exist, and future work is aimed at finding them by analyzing seismic and other volcanic data beyond Alaska (Ogburn et al., 2016; Pesicek et al., 2017).
Summary and Conclusions
There are many documented cases of seismic rate increases preceding eruptions and intrusions worldwide. However, there are also many eruptions where no such precursors were identified, even when sufficient monitoring existed. In this study, we used the β-statistic (Matthews and Reasenberg, 1988), and determined an objective β threshold to quantify the prevalence of seismic rate anomalies preceding eruptions in Alaska and investigate their reliability as a forecasting tool. We find that 6 out of 20 eruptions in Alaska show precursory rate increases, including all 3 eruptions at volcanoes that have been dormant for at least 15 years, and that erupted with a VEI of 3 or greater (Figure 3). Thus, we confirm that seismic rate increases may be expected preceding eruptions at similar closed-system volcanoes in the future. Perhaps more importantly, although 3 other precursory anomalies were identified at volcanoes with shorter repose times (Veniaminof, Shishaldin, Okmok; Figure 3, Table 1), many other similar eruptions lack them, despite the fact that we are using a relatively sensitive test to identify rate increases (Figure 6). From this, we infer that seismic rate increases preceding eruptions at frequently active open-system volcanoes are relatively uncommon. Furthermore, we show that at the closed-system volcanoes with longer repose times, pre-eruptive seismic anomalies are usually the most significant anomalies identified. At open-system volcanoes, however, there are often higher numbers of non-eruptive anomalies, and this method has lower predictive power for these systems. Many other non-eruptive anomalies can be attributed to unrest at nearby volcanoes, non-eruptive volcanic activity, and cases of shallow intrusion of magma without eruption. At the limited number of volcanoes that we analyze, we find that 31% of seismic anomalies identified using this method lead to eruption, while 69% do not, in broad agreement with some other studies that quantify rates of unrest at volcanoes. Finally, we presented a statistical tool that may be useful for future eruption forecasting purposes, particularly when evolving seismic networks lead to temporally variable earthquake detection capabilities. The β-statistic properly considers the long-term background rate when analyzing periods of seismicity and provides a way to quickly and more easily assess apparent rate changes in the context of previous activity. We expect that with more calibration from a wider dataset this tool could prove useful for future eruption forecasting at volcanoes worldwide.
Data Availability Statement
Earthquake data used in this study are from the ANSS Composite Catalog: http://www.quake.geo.berkeley.edu/anss/catalog-search.html. Eruption chronologies are compiled from public sources as described in the manuscript and can be obtained by request from the authors. Seismic waveform data are available at IRIS: http://www.iris.edu.
Author Contributions
SP, JP, and JW designed the analysis, JP and JW performed the analysis, and SO compiled the eruption chronologies. All authors contributed to the writing, interpretations and discussion of the results.
Funding
Funding was provided by the U.S. Agency for International Development Office of U.S. Foreign Disaster Assistance, under VDAP's Eruption Forecasting Information System (EFIS) database project.
Conflict of Interest Statement
The authors declare that the research was conducted in the absence of any commercial or financial relationships that could be construed as a potential conflict of interest.
Acknowledgments
We thank C. Cameron for help defining AVO eruption dates and R. White and W. McCausland for discussions and feedback, and H. Buurman for sharing the results of her analysis of network health for the AVO seismic monitoring networks. We also thank Aaron Wech and two other reviewers for critical reviews that strengthened the manuscript. Data used in this study were collected by the Alaska Volcano Observatory, a cooperation between the USGS, The University of Alaska, Fairbanks, and the Alaska Division of Geological and Geophysical Surveys. Any use of trade, firm, or product names is for descriptive purposes only and does not imply endorsement by the U.S. Government.
References
Aiken, C., and Peng, Z. (2014). Dynamic triggering of microearthquakes in three geothermal/volcanic regions of California. J. Geophys. Res. Solid Earth 119:2014JB011218. doi: 10.1002/2014JB011218
Aron, A., and Hardebeck, J. L. (2009). Seismicity rate changes along the central California coast due to stress changes from the 2003 M 6.5 San Simeon and 2004 M 6.0 Parkfield Earthquakes. Bull. Seismol. Soc. Am. 99, 2280–2292. doi: 10.1785/0120080239
Benoit, J. P., and McNutt, S. R. (1996). Global Volcanic Earthquake Swarm Database 1979-1989, Open-File Report, 96-99, Geological Survey, U. S., 333p.
Biggs, J., Ebmeier, S. K., Aspinall, W. P., Lu, Z., Pritchard, M. E., Sparks, R. S. J., et al. (2014). Global link between deformation and volcanic eruption quantified by satellite imagery. Nat. Commun. 5:4471. doi: 10.1038/ncomms4471
Boué, A., Lesage, P., Cortés, G., Valette, B., and Reyes-Dávila, G. (2015). Real-time eruption forecasting using the material Failure Forecast Method with a Bayesian approach. J. Geophys. Res. Solid Earth 120:2014JB011637. doi: 10.1002/2014JB011637
Boué, A., Lesage, P., Cortés, G., Valette, B., Reyes-Dávila, G., Arámbula-Mendoza, R., et al. (2016). Performance of the “material Failure Forecast Method” in real-time situations: a Bayesian approach applied on effusive and explosive eruptions. J. Volcanol. Geoth. Res. 327, 622–633. doi: 10.1016/j.jvolgeores.2016.10.002
Buurman, H., West, M. E., and Thompson, G. (2013). The seismicity of the 2009 Redoubt eruption. J. Volcanol. Geoth. Res. 259, 16–30. doi: 10.1016/j.jvolgeores.2012.04.024
Buurman, H., Nye, C. J., West, M. E., and Cameron, C. (2014). Regional controls on volcano seismicity along the Aleutian arc, Geochem. Geophys. Geosyst. 15, 1147–1163. doi: 10.1002/2013GC005101
Cameron, C., and AVO staff (2014). Geologic Database of Information on Volcanoes in Alaska (GeoDIVA). Fairbanks, AK: Alaska Volcano Observatory.
Cameron, C., Prejean, S., Coombs, M., Wallace, K., Power, J., and Roman, D. (2018). Alaska Volcano Observatory Alert and Forecasting Timeliness: 1989–2018. Front. Earth Sci. 6:86. doi: 10.3389/feart.2018.00086
Chardot, L., Jolly, A. D., Kennedy, M. B., Fournier, N., and Sherburn, S. (2015). Using volcanic tremor for eruption forecasting at White Island volcano (Whakaari), New Zealand. J. Volcanol. Geoth. Res, 302, 11–23. doi: 10.1016/j.jvolgeores.2015.06.001
Chastin, S. F. M., and Main, I. G. (2003). Statistical analysis of daily seismic event rate as a precursor to volcanic eruptions. Geophys. Res. Lett. 30:1671. doi: 10.1029/2003GL016900
Chouet, B. A., Page, R. A., Stephens, C. D., Lahr, J. C., and Power, J. A. (1994). Precursory swarms of long-period events at Redoubt Volcano (1989–1990), Alaska: Their origin and use as a forecasting tool. J. Volcanol. Geoth. Res. 62, 95–135. doi: 10.1016/0377-0273(94)90030-2
Cornelius, R. R., and Voight, B. (1994). Seismological aspects of the 1989–1990 eruption at Redoubt Volcano, Alaska: the Materials Failure Forecast Method (FFM) with RSAM and SSAM seismic data. J. Volcanol. Geoth. Res. 62, 469–498. doi: 10.1016/0377-0273(94)90048-5
de Moor, J. M., Aiuppa, A., Pacheco, J., Avard, G., Kern, C., Liuzzo, M., et al. (2016). Short-period volcanic gas precursors to phreatic eruptions; insights from Poas Volcano, Costa Rica. Earth Planet. Sci. Lett. 442, 218–227. doi: 10.1016/j.epsl.2016.02.056
Dixon, J. P., Stihler, S. D., Power, J. A., Haney, M., Parker, T, Searcy, C. K., et al. (2013). Catalog of earthquake hypocenters at Alaskan volcanoes: January 1 through December 31, 2012: U.S. Geol. Survey Data Series 789:84. Available online at: https://pubs.usgs.gov/ds/789/
Farrell, J., Husen, S., and Smith, R. B. (2009). Earthquake swarm and b-value characterization of the Yellowstone volcano-tectonic system. J. Volcanol. Geoth. Res. 188, 260–276. doi: 10.1016/j.jvolgeores.2009.08.008
Fisher, M. A., Ruppert, N. A., White, R. A., Sliter, R. W., and Wong, F. L. (2010). “Distal volcano-tectonic seismicity near Augustine Volcano,” in The 2006 Eruption of Augustine Volcano, eds J. A. Power, M. L. Coombs, and J. T. Freymueller (Alaska US Geological Survey Professional Paper 1769), 119–128.
Garza-Giron, R., Brodsky Emily, E., and Prejean Stephanie, G. (2018). Mainshock-Aftershock clustering in volcanic regions. Geophys. Res. Lett. 45, 1370–1378. doi: 10.1002/2017GL075738
Gomberg, J., Reasenberg, P. A., Bodin, P., and Harris, R. A. (2001). Earthquake triggering by seismic waves following the Landers and Hector Mine earthquakes. Nature 411, 462–466. doi: 10.1038/35078053
Gudmundsson, A. (2006). How local stresses control magma-chamber ruptures, dyke injections, and eruptions in composite volcanoes. Earth Sci. Rev. 79, 1–31. doi: 10.1016/j.earscirev.2006.06.006
Herrick, J. A., Neal, C. A., Cameron, C. E., Dixon, J. P., and McGimsey, R. G. (2014). 2012 Volcanic Activity in Alaska: Summary of Events and Response of the Alaska Volcano Observatory. U.S. Geological Survey Open-File Report 2014-5160.
Holtkamp, S. G., and Brudzinski, M. R. (2011). Earthquake swarms in circum-Pacific subduction zones. Earth Planet Sci. Lett. 305, 215–225. doi: 10.1016/j.epsl.2011.03.004
Kilburn, C. R. J. (2003). Multiscale fracturing as a key to forecasting volcanic eruptions. J. Volcanol. Geoth. Res. 125, 271–289. doi: 10.1016/S0377-0273(03)00117-3
Klein, F. W. (1982). Patterns of historical eruptions at Hawaiian volcanoes. J. Volcanol. Geoth. Res. 12, 1–35. doi: 10.1016/0377-0273(82)90002-6
Larsen, J., Neal, C., Webley, P., Freymueller, J., Haney, M., McNutt, S., Wessels, R. (2009). Eruption of Alaska Volcano Breaks Historic Pattern. Eos. Trans. Am. Geophys. Union 90:173. doi: 10.1029/2009EO200001
Matthews, M. V., and Reasenberg, P. A. (1988). Statistical methods for investigating quiescence and other temporal seismicity patterns. PAGEOPH 126, 357–372. doi: 10.1007/BF00879003
McGimsey, R. G., Neal, C. A., and Girina, O. (2004a). 1998 Volcanic Activity in Alaska and Kamchatka: Summary of Events and Response of the Alaska Volcano Observatory. U.S. Geological Survey Open-File Report 2003–423.
McGimsey, R. G., Neal, C. A., and Girina, O. (2004b). 1999 Volcanic Activity in Alaska and Kamchatka: Summary of Events and Response of the Alaska Volcano Observatory. U.S. Geological Survey Open-File Report 2004-1033.
McGimsey, R. G., Neal, C. A., Girina, O. A., Chibisova, M., and Rybin, A. (2014). 2009 Volcanic Activity in Alaska, Kamchatka, and the Kurile Islands: Summary of Events and Response of the Alaska Volcano Observatory. U.S. Geological Survey Open-File Report 2013–5213.
McNutt, S. R. (1996). “Seismic monitoring and eruption forecasting of volcanoes: a review of the state-of-the-art and case histories,” in Monitoring and Mitigation of Volcano Hazards, eds R. Scarpa and R. I. Tilling (Berlin; Heidelberg: Springer), 99–146.
McNutt, S. R. (2005). Volcanic seismology. Annu. Rev. Earth Planet. Sci. 33, 461–491. doi: 10.1146/annurev.earth.33.092203.122459
Minakami, T. (1961). Fundamental research for predicting volcanic eruptions (part 1) : earthquakes and crustal deformations originating from volcanic activities. Bull. Earthquake Res. Inst. 38, 497–544.
Moran, S., Stihler, S., and Power, J. (2002). A tectonic earthquake sequence preceding the April–May 1999 eruption of Shishaldin Volcano, Alaska. Bull Volcanol. 64, 520–524. doi: 10.1007/s00445-002-0226-1
Moran, S. C., Newhall, C., and Roman, D. C. (2011). Failed magmatic eruptions: late-stage cessation of magma ascent. Bull. Volcanol. 73, 115–122. doi: 10.1007/s00445-010-0444-x
Mori, J., White, R. A., Harlow, D. H., Okubo, P., Power, J. A., and Bautista, B. C. (1996). “Volcanic earthquakes following the 1991 climactic eruption of Mount Pinatubo: strong seismicity during a waning eruption,” in Fire and Mud: Eruptions and Lahars of Mount Pinatubo, Philippines, editors C. G., Newhall and R. S. Punongbayan (Seattle, WA: University of Washington Press), 339–350.
Murray, T. L., and Endo, E.T. (1992). “A real-time seismic-amplitude measurement system (RSAM),” in Monitoring Volcanoes: Techniques and Strategies Used by the Staff of the Cascades Volcano Observatory, 1980–1990, eds J. Ewert and D. Swanson (USGS Bulletin 1966), 5–10.
Neal, C. A., McGimsey, R. G., and Girina, O. (2005). 2002 Volcanic Activity in Alaska and Kamchatka: Summary of Events and Response of the Alaska Volcano Observatory. U.S. Geological Survey Open-File Report 2004–1058.
Newhall, C. G., and Self, S. (1982). The volcanic explosivity index (VEI) an estimate of explosive magnitude for historical volcanism. J. Geophys. Res. 87, 1231–1238. doi: 10.1029/JC087iC02p01231
Newhall, C. G., and Dzurisin, D. (1988). Historical Unrest at Large Calderas of the World. U.S. Geological Survey Bulletin 1855:1108.
Newhall, C., and Hoblitt, R. (2002). Constructing event trees for volcanic crises. Bull. Volcanol. 64, 3–20. doi: 10.1007/s004450100173
Nye, C., Keith, T., Eichelberger, J., Miller, T., McNutt, S., Moran, S., et al. (2002). The 1999 eruption of Shishaldin Volcano, Alaska: monitoring a distant eruption. Bull Volcanol. 64, 507–519. doi: 10.1007/s00445-002-0225-2
Ogburn, S., Harpel, C., Pesicek, J., and Wellik, J. (2016). “The eruption forecasting information system: volcanic eruption forecasting using databases,” in Abstract NH53B-2002 presented at the 2016 Fall Meeting, AGU (San Francisco, CA).
Passarelli, L., and Brodsky, E. E (2012). The correlation between run-up and repose times of volcanic eruptions. Geophys. J. Int. 188, 1025–1045. doi: 10.1111/j.1365-246X.2011.05298.x
Pesicek, J. D., Thurber, C. H., DeShon, H. R., Prejean, S.G, and Zhang, H. (2008). Three-Dimensional P-Wave Velocity Structure and Precise Earthquake Relocation at Great Sitkin Volcano, Alaska. Bull. Seismol. Soc. Am. 98, 2428–2448. doi: 10.1785/0120070213
Pesicek, J. D., Ogburn, S. E., and Wellik, J. J. (2017). “Searching for correlations between seismicity and volcanic eruptions for improved eruption forecasting,” in Abstract Presented at 2017 Annual Meeting of the Seismological Society of America (Denver, CO).
Phillipson, G., Sobradelo, R., and Gottsmann, J. (2013). Global volcanic unrest in the 21st century: an analysis of the first decade. J. Volcanol. Geother. Res. 264, 183–196. doi: 10.1016/j.jvolgeores.2013.08.004
Power, J., Jolly, A., Page, R., and McNutt, S. (1995). Seismicity and Forecasting of the 1992 Eruptions of Crater Peak Vent. Mt. Spurr, AK: An Overview, U.S. Geological Survey Bulletin, 149–159.
Power, J. A., Lahr, J. C., Page, R. A., Chouet, B. A., Stephens, C. D., and Davies, J. N. (1994). Seismic evolution of the 1989–1990 eruption sequence of Redoubt Volcano, Alaska. J. Volcanol. Geoth. Res. 62, 69–94. doi: 10.1016/0377-0273(94)90029-9
Power, J. A., and Lalla, D. J. (2010). “Chapter 1: Seismic observations of Augustine Volcano, 1970-2007,” in The 2006 eruption of Augustine Volcano, Alaska: U.S. Geological Survey Professional Paper 1769, eds J. A. Power, M. L. Coombs, and J. T. Freymueller, 3–40.
Power, J. A., Stihler, S. D., Dixon, J. P., Moran, S. C., Caplan-Auerbach, J., Prejean, S. G., et al. (2004). “Renewed seismic unrest at Mount Spurr Volcano, Alaska in 2004: Evidence for a magmatic intrusion: Eos Trans., AGU, 85,” in Fall Meeting Supplement, Abstract Number S51A-0143 (San Francisco, CA).
Prejean, S.G., and Hill, D. P. (2018). The Influence of Tectonic Environment on Dynamic Earthquake Triggering: A Review and Case Study on Alaskan Volcanoes, Tectonophysics.
Reasenberg, P. A., and Matthews, M. V. (1988). Precursory seismic quiescence: a preliminary assessment of the hypothesis. Pure Appl. Geophys. 126, 373–406. doi: 10.1007/BF00879004
Rasmussen, D. J., Plank, T. A., Roman, D. C., Power, J. A., Bodnar, R. J., and Hauri, E. H. (2018). When does eruption run-up begin? Multidisciplinary insight from the 1999 eruption of Shishaldin volcano. Earth Planet. Sci. Lett. 486, 1–14. doi: 10.1016/j.epsl.2018.01.001
Roman, D. C., Power, J. A., Moran, S. C., Cashman, K. V., Doukas, M. P., Neal, C. A., et al. (2004). Evidence for dike emplacement beneath Iliamna Volcano, Alaska in 1996. J. Volcanol. Geoth. Res. 130, 265–284. doi: 10.1016/S0377-0273(03)00302-0
Ruppert, N. A., Kozyreva, N. P., and Hansen, R. A. (2012). Review of crustal seismicity in the Aleutian Arc and implications for arc deformation. Tectonophysics 522–523, 150–157. doi: 10.1016/j.tecto.2011.11.024
Salvage, R. O., and Neuberg, J. W. (2016). Using a cross correlation technique to refine the accuracy of the Failure Forecast Method: application to Soufrière Hills volcano, Montserrat. J. Volcanol. Geoth. Res. 324, 118–133. doi: 10.1016/j.jvolgeores.2016.05.011
Shelly, D. R., Taira, T., Prejean, S. G., Hill, D. P., and Dreger, D. S. (2015). Fluid-faulting interactions: Fracture-mesh and fault-valve behavior in the February 2014 Mammoth Mountain, California, earthquake swarm. Geophys. Res. Lett. 42:2015GL064325. doi: 10.1002/2015GL064325
Shimozuru, D. (1971). “A seismological approach to the prediction of volcanic eruptions,” in The Surveillance and Prediction of Volcanic Activity (Paris: UNESCO Earth Sci Monograph), 19–45.
Siebert, L., Simkin, T., and Kimberly, P. (2011). Volcanoes of the World, 3rd Edn. University of California Press.
Thelen, W. A., Malone, S. D., and West, M. E. (2010). Repose time and cumulative moment magnitude: a new tool for forecasting eruptions? Geophys. Res. Lett. 37:L18301. doi: 10.1029/2010GL044194
van Eaton, A. R., Amigo, Á., Bertin, D., Mastin, L. G., Giacosa, R. E., González, J., et al. (2016). Volcanic lightning and plume behavior reveal evolving hazards during the April 2015 eruption of Calbuco volcano, Chile. Geophys. Res. Lett. 43:2016GL068076. doi: 10.1002/2016GL068076
Vidale, J. E., Boyle, K. L., and Shearer, P. M. (2006). Crustal earthquake bursts in California and Japan: their patterns and relation to volcanoes. Geophys. Res. Lett. 33:L20313. doi: 10.1029/2006GL027723
Waythomas, C. F., Haney, M. M., Fee, D., Schneider, D. J., and Wech, A. (2014). The 2013 eruption of Pavlof Volcano, Alaska: a spatter eruption at an ice- and snow-clad volcano. Bull. Volcanol 76:862. doi: 10.1007/s00445-014-0862-2
White, R., and McCausland, W. (2016). Volcano-tectonic earthquakes: a new tool for estimating intrusive volumes and forecasting eruptions. J. Volcanol. Geoth. Res. 309, 139–155. doi: 10.1016/j.jvolgeores.2015.10.020
Winson, A., Costa, F., Newhall, C., and Woo, G. (2014). An analysis of the issuance of volcanic alert during volcanic crises. J. Appl. Volcanol. 3:12. doi: 10.1186/s13617-014-0014-6
Keywords: volcano-tectonic, earthquake swarm, Alaska, eruption forecasting, seismicity, eruption, volcano monitoring
Citation: Pesicek JD, Wellik JJ II, Prejean SG and Ogburn SE (2018) Prevalence of Seismic Rate Anomalies Preceding Volcanic Eruptions in Alaska. Front. Earth Sci. 6:100. doi: 10.3389/feart.2018.00100
Received: 05 March 2018; Accepted: 02 July 2018;
Published: 20 July 2018.
Edited by:
Nicolas Fournier, GNS Science, New ZealandReviewed by:
Lauriane Chardot, Earth Observatory of Singapore, SingaporeLaura Sandri, Istituto Nazionale di Geofisica e Vulcanologia (INGV), Italy
Valerio Acocella, Università degli Studi Roma Tre, Italy
Copyright © 2018 Pesicek, Wellik, Prejean and Ogburn. This is an open-access article distributed under the terms of the Creative Commons Attribution License (CC BY). The use, distribution or reproduction in other forums is permitted, provided the original author(s) and the copyright owner(s) are credited and that the original publication in this journal is cited, in accordance with accepted academic practice. No use, distribution or reproduction is permitted which does not comply with these terms.
*Correspondence: Jeremy D. Pesicek, anBlc2ljZWtAdXNncy5nb3Y=