 Alexandre M. Ramos
 Maria J. Martins
 Ricardo M. Trigo
- Instituto Dom Luiz (IDL), Faculdade de Ciências, Universidade de Lisboa, Lisbon, Portugal
This study identifies and characterizes the importance of the Atmospheric Rivers in the extreme precipitation episodes that strike the Iberian Peninsula and Portugal during the extended summer months (April to September) between 1950 and 2007. The extreme precipitation days are ranked taking into account a daily gridded precipitation database for the Iberian Peninsula at a 0.2° resolution. The ranking is based on the magnitude of the extreme precipitation days considering not only on the area affected above the 95th climatological percentile but also by the precipitation intensity within the anomalous area. The Atmospheric Rivers detection scheme is used for the North Atlantic Ocean basin that allows the identification of the persistent Atmospheric Rivers that impact the Iberian Peninsula for the extended summer months. It is shown, that there is a relationship between the Atmospheric Rivers and the extreme precipitation days in Portugal especially during the transition months of April, May and September. On the contrary when analysing the entire Iberia Peninsula the impact of ARs is considerably reduced. Moreover, the impacts of the Atmospheric Rivers is considerably higher for the top ranked events in Portugal but decreases when considering less intense extreme precipitation days.
Introduction
The singular location of the Iberian Peninsula (IP), along with its geographic nature make it as one of the most interesting regions for analysing the precipitation variability (Lionello, 2012). The IP is located between the sub-tropical belt and the mid-latitude in western area of Mediterranean basin and confined between the Atlantic Ocean and the Mediterranean Sea. Moreover, the vast majority of the IP area is enclosed by mountain chains contributing to its challenging precipitation (Ramos et al., 2014b) and temperature (Peña-Angulo et al., 2016) variability.
In addition, the IP precipitation presents a strong seasonal cycle with a significant concentration from October to May, particularly over western Iberian and mountain ranges under the influence of the storm track and associated frontal systems (Trigo et al., 2008). However, the summer precipitation is mostly due to local factors and meso-scale convective systems that can also be responsible for high rainfall rates in the eastern half of the Iberian Peninsula especially in summer months (Serrano et al., 1999; García-Herrera et al., 2005; Paredes et al., 2006).
Extreme precipitation events represent one of the major natural threats being often responsible for large socioeconomic impacts in the IP (e.g., Zêzere et al., 2014; Pereira et al., 2016; Trigo et al., 2016). Concerning the extended winter months from October to March, the passage of extra-tropical cyclones (Trigo et al., 2008) combined with the phenomena of presence of Atmospheric Rivers (ARs) are frequently associated with extreme precipitation events that occurred in the IP, particularly for the western and central Iberia, including Ramos et al. (2015). However, precipitation extremes have been less explored during the extended summer months (from April to September) because it is widely regarded as the driest months in most regions of the IP (de Luis et al., 2010).
Atmospheric Rivers (ARs), according to new definition of the Glossary of Meteorology of the American Meteorological Society, correspond to a long, narrow and transient corridor of strong horizontal water vapor transport that is typically associated with a low-level jet stream ahead of the cold front of an extratropical cyclone (Newell et al., 1992; Ralph et al., 2006; Dettinger et al., 2015). ARs frequently lead to heavy precipitation and floods over different continental regions like California (e.g., Neiman et al., 2008; Dettinger et al., 2011); western Europe (e.g., Lavers and Villarini, 2013; Ramos et al., 2015), or even in South Africa (e.g., Blamey et al., 2018).
Focusing on the IP, Ramos et al. (2015) analyzed the extreme precipitation events for the extended winter season from 1950 till 2008 and their relationship with the occurrence of ARs using different reanalysis. In Ramos et al. (2015) the extreme precipitation events were computed using the precipitation intensity as well as the area affected. It was shown that the association between ARs and extreme precipitation days is noteworthy, not only for Portugal, but also in what refers the main western rivers basins like the Minho, Tagus, and Duero. Regarding the eastern and southern river Iberian basins (Guadalquivir, Guadiana, Ebro) the impact of ARs is reduced. In addition, Eiras-Barca et al., 2016 analyzed the impacts of ARs on extreme precipitation (given by the 95th percentile of the distribution) over Galician and Portugal. It was shown that the ARs are strongly linked to high precipitation episodes between October to May, and a weak relationship between July and September. However, a similar analysis performed for the UK (Champion et al., 2015) shows that only 20% of the summer extreme precipitation events are associated to an AR, whereas in winter this value increases up to 50% for extreme rainfall (Lavers and Villarini, 2015).
In this context, this work has the following main objectives: (1) to apply the same methodology of Ramos et al. (2015) to rank the most extreme precipitation events for the IP for the summer extended months (April to September); (2) to access whether the ARs also make landfall in the IP during the extended summer and (3) to analyse the impacts of ARs on extreme precipitation events.
Datasets and Methods
Precipitation Dataset
The precipitation dataset used corresponds to a daily gridded precipitation dataset with a resolution of 0.2° latitude–longitude grid for the IP (IB02) and spanning between January 1950 and March 2008. The gridded precipitation corresponds to the merge of two different precipitation datasets, that used the same methodology, namely the PT02 for Portugal (Belo-Pereira et al., 2011) and the SPAIN02 for Spain (Herrera et al., 2012).
In addition, the IB02 was used extensively in several of previous studies where extreme precipitation events for the IP in the extended winter months were analyzed: (a) in Ramos et al. (2014a) the assessment of daily anomalous precipitation and respective ranking classification of these days was undertaken for the whole IP and (b) in Ramos et al. (2017) that extended the ranking procedure to extreme precipitation considering different time scales (3 to 10 days) over the IP. Therefore the use of the IB02 is appropriate for studying the daily anomalous extreme precipitation events for the extended summer months.
Ranking Extreme Precipitation
Analysing extreme events is not a straightforward task. Ramos et al. (2014a) used normalized precipitation departures from the seasonal climatology with the study being focused on the extended winter months. The authors highlighted that the normalized precipitation anomalies did not ensure for each grid point a standard Gaussian distribution, although the 2 standard deviation (std) used as threshold by Ramos et al. (2014a) is similar to the 95th percentile.
In the case of the extended summer months, preliminary results (not shown) revealed that the highly skewed precipitation distribution does not guarantee a characteristic Gaussian distribution and, therefore, we choose to use the more robust 95th percentile as a threshold for the computation of the anomalous days. The 95th percentile threshold is computed as shown below for each grid point and for each Julian day in order to guarantee a fair comparison between all grid points.
Therefore the ranking of extreme precipitation is computed in a two way procedure. Firstly we have computed the extreme precipitation anomaly from the daily 95th percentile climatological distribution, where a measure of the event rarity, for each day and each grid point, is given by;
where:
(a) N95d,i,j is the extreme anomalous precipitation in day d, at the grid point (i,j) of the IB02 database;
(b) precipitationd,i,j is the daily accumulated precipitation a particular day d and grid point (i,j);
(c) the prec_95th percentilet,i,j is the Julian daily 95th percentile of the precipitation for that grid point (i,j). The highly variable prec_95th percentile daily climatological time series was smooth using a7-day running mean. This procedure is more robust than using the simple monthly climatology, as it avoids artifacts at the monthly edges. The prec_95th percentile was computed considering the entire reference period of data between 1950 and 2007 but restricted to those days with meaningful precipitation, i.e., when daily precipitation registers at least 1 mm (wet days).
Secondly, for each day and for each grid point (i,j) an anomaly departure from 95th percentile threshold is obtained. Since we are only interested in areas where the precipitation is above the 95th percentile, the magnitude of an event (hereafter R) is obtained daily after multiplying:
(a) the area (hereafter A, in percentage) that has precipitation anomalies (N95) greater than zero and (b) the mean value of these anomalies (hereafter M) for all the grid points that are characterized by precipitation anomalies greater than zero. This last step is quite similar to the one implemented by the authors previously (Ramos et al., 2014a) with the difference of using the 95th percentile threshold instead of the 2std threshold.
We have applied the methodology not only for continental IP but also restricting it to Portugal obtaining two different rankings of anomalous precipitation.
Reanalysis Dataset
In order to compute the ARs we have used two different reanalyses datasets that were already used with success in Ramos et al. (2015). The first one is the he NCEP/NCAR reanalysis (Kalnay et al., 1996) was used for the 1948–2012 period, in order to maximize the overlapping period with the available precipitation dataset. However this reanalysis suffers from two important caveats; (a) before 1979 there is no availability of the satellite data and (b) the relatively coarse resolution of 2.5° latitude–longitude grid. As mentioned in Ramos et al. (2015) for the winter season, no significant differences are found in the results in the maximum vertically integrated horizontal water vapor transport (IVT) distribution when comparing the 1948–1979 period and the 1979 onwards. Regarding the ARs frequency itself it seems that there is an increase of variability after 1979. This information will be considered when analysing the ARs frequency in section Ranking of Extreme Precipitation in Summer. The second reanalysis corresponds to higher resolution (0.75° latitude–longitude grid) the ERA-Interim dataset (developed by ECMWF), for the 1979–2012 period (Dee et al., 2001).
We have retrieved the same variables from both reanalyses including the specific humidity q and zonal u and meridional y winds at 1000, 925, 850, 700, 600, 500, 400, and 300 hPa, all at a 6 hourly resolution.
Atmospheric Rivers Detection Scheme
The same ARs detection scheme used by Ramos et al. (2015) is applied here for the extended summer months (April to September) to analyse the ones that impacted the IP. The methodology applied uses the IVT as the key classification variable. The IVT is computed from 300 and 1,000 hPa using the following expression:
where u and v are the layer-averaged zonal and meridional winds in m/s respectively, q is the layer-averaged specific humidity in kg/kg, dp is the pressure difference between two adjacent pressure levels and g is the acceleration due to gravity.
The ARs that will have impact in the Iberian Peninsula where identified in the reference 10°W meridian between 35°N and 45°N. Taking into account the (Ramos et al., 2015) detection scheme, an IVT threshold was computed considering the maximum IVT, at 1200 UTC for each day in the reference meridian between 1979 and 2012 (common period for both reanalyzes). The threshold obtained for NCEP/NCAR is 346 kgm−1s−1 while for ERA-Interim the corresponding threshold is slightly higher, reaching 373 kgm−1s−1. Independently of the reanalysis used, the following detection scheme was applied for the IP:
(1) we compared the IVT values at the grid points of the reference meridian and store the maximum IVT value and its location. This procedure was performed every 6 h (i.e., 4 time steps per day) between 1979 and 2012 over the extended summer months,
(2) if the maximum IVT exceeded the IVT threshold, this grid point was flagged. Afterwards a west to east search is done in order to identify the maximum IVT at each longitude for the grid points where the local IVT threshold was exceeded. Since the ARs need to have a certain minimum length, we adopted the same length suggested by Ramos et al. (2015), which is 1,700 km. This requirement is verified every 6 h and, if it is fulfilled, we considered it as an AR time step. For the ERA-Interim it corresponds to 27 contiguous longitude points (27*0.75° = 20.25°~1,721 km), while for the NCEP/NCAR this corresponds to 8 contiguous longitude points (8*2.5° = 20°~1,700 km) above the threshold taking into account that, at 40°N the length of a degree of longitude is ~85 km.
It should be stressed that the methodology here described only allows the detection of potential ARs close to Iberia. We also have considered persistent AR events which must fulfill an additional temporal criteria (1) it must have at least two uninterrupted time steps, which is at least 12 h persistence; (2) to have independent events, two persistent ARs were considered distinct only if they were separated by more than 1 day. This is the main difference of the approach here to that employed in Ramos et al. (2015), which uses an 18 h persistence threshold due to the life-cycle of this phenomena being higher in the winter months where the storm track activity is much higher (Trigo, 2006).
Ranking of Extreme Precipitation in Summer
Following an adapted version of the methodology considered in Ramos et al. (2014a), that analyzed winter extreme precipitation days, the anomalous magnitude of a summer extreme precipitation event is represented by the area of grid points above the climatological 95th percentile and the mean anomaly of that area. In this way, the magnitude of an event is characterized simultaneously by the area affected as well as by its intensity.
This methodology was applied to the entire IP and also considering only the grid points over Portugal. The results for the #10 of the ranking of events are show for the IP in Table 1 and for Portugal in Table 2. The number of days in the ranking is dependent of the number of days with at least one grid point above the 95th percentile, in this way, the number of days relative to the IP (6078) is considerably higher than the corresponding days in Portugal (1896).
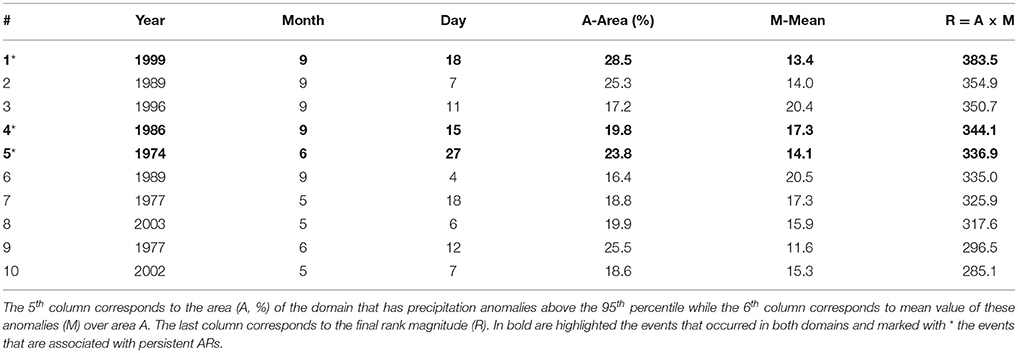
Table 1. The ten most anomalous precipitation events for the Iberian Peninsula.
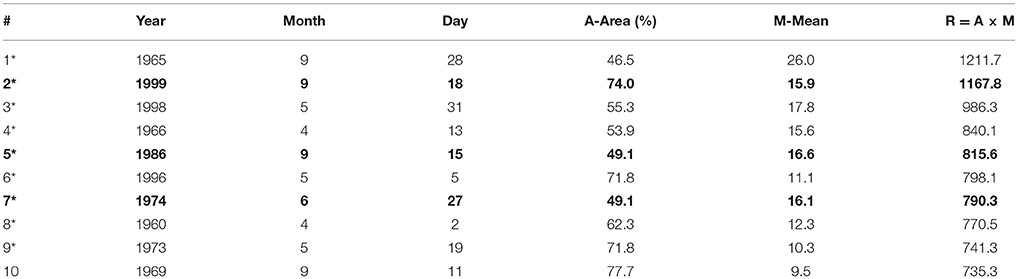
Table 2. The same as Table 1 but for the Portugal.
The extreme precipitation days that are coincident in the Top #10 of both domains are shown in bold and correspond to the days #1 (18 September 1999), #4 (15 September 1986), and #5 (27 June 1974) in the IP, that in the ranking of Portugal correspond to the precipitation events #2, #5, and #7, respectively. When analyzing both rankings a major difference is found in relation to the relative area affected by values of precipitation above the 95th climatological percentile. Thus, while the top #10 events range from an affected area of near 29% to a minimum of ~16% in the IP, the area affected over Portugal range from ~78% to a minimum of ~47%. In addition, a closer analysis of the areas for the coincident cases highlighted in bold suggests that those events affected at least half of Portugal.
A closer analysis to the top #3 the events for each ranking can help to clarify the differences obtained in the two domains. The most anomalous day of the ranking for the IP corresponds to the 18 September 1999 (#2 in the Portugal ranking) are shown in Figure 1A (Figure 2B). One can see, that anomalous precipitation occurred mainly over western IP (Portugal, and the Spanish provinces of Galicia and Extremadura) with the total area affected in Portugal corresponding to 75% while for the entire IP it corresponds to near ~30%. For the other major events in the Iberian Peninsula, 7 September 1989 (#2) and 11 September 1996 (#3), the anomalous precipitation is much more localized (with areas below 25%) especially in the Mediterranean coast with values of anomalous precipitation above 50 mm in some regions which corresponds to absolute values higher than 130 mm in on day (Figures 1B,C).
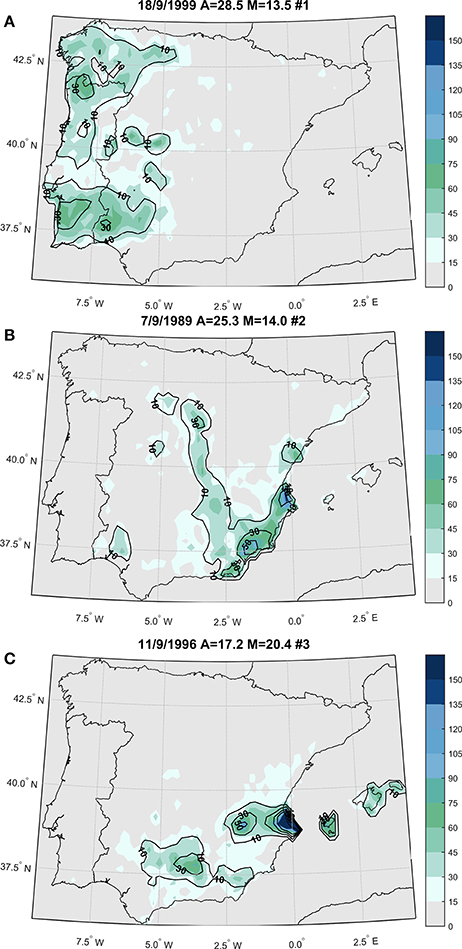
Figure 1. Daily precipitation (mm, shaded) and the corresponding anomalies over the 95th percentile threshold (black contour) of the top three anomalous events in the Iberian Peninsula domain. (A) 18 September 1999; (B) 7 September 1989: (C) 11 September 1996. The anomalies over the over the 95th percentile threshold were smoothed with the neighbor grid points.
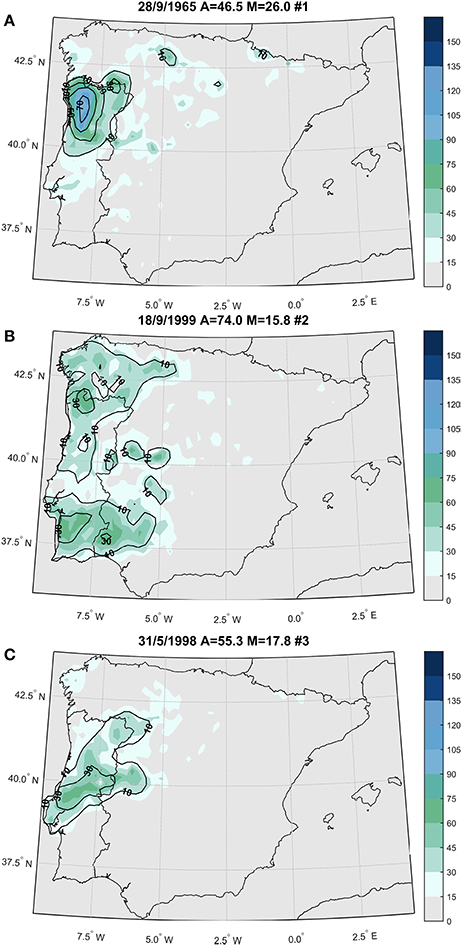
Figure 2. Daily precipitation (mm, shaded) and the corresponding anomalies over the 95th percentile threshold (black contour) of the top three anomalous events in Portugal domain. (A) 28 September 1965; (B) 18 September 1999; (C) 31 May 1998. The anomalies over the over the 95th percentile threshold were smoothed with the neighbor grid points.
Regarding Portugal, the maps of precipitation for the top #3 events are shown in Figure 2, with the day #2 being already analyzed before. On the 28 September 1965 (#1), anomalous precipitation occurred mainly in northern Portugal with anomalies up to 70 mm corresponding to an absolute maximum value of near 120 mm. In addition, for the 31 May 1998 (#3) the precipitation presents a SW-NW pattern in central Portugal with anomalous values of up to 40 mm.
The analyses of the precipitation maps of the top #3 events for both the IP and Portugal (Figures 1, 2) and the area affected for the top#10 events (Tables 1, 2), highlights the different spatial patterns of these summer extreme precipitation episodes occurring in both domains. Thus, while the extreme precipitation cases in the IP domain tends to be more localized in the Mediterranean coast, the extreme precipitation events in the Portugal domain affect a much larger (relative) area in Portugal.
The study of spatial variability of the Iberian Peninsula precipitation regime in extended summer months and its relationship with the variability of the atmospheric circulation patterns associated to precipitation, can provide appropriate background for results (Cortesi et al., 2013; Ramos et al., 2014b). This approach was carried out here considering the standard Circulation Weather Types classification developed for the IP by Trigo and DaCamara, 2000.It was shown that for the western coast of the IP the directional types from the west quadrant dominate the precipitation, even during the extended summer months and that the Northeasterly and Cyclonic types are particularly well associated with extreme precipitation in the Mediterranean region. In this context, days characterized by widespread intense precipitation over the continental IP are unusual during summer months Cortesi et al. (2014). In fact the impacts of distinct WTs are often restricted to relatively narrow areas and with a large intra seasonal spatial variability, suggesting that local processes play a major role in extreme precipitation, especially in the Mediterranean Region (Mosmann et al., 2004; García-Herrera et al., 2005).
Moreover, when we analyze the months of incidence of the extreme events in the top #10 of both rankings, the majority of the days occur in the transitions months such as April, May and September. In order to assess the monthly frequency of the extreme precipitation days throughout the extended summer season, we have divided the ranking into 10% bin, corresponding the first one to the 10% most extreme precipitation days, and the last one to the less extreme precipitation days (Figure 3).
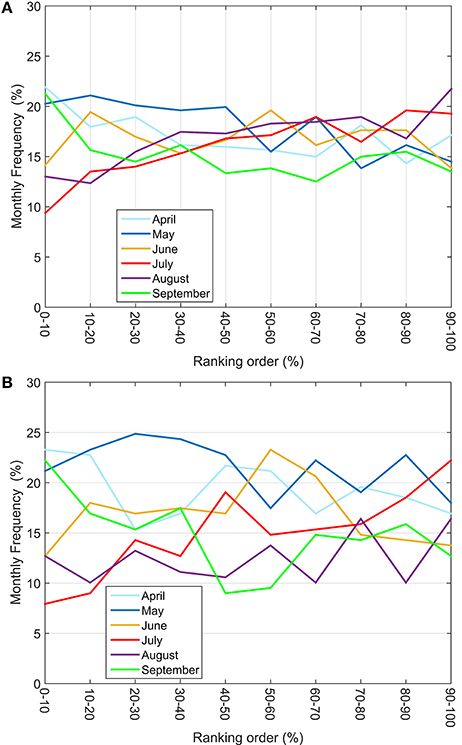
Figure 3. The monthly frequency (%) of days of the ranking divided into 10% bin intervals for (A) Iberian Peninsula and (B) Portugal. The first bin corresponds to the 10% most extreme precipitation days for the different domains while the last bin shown (90–100%) corresponds to the less extreme days of the ranking.
The 10% of the most extreme days tend to occur during the transition months, April, May and September (~65% of the days in both rankings), and lower precipitation for the usual hottest summer months, i.e., June, July, and August (JJA). As one looks into less extreme days, the percentage of extreme days decreases in the transition months and increase in the JJA months. These results can be explained taking into account the intra-annual precipitation variability in the Iberian Peninsula that presents marked seasonal contrasts (Cortesi et al., 2014). In the JJA summer months the IP is usually under the influence of the centers of high pressures and tropical air masses where there is a displacement of the storm track further to the North, causing the IP to be influenced by the Azores subtropical high pressure, bringing hot and humid masses from the Atlantic and dry masses of air from North Africa. In addition, due to the warming in the interior region of the IP there is often the generation of a thermal depression that can be associated to localize convective precipitation (Hoinka and de Castro, 2003). In the transition months (April, May, and September) the atmosphere is very unstable due to the presence of extra tropical cyclones and their associated frontal systems (Trigo, 2006) but also to the developing of cut-off lows (Nieto et al., 2007), causing the existence of precipitation. The Mediterranean will also have an influence on the precipitation in the IP in particular on the coast adjacent to the Mediterranean where positive anomalies of sea surface temperature often associated with the developing of Mesoscale Convective Systems (MCS) are known for producing extreme precipitation (García-Herrera et al., 2005).
Atmospheric Rivers Climatology for Extender Summer
Using the algorithm developed by Ramos et al. (2015) the ARs that make strike the IP (35°-45°N, 10°W) during the extended summer months were compiled. As explained in section Atmospheric Rivers Detection Scheme, we computed the IVT threshold for the extended summer months considering both reanalyzes (NCEP/NCAR-346 kgm−1s−1 vs. ERA-Interim-373 kgm−1s−1). These threshold values are roughly 25% smaller than those obtained for winter months (Ramos et al., 2015), a result that points toward a lower intensity of the ARs in summer than in winter. The frequency of ARs during the extended summer months is shown in Figure 4, considering only the persistent AR events (i.e., restricting the ARs to those that have at least two consecutive time steps as explaining in section Atmospheric Rivers Detection Scheme) for both datasets. In this regard we must stress that the persistent ARs considered in winter were those that had at least three uninterrupted time steps (Ramos et al., 2015). Nevertheless due the nature of the ARs, including their intensity and duration in summer months (see section Atmospheric Rivers Detection Scheme), we relaxed the criteria and considered a persistent AR all those that have, at least, two uninterrupted time steps. Thus, the number of persistent ARs is apparently higher in the summer (Figure 4) than in the winter (Ramos et al., 2015, their Figure 2A).
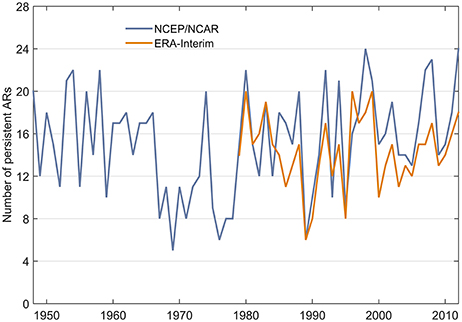
Figure 4. Inter-annual variability of the persistent Atmospheric Rivers during the extended summer months for the NCEP–NCAR (blue line) and ERA-Interim (orange line).
Focusing on the inter-annual variability of the persistent ARs in the summer months (Figure 4), it is shown that for the common period (1979–2012) there is a good agreement between the two reanalyzes, with a Person's correlation of R = 0.76 (statistically significant at 5% level), even though a higher number of ARs is found for the NCEP/NCAR reanalysis. This difference is not unexpected as a similar bias was also observed for the winter months (Ramos et al., 2015). Taking this into account the analyses, from this point forward, will be limited to the results obtained using the NCEP–NCAR reanalysis and for the entire period of analysis (1948–2012).
The intra-annual variability of the persistent ARs for the 1979–2012 period was also analyzed (Figure 5) where one can find a minimum in the frequency of the ARs in June. In addition, September is clearly the month with the highest frequency of ARs (~22%) while from April to June the ARs frequency is kept below 15%. Starting from July there is an increment in the ARs activity, although July and August are core summer months in Iberia, i.e., months where the absent of frontal precipitation is noted (Cortesi et al., 2014; Ramos et al., 2014b). This maximum value of ARs in September could be related with the increase in the storm track activity in September in the North Atlantic (Trigo, 2006) which will increase the IVT over the North Atlantic Ocean.
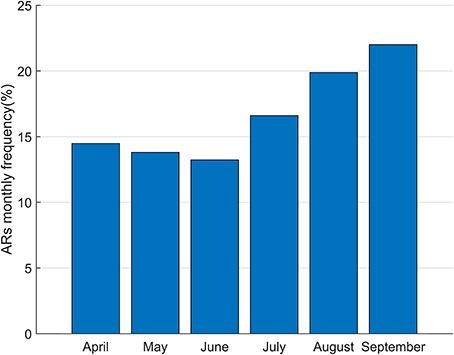
Figure 5. Intra-annual variability of Atmospheric Rivers (in %) making landfall in the Iberian Peninsula using NCEP–NCAR.
Relationship Between ARs and Extreme Precipitation in Summer
The association between the occurrence of extreme precipitation days (given by the days in the ranking) and the timing of ARs (identified between 1948 and 2012) is undertaken in this section. This assessment is restricted to the 1950–2007 period, as this 58-year long period is the longest one that is common to both datasets. As stressed before, an extreme day is considered if at least one grid point has precipitation anomalies above the 95th percentile. In addition, due to the fact that the accumulated precipitation is recorded every 24 h, starting at 07UTC (09 UTC) in Spain (Portugal), we have adjusted the time steps that are better coincident with the hours of the accumulated precipitation. Therefore time step for a particular day are considered between 06UTC at day to 00UTC at day+1.
Taking this into account, the total number of extreme precipitation days are shown in Table 3 corresponding to 6,078 days in the IP and 1,896 days in Portugal. The percentage of days of the raking with the presence of ARs is ~18% for the IP and approximately 26% for Portugal. Additionally, about 12% of the days of precipitation ranking in the IP are associated with persistent ARs (≥2 time steps), while for Portugal the value increases to ~19% of the days.
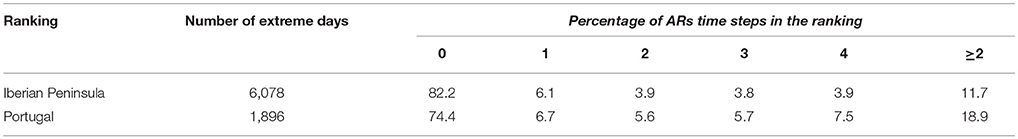
Table 3. The number of extreme precipitation days in the ranking for each domain and the percentage of days (%) in the ranking associated with the number of time steps of ARs per day.
Comparing the data of Table 3 for summer with the results attained in Ramos et al. (2015) for the IP in winter the percentage of extreme days that are not associated with ARs is slightly lower in winter (~75%) than in summer (82%). Regarding Portugal, the percentage of extreme days with no influence of ARs is in line with the results found for the IP being lower in winter (64%) and higher in summer (~74%).
In order to analyze the changing percentage of days associated with persistent ARs (≥2 ARs time steps) and for non ARs days we have divided the ranking into 10% bin intervals for both domains (from the most extreme precipitation days to the less extreme precipitation days), being the results summarized in Figure 6. Moreover as mentioned before the days of the ranking were divided into 10 equally spaced bins where each bin represents 10% intervals, being the first 10% the most extreme days of the ranking and the last 10% the less extreme days.
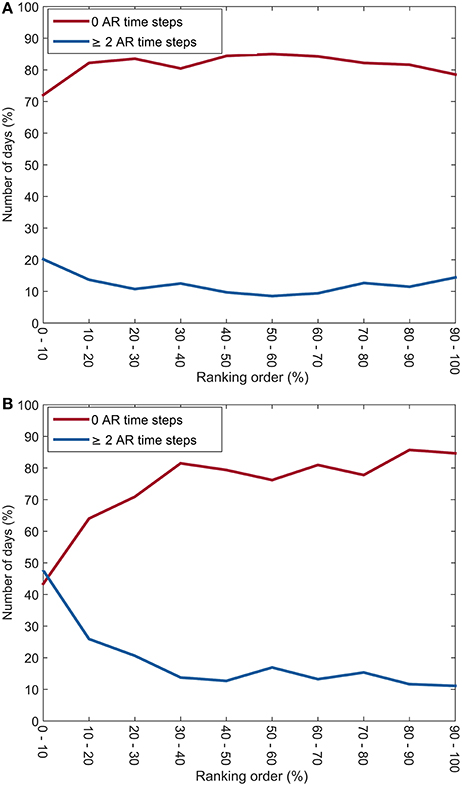
Figure 6. The percentage of days associated with persistent ARs in blue (≥2 ARs time steps) and for non ARs days in red for 10% bin intervals of the ranking for the (A) Iberian Peninsula and (B) Portugal. The first bin corresponds to the top 10% extreme precipitation days while the last bin shown (90–100%) present the less extreme days of the ranking.
The results found for the Iberian Peninsula domain (Figure 6A) reveal the dominance of days of extreme precipitation not associated with ARs, with the 10% of the most extreme precipitation days of the ranking, the percentage of non-occurrence of AR is on the order of 70%. For days associated with persistent ARs, the behavior is roughly constant (approximately 10%) throughout the entire ranking. However for the most extreme days of the ranking (first 10% bin) the persistent ARs play some moderate role being associated to near 20% of the days.
Results are substantially different for the Portugal domain (Figure 6B), where the occurrence of persistent ARs is near 50% for the top 10% of the most extreme days of precipitation. This significant role played by ARs deceases for the less extreme precipitation ranks. However, in the 20–30% bin of the ranking days, the importance of the ARs is still noteworthy in 20% of these days.
These results are differently from the ones obtained for the extended winter for the IP domain (Ramos et al., 2015). Thus, the presence of ARs is not so relevant for explaining the most extreme precipitation days for the IP, however, in winter their occurrence plays an important role. Regarding Portugal, a similar behavior is found during summer and winter, with the most extreme precipitation days showing a strong link with the occurrence of ARs and decreasing substantially as one progresses to less anomalous days.
Conclusions
In this study we present a methodology adapted from Ramos et al. (2015) in order to assess extreme precipitation in summer months, to classify each day in terms of the magnitude of the event and to rank them. In this work, the magnitude of the event is given by multiplying: (a) the area (percentage) that has extreme precipitation anomalies above zero (computed for each grid point using the 95th percentile of the climatological precipitation) and (b) the average of these anomalies for all the grid points that present precipitation anomalies greater than zero. This was applied to both the IP and to the Portuguese domains.
It was found that the occurrence of the most anomalous precipitation days (corresponding to the top positions of the ranking) is higher during the transition months (April, May, and September). Likewise, top positions for the less extreme days were found during June, July, and August for both domains. This dichotomy is mainly due to thermodynamic effects and to dynamical processes associated with the intra-annual variability of precipitation in the IP. In the transition months of April, May, and September the dynamical processes over the North Atlantic Ocean and the Mediterranean play an important role, with the months of April and May associated to the still active storm track (Trigo, 2006) and high frequency of Cut-off low systems (Nieto et al., 2007). September extreme events are fueled by very high values of SST in the Mediterranean, often associated with the developing of MSC (García-Herrera et al., 2005). Regarding the core summer months (June, July, and August) the thermodynamics process dominate due to the heterogeneous heating of the IP which is normally associated with the formation of a thermal low (Hoinka and de Castro, 2003) leading to localize convective precipitation.
The main results are as follow:
• Three extreme precipitation days are coincident between the two top #10 rankings derived for the IP and Portugal;
• Using the top #10 most extreme precipitation events in the Iberian Peninsula and Portugal, it should be noted that only 3 events are associated with ARs in the Iberian Peninsula, while for Portugal 9 out of 10 events are associated with ARs.
• In order to prove such evidence and considering the total number of days for both rankings, it was shown that the days of extreme precipitation associated with persistent ARs (at least 2 AR time steps) represent about 12% of days in the Iberian Peninsula while for Portugal this value increase up to 19%. One must bear in mind that the Iberian Peninsula also includes all the grid points representing Portugal, therefore some of the ranking events in the Iberian Peninsula, corresponds mainly to extreme precipitation in Portugal as the case of 18 September 1999 shown in Figure 1.
• In the first 10% of the most extreme days of precipitation, the impact of ARs is significant in Portugal, with nearly half of the days associated with persistent ARs. For the Iberian Peninsula, the influence of ARs on these extreme precipitation days of extreme precipitation is significantly lower ~ 20%.
In conclusion, results show the importance of the ARs in the most extreme days for the Portugal, while for the Iberian Peninsula it's importance is reduced. These results go beyond those obtained by Eiras-Barca et al., 2016 that found a strong link between ARs with episodes of precipitation above the 95th percentile between October and May but a weak relationship between July and September. However, we found that the ARs are important in explaining the extreme precipitation also in September at least for the top #10 events in Portugal.
Author Contributions
AR conceived and designed the experiments; AR, MM, and RT performed the experiments. MM, AR, and RMT analyzed the data and wrote the paper.
Funding
AR and RMT were supported by the project Improving Drought and Flood Early Warning, Forecasting and Mitigation using real-time hydroclimatic indicators (IMDROFLOOD) funded by Fundação para a Ciência e a Tecnologia, Portugal (FCT) (WaterJPI/0004/2014). AR was also supported by an FCT postdoctoral grant (FCT/DFRH/SFRH/BPD/84328/2012).
Conflict of Interest Statement
The authors declare that the research was conducted in the absence of any commercial or financial relationships that could be construed as a potential conflict of interest.
Acknowledgments
The NCEP/NCAR data were provided by NOAA/OAR/ESRL PSD (http://www.esrl.noaa.gov/psd/), and the ERA-Interim data were obtained from the Meteorological Archival and Retrieval System (MARS) at the ECMWF.
References
Belo-Pereira, M., Dutra, E., and Viterbo, P. (2011). Evaluation of global precipitation data sets over the Iberian Peninsula. J. Geophys. Res. Atmos. 116:D20101. doi: 10.1029/2010JD015481
Blamey, R. C., Ramos, A. M., Trigo, R. M., Tomé, R., and Reason, C. J. (2018). The influence of atmospheric rivers over the south atlantic on winter rainfall in South Africa. J. Hydrometeor. 19, 127–142. doi: 10.1175/JHM-D-17-0111.1
Champion, A. J., Allan, R. P., and Lavers, D. A. (2015). Atmospheric rivers do not explain UK summer extreme rainfall. J. Geophys. Res. Atmos. 120, 6731–6741. doi: 10.1002/2014JD022863
Cortesi, N., Gonzalez-Hidalgo, J. C., Trigo, R. M., and Ramos, A. M. (2014). Weather types and spatial variability of precipitation in the Iberian Peninsula. Int. J. Climatol. 34, 2661–2677. doi: 10.1002/joc.3866
Cortesi, N., Trigo, R. M., Gonzalez-Hidalgo, J. C., and Ramos, A. M. (2013). Modelling monthly precipitation with circulation weather types for a dense network of stations over Iberia. Hydrol. Earth Syst. Sci. 17, 665–678. doi: 10.5194/hess-17-665-2013
Dee, D. P., Uppala, S. M., Simmons, A. J., Berrisford, P., Poli, P., Kobayashi, S., et al. (2001). The ERA-Interim reanalysis: configuration and performance of the data assimilation system. Q. J. R. Meteorol. Soc. 137, 553–597. doi: 10.1002/qj.828
de Luis, M., Brunetti, M., Gonzalez-Hidalgo, J. C., Longares, L. A., and Martin-Vide, J. (2010). Changes in seasonal precipitation in the Iberian Peninsula during 1946-2005. Glob. Planet. Change 74, 27–33. doi: 10.1016/j.gloplacha.2010.06.006
Dettinger, M. D., Ralph, F. M., Das, T., Neiman, P. J., and Cayan, D. R. (2011). Atmospheric rivers, floods and the water resources of California. Water 3, 445–478. doi: 10.3390/w3020445
Dettinger, M., Ralph, F. M., and Lavers, D. (2015). Setting the stage for a global science of atmospheric rivers. Eos 96. doi: 10.1029/2015EO038675
Eiras-Barca, J., Brands, S., and Miguez-Macho, G. (2016). Seasonal variations in North Atlantic atmospheric river activity and associations with anomalous precipitation over the Iberian Atlantic Margin. J. Geophys. Res. Atmos. 121, 931–948. doi: 10.1002/2015JD023379
García-Herrera, R., Barriopedro, D., Hernández, E., Paredes, D., Correoso, J. F., and Prieto, L. (2005). The 2001 mesoscale convective systems over Iberia and the Balearic Islands. Meteorol. Atmos. Phys. 90, 225–243. doi: 10.1007/s00703-005-0114-2
Herrera, S., Gutiérrez, J. M., Ancell, R., Pons, M. R., Frías, M. D., and Fernández, J. (2012). Development and analysis of a 50-year high-resolution daily gridded precipitation dataset over Spain (Spain02). Int. J. Climatol. 32, 74–85. doi: 10.1002/joc.2256
Hoinka, K. P., and de Castro, M. D. (2003). The Iberian Peninsula thermal low. Q. J. R. Meteorol. Soc. 129, 1491–1511. doi: 10.1256/qj.01.189
Kalnay, E., Kanamitsu, M., Kistler, R., Collins, W., Deaven, D., Gandin, L., et al. (1996). The NCEP/NCAR 40-year reanalysis project. Bull. Amer. Meteor. Soc. 77, 437–471. doi: 10.1175/1520-0477(1996)077<0437:TNYRP>2.0.CO;2
Lavers, D. A., and Villarini, G. (2013). The nexus between atmospheric rivers and extreme precipitation across Europe. Geophys. Res. Lett. 40, 3259–3264. doi: 10.1002/grl.50636
Lavers, D. A., and Villarini, G. (2015). The contribution of atmospheric rivers to precipitation in Europe and the United States. J. Hydrol. 522, 382–390. doi: 10.1016/j.jhydrol.2014.12.010
Lionello, P. (2012). The Climate of the Mediterranean Region: From the Past to the Future. Amsterdam: Elsevier.
Mosmann, V., Castro, A., Fraile, R., Dessens, J., and Sanchez, J. L. (2004). Detection of statistically significant trends in the summer precipitation of mainland Spain. Atmos. Res. 70, 43–53. doi: 10.1016/j.atmosres.2003.11.002
Neiman, P. J., Ralph, F. M., Wick, G. A., Lundquist, J. D., and Dettinger, M. D. (2008). Meteorological characteristics and overland precipitation impacts of atmospheric rivers affecting the West Coast of North America based on eight years of SSM/I satellite observations. J. Hydrometeor. 9, 22–47. doi: 10.1175/2007JHM855.1
Newell, R. E., Newell, N. E., Zhu, Y., and Scott, C. (1992). Tropospheric rivers? a pilot study. Geophys. Res. Lett. 19, 2401–2404. doi: 10.1029/92GL02916
Nieto, R., Gimeno, L., de la Torre, L., Ribera, P., Barriopedro, D., García-Herrera, R., et al. (2007). Interanual variability of cut-off low systems over the European sector: the role of blocking and the Northern Hemisphere circulation modes. Meteorol. Atmos. Phys. 96, 85–101. doi: 10.1007/s00703-006-0222-7
Paredes, D., Trigo, R. M., García-Herrera, R., and Trigo, I. F. (2006). Understanding precipitation changes in Iberia in early spring: weather typing and storm-tracking approaches. J. Hydrometeorol. 7, 101–113. doi: 10.1175/JHM472.1
Peña-Angulo, D., Brunetti, M., Cortesi, N., and Gonzalez-Hidalgo, J. C. (2016). A new climatology of maximum and minimum temperature (1951–2010) in the Spanish mainland: a comparison between three different interpolation methods. Int. J. Geogr. Inf. Sci. 30, 2109–2132. doi: 10.1080/13658816.2016.1155712
Pereira, S., Ramos, A. M., Zêzere, J. L., Trigo, R. M., and Vaquero, J. M. (2016). Spatial impact and triggering conditions of the exceptional hydro-geomorphological event of December 1909 in Iberia. Nat. Hazards Earth Syst. Sci. 16, 371–390. doi: 10.5194/nhess-16-371-2016
Ralph, F. M., Neiman, P. J., Wick, G. A., Gutman, S. I., Dettinger, M. D., Cayan, D. R., et al. (2006). Flooding on california's Russian river: role of atmospheric rivers. Geophys. Res. Lett. 33:L13801. doi: 10.1029/2006GL026689
Ramos, A. M., Cortesi, N., and Trigo, R. M. (2014b). Circulation weather types and spatial variability of daily precipitation in the Iberian Peninsula. Front. Earth Sci. 2:25. doi: 10.3389/feart.2014.00025
Ramos, A. M., Trigo, R. M., and Liberato, M. L. R. (2014a). A ranking of high-resolution daily precipitation extreme events for the Iberian Peninsula. Atmos. Sci. Lett. 15, 328–334. doi: 10.1002/asl2.507
Ramos, A. M., Trigo, R. M., and Liberato, M. L. R. (2017). Ranking of multi-day extreme precipitation events over the Iberian Peninsula. Int. J. Climatol. 37, 607–620. doi: 10.1002/joc.4726
Ramos, A. M., Trigo, R. M., Liberato, M. L. R., and Tomé, R. (2015). Daily precipitation extreme events in the Iberian Peninsula and its association with atmospheric rivers. J. Hydrometeorol. 16, 579–597. doi: 10.1175/JHM-D-14-0103.1
Serrano, A., Garciacutea, J., Mateos, V., Cancillo, M. L., and Garrido, J. (1999). Monthly modes of variation of precipitation over the Iberian Peninsula. J. Clim. 12, 2894–2919. doi: 10.1175/1520-0442(1999)012<2894:MMOVOP>2.0.CO;2
Trigo, I. F. (2006). Climatology and interannual variability of storm-tracks in the Euro-Atlantic sector: a comparison between ERA-40 and NCEP/NCAR reanalyses. Clim. Dyn. 26, 127–143. doi: 10.1007/s00382-005-0065-9
Trigo, R. M., and DaCamara, C. C. (2000). Circulation weather types and their influence on the precipitation regime in Portugal. Int. J. Climatol. 20, 1559–1581. doi: 10.1002/1097-0088(20001115)20:13<1559::AID-JOC555>3.0.CO;2-5
Trigo, R. M., Ramos, C., Pereira, S. S., Ramos, A. M., Zêzere, J. L., and Liberato, M. L. R. (2016). The deadliest storm of the 20th century striking Portugal; flood impacts and atmospheric circulation. J. Hydrol. 541, 597–610. doi: 10.1016/j.jhydrol.2015.10.036
Trigo, R. M., Valente, M. A., Trigo, I. F., Miranda, P. M. A., Ramos, A. M., Paredes, D., et al. (2008). The impact of North Atlantic wind and cyclone trends on european precipitation and significant wave height in the atlantic, trends and directions in climate research. Ann. N Y. Acad. Sci. 1146, 212–234. doi: 10.1196/annals.1446.014
Keywords: Atmospheric Rivers, extreme precipitation, extended summer months, Iberian Peninsula, Portugal
Citation: Ramos AM, Martins MJ, Tomé R and Trigo RM (2018) Extreme Precipitation Events in Summer in the Iberian Peninsula and Its Relationship With Atmospheric Rivers. Front. Earth Sci. 6:110. doi: 10.3389/feart.2018.00110
Received: 16 April 2018; Accepted: 20 July 2018;
Published: 10 August 2018.
Edited by:
Wen Chen, Institute of Atmospheric Physics (CAS), ChinaCopyright © 2018 Ramos, Martins, Tomé and Trigo. This is an open-access article distributed under the terms of the Creative Commons Attribution License (CC BY). The use, distribution or reproduction in other forums is permitted, provided the original author(s) and the copyright owner(s) are credited and that the original publication in this journal is cited, in accordance with accepted academic practice. No use, distribution or reproduction is permitted which does not comply with these terms.
*Correspondence: Alexandre M. Ramos, YW1yYW1vc0BmYy51bC5wdA==