 Jennifer K. Hutchings
 M. Kate Faber
- College of Earth Ocean and Atmospheric Sciences, Oregon State University, Corvallis, OR, United States
An ice watch, encompassing visual observation of sea ice conducted from the ship's bridge, is typically performed on sea-ice oriented research cruises. Ice watch data collected during a decade, 2006–2015, of annual cruises to the Beaufort Sea and Canadian Basin characterizes sea-ice morphology during mid to late summer. Observations not otherwise available on extensive regional scales with remote sensing are highlighted, including stage of melt, floe size, and surface topography in summer. The summer ice pack in the Canada Basin is found to be of smaller floe size than found in 1973–1975. A disintegrating ice pack of mainly small floe size covered much on the Canada Basin in 2006–2009 and 2011–2012. Since 2007 the ice in the Canada Basin has experienced more extensive melt, and more advanced stages of melt than in 1973–1975, during the Arctic Ice Dynamics Joint Experiment (AIDJEX), and early 1990s. Since 2007, Summer ridge sail heights are lower and ridges less extensive compared to the AIDJEX period.
1. Introduction
The Beaufort Sea has experienced a dramatic reduction in perennial ice cover. This is related to transport of ice away from the Chukchi Sea (Nghiem et al., 2007) and Beaufort Sea (Ogi et al., 2008; Hutchings and Rigor, 2012). First year ice is becoming prevalent in the region (Comiso, 2002; Galley et al., 2016), resulting in younger, thinner ice being circulated in the central Beaufort Gyre (Hutchings and Rigor, 2012). This ice is more vulnerable to melt than the older thicker ice that was prevalent in the region in the 1970s and 1980s. Summer ice melt has increased in the Beaufort Sea, with melt of perennial ice becoming prevalent in the Beaufort Sea in recent years (Perovich et al., 2008; Kwok and Cunningham, 2010; Perovich and Richter-Menge, 2015). In this paper we describe the morphology of the Canada Basin ice pack since 2006, providing information obtained by visual observation from annual research cruises supporting the Beaufort Gyre Exploration Program.
Visual observations of ice from airplane or ship are an integral part of sea-ice monitoring for operational and research support. These observations provide information about sea-ice morphology that is not obtainable or ambiguous in remotely sensed data. We present 10 years of visual observations collected in the Beaufort Sea during Joint Ocean Ice Surveys (JOIS) on the Louis S. St. Laurent. These provide an overview of sea-ice change in the Canada Basin with information about floe size, topography, and stage of melt (which describes the progress of sea ice melt processes from the onset of snow melt to deteriating, rotten ice) that is not possible without in-situ observations.
Observations of sea-ice morphology are not extensively available in the region the JOIS cruises traverse for other seasons or previous years. We have identified previous summer observations collected by aircraft for comparison against the JOIS record. Given the limitations of fidelity for the visual observations and prior observations, we can draw some inferences about how summer sea-ice morphology differs during the period 2006–2016 and earlier time periods when aircraft and in-situ observations are available. We find differences in surface topography and floe size. It is more difficult to make any inferences about variability in the stage of melt.
In section 2 we introduce the visual observations and protocols that were used to standardize across observers on JOIS cruises. We present the decade of data collected in the Canada Basin between 2006 and 2015. Section 3 presents some key observational findings in the context of the summer sea-ice state recorded in the 1960s, 1970s, and 1990s. Conclusions are presented in section 4.
2. JOIS Ice Watch Data
The Joint Ocean Ice Study is a collaboration between Canadian, U.S., and Japanese scientists surveying the Beaufort Sea and Canada Basin each year since 2003 on the CCGS Louis S. St. Laurent. The JOIS cruises perform oceanographic stations and mooring service at the same locations each summer, such that the cruise tracks follow repeating paths. At northern latitudes of the cruise tracks autonomous drifting stations were deployed, and occasionally the tracks deviate from repeat paths to find large ice floes suitable to deployment. Since 2006 an ice watch has been performed on each cruise (Figure 1).
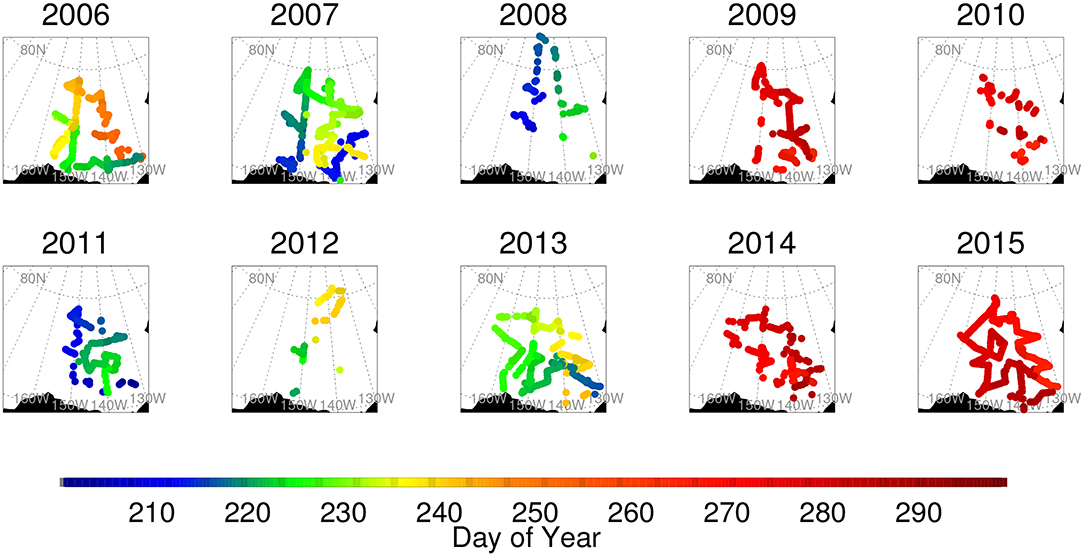
Figure 1. Visual observations of sea ice recorded during JOIS cruises. Color represents the date of the observation. Note that cruises in 2009, 2010, 2014, and 2015 were in late September–October, after the summer minimum ice extent.
The JOIS ice watch followed Antarctic Sea ice Processes and Climate (ASPeCt) (Worby and Allison, 1999) observation protocols that preserves World Meteorological Organization (WMO) and ice charting convention (Fequest, 2002) in their recording system. ASPeCt includes additional information characterizing sea-ice morphology. We expanded the ASPeCt observation protocols to characterize Arctic summer ice conditions that differ from the Antarctic conditions ASPeCt was designed for. The new observation fields characterize the stage of melt of the ice. During the course of the decade of observations we formed a standardization of ship-based sea-ice visual observations in the Arctic. We developed software to aid in data collection and quality control called the Arctic Ship-bourne Sea Ice Standardization Tool (ASSIST). See Hutchings et al. (2016) for a summary of all observational fields in ASSIST.
Each JOIS cruise ice watch followed a standard protocol, recording hourly observations around the clock when the ship was traveling in ice. The ice watch was split between 2 and 4 people in 12 or 6 hour shifts, and cross-comparison between observers was performed during cruises for consistency. A variety of variables are estimated by eye and recorded following the ASSIST and ASPeCt observation protocols. These include ice type, concentration, floe size, thickness, surface topography, stage of melt, and melt-pond fraction. The surface topography includes estimate of ridge sail height and area of ice covered by ridges. The protocols for observing most of these variables are provided in manuals (Worby and Allison, 1999; Worby and Dirita, 1999; Fequest, 2002). We outline the protocols used for stage of melt and note how they changed during the decade in section 2.3.
The JOIS cruises occurred at various times of year during mid-summer to early freeze-up (Figure 2). The changing timing of the cruises in relation to the seasonal cycle of sea ice is of course challenging when tracking evolution in the ice pack. The time of ice extent minimum [the date when NASA Team (Meier et al., 2015) extent of ice with concentration >15% is at it's annual minimum] is around mid-September. Four of the cruises (2009, 2010, 2014, 2015) occurred after the sea-ice minimum, and will be referred to as fall cruises from here on.
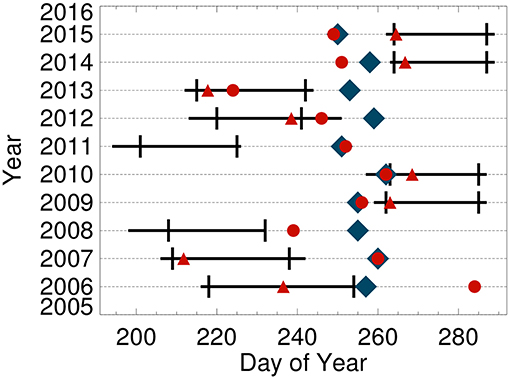
Figure 2. Dates of JOIS cruises on which ice watches were performed, with ice watch time periods bounded by vertical black lines. The time of freeze up is shown for several different methods of estimating freeze up. Red triangles show when the ocean surface was visually observed to be freezing. Red circles are the date of minimum ice extent in the Beaufort region. Blue diamonds are Arctic minimum ice extent dates.
Even given the difficulties in cross-comparison of observations between cruises at different times in the sea-ice melt/growth cycle (Figure 2), there are several findings of note in the observational records. Here we present those features of the ice pack that show distinct characteristics or variability across the decade of observations.
2.1. Thickness
Ice thickness is estimated from blocks of ice the ship cracks and overturns. There is an upper limit on the thickness a ship consistently overturns that is ship dependent. Thickness can also be estimated from freeboard. Observers record the most common thickness during the 10 min observation period, for each ice type. Hence the thicknesses recorded correspond to the mode of ice thickness of each type observed.
First year ice thickness varies considerably between cruises (Figure 3). During summer, the thickness of ice will depend on the history of the melt season and so we can expect different thicknesses to be observed for cruises that happened at different times during summer. If we consider the parts of cruises for which freeze-up was underway (2009, 2010, 2013–2015, and in the north of the 2006 cruise) we find that only in 2006 and 2013 was there first year ice that survived summer. The summers of 2007, 2008, and 2012 experienced record-breaking low ice extents in the Beaufort Sea, and little of the observed first year ice survived summer. It is notable that only in the cold summer of 2013 did first year ice survive summer in the Beaufort Sea at latitudes south of 76N. We can track this ice through subsequent years, as it is circulated around the Beaufort in the center of the Beaufort Gyre.
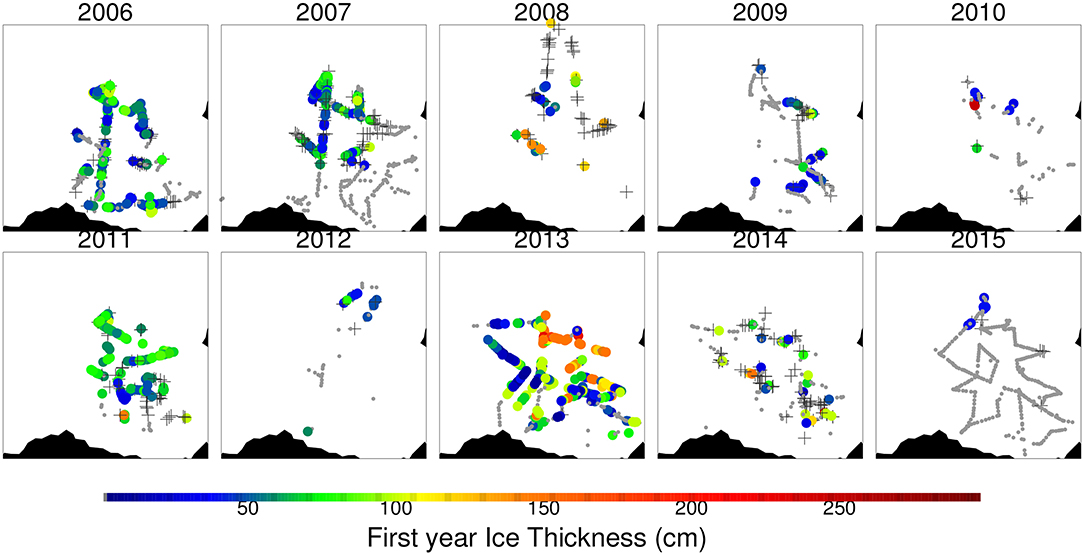
Figure 3. First year ice thickness. Observations where no first year ice was present are shown as small gray circles. Crosses show where first year ice was observed but a thickness estimate not recorded.
Multi-year ice thickness is variable from year to year (Figure 4), and this is related to the circulation of perennial ice in the Beaufort Gyre. In years when ice imported to the north of the Beaufort Sea is transported in the gyre toward the western Arctic (2006, 2013, 2015), thicker perennial ice was observed in the southern regions of the Beaufort. This region of older ice transported to the south-western Beaufort is referred to as the old ice tongue. Figure 5 shows maps of floe size, where it is apparent that large/vast ice floes are only present in the southwest Beaufort in 2006. It is notable that these multi-year floes are small in 2013 and 2015, whereas in 2006 vast floes impeded the travel of the CCGS Louis. S. St. Laurent in the same location.
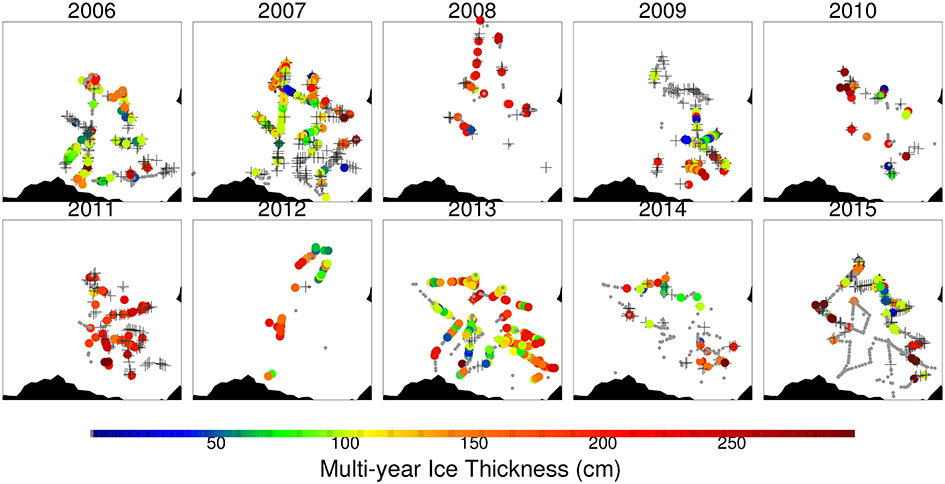
Figure 4. Multi-year ice thickness. Observations where no multi-year ice was present are shown as small gray circles. Crosses show where multi-year ice was observed but a thickness estimate not recorded.
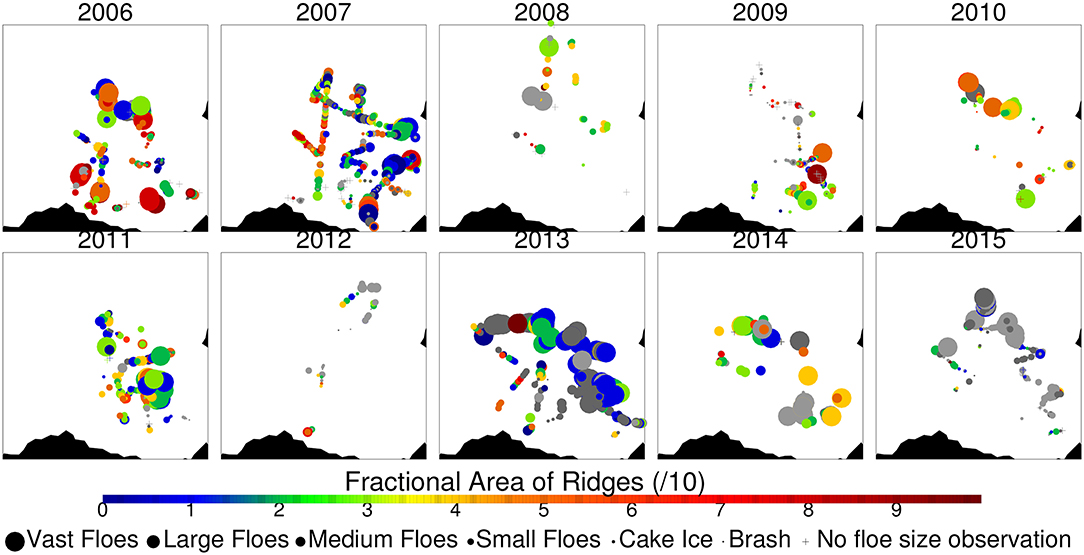
Figure 5. Area of ridges on multi-year ice is shown in color. Gray colored circles do not have this topographic information in the observation record. The symbol size reflects the floe size of the multi-year ice. Multi-year ice for which no floe size information is available are shown as a cross.
The thickness of multi-year ice in the northern cruise locations is consistently lower than the old ice tongue that is transported around the edge of the Beaufort Gyre. This reflects the younger age of the multi-year ice in the center of the Beaufort Gyre since 1998 (Hutchings and Rigor, 2012).
2.2. Ice Surface Topography
The surface topography of sea ice is characterized by ridges, melt ponds, and hummocks. New ridges from the previous winter can be identified, as blocks formed during the ridging event are distinguishable in the ridge. Ridges are transformed during subsequent melt seasons, becoming less angular. Very old ice that has undergone several melt seasons will be hummocked, where melt ponds create an undulating topography and ridges become rounded. The surface topography of the ice pack provides insight into the history of the previous winter, through the area and height of new ridges, and effect of several summers on the old ridge characteristics.
In the Beaufort Sea, we can track an evolution in the characteristics of the oldest ice that transits the region in the Beaufort Gyre. This ice is transported around the outer edge of the Canada Basin. It has been consistently of smaller floe size than observed in 2006.
The multi-year ice in the center of the Beaufort Gyre is younger in the last decade, typically <5 years old (Hutchings and Rigor, 2012). This ice enters the Beaufort Sea from the west as first year ice, and is less ridged than the older ice transported into the Beaufort from the north. Ship based visual observations (Figure 5) indicate a reduction in the topography of this younger multi-year ice for larger ice floes. In 2011–2015 this younger multi-year ice was notably of reduced ridge area. The ice with greater area of ridges, after 2006, is typically found as small floes or cakes. Indicating that in locations such as the northwest Beaufort in 2007, only remnant ridges survived summer.
Area and height of ridge sails can be used to estimate volume of deformed ice (Worby et al., 2008). We do not attempt this here, as ridge height was not always recorded. We can demonstrate that the height of ridge sails displays interannual variability in the Beaufort Sea. Taller sails were found in 2013 and 2011. A large recovery of the perennial ice pack extent in 2013 was partially due to the cooler summer that year, with reduced ice melt. We expect ridges also melted less during this summer. The ridge sail heights in 2014 and 15 are notably low. Much of the ice that survived 2013 was sampled again in 2014 and 2015. The observations indicate either large melt of ridges in these two summer and/or exceptional divergence of the pack occurred. The height of sails recorded is an average over the observation area, so the standard deviations reported in Table 1 are an indication of spatial variability in the mean rather than the true variance of the sail height.
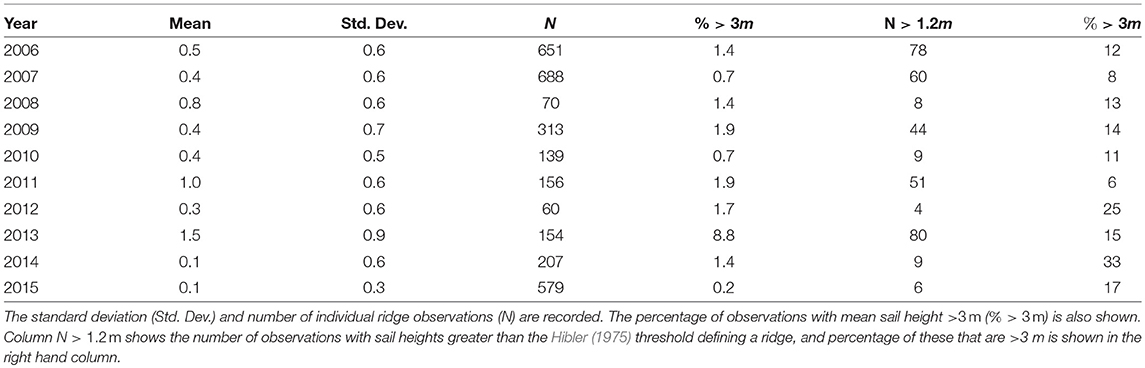
Table 1. Ridge sail heights, averaged each year over the full cruise track.
2.3. Stage of Melt
Stage of sea-ice melt is considered on a five-point scale (Table 2) following World Meteorological Organization standard convention to describe melt. In ASSIST it is reported whether thaw holes are present in melt ponds, if ice is dried or rotten (advanced stages of melt) and whether ponds are frozen over. The fractional area of ice that ponds cover is estimated in the same way as ice concentration, and reported in fractions of 10. If all these fields are recorded they can be combined to reproduce the stage of melt. Stage of melt was recorded in various different ways throughout the decade. Observations used the code given in Table 2 from 2006 to 2011. After 2011 our recording method evolved following peer advice for standardization of surface melt observations. The melt features recorded changed over several years as we worked out problems in the observations system, eventually agreeing on a set of observations that can fully recreate WMO stage of melt (as shown in Table 2) by 2014. Between 2012 and 2014 observers did not successfully record the full information required to recreate stage of melt. After 2014 we standardized our recording method to fully characterize stage of melt as described in Fequest (2002). The Fequest (2002) characterization does not include the ice type fidelity shown in Table 2, however since 2014 ASSIST data does allow stage of melt to be assigned to an ice type as in Table 2. In this paper we consider the stage of melt for years where observations follow Table 2, in subsequent years it was often not possible to recreate these codes to provide a full picture of the stage of melt. Unfortunately this means that we do not have a full record for stage of melt throughout the 10 years.
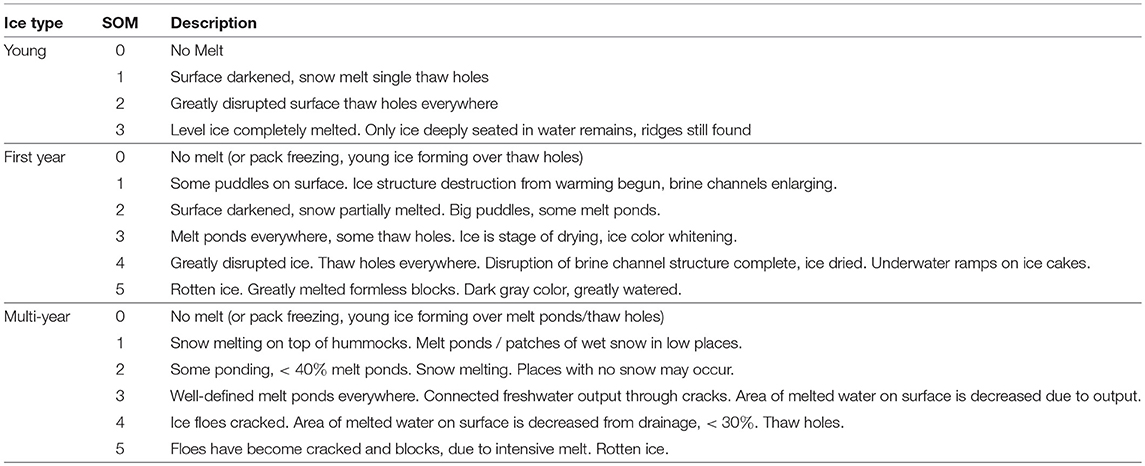
Table 2. Stage of melt (SOM) classification for different ice types, following Russian ice observer convention (pers. comm. Vasily Smolyanitsky, 2003).
The stage of melt of ice in the Beaufort Sea changes between May, with the onset of surface snow melt, to freeze-up. Freeze-up varies in onset time from year to year and with latitude. Here we discuss stage of melt for the parts of cruises undertaken during the melt season in 2006–2008 and 2011. Half of the cruise tracks (2009–2010, 2013–2015, and northern legs of 2006) were after freeze-up when melt ponds were freezing and the summer melt history has to be determined from the ice thickness, floe size, and surface topography. There is variability in stage of melt between years, some of which is related to the time in melt season during which the cruise occurred.
Of the cruises during melt season (Table 3), the stage of melt is consistently higher than 4 for all first year ice and higher than 3 for multi-year ice. An indicator of the enhanced melt of ice in JOIS observations is the prevalence of rotten ice (stage of melt 5). Rotten ice was recorded for between 45 and 86% of all stage of melt observations in the years 2006–2007 and 2011.
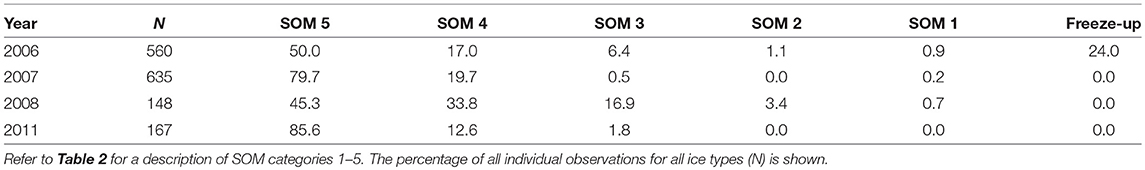
Table 3. Stage of melt (SOM) recorded for JOIS cruises during the melt season.
Melt-pond cover, as a fraction of the ice area, was recorded in all years following from 2008. The average melt-pond cover was 47% in 2008, 48% in 2011, and 8.4% in 2012. The low melt-pond cover in 2012 reflects that ice was in an advanced stage of melt with small floe size throughout this cruise. In 2012, the ice floes with melt ponds had mean melt-pond coverage of 27%. This is lower than the previous years as the ice was in an advanced stage of melt, and floes had disintegrated along thaw holes. In 2013 there was some ice encountered, in the southern Beaufort, before freeze onset. This ice had an average cover of 22% melt ponds. Melt pond cover is recorded as 0% after freeze up occurs, as once ice and snow covers the ponds it is very difficult to judge the area the ponds did cover prior to freeze up.
2.4. Floe Size
Floe size is best estimated from a combination of aerial photography and satellite imagery (Rothrock and Thorndike, 1984; Toyota et al., 2006). The information ship-based observations provide is the distributions of brash, cake ice, and four floe size categories. Visual observations have courser resolution than imagery-based analysis. However, the visual observations do indicate how the melt season progresses over large regions. They are recorded in all weather along large transects of the ocean, so present considerably larger coverage of the Beaufort Sea than previous campaigns.
The representation of larger floes in bridge-based observations may be biased due to a preference to avoid thick or pressured ice by ship captains. However, such bias becomes apparent in examination of satellite imagery or cruise tracks that meander to avoid large floes. During JOIS northern parts of the cruise tracks were targeting areas with large floes, so this bias is likely reduced in the north. In southern parts of the cruise the navigator might choose to avoid large floes visible in satellite imagery. We find that in regions where the ship deviated in the south large ice floes are observed. We restrict our comments on changes in floe size distribution to whether large and vast floes were present or not. As the observations we present are all taken from the same ship, with no variations in the power available for breaking ice between cruises, and given the cruises covered similar tracks from year to year any low bias in the thicker ice categories should be consistent between cruises. Meaning the bias is not affected by varying ship ice breaking capabilities, such that representation of larger floes for ice of similar age and area should not vary from year to year.
It is notable (Figure 6) that the only years where large and vast floes were commonly observed were 2006, 2013, and 2014. Of which, 2013 and 2014 cruises were fall cruises that occurred during freeze-up. Several melt season cruises had floe size distribution skewed to smaller floe size. These were 2007, 2008, 2011, and 2012, which were years with extensive loss of sea ice from the Beaufort Sea.
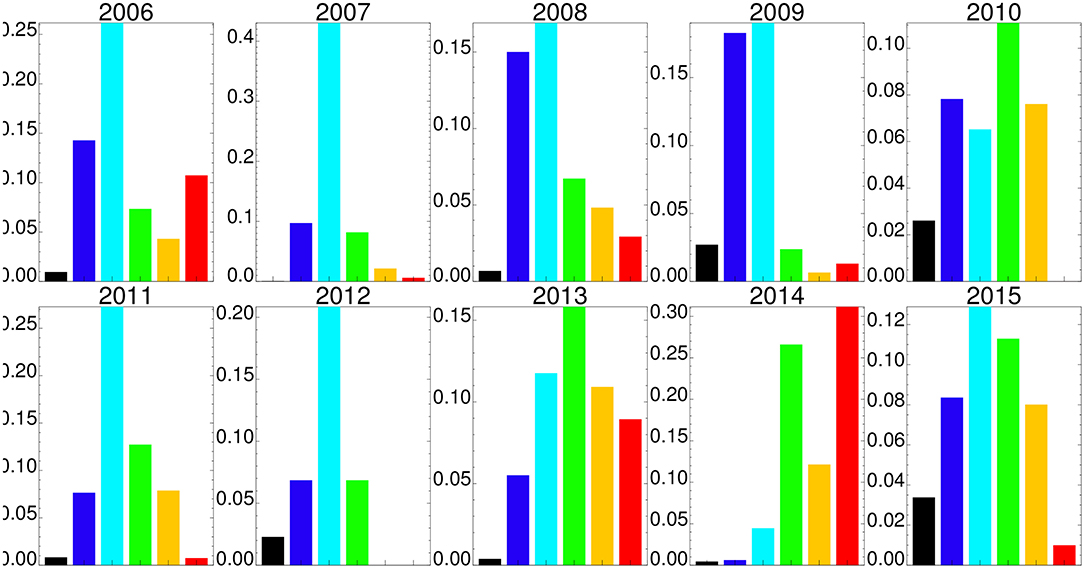
Figure 6. Fraction of observation area with brash (black), cakes (floes <20 m width, blue), small floes (20–100 m, light blue), medium floes (100–500 m, green), large floes (500–2,000 m, orange) and vast floes (> 2, 000 m, red). Only shown for observations where floe size was recorded for all primary, secondary and tertiary ice types present if they were first year or older.
It has been documented by Rothrock and Thorndike (1984) that in regions where the ice pack is disintegrating, larger floes are broken up into smaller floes. The observed floe sizes demonstrate a disintegrating ice pack in years with extensive ice loss. The observations in 2013 are of note, because this was a year of lower ice loss compared to the previous 6 years. Larger floe sizes were present, indicating the ice pack did not experience extensive disintegration due to wave action, deformation or melt, unlike the previous years.
3. JOIS Morphology Observations in the Context of Past Summer Sea-Ice State
There are limited summer time data for the ice pack in the Canada Basin prior to the JOIS cruises that began in 2003. Several submarine traverses have been recorded as part of the SCICEX program, and these have documented decreasing ice thickness in the Canada Basin between 1958 and 1997 (Rothrock et al., 1999). Further ice thickness decrease was found between 2003 and 2013 from moored upward looking sonar (Krishfield et al., 2014). In the 1960s and 1970s there were a series of ice camps and aerial surveys that provide information about ice morphology during this time. Here we discuss the changes in morphology observed between the 1960/70s and the thinner ice period of 2006–15.
3.1. Ridge Characteristics
Weeks (1976) presents a summary of ship and aerial reconnaissance data from various sources. The perennial ice pack showed very small variability in ice concentration from winter to summer, and the seasonal ice zone was at maximum 200 nm in width (Weeks, 1976). It is noted there is large interannual variability in the width of the seasonal ice zone. Drobot (2003) document increases in the seasonal ice zone extent, and decreasing severity of ice conditions in summer, between 1953 and 2000, along the Alaskan Beaufort coast. Since then the seasonal ice zone in the Beaufort has extended to 450 nm from shore and interannual variability of this has increased (extending summer minimum ice extent analysis to 2015 following; Hutchings and Rigor, 2012). Much of the region in the Canada Basin that was covered by perennial ice in the 1970's is now first year ice.
Weeks (1976) report observations from aerial surveys during the Birdseye reconnaissance campaign in the 1960s. They found that that ridge sails >3m in height were prevalent in the summer perennial ice pack. Ridge heights >3m represented 85% of the recorded ridges. Weeks (1976), used data provided by Wittmann and Schule Jr (1967) to characterize the morphology of the coastal shear zone, seasonal ice zone, and perennial ice pack in the Beaufort Sea and Canada Basin. They report numbers and amplitude of summer sail heights that are higher in the perennial ice pack than the seasonal ice zone and coastal shear zone. In summer the seasonal zone ridge area cover (23%) is smaller than the perennial pack ridge area (27%), which may be attributed to collapse of unconsolidated first year ridges during the melt season. The aerial coverage of ridges with sail heights >3m was 23% in the summer in the perennial ice pack.
JOIS mean observed sail height from 2006 to 2015 was 0.5m. The percentage of sail observations with mean heights >3m was always lower than 9% during the JOIS period. AIDJEX-era laser profile analysis characterized ridges as having a minimum height, typically 0.6m above the surrounding level ice (Tucker and Westhall, 1973). In other AIDJEX studies a 1.2m cut off was used (Hibler, 1975; Weeks, 1976). Hence to compare with AIDJEX we should only consider ridge observations for sails greater than 1.2m. We find that the number of > 3 m high sails in this sub-set varies from 6 to 33% (Table 3), which is substantially lower than the 85% observed in the 1960s. Visual observations indicate the Canada Basin ice pack in the last decade is less deformed than in the 1960s and early 1970s.
3.2. Stage of Melt
Stage of melt information is more difficult to discern from the literature of the 1960/70s. Weeks (1976) reports melt pond cover can get as high as 60% with some ponds thawed through in the Central Arctic. All that can be discerned from these comments is that the highest stage of melt observed in the Beaufort Sea and Canada Basin in the 1960s may have been 4 for multi-year ice and 3 for thick first year ice. No occurrence of dried or rotten ice was reported. As melt ponds evolve they reach a maximum coverage and then drain and shrink in size as the ice become porous (Fetterer and Untersteiner, 1998). Observations from Russian ice stations, 1950–1958, show a minimum pond area of <10% on multi-year ice (Nazintsev, 1964). A study of the Canada Basin melt season in 1992 found melt characteristics that did not deviate from the central Arctic Russian ice station or 1970s Canada Basin observations, with melt pond fraction varying for a summer maximum of 60% to a late summer minimum of 10% (Jeffries et al., 1997), consistent with melt ponds on a multi-year ice pack. In contrast, Fetterer and Untersteiner (1998) found that in 1995 ice at the later stage of melt, 3, had pond coverage of about 20% in late summer, August. This ice was smooth, and ponds were interconnected, as found on first year ice (Holt and Digby, 1985). JOIS observations found melt-pond coverage of greater than 20% in later summer. It is likely this relatively large minimum observed pond coverage, on floes with ponds, during JOIS in late summer, is related to the smoother topography of the ice.
A more revealing study in relation to stage of melt was a photographic survey on September 21, 1994 (Tschudi et al., 1997), in the southern Beaufort Sea. Tschudi et al. (1997) found <10% of melt ponds in this region had thaw holes. This ice was clearly at a stage of melt of 3 or less. A similar campaign in 1997 (Tschudi et al., 2001) found thaw holes in July in up to 30% of melt ponds in the western Beaufort, which indicates a stage of melt of 4, which is consistent with JOIS observations. The available melt pond reports from the Beaufort Sea indicate that there is large spatial and year-to-year variability in the stage of melt of ice at the end of summer. Observations suggest the higher stages of melt, 4–5, were only apparent at high latitudes after 1994. However a caveat must be included here that melt-pond observations have not been obtained over extensive regions prior to 1994. JOIS observations show that stage of melt was consistently advanced (3–5) between 2007 and 2012. Earlier observations suggest higher interannual variability in stage of melt than the 2007–2012 period.
3.3. Floe Size
Floe size observations provide further indication of the stage of melt of ice in the region, as ice floes disintegrate along melt ponds with extensive thaw holes. However, floe size data need to be considered carefully as the disintegration of the ice pack into smaller floes during summer is dependent on the history of ice dynamics in the previous winter, through collapse of first year ridges (Prinsenberg and Peterson, 2011) and melt of ice in leads and thermal cracks (Arntsen et al., 2015). Floe size is expected to decrease as the ice pack becomes more seasonal due to the impact of ocean swell on the ice pack (Squire, 2007), and increased lateral melt (Steele, 1992).
Nimbus ERTS-1 microwave imagery during summer 1971 and 1972 (Campbell et al., 1973) found the eastern Beaufort to be covered with very large to vast ice floes, that showed little change in shape or weathering between early July and early August. In late August the western Beaufort was found to consist of smaller 1–2 km floes. This suggests the stage of melt must have been 3 or less for this ice in the eastern Beaufort. The stage of melt cannot be identified in the western Beaufort, as floes were not tracked and the satellite imagery does not resolve floe sizes below medium size.
Aerial and satellite imagery during the AIDJEX campaign provide floe size distributions. Late summer floe size has been provided for August 18, 1973, and August 18, 1975 around 74.5 N 140 W in the eastern Beaufort (Hall, 1978). Sideward looking radar (SLR) provided floe size distributions on September 23, 1975 (Weeks et al., 1980), in the southern Beaufort near Point Barrow and Cape Simpson. The imagery from later in the season, and SLR imagery further south in the seasonal ice zone, had smaller floe sizes, as one might expect from consideration of melt progress. The probability density function for floe size in the images can be estimated from the power law relating floe size to cumulative frequency (Rothrock and Thorndike, 1984). The resolution limits on the different data sets and the JOIS observations differ, however we can still make some inferences regarding the differences in cover of each floe size category between the two periods.
The imagery from the 1970's provides areal coverage information for floes in the medium, large, and vast size categories. In the SLR study where the ice pack was disintegrating, regional coverage of medium floes was 4%, large floes 6%, and vast floes 1%. For summer observations further north in 1975 large floes covered 8% and vast flows covered 30% of the AIDJEX experiment region on August 18 when melt was underway. In 1973 the cover of vast floes in the AIDJEX region was 11% on August 18. It is apparent from JOIS observations that there is a large interannual variability in the floe size distribution during the melt season. However, in none of the cruises that occurred during the melt season, with the exception of 2006, did we observe vast floes covering more than 4% of the Beaufort and Canada Basin. In 2006 vast floes were observed in the multi-year ice tongue just north of Barrow and in the northern regions where freeze-up had commenced. Hence this data is not representative of the AIDJEX region. Visual observation indicate that floe disintegration was the norm for the region between 2006 and 2012 and in 2015, with the majority of the pack experiencing either marginal ice zone conditions or later stages of melt (stage of melt 4, 5).
It is notable that the floe size in the Beaufort Sea and Canada Basin, during the mid-to-late melt season, is smaller during 2007–2015 than observed in the 1970s. Small floe size is associated with amplification of the ice-albedo feedback, as lateral melt rate is increased (Steele, 1992). Hence decreased floe size could be related to amplified ice melt during summer, and is an indicator of the Beaufort Sea and Canada Basin ice pack experiencing marginal ice zone like conditions since 2007.
3.4. Summary of Observable Change
Since the late 1990s we have observed increasing area of seasonal ice zone in the Beaufort (Cavalieri and Parkinson, 2012), and enhanced melt rates in the Beaufort (Perovich and Richter-Menge, 2015) due to the increased albedo-feedback driving greater melt (Perovich et al., 2011). There was a marked increase in summer ice loss, and expansion of the seasonal ice zone, after 2007. Ship-based visual observations indicate that after 2007 the Canada Basin end of summer ice cover was of lower concentration, thinner and with reduced surface topography compared to the 1960/70s. While there was a recovery of the perennial ice pack in 2013–2014, this ice pack remains of low thickness and surface roughness.
4. Conclusion
With the standardization of ice watch data for the Arctic, it is anticipated that information from multiple ships can be combined in future. While the ice watch data is at times subjective, it is useful information for sea-ice scientists studying the evolving morphology of the Arctic ice pack. In this paper we highlight one particular set of observations from repeat cruises in the Beaufort Sea, and document key observations in relation to the recent expansion of the seasonal ice zone in this region.
Visual observations of sea ice in the Beaufort Sea during or near the end of the melt seasons from 2006 to 2015 demonstrate a summer ice pack that is of smaller floe size and reduced surface roughness than previously existed in this region. The old, thick, vast, deformed floes observed in 2006, just north of point Barrow, would have been a prevalent ice type in the perennial pack throughout the Beaufort prior to the expansion of the seasonal ice zone in the western Arctic after 1997. This type of ice has not been observed in the regions of the Canada Basin visited since 2006.
These observations indicate a need to monitor ice conditions at the end of summer across the Arctic, as the increased seasonality of the ice pack has resulted in changes to the ice morphology that impact the survivability of this ice in future years. In particular smoother ice with large melt-pond coverage may partially explain the increased seasonal ice zone area. Decreased topography on thinner multi-year ice, with more extensive melt ponding, may also manifest in increased amplitude of the seasonal cycle in the volume of the perennial ice pack.
Data Availability Statement
JOIS sea-ice observation data and the ASSIST software are available from icewatch.gina.alaska.edu. The data can also be obtained from the PANGAEA world data center at pangaea.de (Hutchings, 2018).
Author Contributions
JH wrote this manuscript, performed the data analysis, and lead the Ice Watch program that collated the JOIS data and extended standardization of observation protocols. MF analyzed the stage of melt data, melt-pond fractions, and processed data to find consistency across the JOIS period when stage of melt recording methods changed.
Funding
Ice Watch, the program that developed ASSIST, has been supported by the National Science Foundation (NSF PLR-1304315), as part of the Sea Ice Prediction Network, and by the Japan Aerospace Exploration Agency (JAXA) under the Arctic Research Plan Utilizing the IARC-JAXA Information System (IJIS) and Satellite Imagery. JH was funded by NSF (PLR-0520574, PLR-1023662) NASA (NNX13AK36G), ONR (N000141210470). MF was supported by Oregon State University URSA-Engage.
Conflict of Interest Statement
The authors declare that the research was conducted in the absence of any commercial or financial relationships that could be construed as a potential conflict of interest.
Acknowledgments
The design of the Ice Watch standardized observing method and ASSIST software has been developed from numerous conversations with many Arctic field researchers both informally and during Climate of the Cryosphere Sea Ice Working Group meetings. Thank you to Alice Orlich, Judy Twedt, Alek Petty, Pat McKeown, Heidi Isengard, Ed Blanchard Wigglesworth, Kazu Tateyama, Seita Hoshino, Yasuhiro Tanaka who contributed as ice observers on JOIS cruises. We wish to thank the three reviewers, editor and chief editor Regina Hock, whose comments greatly improved the presentation of this paper.
References
Arntsen, A. E., Song, A. J., Perovich, D. K., and Richter-Menge, J. A. (2015). Observations of the summer breakup of an arctic sea ice cover. Geophys. Res. Lett. 42, 8057–8063. doi: 10.1002/2015GL065224
Campbell, W., Gloersen, P., Nordberg, W., and Wilheit, T. (1973). Dynamics and Morphology of Beaufort Sea Ice Determined From Satellites, Aircraft, and Drifting Stations. Technical Report NASA-TM-X-66291, NASA Goddard Space Flight Center, Greenbelt, MD.
Cavalieri, D. J., and Parkinson, C. L. (2012). Arctic sea ice variability and trends, 1979-2010. Cryosphere 6, 881–889. doi: 10.5194/tc-6-881-2012
Comiso, J. C. (2002). A rapidly declining perennial sea ice cover in the Arctic. Geophys. Res. Lett. 29, 17-1–17-4. doi: 10.1029/2002GL015650
Drobot, S. D. (2003). Interannual variability in summer Beaufort Sea ice conditions: relationship to winter and summer surface and atmospheric variability. J. Geophys. Res. 108:3233. doi: 10.1029/2002JC001537
Fequest, D. (2002). MANICE: Manual of Standard Procedures for Observing and Reporting Ice Conditions. Ottawa, ON: Environment Canada.
Fetterer, F., and Untersteiner, N. (1998). Observations of melt ponds on Arctic sea ice. J. Geophys. Res. 103, 24821–24835.
Galley, R. J., Babb, D., Ogi, M., Else, B. G. T., Geilfus, N.-X., Crabeck, O., et al. (2016). Replacement of multiyear sea ice and changes in the open water season duration in the Beaufort Sea since 2004. J. Geophys. Res. 121, 1806–1823. doi: 10.1002/2015JC011583
Hibler, W. D. III. (1975). “Statistical variations in Arctic sea ice ridging and deformation rates,” in Ice Tech Symposium (Montreal, QC: Society of Naval Architects and Marine Engineers).
Holt, B., and Digby, S. A. (1985). Processes and imagery of first-year fast sea ice during the melt season. J. Geophys. Res. 90, 5045–5062.
Hutchings, J., and Rigor, I. (2012). Role of ice dynamics in anomalous ice conditions in the Beaufort Sea during 2006 and 2007. J. Geophys. Res. 117:C00E04. doi: 10.1029/2011JC007182
Hutchings, J. K., Hughes, N., Orlich, A. R., MacFarlane, S., Cowen, A., Farmer, L., et al. (2016). “Ice Watch: standardizing and expanding Arctic ship based sea ice observations,” in White Paper Presented at Arctic Observing Summit (Fairbanks, AK).
Jeffries, M., Schwartz, K., and Li, S. (1997). Arctic summer sea-ice SAR signatures, melt-season characteristics, and melt-pond fractions. Polar Record 33, 101–112. doi: 10.1017/S003224740001442X
Krishfield, R. A., Proshutinsky, A., Tateyama, K., Williams, W. J., Carmack, E. C., McLaughlin, F. A., et al. (2014). Deterioration of perennial sea ice in the Beaufort Gyre from 2003 to 2012 and its impact on the oceanic freshwater cycle. J. Geophys. Res. 119, 1271–1305. doi: 10.1002/2013JC008999
Kwok, R., and Cunningham, G. F. (2010). Contribution of melt in the Beaufort Sea to the decline in Arctic multiyear sea ice coverage: 1993-2009. Geophys. Res. Lett. 37, 1–5. doi: 10.1029/2010GL044678
Meier, W. F. F., Savoie, M., Mallory, S., Duerr, R., and Stroeve, J. (2015). NOAA/NSIDC Climate Data Record of Passive Microwave Sea Ice Concentration, Version 2. NASA National Snow and Ice Data Center Distributed Active Archive Center.
Nazintsev, Y. L. (1964). The heat balance of the surface of the multiyear ice cover in the central Arctic. Tr. Arkt. Antarkt. Nauchno Issled. Inst. 267, 110–126.
Nghiem, S. V., Rigor, I. G., Perovich, D. K., Clemente-Colón, P., Weatherly, J. W., and Neumann, G. (2007). Rapid reduction of Arctic perennial sea ice. Geophys. Res. Lett. 34:L19504. doi: 10.1029/2007GL031138
Ogi, M., Rigor, I. G., McPhee, M. G., and Wallace, J. M. (2008). Summer retreat of Arctic sea ice: role of summer winds. Geophys. Res. Lett. 35:L24701. doi: 10.1029/2008GL035672
Perovich, D., Jones, K., Light, B., and Eicken, H. (2011). Solar partitioning in a changing Arctic sea-ice cover. Ann. Glaciol. 52, 192–196. doi: 10.3189/172756411795931543
Perovich, D. K., and Richter-Menge, J. A. (2015). Regional variability in sea ice melt in a changing Arctic. Philos. Trans. R. Soc. A Math. Phys. Eng. Sci. 373:20140165. doi: 10.1098/rsta.2014.0165
Perovich, D. K., Richter-Menge, J. A., Jones, K. F., and Light, B. (2008). Sunlight, water, and ice: extreme Arctic sea ice melt during the summer of 2007. Geophys. Res. Lett. 35:L11501. doi: 10.1029/2008GL034007
Prinsenberg, S. J., and Peterson, I. K. (2011). Observing regional-scale pack-ice decay processes with helicopter-borne sensors and moored upward-looking sonars. Ann. Glaciol. 52, 35–42. doi: 10.3189/172756411795931688
Rothrock, D. A., and Thorndike, A. S. (1984). Measuring the sea ice floe size distribution. J. Geophys. Res. 89, 6477–6486. doi: 10.1029/JC089iC04p06477
Rothrock, D. a., Yu, Y., and Maykut, G. a. (1999). Thinning of the Arctic sea ice cover. Geophys. Res. Lett. 26, 3469–3472. doi: 10.1029/1999GL010863
Squire, V. (2007). Of ocean waves and sea-ice revisited. Cold Regions Sci. Technol. 49, 110–133. doi: 10.1016/j.coldregions.2007.04.007
Steele, M. (1992). Sea ice melting and floe geometry in a simple ice-ocean model. J. Geophys. Res. 97, 17729–17738. doi: 10.1029/92JC01755
Toyota, T., Takatsuji, S., and Nakayama, M. (2006). Characteristics of sea ice floe size distribution in the seasonal ice zone. Geophys. Res. Lett. 33:L02616. doi: 10.1029/2005GL024556
Tschudi, M., Curry, J., and Maslanik, J. A. (1997). Determination of areal surface-feature coverage in the Beaufort Sea using aircraft video data. Ann. Glaciol. 25, 434–438. doi: 10.3189/S0260305500014415
Tschudi, M. A., Curry, J. A., and Maslanik, J. A. (2001). Airborne observations of summertime surface features and their effect on surface albedo during FIRE/SHEBA. J. Geophys. Res. 106, 15335–15344. doi: 10.1029/2000JD900275
Tucker, W., and Westhall, V. (1973). Arctic sea ice ridge frequency distributions derived from laser profiles. AIDJEX Bull. 21, 170–180.
Weeks, W. F., Tucker, W. B. III, Frank, M., and Fungcharoen, S. (1980). Characterization of Surface Roughness and Floe Geometry of Sea Ice Over the Continental Shelves of the Beaufort and Chukchi Seas. Seattle, WA: Sea Ice Processes and Models (RS Pritchard, Ed.), University of Washington Press, 300–312.
Wittmann, W. I., and Schule Jr, J. J. (1967). Comments on the Mass Budget of Arctic Pack Ice. Technical report, NAVAL OCEANOGRAPHIC OFFICE NSTL STATION MS.
Worby, A., and Allison, I. (1999). A Technique for Making Ship-Based Observations of Antarctic Sea Ice Thickness and Characteristics, Part 1 Observational Technique and Results. Technical report, Antarctic CRC.
Worby, A., and Dirita, V. (1999). A Technique for Making Ship-Based Observations of Antarctic Sea Ice Thickness and Characteristics, Part 2 User operating Manual. Technical report, Antarctic CRC.
Keywords: sea ice, sea-ice topography, stage of melt, sea-ice morphology, ship observations
Citation: Hutchings JK and Faber MK (2018) Sea-Ice Morphology Change in the Canada Basin Summer: 2006–2015 Ship Observations Compared to Observations From the 1960s to the Early 1990s. Front. Earth Sci. 6:123. doi: 10.3389/feart.2018.00123
Received: 23 March 2018; Accepted: 10 August 2018;
Published: 30 August 2018.
Edited by:
Alun Hubbard, UiT The Arctic University of Norway, NorwayReviewed by:
Benjamin Rabe, Alfred Wegener Institut Helmholtz Zentrum für Polar und Meeresforschung, GermanyAgnieszka Herman, University of Gdansk, Poland
Daniela Flocco, University of Reading, United Kingdom
Copyright © 2018 Hutchings and Faber. This is an open-access article distributed under the terms of the Creative Commons Attribution License (CC BY). The use, distribution or reproduction in other forums is permitted, provided the original author(s) and the copyright owner(s) are credited and that the original publication in this journal is cited, in accordance with accepted academic practice. No use, distribution or reproduction is permitted which does not comply with these terms.
*Correspondence: Jennifer K. Hutchings, amh1dGNoaW5nc0Bjb2FzLm9yZWdvbnN0YXRlLmVkdQ==