 Keith Reid
 Kimberly Schneider
 Brian McConkey
- 1Science and Technology Branch, Agriculture and Agri-Food Canada, Guelph, ON, Canada
- 2Science and Technology Branch, Agriculture and Agri-Food Canada, Swift Current, SK, Canada
Phosphorus (P) loss to surface freshwater is a key driver of environmental degradation, including blooms of both harmful (e.g., microcystis) and nuisance (e.g., cladophora) algae, along with the development of hypoxic zones that could significantly impact fish habitat. Mitigating P losses from agricultural land will require a detailed understanding of the forms (particulate versus dissolved, and chemical speciation), sources (soil erosion, desorption of soil P, dissolved P from fertilizer or manure application, or release from frozen vegetation) and transport pathways (surface runoff, or subsurface runoff through tile drains). This paper describes each of these components in detail, and discusses how this can guide the adoption of appropriate beneficial management practices to effectively reduce P losses. Further, it describes how this component structure has been incorporated into the Canadian national Indicator of Risk of Water Contamination by Phosphorus (IROWC-P) as an example of a risk assessment tool.
Introduction
Phosphorus (P) loss to surface freshwater is a key driver of environmental degradation (Sharpley et al., 2003; Jarvie et al., 2013; Scavia et al., 2014), including blooms of both harmful (e.g., microcystis) (Conroy et al., 2014; Steffen et al., 2014; Simic et al., 2017) and nuisance (e.g., cladophora) algae (Auer et al., 2010; Depew et al., 2011; Howell and Dove, 2017), along with contributing to the development of hypoxic zones that impact fish habitat (Bouffard et al., 2013; Scavia et al., 2014). While agricultural runoff is not the only source of P loading to surface water, it is significant in many areas and is implicated as the dominant source to some of the most heavily impacted waters (Sharpley et al., 2003; Michaud et al., 2004; Joosse and Baker, 2011; Bunting et al., 2016).
Given the importance of agricultural runoff in P loading to surface water, there is great interest in finding ways to mitigate these losses (Haygarth et al., 2005; OLEPTF, 2010; Reutter et al., 2011; Osmond et al., 2012a; Kerr et al., 2016). The success of these mitigation activities depends on how well our understanding of the source and transport processes for P represent what is actually happening in an individual field, farm or catchment (Gburek et al., 2002; Osmond et al., 2012b; Sharpley et al., 2012; Radcliffe et al., 2015). Unfortunately, this linkage is often less than perfect for a number of reasons. For example, models may be adapted from other jurisdictions that are dominated by different processes; our understanding of the underlying processes for the transport of P may be flawed, or based on outdated research; or the models chosen may be biased by tightly held cultural, political or economic preferences (Kleinman et al., 2015b).
This paper will attempt to outline our current understanding of the dominant sources and transport pathways for phosphorus loss from agricultural land under varying inherent conditions and management practices, and how the relative importance of each may be assessed. The Indicator of Risk of Water Contamination by Phosphorus (IROWC-P) will be discussed as an example of one type of assessment tool, including describing the areas for future improvement.
The Source × Transport Paradigm for Understanding P Loss
The earliest P indexes considered sources of P independently from the risk of transport (Lemunyon and Gilbert, 1993) and did not always assign risk correctly if there was, for example, a large source of P with no transport risk. Gburek et al. (2000) pointed out this flaw, and suggested an alternative model which determined the potential P source for loss, and multiplied it by a transport modifier to assess the risk of P loss to surface water. This forms the basis for our understanding of P losses, where water movement is needed before any P transport can occur. The unfortunate corollary is that some models assume that any water leaving the landscape will carry the same concentration of P, which ignores the differences in the ways that P is released into water traveling by different pathways, the opportunities for mitigation of P traveling through different pathways, and the ways that different forms of P will be transported.
This weakness is addressed by using a component model to understand and predict P losses, where the combinations of P sources and transport pathways are assessed individually, and then summed to determine the total risk of P loss from the field or region being assessed. The focus in this paper is on P transport by water, although atmospheric deposition of P can also occur, and may be a significant fraction of P inputs to some smaller water bodies adjacent to sources of P (Anderson and Downing, 2006), and this could be included in as a component in a P loss model. The factors that make up each of the components are discussed in the following sections.
Particulate Versus Dissolved P
Phosphorus exported from terrestrial systems is a combination of dissolved P, and P that is bound to soil as particulate P. Dissolved P is predominantly phosphate ions [also identified as dissolved reactive P (DRP) due to its reactivity with molybdate to form a blue colored complex (Joosse and Baker, 2011)], but it can also contain P sorbed to colloidal particles, organic P compounds (Heathwaite et al., 2005), and non-reactive mineral forms including polyphosphates and phosphonates (Turner and Newman, 2005; Weihrauch and Opp, 2018). The phosphate ion is extremely reactive, and therefore tends to form insoluble or slightly soluble compounds if a suitable counter ion is available (Sharpley, 1995). Most P in the soil is in the particulate form, as precipitates of iron, aluminum or calcium phosphates, bound to soil minerals (clay, calcite, aluminum hydroxides, etc.), or occluded within soil granules (Wang et al., 2010). This has led to the misconception that controlling soil erosion will effectively control P export from agricultural land (Baker et al., 2014), but recent developments have shown that a significant portion of P losses can be in the dissolved form (Baker et al., 2007; Joosse and Baker, 2011).
This is relevant to water quality because of the relative availability of each P form to freshwater algae. Dissolved P, especially PO43-, is immediately available to algae, and is absorbed within a time frame of minutes to hours (Barlow-Busch et al., 2006), so many lake water analyses ignore the dissolved fraction completely since the majority is in the algal biomass (Lin and Guo, 2016). The particulate fraction is, generally, more slowly available, as the recalcitrant compounds gradually dissolve. This proportion will vary with the soil chemistry, and with the amount of P in the soil. Estimates of the proportion of total particulate P that is bioavailable vary widely, with Sharpley et al. (1991) reporting a range from 0 to 95%, and Young et al. (1985) reporting a range from 0 to 70% for sediments in the Great Lakes basin. The most frequently used estimates, however, are in the range of 10% (Fang et al., 2002) to 30% (Sharpley and Smith, 1993), which is within the range reported for five lower Great Lakes tributaries by DePinto et al. (1981). A full discussion of the complexity of various P forms in soils and sediments is beyond the scope of this paper, but the topic has been well summarized by Condron and Newman (2011) and Weihrauch and Opp (2018).
The biological response of lakes and streams to P inputs will depend on the total amount of bioavailable P. This can be calculated as the total of dissolved P and the bioavailable portion of particulate P.
P Sources
One of the limitations of P risk assessments is focusing on a limited number of potential sources, which may lead to ignoring sources that are relevant to the conditions in a given area. This is a particular danger if P indexes are adopted from other regions with different dominant P sources. While it may be appropriate to focus on particular sources, this should only be done after an objective assessment of the relative importance of each source within the area of interest, rather than adopting the assumptions made in different geographies.
Particulate P From Eroded Soil
In many environments, the particulate P fraction represents the majority of total P leaving a field, although it may not represent the largest amount of bioavailable P. Nonetheless, it is important to consider in any assessment of P loss.
The factors affecting particulate P loss include the quantity of eroded soil, and the P concentration within that sediment. It is difficult to measure soil loss directly, but there are a number of tools available to estimate soil erosion from soil, landscape, climate, and management factors. These are generally based on the Universal Soil Loss Equation (USLE), which is a mixed model that combines both source and transport factors to predict soil delivery to the bottom of a 22.7 m slope (Foster et al., 2003; Kinnell, 2008). This helps to explain why soil erosion is often included as a transport factor rather than a source factor. Variations on USLE, like RUSLE (Renard et al., 1995) or WEPP (Flanagan et al., 2007), use similar equations to estimate the quantity of soil detached but also account for additional landscape factors to improve estimates of P delivery to the edge of field.
Two different methods have been used for estimation of the particulate P concentration within the soil. Some studies have shown a correlation between the soil test P (STP) of the soil and total P concentration (van der Perk et al., 2007; Withers et al., 2009). The second method is to assume that particulate P concentration is a constant fraction of the soil, which is supported by data showing a weak relationship between STP and PP (Uusitalo et al., 2003; Reid, 2011; Glæsner et al., 2013; Borda et al., 2014). It is likely that this proportion varies with mineralogy as well as organic matter content and composition, so there may be significant differences between regions that are independent of STP.
Complicating the estimation of PP losses are the issues of P stratification and P enrichment. P stratification is the accumulation of elevated levels of P at the soil surface, either by the deposition of plant residues on the soil surface or by the surface application of fertilizer or manure (Smith et al., 2017). P stratification is an important consideration because the runoff water interacts with a very shallow layer of soil at the surface (Sharpley, 1985). P enrichment refers to the selective erosion of sediments with a higher P concentration than the bulk soil during small erosion events (Sharpley, 1980).
Some risk assessment tools are attempting to estimate the bioavailable fraction of PP, rather than the total, to better predict the biological consequences of the P loss. This can be estimated as a constant proportion of the PP (see previous section), or related to the STP (Sharpley et al., 1992; Sharpley and Smith, 1993). Ellison and Brett (2006) showed the proportion of bioavailable particulate P (BAPP) ranging from 12 to 29% in runoff from rural areas in Washington State, United States. DePinto et al. (1981) found that the BAPP of suspended sediments in tributaries of Lakes Erie and Ontario were relatively consistent within tributary samples, but varied between tributaries with a range of 6.1–35.8% of total sediment P.
Dissolved P Desorbed From Soil
When rain or snow-melt interacts with the soil surface, a small part of the P contained in that soil will dissolve and be transported with runoff water, either across the soil surface in surface runoff or diverted vertically through macropores to tile drains. The exact proportion of soil P that desorbs will vary with P content of the soil, and the soil mineralogy. A number of studies have shown that DP losses are related to the agronomic soil tests that are appropriate for that region, which provides a readily available tool for estimating the risk of DP losses (Vadas et al., 2005; Little et al., 2007; Wang et al., 2012, 2015). Some of these studies have shown greater accuracy when the STP is expressed as a degree of P saturation (DPS), calculated as the STP divided by the P sorption capacity of the soil. The importance of this increased accuracy for routine evaluations is unclear, however, since it would require soil analyses that are not included as part of most STP evaluations, and the increase in accuracy is modest relative to the range of STP values found under field conditions (Vadas et al., 2005; Wang et al., 2010, 2015).
The proportion of desorbed P has generally been assessed using artificial rainfall on small field plots or repacked soil boxes (National Phosphorus Research Project [NPRP], 2001; Wang et al., 2010). This consistent approach has been very good for assessing the relative difference between different soils and STP values, although there is evidence that it may be underestimating the concentration of P in runoff water from small rain events (Shigaki et al., 2007; Srinivasan et al., 2007; Dougherty et al., 2008; Dunkerley, 2017). It is speculated that the intensive rainfall in the rainfall simulators limits the opportunity for rainwater to interact with the soil surface due to the rapid runoff, and that the estimated proportions should be increased for light rain.
Dissolved P Desorbed From Applied Fertilizer
Fertilizer applied to the soil surface represents a highly soluble source of phosphorus, which can readily be mobilized in runoff water. Vadas et al. (2008) summarized the state of knowledge regarding interactions of fertilizer with soil and precipitation, noting that fertilizer granules dissolve over time with successive rainfall events. The resulting solution is more concentrated than what would result from the interaction of runoff water with soil, so the soil represents a net sink for the P desorbed from fertilizer. Using the assumption that the P in water which infiltrates into the soil will be retained there, the P losses from fertilizer can be estimated by using a distribution factor to account for the partitioning between runoff and infiltration (Vadas et al., 2008).
It is important to note that losses from applied P are only relevant from fertilizer that remains on the surface. Sub-surface banding or incorporation by tillage should, theoretically, eliminate losses from applied P fertilizer, although the reality is that a small amount of the applied P remains on the surface. The degree of incorporation, and the lag time between application and incorporation, if known, should be considered in P loss risk assessments.
Dissolved P Released From Applied Manure
Similar to fertilizer, manure is a highly available source of P for runoff, but has two key differences. The first is that manure contains a range of organic and mineral forms of P (Johannesson et al., 2017), so not all is immediately soluble although some compounds will degrade to release soluble P over time (Sharpley and Moyer, 2000; Vadas et al., 2011). The rate of release of these compounds can also vary with soil conditions, e.g., redox potential (Turner and Newman, 2005). The second is the physical form of the manure, as there may be immediate infiltration of liquid manure (Vadas, 2006), or reduced effectiveness of incorporation due to the larger volume applied and the clumpy nature of solid manure (Vadas et al., 2007). The net result is that the immediate release from applied manure may be less than from an equivalent amount of fertilizer P, but the concentration of P in runoff water will not decline as quickly.
Dissolved P release from applied manure can be estimated from the total P application rate multiplied by the water extractable P proportion in the manure, which varies among livestock species (Kleinman et al., 2002, 2005, 2006), minus the amount of liquid manure that has infiltrated (Vadas et al., 2007). This dissolved P is then subject to a similar partitioning between runoff and infiltration as fertilizer, but with a different partitioning coefficient to reflect the slower rate but longer duration of P release from manure (Vadas et al., 2008, 2009).
Dissolved P Released From Frozen Plant Residue
In areas where annual runoff is dominated by snowmelt, P that is released from frozen plant residue can represent a significant part of annual P losses to surface water (Elliott, 2013). It has been well established that the rate of P release from plant tissue is accelerated by freezing and thawing (Miller et al., 1994; Bechmann et al., 2005; Liu J. et al., 2013; Kirchmann and Wessling, 2017), although this has not translated into increased P losses to surface water under all conditions (Lozier et al., 2017). The most likely explanation for this seeming discrepancy is the difference in water infiltration under different climatic conditions. Where freezing conditions are followed by warm weather and rainfall, the P leached out of the plant residues will have to opportunity to interact with the soil and be adsorbed. In contrast, if there is little or no rainfall between freezing conditions and the onset of winter with snow accumulation, most of the P would remain in the residue in soluble form until it is carried off the field during snowmelt (Roberson et al., 2007).
This can be modeled by assuming the labile portion of the P in crop residue (roughly 50% for most residues) is converted to soluble forms according to an exponential decay function (Damon et al., 2014). This soluble P is then washed out of the residue by rainwater or by “steeping” in the water from snowmelt (Elliott, 2013), and partitions between infiltration and runoff in the same manner as dissolved P from fertilizer (Vadas et al., 2009). Modeling the P in alfalfa residue against actual weather conditions in southwestern Ontario (Harrow) and southern Saskatchewan (Swift Current) showed that most of the P was leached out of the Ontario residue by January with relatively little carried off the field, while significant amounts remained over winter in the prairie environment (Saskatchewan) and was exported in runoff during snowmelt (Figure 1).
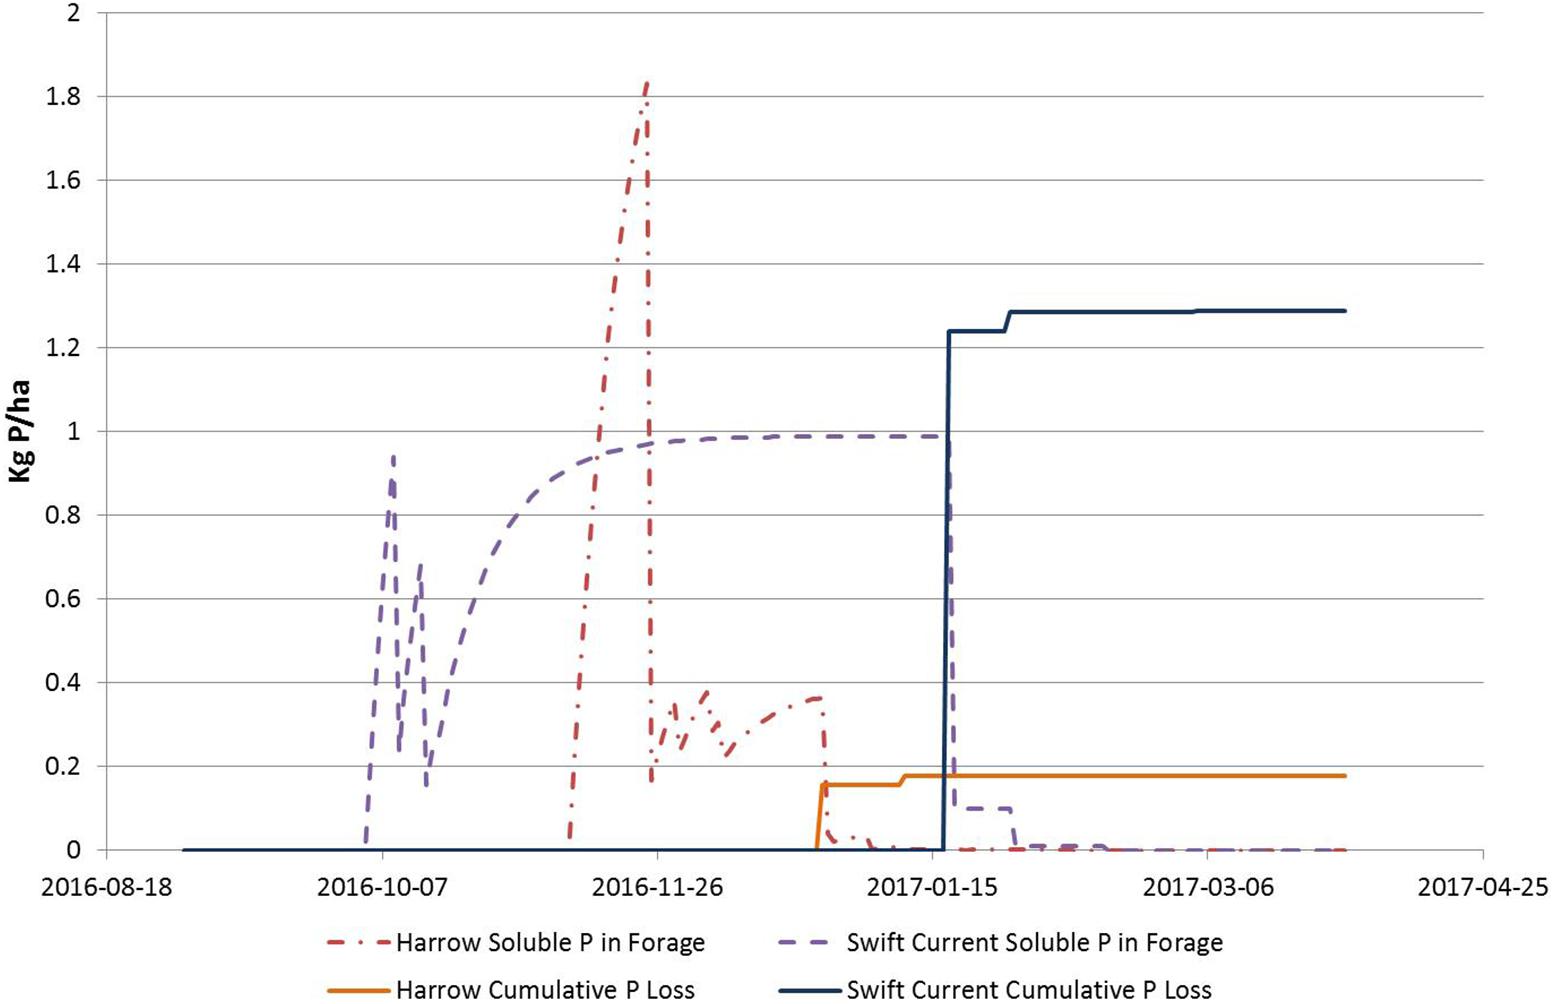
FIGURE 1. Predicted plant residue P available for loss from forages in different climate zones.
P Transport Pathways
As already noted, P movement in runoff cannot occur unless there is also water movement (Chardon and Schoumans, 2002). Most models of P loss account for surface runoff, but in regions with extensive tile drainage it is important to consider this pathway, as well (Reid et al., 2012; Jarvie et al., 2017). In some environments, subsurface lateral movement of P can contribute to P losses, but this requires preferential flow pathways in both vertical and horizontal directions, that discharge to surface water (Allen et al., 2012; McGrath et al., 2013; Kleinman et al., 2015a).
It should be noted that, although it is common to refer to the vertical movement of P as “leaching,” that this is a different process from the leaching of compounds like nitrate. Both dissolved and particulate forms of P are significantly retarded by contact with the soil matrix, so the vertical movement of P to tile drains is through preferential flow pathways rather than through the soil matrix (Radcliffe et al., 2015). Leaching to deep aquifers is not assessed as part of P loss, both because dissolved P does not pose a direct human health risk, and because the conditions to support the biological response to P loading (i.e., algae growth) are not present in groundwater.
Transport of P through the air to surface water is ignored in most models, because, unlike N, there are no gaseous losses of P from the soil surface and it is considered to be a relatively minor contributor to P loading. There can, however, be significant generation of dust by soil disturbance that can then be deposited on surface water, which can contribute a significant part of P loading to water bodies that are relatively small (Anderson and Downing, 2006).
Surface Runoff
Surface runoff will be generated whenever water inputs from precipitation or snowmelt exceed the capacity of the soil to absorb that water. This exceedance may occur because the rate of precipitation exceeds the infiltration capacity of the soil (Infiltration excess runoff, or Hortonian flow), or because the soil is already saturated and cannot absorb any more water (saturation excess runoff). The amount of runoff, and therefore the risk of P loss in that runoff, is driven by the total amount of precipitation, the intensity of that precipitation, and the proportion of that precipitation that becomes runoff. Runoff from any landscape will be a combination of both processes, although the dominant process will depend on climate, topography, and soils.
Infiltration excess is the basis of runoff predictions using the SCS Curve Number approach (Garen and Moore, 2005; Singh et al., 2010). The underlying assumption is that areas with similar infiltration capacity (hydrologic response units, or HRUs), as determined by soil type, crop types, soil management and antecedent moisture, will all generate runoff at the same time when an intense rain event occurs. The corollary of this assumption is that the runoff generated will all run downslope to surface water, so the entire HRU is a source for P transport. Infiltration excess runoff will dominate in areas where soil permeability is low and precipitation is concentrated into intense storm events. Because of the influence of crop type and soil management (particularly tillage system), this form of runoff generation will change in response to management (Garen and Moore, 2005).
Saturation excess flow, in contrast, occurs in parts of the landscape where the water table is close to the surface of the soil. This may be due to topographic position (i.e., low elevation), or to impermeable layers in (cemented horizons or shallow bedrock) or at the surface (compacted soils) of the soil. It is the basis for variable source areas for runoff (Gburek et al., 2006; Schneiderman et al., 2007; Dahlke et al., 2009). Runoff will generally occur from only a small part of the landscape, but can have a disproportionate effect because they are concentrated close to surface water. The proportion of precipitation that becomes runoff is related to the proportion of the landscape with saturated conditions; this parameter will not be affected by changes in crop type or soil management.
Both of these methods can be calibrated to provide good estimations of total runoff volume from a landscape, but the parts of that landscape that are assumed to be generating runoff can be quite different for each (Lyon et al., 2006). Models based on infiltration excess will predict most of the runoff coming from upland areas within a watershed, while saturation excess models will predict that most runoff comes from the lower reaches. Understanding the relative importance of each process within an area will be critical to the choice of P source mitigation efforts, if the goal is to reduce P losses to surface water.
Runoff from snowmelt is a special case, since large parts of the landscape may be either saturated or frozen. If this occurs, the differences between infiltration and saturation excess disappear. One of the major challenges, from both a modeling and a management perspective, is that there are also conditions where the snow melts gradually over a permeable soil so almost all of it infiltrates (Zhang, 2005; Dutta et al., 2017). This process has not been extensively researched, and the process of infiltration into unfrozen soils is not included in the Cold Regions Hydrologic Model (Pomeroy et al., 2007), although it does include a factor for infiltration into unsaturated frozen soils.
The impact of the interactions between regional climate variation and the seasonality of runoff generation on potential source areas for P loss can be illustrated by some examples. In the northern Great Plains, dry conditions dictate that there is virtually no runoff except during spring snowmelt (Liu K. et al., 2013; Liu et al., 2014; Mahmood et al., 2017), but there is also little opportunity for infiltration of P into frozen soils. Surface applied P during the fall or winter, or P from frozen plant residues, would represent a high risk of P loss. In contrast, runoff generation in much of south-eastern United States is dominated by infiltration excess from summer storms so losses from spring applied nutrients are more problematic than from fall applications (Osmond et al., 2012b; Woodbury et al., 2014). The Eastern Corn Belt is a transition zone, where runoff in the spring freshet mimics infiltration excess, while during the growing season there are seldom storms intense enough to exceed soil infiltration capacity so runoff is dominated by saturation excess (Gburek et al., 2006; Easton et al., 2008).
Tile Runoff
Tile drainage is widely used in many humid temperate agricultural areas to manage excess soil moisture and improve crop growth, with some of the most intensive areas of tile drainage in the southern parts of the Great Lakes basin (Tan and Zhang, 2011; Reid et al., 2012; King et al., 2015), the Mississippi River basin (Blann et al., 2009), and northern Europe (Uusitalo et al., 2007; Ulén et al., 2011). Tile drains have a marked effect on hydrology by reducing the volume of surface runoff, lowering the water table within the soil, and changing the timing and duration of peak runoff flows (Sloan et al., 2016), although the total runoff from an individual field may not increase very much (King et al., 2014) if at all (Singh et al., 2006; Turunen et al., 2013). At the same time, the increased connectivity of the upper parts of the landscape and the greater conductivity of straightened streams and surface drains installed to receive tile water can increase the total water export from the landscape (Blann et al., 2009).
Although tile drains may have limited impact on total water movement off the landscape, they typically carry a significant part of the total annual runoff. King et al. (2014) measured tile contribution to stream flow on a silt loam to clay loam watershed in Ohio that ranged from 0 to 100% of total runoff in any month, with a mean annual value of 41%. This is similar to the 42% of total streamflow from tiles found by Macrae et al. (2007) on a watershed with coarse to medium texture soils in southern Ontario. Van Esbroeck et al. (2016) found a higher proportion of tile runoff at edge of field on three coarse to medium textured sites, ranging from 78 to 90% of total runoff. Tan and Zhang (2011) found that 96% of the total runoff, averaged over 5 years, was through tile drains on a clay soil in Essex County, ON, Canada.
Phosphorus export through tile drains in all of the above studies was less than the proportion of total flow, indicating that either movement of P from the surface to the tile drains was being partially impeded, or that the tile flow was a mix of surface runoff diverted to the tiles through macropores and water that had percolated through the soil matrix. Given the propensity of most soils in the tile drained regions to adsorb P (Richards et al., 1995; Wang et al., 2014), the latter mechanism seems much more likely, and has been proposed by a number of authors as an explanation for the P concentrations found in tile flow (Stamm et al., 1998; Chikhaoui et al., 2008; Van Bochove et al., 2010; Reid et al., 2012; Beven and Germann, 2013; Radcliffe et al., 2015; Jarvis et al., 2016). Further evidence that P transport to tile drains is occurring through macropores is that the proportion of particulate P in the tiles is similar to that in the surface runoff, when averaged over a year (Ball Coelho et al., 2010; Radcliffe et al., 2015; Pease et al., 2017), although there can be significant variability between individual flow events, and the application of fertilizer or manure can temporarily increase the proportion of dissolved P (Macrae et al., 2007). Within this framework, the main determinant of P movement to tile drains will be the partitioning of water reaching the tile drains between macropore flow, with a relatively high P concentration, and matrix flow which carries very little P. This partitioning is not well represented in most models of P transport (Radcliffe et al., 2015), but there has been some progress in empirical determination of macropore flow showing a strong influence of soil texture (Allaire et al., 2009; Eastman et al., 2010; Karahan and Erşahin, 2017). The textural influence may be directly affecting the propensity of the soil to form shrinkage cracks, or indirectly affect the population of anecic earthworms, both of which can contribute to macroporosity (van Bochove et al., 2007; Fox et al., 2008; Koestel et al., 2011; Jarvis et al., 2016). The general trend, where there have been direct comparisons, is for greater macropore flow in fine than coarse textured soils (Eastman et al., 2010).
Since the installation of tile drains reduces the volume of surface runoff, proper accounting for the contribution of tile drains to P transport requires estimation of the reduced surface runoff, as well as the macropore portion of tile flow as shown in Figure 2. Since the macropores with direct connection to the tiles are concentrated in a narrow strip over the tile drains, the spacing between the tile runs will influence the amount of P that could move to the tile. An additional complication is the extent of many subsurface drainage systems. Within an individual field, the catchment areas for surface runoff and subsurface runoff may correspond fairly closely, but modern tile drainage systems may encompass many fields and extend for a kilometer or more into the landscape. This represents a large increase in the connectivity of the landscape to surface water, and since there is essentially no mitigation of P in the tile flow and the drain outlets are generally directly into surface water, it can bypass the riparian buffers that can reduce the P entrained in surface runoff.
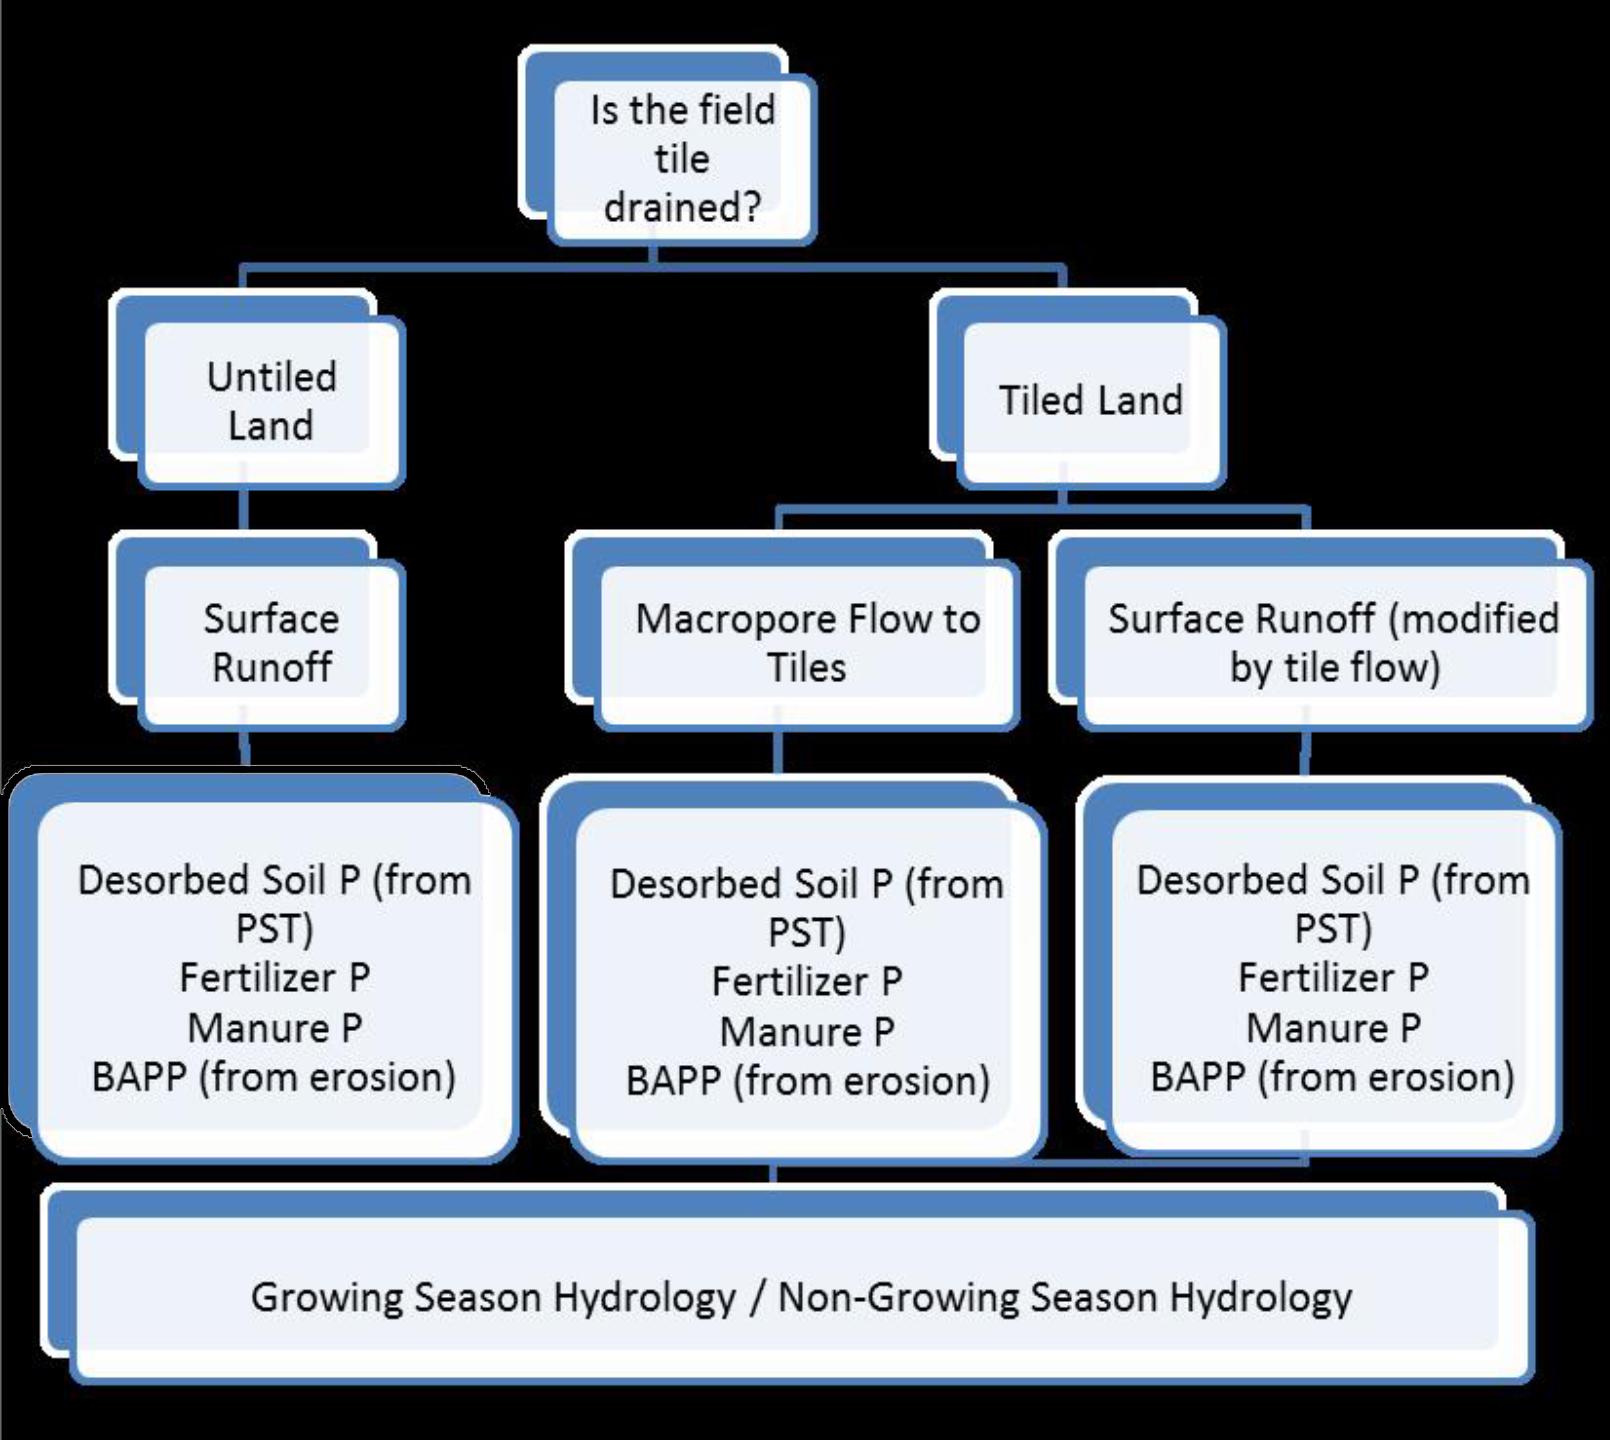
FIGURE 2. Flow chart to determine transport coefficients for various P sources in tiled or non-tiled agricultural fields.
Sub Surface Lateral Flow
Preferential flow is generally considered to be vertical, but there are situations where there are horizontal preferential pathways, often where there is an impervious layer beneath the surface that impedes vertical flow and creates a perched water table. Water reaching these lateral flow paths, either through vertical macropores or by matrix flow through a soil that is saturated with P, can be carried horizontally to side-hill seeps (where the impervious layer reaches the soil surface along a slope) or into drainage ditches that intersect the impervious layer. This is the dominant pathway for P loss in the Delmarva Peninsula (Kleinman et al., 2007, 2015a).
Mitigation From Edge-of-Field to Edge-of-Water
The sources of P from agricultural land, and the transport factors that are calculated are operating within the same geography, so the end result is an estimate of P delivery to the edge of the field. If this coincides with the shore of a water body it is a reasonable estimate of risk, but more often the field is at some distance from surface water, and runoff must travel over other fields or buffer areas where mitigation of the P losses could occur. The actual risk to surface water quality, therefore, will depend on the distance from the edge of field to the stream, and on the nature of the soils and vegetation in this area.
Mitigation of P runoff can occur in several ways. Particulate P can be trapped or filtered by growing vegetation, particularly if there is a dense sward of grasses (Butler et al., 2006). Surface runoff can infiltrate into the soil in a buffer zone, which will reduce both dissolved and particulate P (Leguédois et al., 2008; Dosskey et al., 2010). There can even be some mitigation of P in runoff over a field, as the P concentration in the runoff water reaches equilibrium with the soil surface. All of these mechanisms will be most effective if there is sheet flow, to maximize the area of interaction. Concentrated flow will have enough energy to travel through the buffer without any appreciable reduction in P (Dosskey et al., 2002).
This mitigation is generally accounted for in models as a delivery ratio. This may be a single coefficient for buffers of a given width, or there may be more complex models that account for landscape types and vegetation (Li et al., 2011). Neither of these approaches has been well calibrated, and this remains an area requiring further work.
The Component Model Structure
The principle of the component model structure is that each source has a unique transport modifier, and the product of each source × transport calculation is summed to determine the total risk of P loss. If taken to this extreme, the component model would become complex to the point of being impractical. Fortunately, it is possible to lump together many of the sources to simplify the calculations. The transport of dissolved P is going to be similar, for example, whether it came from applied fertilizer or released from frozen vegetation.
Even with the rationalization of transport coefficients, there are many possible combinations of source and transport which could make the model unwieldy. Anyone developing a P Index using this approach should apply judgment as to which components are most important for the conditions within their jurisdiction, and which can be safely excluded. This will mean that indexes will vary between jurisdictions, but if both are using the component structure the results should still be comparable. This structure also encourages an objective assessment of which components should be included or excluded, and a framework for explaining why there are differences across jurisdictional boundaries.
Key considerations in the development of a component P index are consistency of units, and ensuring that the weighting of each of the individual components is correct. Ignoring either of these details can result in a model that is highly skewed because one of the components is generating results on a different scale than the others, and so is off by an order of magnitude or more. One advantage of the component structure is that, while the models are not complex enough to generate P loadings from individual storm events, the results should correlate with water quality measurements over the annual time scale and so can be validated as to whether they meet the goal of being “directionally and magnitudinally correct” (Sharpley et al., 2012).
We will discuss the IROWC-P model as an example of the component structure in the Section “IROWC-P as an Example of P Loss Risk Assessment.”
Setting Categories for Risk of P Loss
The numbers generated by any index do not, without context, provide any useful information, so it is important to assign the results into categories. This will allow users to quickly determine if they are at a high or low risk. For risk indicators that cover a broad area, it will also facilitate visual representation of the data on a map. There are a number of ways to define risk categories, but two of the most common are to relate the categories to environmental outcomes (or reduction targets), or to use the frequency distribution of the index results to base the categories on percentiles.
The idea of classifying risk categories by environmental outcomes is attractive, but it overestimates the model’s ability to quantify the losses from the landscape. There is also a danger that the choice of thresholds, even if the model were accurate, would be set so that the highest level of risk would not exceed environmental outcomes, even though the majority of the catchment is already below that level. In this case, the categories could provide an unrealistically harsh perception of the performance of farmers in a region.
Another approach is to use the frequency distribution to separate the risk categories, either as even quartiles or quintiles, or using a skewed distribution of the percentiles. This latter approach can use the cumulative risk at each level to inform the setting of the categories, since a few very large scores at the top of the range can have a much greater impact than a large number of low scores. This focuses attention on the relatively few operations that contribute disproportionately to environmental impact, and allows for continuous improvement as the frequency distribution moves downward. It depends, however, on knowing the distribution of index scores. Since this is not possible before the use of the index is widespread, the distribution can be estimated by using Monte Carlo simulations as a proxy.
IROWC-P as an Example of P Loss Risk Assessment
Developing models to assess the risk of P loss from terrestrial systems is a balancing act between representing all of the source and transport processes as accurately as possible, the availability of input data at an appropriate level of detail to run a process-based model, and the complexity of the model, at a scale that is useful to the end user (Sharpley et al., 2002). One of the key challenges is that individual source and transport factors have been quantified through research, but there are few studies that account for the relative weighting of these factors in describing P losses at the field or landscape scale under varying soil types, topography, vegetation, P inputs and weather. Osmond et al. (2012b) found that P Indices developed using professional judgment about local conditions were more accurate at predicting runoff water quality than process based models. This may stem, in part, from imperfect representation of P loss processes in the model, or from over-parameterization where the errors associated with input variables propagate through the model to skew the final results (Vadas et al., 2013).
IROWC-P is one of the agri-environmental indicators developed by Agriculture and Agri-Food Canada (AAFC) to provide information on the status and trends of environmental performance by Canadian agricultural producers (Reid et al., 2016). Although this indicator operates at a regional rather than field scale – the basic spatial unit is a Soil Landscape of Canada (SLC) polygon, or 1:1,000,000 scale – the calculations used to estimate risk of P loss are parallel to those used in a field scale P Index. Each SLC polygon is treated as a virtual field, with input parameters to the model estimated from publicly available data. The version used in the last report was a multiplicative approach to P risk assessment, with a single transport coefficient, but it is currently being updated to a component model. The discussion in this paper will focus on the updated version, and on the algorithms used for determining risk of P loss but not the estimation procedures for the input parameters.
IROWC-P first determines the risk of P loss at the edge of field, and then applies a delivery ratio to estimate the proportion of this loss that reaches surface water. The source and transport factors for each of the components are summarized in Table 1.
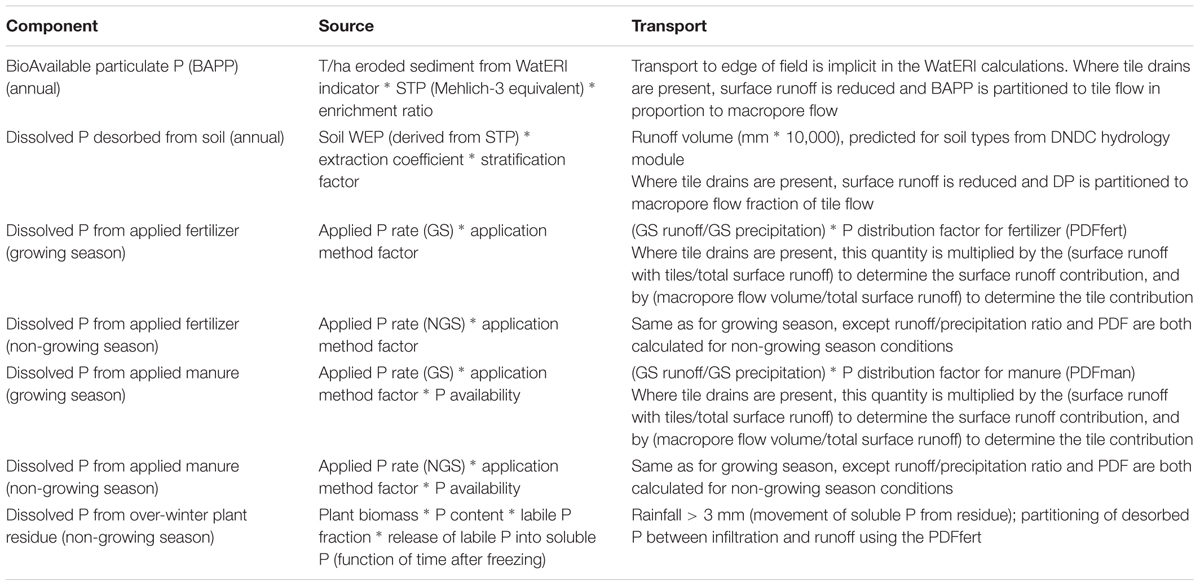
TABLE 1. Source and transport components in IROWC-P.
BioAvailable Particulate P
The developers of this indicator chose to express the results in terms of bioavailable P rather than total P to provide better information on the potential impact of P loss in different forms on water quality. The sediment loss to the edge of field is derived from the water erosion component of the AAFC Soil Erosion indicator (Lobb et al., 2016), and the bioavailable portion of this sediment is predicted from the STP levels according to the method of Sharpley and Smith (1993). A P enrichment factor is also included to account for the increased P concentrations in eroded sediment relative to the bulk soil in the field, particularly under small runoff events (Sharpley, 1980). The product of this equation is multiplied by a scaling factor to align the units of the outputs with the rest of the components in IROWC-P (Reid et al., 2016).
Soil erosion models combine sediment source and transport to predict delivery of sediment to the bottom of a slope or, in this case, to the edge of a field. A separate transport modifier is not required, except where tile drains are present. The tile drains reduce the amount of surface runoff, diverting that water into the tile drains, but also carrying the portion of the sediment that is carried with the portion of tile flow that has reached the tile through macropores rather than soil matrix flow. The partitioning of water between surface runoff and tile flow is predicted using the hydrology module of the DNDC model (Kröbel et al., 2010; Dutta et al., 2016; Guest et al., 2017), and the fraction of tile flow from macropores is derived from the probability of burrow flow (through anecic worm burrows) (Dadfar et al., 2010a) and crack flow (Dadfar et al., 2010b). In general, the macropore flow is highest for the fine and medium textured soils, and lowest for the coarse textured soils. Since there is compelling evidence that macropore flow represents diverted surface runoff, and that the ratio of dissolved to particulate P in macropore flow tracks that in surface runoff (Radcliffe et al., 2009; Reid et al., 2012), this partitioning of water into surface runoff, macropore tile flow and matrix tile flow will be used for all of the components.
Dissolved P Desorbed From Soil
This component represents the release of dissolved P from the soil surface as it interacts with runoff water. Water Extractable P (WEP), derived from the STP values, is used as an indicator of the amount of P that could be desorbed from the soil surface. This is multiplied by an extraction coefficient to convert the potentially desorbed P into actual dissolved P (Wang et al., 2010), and modified by a stratification factor based on tillage system to account for the build-up of P in the shallow surface layer that runoff water interacts with (Sharpley, 1985).
The transport factor for this component is the total volume of runoff, as predicted by the DNDC hydrology module (Dutta et al., 2016; Guest et al., 2017). This is assessed on an annual basis, since the pool of P available for desorption is very large relative to the actual losses and so does not vary over the year. Adjustments for tile drains are the same as for BAPP.
Dissolved P From Applied Fertilizer
Because the risk of P loss from applied nutrients is highest immediately after application and declines quickly as they interact with the soil (Vadas et al., 2008), both fertilizer and manure applications are assessed separately for the growing- and non-growing-seasons. Under Canadian climatic conditions, the partitioning of water between infiltration and runoff is markedly different between these two periods (Liu K. et al., 2013; Mahmood et al., 2017). The source factor for this component is the rate of fertilizer P applied, modified by an application factor to account for the proportion of fertilizer remaining on the soil surface. Incorporation has been shown to effectively shield the applied P from immediate losses (Sharpley, 1985), but there will always be a small amount remaining at the surface so the application factor estimates these proportions for different application systems.
The concentration of P in runoff water from applied fertilizer will be high relative to the P desorbed from soil, so the transport factor needs to account for the soil as a sink for this dissolved P. IROWC-P follows the method of Vadas et al. (2008), using a P distribution factor (PDF) multiplied by the ratio of runoff:precipitation to partition the applied P between adsorption by the soil and loss in runoff. The proportion of precipitation that runs off is much greater in the non-growing season under Canadian climatic conditions, so differentiating between P applications in the growing- versus non-growing-season is important for predicting risk of P loss. As noted above, the impact of tile drainage is predicted using the same algorithms as for BAPP.
Dissolved P From Applied Manure
The prediction of P losses from applied manure parallels that of applied fertilizer, with three exceptions. The source factor is based on the water extractable P in the manure, so only a portion of the total P applied is considered to be available for loss. The application factors are also modified to reflect the difficulty in achieving complete incorporation of the large volumes normally associated with manure application. On the transport side, the PDF is specific to manure (Vadas et al., 2004), reflecting the difference in the timing of P release from manure compared to fertilizer.
Dissolved P From Over-Wintering Vegetation
This component only applies to the non-growing season, from the time of killing frost until the spring freshet prior to the next growing season. The source factor for this component is the labile, or easily degraded, portion of the P contained in the above-ground portion of plant residues at the time of killing frost in the fall. This is calculated as the plant biomass times the P concentration times the labile fraction, which is assumed to be 0.50 after Damon et al. (2014). An exponential decay function is used to estimate the conversion of labile P to soluble P within the plant biomass from freezing until the P is leached out by rainfall. These calculations can be applied to crop residue remaining in the field post-harvest (in which case the harvest date is used as a proxy for plant maturity and the beginning of plant senescence) or for forage regrowth. The current version of the indicator is not assessing the P contributions from cover crops because of insufficient data regarding the area of cover crops, the biomass production and the P concentration, although it would be desirable to include this in future versions.
The transport of P from the frozen plant residues is in two steps, with the first being the leaching of the P out of the plant residue. It is assumed that rainfall must be >3 mm to initiate this process, or that the residue is in contact with meltwater from the accumulated snowpack, and that the dissolution of the soluble P in the residue follows a similar pattern to that of fertilizer P as described in Vadas et al. (2008), but with the duration of rainfall used by Vadas et al. (2008) replaced by the accumulated rainfall. The dissolved P that was then entrained in the runoff water was distributed between soil adsorption and runoff using the PDF for fertilizer (Vadas et al., 2009). Melt water runoff that occurs on frozen soils will carry much of the over-winter accumulation of soluble P from the field, because of limited infiltration.
Aggregate Risk of P Loss
Since the components are designed so that all of the outputs are at the same scale, the total risk of P loss at the edge of field is calculated by summing the values for each of the components.
Delivery Ratio From Edge of Field to Surface Water
To assess the potential impact of agricultural P losses on surface water quality, it is necessary to estimate how much of the P leaving the edge of a field actually reaches surface water. The underlying assumption in assessing connectivity to surface water is that there is mitigation of P losses with greater transport distance to surface water. Processes that could contribute to this mitigation include:
• infiltration of runoff water or trapping of water in ponds (Li et al., 2011), so less water (with its associated P load) reaches surface water, or
• trapping of sediment (Leguédois et al., 2008) or adsorption of dissolved P to the underlying soil (Sharpley et al., 1981), so the concentration of P in runoff water is reduced, or
• both operating simultaneously.
These processes are not well quantified, and have seldom been included in P transport models beyond rudimentary estimates. Gburek et al. (2006), for example, estimated the proportion of the landscape that was contributing surface runoff from the proportion of precipitation that contributed to increased streamflow during storm events. Other models have simply assumed a delivery ratio based on the measured P loading at a watershed scale, relative to modeled or measured P losses within fields in the watershed, but without any understanding in the processes involved in P delivery from the field to the stream.
The AAFC Soil Erosion indicator (Lobb et al., 2016) includes calculations for sediment reaching surface water based on the stream density (defined as the kilometers of shoreline per square kilometer of watershed), and the landform type and slope within the watershed. This has been modified to assume the greatest mitigation of BAPP losses in overland runoff, less mitigation of dissolved P in surface runoff, and no mitigation of either BAPP or dissolved P in tile flow.
Additional Considerations
Phosphorus losses in sub-surface lateral flow are not included as part of the IROWC-P model. The conditions favorable for this type of P transport from Canadian agricultural land are considered to be rare enough that ignoring it will not introduce a significant source of error in the estimates of P loss.
One of the desired outcomes from this indicator is an assessment of the impact of changes in management on the risk of P loss from agricultural landscapes, but extreme weather events can completely eclipse the effect of management changes in any given year. This could be addressed by using average weather conditions in model runs, so that regional variations in climate are accounted for but annual weather is de-emphasized. The drawback to this approach is that responses to weather conditions non-linear and losses from areas with more variable weather may be underestimated. Calculations for IROWC-P are conducted using weather data from each year within the 30-year window that makes up the climate norm, and then the results averaged.
Gaps and Next Steps
While the authors consider this revision of IROWC-P to be a significant advance in accurately representing the geographic distribution and temporal trends in the relative risk of P losses from Canadian agricultural land, there are still some areas in need of improvement. The individual components have been derived from a large body of scientific research, but not all of them have been validated for Canadian conditions. The aggregate values for edge of field losses are also in need of validation to ensure that the relative contribution from each of the components has been captured correctly. This model does not, nor was it intended to, provide a quantitative estimate of P loss from agricultural land during individual runoff events, so validation needs to be based on whether the relative P losses from contrasting fields matches the relative predicted risk of P loss, over an annual period or longer.
As previously mentioned, the delivery ratios from edge of field to surface water are an area of significant uncertainty. The scope of this issue means that it will require a large research effort to adequately address. The mandate to conduct this research, however, or the funding availability, often falls between the areas of responsibility of organizations with a primary focus on land management, and those focused on water quality impacts.
A perennial challenge for any regional or national scale indicator is the availability of input data to run the models. We do not know what each individual land manager is doing on their properties, so average or typical values are inferred from public data sources. In the case of IROWC-P, these values are based on interpretation of data from the Census of Agriculture, supplemented by data from surveys (Reid et al., 2016), but it is recognized that the information about nutrient management practices is extremely limited. In the United States, the Conservation Effects Assessment Program (CEAP, 2011) has addressed this issue through detailed interviews with a stratified sample of farmers within a region, but this requires a large resource commitment, and while it provides a more complete picture of individual farmer activities there is limited opportunity to assess how well this represents the population as a whole. We can expect future improvements in some of the input data using remote sensing, which can detect topography and soil moisture, and enumerate areas of different crops or amount of soil cover, but this will be of little use for capturing data about management. Better methods of data collection will improve the accuracy of the model predictions, but they will need to meet the multiple requirements of protecting individual privacy, ensuring accuracy of the collected data, and being economical to collect and store.
The focus to this point has been on understanding the spatial variation in risk of P loss to surface water, and how it is changing over time. The indicator has been designed in such a way, however, that data for individual crops or farming systems can be extracted, although it will have to be at a coarser spatial scale to be meaningful. This creates the opportunity to work with commodity organizations to generate intensity based indicators of risk of P loss per unit of production. An additional benefit to this type of assessment might be the ability for individual farmers to compare the performance of their own farms to regional averages.
Summary and Conclusion
Phosphorus loss from a landscape is not a single process, but rather is the aggregate of a number of different source × transport interactions. Which of these components will dominate in a particular area, or on a particular farm, is a function of climate, soils, topography, and both long- and short-term management. The choice of options to mitigate these losses will, necessarily, be equally complex. It also renders useless the application of static coefficients to predict the effectiveness of mitigation practices, since the effectiveness of each practice will depend on the conditions where it is applied.
Progress is being made in developing risk indicators that address this complexity in a meaningful way, although much work remains to be done. IROWC-P has been presented as one example of how this could be approached, but other examples include models developed in North Carolina (N.C. PLAT Committee, 2005) and Wisconsin (Vadas et al., 2013). It is likely that selecting the best features from each of these component models for the individual conditions within a given jurisdiction will result in the most accurate representation of P loss risk.
Author Contributions
The majority of the writing in this paper was contributed by KR, with significant additions from KS and BM.
Funding
Research and development activities described in this paper were funded as part of the Agriculture and Agri-Food Canada internal Research, Development and Transfer project funds.
Conflict of Interest Statement
The authors declare that the research was conducted in the absence of any commercial or financial relationships that could be construed as a potential conflict of interest.
Acknowledgments
The authors would like to acknowledge the contributions of all of the scientists and professionals who contributed to the development of the Sustainability Metrics for Canadian Agriculture, as well as the programs which preceded it (Agri-Environmental Indicators for Canadian Agriculture, and the National Agri-Environmental Standards Initiative).
References
Allaire, S. E., Roulier, S., and Cessna, A. J. (2009). Quantifying preferential flow in soils: a review of different techniques. J. Hydrol. 378, 179–204. doi: 10.1016/j.jhydrol.2009.08.013
Allen, B. L., Mallarino, A. P., Lore, J. F., Baker, J. L., and Haq, M. U. (2012). Phosphorus lateral movement through subsoil to subsurface tile drains. Soil Sci. Soc. Am. J. 76, 710–717. doi: 10.2136/sssaj2011.0150
Anderson, K. A., and Downing, J. A. (2006). Dry and wet atmospheric deposition of nitrogen, phosphorus and silicon in an agricultural region. Water Air Soil Pollut. 176, 351–374. doi: 10.1007/s11270-006-9172-4
Auer, M. T., Tomlinson, L. M., Higgins, S. N., Malkin, S. Y., Howell, E. T., and Bootsma, H. A. (2010). Great lakes Cladophora in the 21st century: same algae—different ecosystem. J. Great Lakes Res. 36, 248–255. doi: 10.1016/j.jglr.2010.03.001
Baker, D., Richards, R., and Crumrine, J. (2007). Increasing Dissolved Phosphorus Loading to Lake Erie from Agricultural Watersheds: a Conservation Tillage Trade-Off. Tampa, FL: Soil and Water Conservation Society.
Baker, D. B., Confesor, R., Ewing, D. E., Johnson, L. T., Kramer, J. W., and Merryfield, B. J. (2014). Phosphorus loading to lake erie from the Maumee, Sandusky and Cuyahoga rivers: the importance of bioavailability. J. Great Lakes Res. 40, 502–517. doi: 10.1016/j.jglr.2014.05.001
Ball Coelho, B., Bruin, A. J., Staton, S., and Hayman, D. (2010). Sediment and nutrient contributions from subsurface drains and point sources to an agricultural watershed. Air Soil Water Res. 3, 1–21. doi: 10.4137/ASWR.S4471
Barlow-Busch, L., Baulch, H. M., and Taylor, W. D. (2006). Phosphate uptake by seston and epilithon in the Grand River, southern Ontario. Aquat. Sci. 68, 181–192. doi: 10.1007/s00027-006-0806-9
Bechmann, M. E., Kleinman, P. J. A., Sharpley, A. N., and Saporito, L. S. (2005). Freeze–thaw effects on phosphorus loss in runoff from manured and catch-cropped soils. J. Environ. Qual. 34, 2301–2309. doi: 10.2134/jeq2004.0415
Beven, K., and Germann, P. (2013). Macropores and water flow in soils revisited. Water Resour. Res. 49, 3071–3092. doi: 10.1002/wrcr.20156
Blann, K. L., Anderson, J. L., Sands, G. R., and Vondracek, B. (2009). Effects of agricultural drainage on aquatic ecosystems: a review. Crit. Rev. Environ. Sci. Technol. 39, 909–1001. doi: 10.1080/10643380801977966
Borda, T., Celi, L., Bünemann, E. K., Oberson, A., Frossard, E., and Barberis, E. (2014). Fertilization strategies affect phosphorus forms and release from soils and suspended solids. J. Environ. Qual. 43, 1024–1031. doi: 10.2134/jeq2013.11.0436
Bouffard, D., Ackerman, J. D., and Boegman, L. (2013). Factors affecting the development and dynamics of hypoxia in a large shallow stratified lake: hourly to seasonal patterns. Water Resour. Res. 49, 2380–2394. doi: 10.1002/wrcr.20241
Bunting, L., Leavitt, P. R., Simpson, G. L., Wissel, B., Laird, K. R., Cumming, B. F., et al. (2016). Increased variability and sudden ecosystem state change in Lake Winnipeg, Canada, caused by 20th century agriculture. Limnol. Oceanogr. 61, 2090–2107. doi: 10.1002/lno.10355
Butler, D. M., Franklin, D. H., Ranells, N. N., Poore, M. H., and Green, J. T. (2006). Ground cover impacts on sediment and phosphorus export from manured riparian pasture. J. Environ. Qual. 35, 2178–2185. doi: 10.2134/jeq2005.0351
CEAP. (2011). Assessment of the Effects of Conservation Practices on Cultivated Cropland in the Great Lakes Region. Washington, DC: USDA.
Chardon, W. J., and Schoumans, O. F. (2002). Phosphorus Losses from Agricultural Soils: Processes at the Field Scale. Wageningen: Alterra.
Chikhaoui, M., Madramootoo, C. A., Eastman, M., and Michaud, A. (2008). “Estimating preferential flow to agricultural tile drains,” in Proceedings of the 2008 ASABE Annual International Meeting, Providence.
Committee, N. C. P. L. A. T. (2005). North Carolina Phosphorus Loss Assessment: I. Model Description and II. Scientific Basis and Supporting Literature, Department of Soil Science. Raleigh, NC: North Carolina State University.
Condron, L. M., and Newman, S. (2011). Revisiting the fundamentals of phosphorus fractionation of sediments and soils. J. Soils Sediments 11, 830–840. doi: 10.1007/s11368-011-0363-2
Conroy, J. D., Kane, D. D., Briland, R. D., and Culver, D. A. (2014). Systemic, early-season Microcystis blooms in western Lake Erie and two of its major agricultural tributaries (Maumee and Sandusky rivers). J. Great Lakes Res. 40, 518–523. doi: 10.1016/j.jglr.2014.04.015
Dadfar, H., Allaire, S. E., Bochove, E. V., Denault, J.-T., Thériault, G., and Charles, A. (2010a). Likelihood of burrow flow in Canadian agricultural lands. J. Hydrol. 386, 142–159. doi: 10.1016/j.jhydrol.2010.03.016
Dadfar, H., Allaire, S. E., De Jong, R., van Bochove, E., Denault, J.-T., Theriault, G., et al. (2010b). Development of a method for estimating the likelihood of crack flow in Canadian agricultural soils at the landscape scale. Can. J. Soil Sci. 90, 129–149. doi: 10.4141/CJSS09066
Dahlke, H. E., Easton, Z. M., Fuka, D. R., Lyon, S. W., and Steenhuis, T. S. (2009). Modelling variable source area dynamics in a CEAP watershed. Ecohydrology 2, 337–349. doi: 10.1002/eco.58
Damon, P. M., Bowden, B., Rose, T., and Rengel, Z. (2014). Crop residue contributions to phosphorus pools in agricultural soils: a review. Soil Biol. Biochem. 74, 127–137. doi: 10.1016/j.soilbio.2014.03.003
Depew, D. C., Houben, A. J., Guildford, S. J., and Hecky, R. E. (2011). Distribution of nuisance Cladophora in the lower Great lakes: patterns with land use, near shore water quality and dreissenid abundance. J. Great Lakes Res. 37, 656–671. doi: 10.1016/j.jglr.2011.08.011
DePinto, J. V., Young, T. C., and Martin, S. C. (1981). Algal-available phosphorus in suspended sediments from lower great lakes tributaries. J. Great Lakes Res. 7, 311–325. doi: 10.1016/S0380-1330(81)72059-8
Dosskey, M. G., Helmers, M. J., Eisenhauer, D. E., Franti, T. G., and Hoagland, K. D. (2002). Assessment of concentrated flow through riparian buffers. J. Soil Water Conserv. 57, 336–343.
Dosskey, M. G., Vidon, P., Gurwick, N. P., Allan, C. J., Duval, T. P., and Lowrance, R. (2010). The role of riparian vegetation in protecting and improving chemical water quality in streams1. JAWRA J. Am. Water Res. Assoc. 46, 261–277. doi: 10.1111/j.1752-1688.2010.00419.x
Dougherty, W. J., Nash, D. M., Cox, J. W., Chittleborough, D. J., and Fleming, N. K. (2008). Small-scale, high-intensity rainfall simulation under-estimates natural runoff P concentrations from pastures on hill-slopes. Soil Res. 46, 694–702. doi: 10.1071/SR07232
Dunkerley, D. (2017). An approach to analysing plot scale infiltration and runoff responses to rainfall of fluctuating intensity. Hydrol. Process. 31, 191–206. doi: 10.1002/hyp.10990
Dutta, B., Grant, B. B., Congreves, K. A., Smith, W. N., Wagner-Riddle, C., VanderZaag, A. C., et al. (2017). Characterising effects of management practices, snow cover, and soil texture on soil temperature: model development in DNDC. Biosyst. Eng. 168, 54–72. doi: 10.1016/j.biosystemseng.2017.02.001
Dutta, B., Smith, W. N., Grant, B. B., Pattey, E., Desjardins, R. L., and Li, C. (2016). Model development in DNDC for the prediction of evapotranspiration and water use in temperate field cropping systems. Environ. Model. Softw. 80, 9–25. doi: 10.1016/j.envsoft.2016.02.014
Eastman, M., Gollamudi, A., Stämpfli, N., Madramootoo, C. A., and Sarangi, A. (2010). Comparative evaluation of phosphorus losses from subsurface and naturally drained agricultural fields in the Pike River watershed of Quebec. Canada. Agric. Water Manag. 97, 596–604. doi: 10.1016/j.agwat.2009.11.010
Easton, Z. M., Fuka, D. R., Walter, M. T., Cowan, D. M., Schneiderman, E. M., and Steenhuis, T. S. (2008). Re-conceptualizing the soil and water assessment tool (SWAT) model to predict runoff from variable source areas. J. Hydrol. 348, 279–291. doi: 10.1016/j.jhydrol.2007.10.008
Elliott, J. (2013). Evaluating the potential contribution of vegetation as a nutrient source in snowmelt runoff. Can. J. Soil Sci. 93, 435–443. doi: 10.4141/cjss2012-050
Ellison, M. E., and Brett, M. T. (2006). Particulate phosphorus bioavailability as a function of stream flow and land cover. Water Res. 40, 1258–1268. doi: 10.1016/j.watres.2006.01.016
Fang, F., Brezonik, P. L., Mulla, D. J., and Hatch, L. K. (2002). Estimating runoff phosphorus losses from calcareous soils in the Minnesota River Basin. J. Environ. Qual. 31, 1918–1929. doi: 10.2134/jeq2002.1918
Flanagan, D. C., Gilley, J. E., and Franti, T. G. (2007). Water Erosion Prediction Project (WEPP): development history, model capabilities, and future enhancements. Trans. ASABE 50, 1603–1612. doi: 10.13031/2013.23968
Foster, G. R., Toy, T. E., and Renard, K. G. (2003). “Comparison of the USLE, RUSLE1.06c, and RUSLE2 for application to highly disturbed lands,” in Proceedings of the 1st Interagency Conference on Research in Watersheds, Washington, DC.
Fox, C. A., Jarvis, I., Behan-Pelletier, V., Dalpe, Y., Clapperton, J., Prevost, D., et al. (2008). “Progress towards developing a soil biodiversity indicator for Canada,” in Agricultural Impacts on Soil Erosion and Soil Biodiversity: Developing Indicators for Policy Analysis, ed. R. Francaviglia (Paris: OECD).
Garen, D. C., and Moore, D. S. (2005). Curve number hydrology in water quality modeling: uses, abuses and future directions. JAWRA J. Am. Water Resour. Assoc. 41, 377–388. doi: 10.1111/j.1752-1688.2005.tb03742.x
Gburek, W. J., Drungil, C. C., Srinivasan, M. S., Needelman, B. A., and Woodward, D. E. (2002). Variable-source-area controls on phosphorus transport: bridging the gap between research and design. J. Soil Water Conserv. 57, 534–543.
Gburek, W. J., Sharpley, A. N., and Beegle, D. B. (2006). Incorporation of Variable Source Area Hydrology in the Phosphorus Index: a Paradigm for Improving Relevancy of Watershed Research. Washington,DC: USDA.
Gburek, W. J., Sharpley, A. N., Heathwaite, L., and Folmar, G. J. (2000). Phosphorus management at the watershed scale: a modification of the phosphorus index. J. Environ. Qual. 29, 130–144. doi: 10.2134/jeq2000.00472425002900010017x
Glæsner, N., Kjaergaard, C., Rubæk, G. H., and Magid, J. (2013). Relation between soil P test values and mobilization of dissolved and particulate P from the plough layer of typical Danish soils from a long-term field experiment with applied P fertilizers. Soil Use Manag. 29, 297–305. doi: 10.1111/sum.12060
Guest, G., Kröbel, R., Grant, B., Smith, W., Sansoulet, J., Pattey, E., et al. (2017). Model comparison of soil processes in eastern Canada using DayCent, DNDC and STICS. Nutr. Cycling Agroecosyst. 109, 211–232. doi: 10.1007/s10705-017-9880-8
Haygarth, P. M., Condron, L. M., Heathwaite, A. L., Turner, B. L., and Harris, G. P. (2005). The phosphorus transfer continuum: linking source to impact with an interdisciplinary and multi-scaled approach. Sci. Total Environ. 344, 5–14. doi: 10.1016/j.scitotenv.2005.02.001
Heathwaite, L., Haygarth, P., Matthews, R., Preedy, N., and Butler, P. (2005). Evaluating colloidal phosphorus delivery to surface waters from diffuse agricultural sources. J. Environ. Qual. 34, 287–298.
Howell, E. T., and Dove, A. (2017). Chronic nutrient loading from Lake Erie affecting water quality and nuisance algae on the St. Catharines shores of Lake Ontario. J. Great Lakes Res. 43, 899–915. doi: 10.1016/j.jglr.2017.06.006
Jarvie, H. P., Johnson, L. T., Sharpley, A. N., Smith, D. R., Baker, D. B., Bruulsema, T. W., et al. (2017). Increased soluble phosphorus loads to lake Erie: unintended consequences of conservation practices? J. Environ. Qual. 46, 123–132. doi: 10.2134/jeq2016.07.0248
Jarvie, H. P., Sharpley, A. N., Withers, P. J. A., Scott, J. T., Haggard, B. E., and Neal, C. (2013). Phosphorus mitigation to control river eutrophication: murky waters, inconvenient truths, and “Postnormal” science. J. Environ. Qual. 42, 295–304. doi: 10.2134/jeq2012.0085
Jarvis, N., Koestel, J., and Larsbo, M. (2016). Understanding preferential flow in the vadose zone: recent advances and future prospects. Vadose Zone J. 15, 1–11. doi: 10.2136/vzj2016.09.0075
Johannesson, G. H., Lauzon, J., Crolla, A., Gilroyed, B., Vanderzaag, A., and Gordon, R. (2017). Impact of manure storage conditions and time on decomposition of and losses from liquid dairy manure stored in a temperate climate. Can. J. Soil Sci. 98, 148–160. doi: 10.1139/CJSS-2017-0083
Joosse, P. J., and Baker, D. B. (2011). Context for re-evaluating agricultural source phosphorus loadings to the great Lakes. Can. J. Soil Sci. 91, 317–327. doi: 10.4141/cjss10005
Karahan, G., and Erşahin, S. (2017). Relating macropore flow to soil parametric and morphological variables. Soil Sci. Soc. Am. J. 81, 1014–1024. doi: 10.2136/sssaj2016.10.0327
Kerr, J. M., DePinto, J. V., McGrath, D., Sowa, S. P., and Swinton, S. M. (2016). Sustainable management of great Lakes watersheds dominated by agricultural land use. J. Great Lakes Res. 42, 1252–1259. doi: 10.1016/j.jglr.2016.10.001
King, K. W., Fausey, N. R., and Williams, M. R. (2014). Effect of subsurface drainage on streamflow in an agricultural headwater watershed. J. Hydrol. 519(Part A), 438–445. doi: 10.1016/j.jhydrol.2014.07.035
King, K. W., Williams, M. R., Macrae, M. L., Fausey, N. R., Frankenberger, J., Smith, D. R., et al. (2015). Phosphorus transport in agricultural subsurface drainage: a review. J. Environ. Qual. 44, 467–485. doi: 10.2134/jeq2014.04.0163
Kinnell, P. I. A. (2008). Discussion: misrepresentation of the USLE in ‘Is sediment delivery a fallacy?’. Earth Surf. Process. Landf. 33, 1627–1629. doi: 10.1002/esp.1629
Kirchmann, H., and Wessling, J. (2017). Kinetics of inorganic and organic P release from red clover (Trifolium pratense L.) and ryegrass (Lolium multiflorum L.) upon frost or drying. Acta Agric. Scand. B Soil Plant Sci. 67, 693–696. doi: 10.1080/09064710.2017.1339823
Kleinman, P. J. A., Allen, A. L., Needelman, B. A., Sharpley, A. N., Vadas, P. A., Saporito, L. S., et al. (2007). Dynamics of phosphorus transfers from heavily manured coastal plain soils to drainage ditches. J. Soil Water Conserv. 62, 225–235.
Kleinman, P. J. A., Church, C., Saporito, L. S., McGrath, J. M., Reiter, M. S., Allen, A. L., et al. (2015a). Phosphorus leaching from agricultural soils of the Delmarva Peninsula. USA. J. Environ. Qual. 44, 524–534. doi: 10.2134/jeq2014.07.0301
Kleinman, P. J. A., Smith, D. R., Bolster, C. H., and Easton, Z. M. (2015b). Phosphorus fate, management, and modeling in artificially drained systems. J. Environ. Qual. 44, 460–466. doi: 10.2134/jeq2015.02.0090
Kleinman, P. J. A., Sharpley, A. N., Wolf, A. M., Beegle, D. B., Elliott, H. A., Weld, J. L., et al. (2006). Developing an environmental manure test for the phosphorus index. Commun. Soil Sci. Plant Anal. 37, 2137–2155. doi: 10.1080/00103620600817242
Kleinman, P. J. A., Sharpley, A. N., Wolf, A. M., Beegle, D. B., and Moore, P. A. (2002). Measuring water-extractable phosphorus in manure as an indicator of phosphorus in runoff. Soil Sci. Soc. Am. J. 66, 2009–2015. doi: 10.2136/sssaj2002.2009
Kleinman, P. J. A., Wolf, A. M., Sharpley, A. N., Beegle, D. B., and Saporito, L. S. (2005). Survey of water-extractable phosphorus in livestock manures. Soil Sci. Soc. Am. J. 69, 701–708. doi: 10.2136/sssaj2004.0099
Koestel, J. K., Moeys, J., and Jarvis, N. J. (2011). Meta-analysis of the effects of soil properties, site factors and experimental conditions on preferential solute transport. Hydrol. Earth Syst. Sci. Discuss. 8, 10007–10052. doi: 10.5194/hessd-8-10007-2011
Kröbel, R., Sun, Q., Ingwersen, J., Chen, X., Zhang, F., Müller, T., et al. (2010). Modelling water dynamics with DNDC and DAISY in a soil of the North China Plain: a comparative study. Environ. Model. Softw. 25, 583–601. doi: 10.1016/j.envsoft.2009.09.003
Leguédois, S., Ellis, T. W., Hairsine, P. B., and Tongway, D. J. (2008). Sediment trapping by a tree belt: processes and consequences for sediment delivery. Hydrol. Process. 22, 3523–3534. doi: 10.1002/hyp.6957
Lemunyon, J. L., and Gilbert, R. G. (1993). The concept and need for a phosphorus assessment tool. J. Prod. Agric. 6, 483–486. doi: 10.2134/jpa1993.0483
Li, S., Elliott, J. A., Tiessen, K. H. D., Yarotski, J., Lobb, D. A., and Flaten, D. N. (2011). The effects of multiple beneficial management practices on hydrology and nutrient losses in a small watershed in the canadian prairies. J. Environ. Qual. 40, 1627–1642. doi: 10.2134/jeq2011.0054
Lin, P., and Guo, L. (2016). Dynamic changes in the abundance and chemical speciation of dissolved and particulate phosphorus across the river-lake interface in southwest Lake Michigan. Limnol. Oceanogr. 61, 771–789. doi: 10.1002/lno.10254
Little, J. L., Nolan, S. C., Casson, J. P., and Olson, B. M. (2007). Relationships between soil and runoff phosphorus in small alberta watersheds. J. Environ. Qual. 36, 1289–1300. doi: 10.2134/jeq2006.0502
Liu, J., Khalaf, R., Ulén, B., and Bergkvist, G. (2013). Potential phosphorus release from catch crop shoots and roots after freezing-thawing. Plant Soil 371, 543–557. doi: 10.1007/s11104-013-1716-y
Liu, K., Elliott, J. A., Lobb, D. A., Flaten, D. N., and Yarotski, J. (2013). Critical factors affecting field-scale losses of nitrogen and phosphorus in spring snowmelt runoff in the Canadian prairies. J. Environ. Qual. 42, 484–496. doi: 10.2134/jeq2012.0385
Liu, K., Elliott, J. A., Lobb, D. A., Flaten, D. N., and Yarotski, J. (2014). Nutrient and sediment losses in snowmelt runoff from perennial forage and annual cropland in the Canadian prairies. J. Environ. Qual. 43, 1644–1655. doi: 10.2134/jeq2014.01.0040
Lobb, D. A., Li, S. T., and McConkey, B. G. (2016). “Soil Erosion,” in Environmental Sustainability of Canadian Agriculture: Agri-Environmental Indicator Report Series, ed. W. Eilers (Ottawa: Agriculture and Agri-Food Canada), 79–100.
Lozier, T. M., Macrae, M. L., Brunke, R., and Van Eerd, L. L. (2017). Release of phosphorus from crop residue and cover crops over the non-growing season in a cool temperate region. Agric. Water Manag. 189, 39–51. doi: 10.1016/j.agwat.2017.04.015
Lyon, S. W., McHale, M. R., Walter, M. T., and Steenhuis, T. S. (2006). The impact of runoff generation mechanisms on the location of critical source areas. J. Am. Water Resour. Assoc. 42, 793–804. doi: 10.1111/j.1752-1688.2006.tb04493.x
Macrae, M. L., English, M. C., Schiff, S. L., and Stone, M. (2007). Intra-annual variability in the contribution of tile drains to basin discharge and phosphorus export in a first-order agricultural catchment. Agric. Water Manag. 92, 171–182. doi: 10.1016/j.agwat.2007.05.015
Mahmood, T. H., Pomeroy, J. W., Wheater, H. S., and Baulch, H. M. (2017). Hydrological responses to climatic variability in a cold agricultural region. Hydrol. Process. 31, 854–870. doi: 10.1002/hyp.11064
McGrath, J. M., Penn, C. J., and Coale, F. J. (2013). A modelling approach to the design of in situ agricultural drainage filters. Soil Use Manag. 29, 155–161. doi: 10.1111/j.1475-2743.2011.00381.x
Michaud, A. R., Lauzier, R., and Laverdiere, M. R. (2004). “Temporal and spatial variability in non-point source phosphorus in relation to agricultural production and terrestrial indicators: the Beaver Brook case study, Pike River basin, Quebec,” in Lake Champlain: Partnership and Research in the New Millenium, ed. T. Mihuc (Dordrecht: Kluwer Academic/Plenum Pub), 97–121.
Miller, M. H., Beauchamp, E. G., and Lauzon, J. D. (1994). Leaching of nitrogen and phosphorus from the biomass of three cover crop species. J. Environ. Qual. 23, 267–272. doi: 10.2134/jeq1994.00472425002300020007x
OLEPTF (2010). Ohio Lake Erie Phosphorus Task Force Final Report. Columbus, OH: Ohio Environmental Protection Agency.
Osmond, D., Meals, D., Hoag, D., Arabi, M., Luloff, A., Jennings, G., et al. (2012a). Improving conservation practices programming to protect water quality in agricultural watersheds: lessons learned from the National Institute of Food and Agriculture-Conservation Effects Assessment Project. J. Soil Water Conserv. 67, 122A–127A. doi: 10.2489/jswc.67.5.122A
Osmond, D., Sharpley, A., Bolster, C., Cabrera, M., Feagley, S., Lee, B., et al. (2012b). Comparing phosphorus indices from twelve southern U.S. states against monitored phosphorus loads from six prior southern studies. J. Environ. Qual. 41, 1741–1749. doi: 10.2134/jeq2012.0013
Pease, L. A., King, K. W., Williams, M. R., LaBarge, G. A., Duncan, E. W., and Fausey, N. R. (2017). Phosphorus export from artificially drained fields across the eastern corn belt. J. Great Lakes Res. 44, 43–53. doi: 10.1016/j.jglr.2017.11.009
Pomeroy, J. W., Gray, D. M., Brown, T., Hedstrom, N. R., Quinton, W. L., Granger, R. J., et al. (2007). The cold regions hydrological model: a platform for basing process representation and model structure on physical evidence. Hydrol. Process. 21, 2650–2667. doi: 10.1002/hyp.6787
Radcliffe, D. E., Freer, J., and Schoumans, O. (2009). Diffuse phosphorus models in the United States and Europe: their usages, scales, and uncertainties. J. Environ. Qual. 38, 1956–1967. doi: 10.2134/jeq2008.0060
Radcliffe, D. E., Reid, D. K., Blombäck, K., Bolster, C. H., Collick, A. S., Easton, Z. M., et al. (2015). Applicability of models to predict phosphorus losses in drained fields: a review. J. Environ. Qual. 44, 614–628. doi: 10.2134/jeq2014.05.0220
Reid, D. K. (2011). A modified Ontario P index as a tool for on-farm phosphorus management. Can. J. Soil Sci. 91, 455–466. doi: 10.4141/CJSS09088
Reid, D. K., Ball, B., and Zhang, T. Q. (2012). Accounting for the risks of phosphorus losses through tile drains in a P index. J. Environ. Qual. 41, 1720–1729. doi: 10.2134/jeq2012.0238
Reid, D. K., Western, W., Rounce, T., Bogdan, D., Churchill, J., van Bochove, E., et al. (2016). “Risk of water contamination by phosphorus (IROWC-P),” in Environmental Sustainability of Canadian Agriculture: Agri-Environmental Indicator Report Series, ed. W. Eilers (Ottawa: Agriculture and Agri Food Canada), 131–142.
Renard, K. G., Foster, G. R., Weesies, G. A., and Porter, J. P. (1995). RUSLE: revised universal soil loss equation. J. Soil Water Conserv. 46, 30–33.
Reutter, J. M., Ciborowski, J., DePinto, J., Bade, D., Baker, D., and Bridgeman, T. B. (eds). (2011). “Lake Erie nutrient loading and harmful algal blooms,” in Research Findings and Management Implications (Columbus, OH: Final Report of the Lake Erie Millennium Network Synthesis Team).
Richards, J. E., Bates, T. E., and Sheppard, S. C. (1995). Changes in the forms and distribution of soil phosphorus due to long-term corn production. Can. J. Soil Sci. 75, 311–318. doi: 10.4141/cjss95-045
Roberson, T., Bundy, L. G., and Andraski, T. W. (2007) Freezing and drying effects on potential plant contributions to phosphorus in runoff. J. Environ. Qual. 36, 532–539. doi: 10.2134/jeq2006.0169
Scavia, D., David Allan, J., Arend, K. K., Bartell, S., Beletsky, D., Bosch, N. S., et al. (2014). Assessing and addressing the re-eutrophication of Lake Erie: central basin hypoxia. J. Great Lakes Res. 40, 226–246. doi: 10.1016/j.jglr.2014.02.004
Schneiderman, E. M., Steenhuis, T. S., Thongs, D. J., Easton, Z. M., Zion, M. S., Neal, A. L., et al. (2007). Incorporating variable source area hydrology into a curve-number-based watershed model. Hydrol. Process. 21, 3420–3430. doi: 10.1002/hyp.6556
Sharpley, A., Beegle, D., Bolster, C., Good, L., Joern, B., Ketterings, Q., et al. (2012). Phosphorus indices: why we need to take stock of how we are doing. J. Environ. Qual. 41, 1711–1719. doi: 10.2134/jeq2012.0040
Sharpley, A., Daniel, T., Sims, T., Lemunyon, J. L., Stevens, R., and Parry, R. (2003). Agricultural Phosphorus and Eutrophication. Washington, DC: United States Department of Agriculture.
Sharpley, A., and Moyer, B. (2000). Phosphorus forms in manure and compost and their release during simulated rainfall. J. Environ. Qual. 29, 1462–1469. doi: 10.2134/jeq2000.00472425002900050012x
Sharpley, A. N. (1980). The enrichment of soil phosphorus in runoff sediments. J. Environ. Qual. 9, 521–526. doi: 10.2134/jeq1980.00472425000900030039x
Sharpley, A. N. (1985). Depth of surface soil-runoff interaction as affected by rainfall, soil slope, and management1. Soil Sci. Soc. Am. J. 49, 1010–1015. doi: 10.2136/sssaj1985.03615995004900040044x
Sharpley, A. N. (1995). Soil phosphorus dynamics: agronomic and environmental impacts. Ecol. Eng. 5, 261–279. doi: 10.1016/0925-8574(95)00027-5
Sharpley, A. N., Kleinman, P. J. A., McDowell, R. W., Gitau, M., and Bryant, R. B. (2002). Modeling phosphorus transport in agricultural watersheds: processes and possibilities. J. Soil Water Conserv. 57, 425–439.
Sharpley, A. N., Menzel, R. G., Smith, S. J., Rhoades, E. D., and Olness, A. E. (1981). The sorption of soluble phosphorus by soil material during transport in runoff from cropped and grassed watersheds1. J. Environ. Qual. 10, 211–215. doi: 10.2134/jeq1981.00472425001000020018x
Sharpley, A. N., and Smith, S. J. (1993). Prediction of bioavailable phosphorus loss in agricultural runoff. J. Environ. Qual. 22, 32–37. doi: 10.2134/jeq1993.00472425002200010004x
Sharpley, A. N., Smith, S. J., Jones, O. R., Berg, W. A., and Coleman, G. A. (1992). The transport of bioavailable phosphorus in agricultural runoff. J. Environ. Qual. 21, 30–35. doi: 10.2134/jeq1992.00472425002100010003x
Sharpley, A. N., Troeger, W. W., and Smith, S. J. (1991). The measurement of bioavailable phosphorus in agricultural runoff. J. Environ. Qual. 20, 235–238. doi: 10.2134/jeq1991.00472425002000010037x
Shigaki, F., Sharpley, A., and Prochnow, L. I. (2007). Rainfall intensity and phosphorus source effects on phosphorus transport in surface runoff from soil trays. Sci. Total Environ. 373, 334–343. doi: 10.1016/j.scitotenv.2006.10.048
Simic, S. B., Ðorðevic, N. B., and Milosevic, D. (2017). The relationship between the dominance of Cyanobacteria species and environmental variables in different seasons and after extreme precipitation. Fundam. Appl. Limnol. 190, 1–11. doi: 10.1127/fal/2017/0975
Singh, P. K., Gaur, M. L., Mishra, S. K., and Rawat, S. S. (2010). An updated hydrological review on recent advancements in soil conservation service-curve number technique. J. Water Clim. Change 1, 118–134. doi: 10.2166/wcc.2010.022
Singh, R., Helmers, M. J., and Qi, Z. (2006). Calibration and validation of DRAINMOD to design subsurface drainage systems for Iowa’s tile landscapes. Agric. Water Manag. 85, 221–232. doi: 10.1016/j.agwat.2006.05.013
Sloan, B. P., Basu, N. B., and Mantilla, R. (2016). Hydrologic impacts of subsurface drainage at the field scale: climate, landscape and anthropogenic controls. Agric. Water Manag. 165, 1–10. doi: 10.1016/j.agwat.2015.10.008
Smith, D. R., Huang, C., and Haney, R. L. (2017). Phosphorus fertilization, soil stratification, and potential water quality impacts. J. Soil Water Conserv. 72, 417–424. doi: 10.2489/jswc.72.5.417
Srinivasan, M. S., Kleinman, P. J. A., Sharpley, A. N., Buob, T., and Gburek, W. J. (2007). Hydrology of small field plots used to study phosphorus runoff under simulated rainfall. J. Environ. Qual. 36, 1833–1842. doi: 10.2134/jeq2007.0017
Stamm, C., Flühler, H., Gächter, R., Leuenberger, J., and Wunderli, H. (1998). Preferential transport of phosphorus in drained grassland soils. J. Environ. Qual. 27, 515–522. doi: 10.2134/jeq1998.00472425002700030006x
Steffen, M. M., Belisle, B. S., Watson, S. B., Boyer, G. L., and Wilhelm, S. W. (2014). Status, causes and controls of cyanobacterial blooms in Lake Erie. J. Great Lakes Res. 40, 215–225. doi: 10.1016/j.jglr.2013.12.012
Tan, C. S., and Zhang, T. Q. (2011). Surface runoff and sub - surface drainage phosphorus losses under regular free drainage and controlled drainage with sub - irrigation systems in southern Ontario. Can. J. Soil Sci. 91, 349–359. doi: 10.4141/cjss09086
Turner, B. L., and Newman, S. (2005). Phosphorus cycling in wetland soils. J. Environ. Qual. 34, 1921–1929. doi: 10.2134/jeq2005.0060
Turunen, M., Warsta, L., Paasonen-Kivekäs, M., Nurminen, J., Myllys, M., Alakukku, L., et al. (2013). Modeling water balance and effects of different subsurface drainage methods on water outflow components in a clayey agricultural field in boreal conditions. Agric. Water Manag. 121, 135–148. doi: 10.1016/j.agwat.2013.01.012
Ulén, B., Djodjic, F., Etana, A., Johansson, G., and Lindström, J. (2011). The need for an improved risk index for phosphorus losses to water from tile-drained agricultural land. J. Hydrol. 400, 234–243. doi: 10.1016/j.jhydrol.2011.01.038
Uusitalo, R., Turtola, E., and Lemola, R. (2007). Phosphorus losses from a subdrained clayey soil as affected by cultivation. Agric. Food Sci. 16, 352–365. doi: 10.2137/145960607784125393
Uusitalo, R., Turtola, E., Puustinen, M., Paasonen-Kivekäs, M., and Uusi-Kamppa, J. (2003). Contribution of particulate phosphorus to runoff phosphorus bioavailability. J. Environ. Qual. 32, 2007–2016. doi: 10.2134/jeq2003.2007
Vadas, P. A. (2006). Distribution of phosphorus in manure slurry and its infiltration after application to soils. J. Environ. Qual. 35:6. doi: 10.2134/jeq2005.0214
Vadas, P. A., Aarons, S. R., Butler, D. M., and Dougherty, W. J. (2011). A new model for dung decomposition and phosphorus transformations and loss in runoff. Soil Res. 49, 367–375. doi: 10.1071/SR10195
Vadas, P. A., Bolster, C. H., and Good, L. W. (2013). Critical evaluation of models used to study agricultural phosphorus and water quality. Soil Use Manag. 29, 36–44. doi: 10.1111/j.1475-2743.2012.00431.x
Vadas, P. A., Gburek, W. J., Sharpley, A. N., Kleinman, P. J. A., Moore, P. A., Cabrera, M. L., et al. (2007). A model for phosphorus transformation and runoff loss for surface-applied manures. J. Environ. Qual. 36, 324–332. doi: 10.2134/jeq2006.0213
Vadas, P. A., Good, L. W., Moore, P. A. J., and Widman, N. (2009). Estimating phosphorus loss in runoff from manure and fertilizer for a phosphorus loss quantification tool. J. Environ. Qual. 38, 1645–1653. doi: 10.2134/jeq2008.0337
Vadas, P. A., Kleinman, P. J. A., and Sharpley, A. (2004). A simple method to predict dissolved phosphorus in runoff from surface - applied manures. J. Environ. Qual. 33, 749–756. doi: 10.2134/jeq2004.7490
Vadas, P. A., Kleinman, P. J. A., Sharpley, A. N., and Turner, B. L. (2005). Relating soil phosphorus to dissolved phosphorus in runoff. J. Environ. Qual. 34, 572–580. doi: 10.2134/jeq2005.0572
Vadas, P. A., Owens, L. B., and Sharpley, A. N. (2008). An empirical model for dissolved phosphorus in runoff from surface-applied fertilizers. Agric. Ecosyst. Environ. 127, 59–65. doi: 10.1016/j.agee.2008.03.001
van Bochove, E., Thériault, G., Dechmi, F., Leclerc, M.-L., and Goussard, N. (2007). Indicator of risk of water contamination by phosphorus: temporal trends for the province of Quebec from 1981 to 2001. Can. J. Soil Sci. 87, 121–128. doi: 10.4141/s06-067
Van Bochove, E., Theriault, G., Denault, J. T., Dechmi, F., Rousseau, A. N., and Allaire, S. E. (2010). “Phosphorus,” in Environmental Sustainability of Canadian Agriculture: Agri-Environmental Indicator Report Series, ed. W. Eilers (Ottawa: Agriculture and Agri-Food Canada).
van der Perk, M., Owens, P. N., Deeks, L. K., Rawlins, B. G., Haygarth, P. M., and Beven, K. J. (2007). Controls on catchment-scale patterns of phosphorus in soil, streambed sediment, and stream water. J. Environ. Qual. 36, 694–708. doi: 10.2134/jeq2006.0175
Van Esbroeck, C. J., Macrae, M. L., Brunke, R. I., and McKague, K. (2016). Annual and seasonal phosphorus export in surface runoff and tile drainage from agricultural fields with cold temperate climates. J. Great Lakes Res. 42, 1271–1280. doi: 10.1016/j.jglr.2015.12.014
Wang, Y., Tang, J., Zhang, H., Schroder, J. L., and He, Y. (2014). Phosphorus availability and sorption as affected by long-term fertilization. Agron. J. 106, 1583–1592. doi: 10.2134/agronj14.0059
Wang, Y. T., Zhang, T. Q., Hu, Q. C., Tan, C. S., Halloran, I. P. O., Drury, C. F., et al. (2010). Estimating dissolved reactive phosphorus concentration in surface runoff water from major Ontario soils. J. Environ. Qual. 39, 1771–1781. doi: 10.2134/jeq2009.0504
Wang, Y. T., Zhang, T. Q., O’Halloran, I. P., Hu, Q. C., Tan, C. S., Speranzini, D., et al. (2015). Agronomic and environmental soil phosphorus tests for predicting potential phosphorus loss from Ontario soils. Geoderma 241–242, 51–58. doi: 10.1016/j.geoderma.2014.11.001
Wang, Y. T., Zhang, T. Q., O’Halloran, I. P., Tan, C. S., Hu, Q. C., and Reid, D. K. (2012). Soil tests as risk indicators for leaching of dissolved phosphorus from agricultural soils in Ontario. Soil Sci. Soc. Am. J. 76, 220–229. doi: 10.2136/sssaj2011.0175
Weihrauch, C., and Opp, C. (2018). Ecologically relevant phosphorus pools in soils and their dynamics: the story so far. Geoderma 325, 183–194. doi: 10.1016/j.geoderma.2018.02.047
Withers, P. J. A., Hartikainen, H., Barberis, E., Flynn, N. J., and Warren, G. P. (2009). The effect of soil phosphorus on particulate phosphorus in land runoff. Eur. J. Soil Sci. 60, 994–1004. doi: 10.1111/j.1365-2389.2009.01161.x
Woodbury, J. D., Shoemaker, C. A., Easton, Z. M., and Cowan, D. M. (2014). Application of SWAT with and without variable source area hydrology to a large watershed. JAWRA J. Am. Water Resour. Assoc. 50, 42–56. doi: 10.1111/jawr.12116
Young, T. C., DePinto, J. V., Martin, S. C., and Bonner, J. S. (1985). Algal-available particulate phosphorus in the great lakes Basin. J. Great Lakes Res. 11, 434–446. doi: 10.1016/S0380-1330(85)71788-1
Keywords: phosphorus, nutrient loss, risk assessment tools, component P index, P source, P transport
Citation: Reid K, Schneider K and McConkey B (2018) Components of Phosphorus Loss From Agricultural Landscapes, and How to Incorporate Them Into Risk Assessment Tools. Front. Earth Sci. 6:135. doi: 10.3389/feart.2018.00135
Received: 26 January 2018; Accepted: 20 August 2018;
Published: 05 September 2018.
Edited by:
Chris Thomas Parsons, University of Waterloo, CanadaReviewed by:
Yi Zhang, University of Maryland, College Park, United StatesRyuichiro Shinohara, National Institute for Environmental Studies, Japan
Copyright © 2018 Reid, Schneider and McConkey. This is an open-access article distributed under the terms of the Creative Commons Attribution License (CC BY). The use, distribution or reproduction in other forums is permitted, provided the original author(s) and the copyright owner(s) are credited and that the original publication in this journal is cited, in accordance with accepted academic practice. No use, distribution or reproduction is permitted which does not comply with these terms.
*Correspondence: Keith Reid, a2VpdGgucmVpZEBjYW5hZGEuY2E=