 Ian Delaney
 Andreas Bauder1
 Mauro A. Werder
 Daniel Farinotti
- 1Laboratory of Hydraulics, Hydrology and Glaciology (VAW), ETH Zurich, Zurich, Switzerland
- 2Swiss Federal Institute for Forest, Snow and Landscape Research (WSL), Birmensdorf, Switzerland
Glaciers expel large amounts of water and sediments, and the discharge of both is influenced by glacier retreat. Because the majority of sediment originates subglacially, as opposed to proglacially, focus must be given to subglacial sediment discharge. The latter, however, is poorly constrained. We present a subglacial sediment transport time-series from the Gornergletscher and Aletschgletscher catchments in the Swiss Alps, based on hourly suspended sediment transport data and bedload transport estimates. This dataset is used to identify interannual and regional variability and to quantify the relationship between sediment transport and water discharge. Analysis of the relationship suggests that the access of water to subglacial sediment exerts substantial control on the quantity of sediment discharged. Historical data from Gornergletscher since the 1970's show that elevated amounts of sediment were discharged in the 1980's, following the onset of increasing glacier melt. However, by 2016 and 2017, the sediment discharge had returned to quantities below those in the 1970's, suggesting that sediment discharge may return to an equilibrium over decadal times scales following the onset of a new hydrological regime. Erosion rates for the two catchments (0.28 mm a−1 to 0.49 mm a−1) are lower than in other glacierized catchments of the Swiss Alps (~1 mm a−1). In some years in both catchments, these rates are even less than a third of those reported in earlier decades, highlighting substantial regional and interannual variability in catchment-scale erosion. Empirical models of the relationship between sediment concentration and water discharge, calibrated with the presented 2016–2017 data, fail to capture the elevated sediment discharge over the 1980's. This suggests that processes other than runoff, such as changing access to subglacial sediment by meltwater, were responsible for the increase. Subglacial sediment discharge depends on both water discharge and sediment availability. Therefore, we argue that physically-based models of subglacial sediment transport, that can capture its complex temporal and spatial evolution in response to glacier retreat, are needed to predict and understand a glacier's sediment yield.
1. Introduction
The retreat of alpine glaciers not only changes their hydrologic regime (e.g., Farinotti et al., 2016), but can also alter their sediment discharge (e.g., Koppes et al., 2009; Micheletti et al., 2015; Raymond-Pralong et al., 2015; Costa et al., 2018). Glaciers are known to evacuate large amounts of sediment from their beds (e.g., Østrem, 1975; Collins, 1979; Hallet et al., 1996), which can affect communities downstream of glacierized catchments. This is problematic for hydropower companies that must manage the sediment influx into reservoirs (leading to infill) and water intakes (causing turbine abrasion) (e.g., Anselmetti et al., 2007; Felix et al., 2016). Increased sediment discharge from glacierized environments has been observed in conjunction with increased runoff and glacier retreat: during an especially hot summer (Stott and Mount, 2007), on the west coast of Greenland (Bendixen et al., 2017), in Rhone-river catchment of the Swiss Alps (Costa et al., 2018), and at outlet glaciers (Koppes et al., 2009, 2015). However, the response is inconsistent from catchment to catchment (e.g., Hinderer et al., 2013) and varies with local factors such as the presence of a proglacial lake (Geilhausen et al., 2013), the ability of water to transported sediment in different hydrological regimes (e.g., Raymond-Pralong et al., 2015) and the length of time since glacier retreat began (e.g., Lane et al., 2017). Therefore, the influence of glacier retreat on sediment discharge in alpine regions remains uncertain.
Sediment transported out of glacierized catchments can either originate from the subglacial or the proglacial environments, areas in front of glaciers that have been exposed by glacier retreat. As ice no longer buttresses and supports recently exposed proglacial sediment, large amounts of sediment can be readily available for fluvial transport (Church and Ryder, 1972). However, proglacial areas can stabilize over relatively short time periods due to gully formation, which limits the access of water to available sediment, and due to sorting of transportable sediment, which leaves larger clasts in the proglacial area (Ballantyne, 2002; Lane et al., 2017; Delaney et al., 2018). As a result, 50–90% of sediment leaving some catchments has subglacial origins, as opposed to proglacial origins (Fenn and Gomez, 1989; Guillon et al., 2015, 2017; Delaney et al., 2018). As proglacial areas stabilize, they can contribute progressively less to the catchment's sediment budget with time. Therefore, understanding subglacial sediment transport processes is imperative to quantifying sediment dynamics in glacierized regions.
Several processes govern sediment dynamics and bedrock erosion in the subglacial environment (Alley et al., 1997). Subglacial sediment must first be created. This occurs through plucking of bedrock by (i) changing pressure gradients (as glacier ice moves over bedrock bumps) and (ii) refreezing of meltwater that expands cracks within the bedrock, leading to material detachment from the glacier bed (Alley et al., 1997). Debris-laden ice sliding over its substrate abrades the underlying bedrock and produces additional sediment (Alley et al., 1997). Some of this newly-created sediment can be accreted to the basal ice in locations such as overdeepenings and carried with the ice flow (Swift et al., 2018). The majority of sediment, however, is transported down-glacier by water flowing along the glacier bed (e.g., Walder and Fowler, 1994).
Subglacial water, responsible for the fluvial transport of sediment, is pressurized by the overlying ice (Röthlisberger, 1972). The shear stress exerted on subglacial sediment by the water flow increases with its velocity and once the shear stress exceeds a critical value, sediment is mobilized (e.g., Meyer-Peter and Müller, 1948; Walder and Fowler, 1994). As a result, subglacial sediment transport is not only a function of water discharge (e.g., Rickenmann, 2001), but also of ice dynamics, as pressurized water flow can exhibit higher velocities (Walder and Fowler, 1994). The access of fast flowing meltwater to subglacial sediment is another major factor impacting subglacial sediment discharge (e.g., Collins, 1996; Willis et al., 1996; Herman et al., 2015).
Over the past decades, observations of subglacial sediment discharge has been used to determine catchment erosion quantities (e.g., Bezinge, 1987), identify characteristics of subglacial drainage systems (e.g., Collins, 1979, 1989; Richards and Moore, 2003), examine differences between cold and temperate based glaciers (e.g., Hodson and Ferguson, 1999) and investigate the availability of subglacial sediment for transport by meltwater (e.g., Willis et al., 1996; Riihimaki et al., 2005; Swift et al., 2005; Mao et al., 2014). Many of these studies analyzed data from a single glacier (e.g., Richards and Moore, 2003; Riihimaki et al., 2005; Herman et al., 2015) and over one season (e.g., Willis et al., 1996; Swift et al., 2005). To understand subglacial sediment processes more comprehensively, however, the inter-annual variations in sediment discharge and the differences in erosion rates and decadal-scale changes to sediment discharge across multiple glacierized catchments must all be evaluated. With increased understanding, these processes can then be implemented in physical and numerical models to make quantitative estimates of subglacial sediment dynamics and discharge as glaciers retreat.
This paper makes use of two sediment discharge time series from the Gornergletscher and Aletschgletscher catchments in the Swiss Alps over the 2016 and 2017 seasons. By examining these data, we constrain the amounts of subglacial sediment leaving these catchments, present a hypothesis about subglacial sediment availability, and analyze the capacity of a simple empirical model to forecast subglacial sediment transport. In the Gornergletscher catchment, observed, long-term subglacial sediment discharge measurements allow us to examine decadal changes in subglacial sediment transport following glacier retreat. By synthesizing these data we examine processes that can be implemented and considered in physically-based subglacial sediment transport models (e.g., Creyts et al., 2013; Carter et al., 2017).
2. Study Sites and Data
Our main datasets were collected from the Gornergletscher and Aletschgletscher catchments (Figure 1) over the 2016 and 2017 melt seasons. Additionally, some historical sediment discharge data are available for the Gornergletscher catchment. In both locations, the glacier meltwater is captured and used for hydropower purposes. Both glaciers terminate near or in bedrock gorges (Figures 1, 2A,C). Thus, periglacial sediment leaving the catchment must have passed through the subglacial drainage system (Figures 2A,C), and subglacial processes can be examined in isolation.
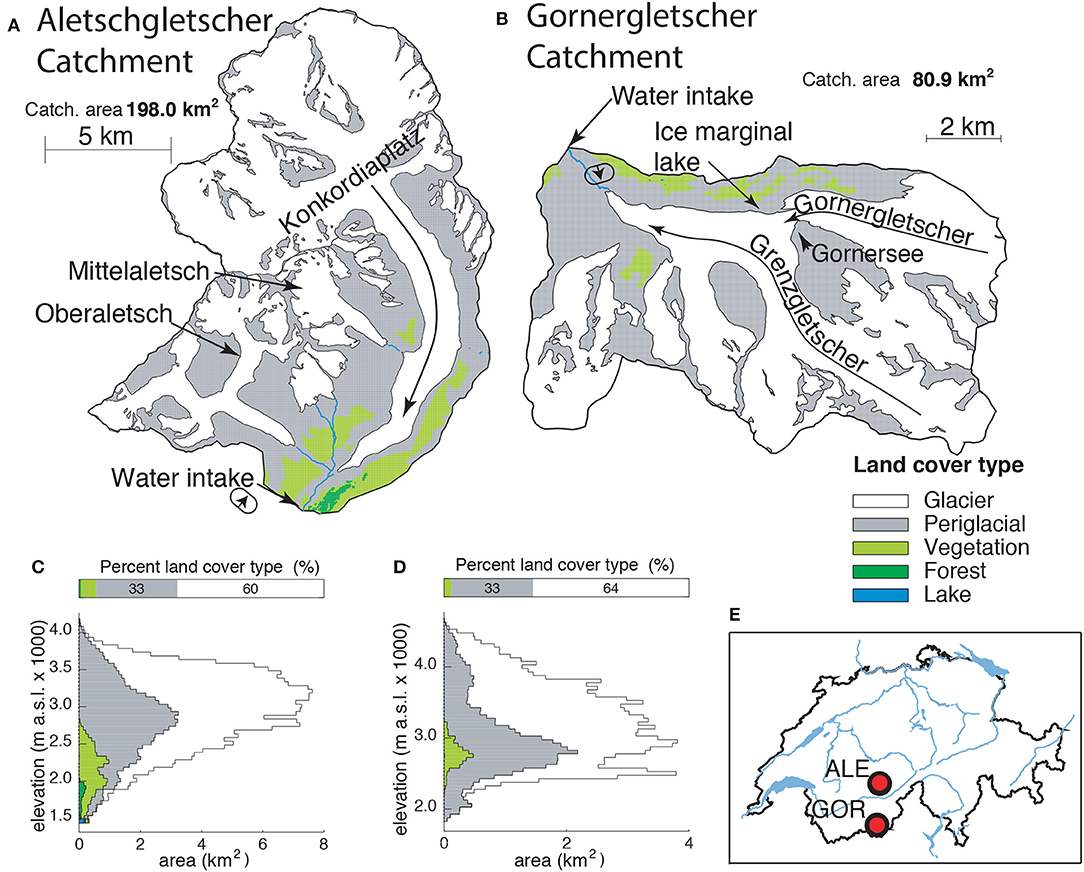
Figure 1. Maps, land cover and hypsometry for Aletschgletscher catchment (A) and Gornergletscher catchment (B) located within Switzerland (E). Water intakes that house instrumentation are labeled, as are the ice marginal lake and Gornersee in the Gornergletscher catchment. Interpreted glacier flow lines are marked. (C,D) Represent hypsometry for the Aletschgletscher and Gornergletscher catchments, respectively. Ovals with arrows (A,B) denote the approximate location and directions of photos (A,C) in Figure 2.
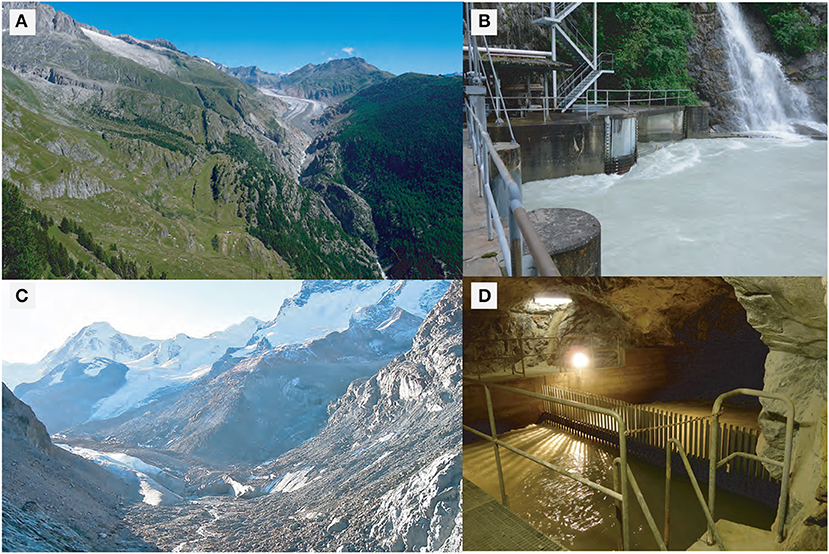
Figure 2. The glacier termini of Aletschgletscher in 2016 (A) and Gornergletscher in 2017 (Archives VAW/ETH Zürich; St. Walter) (C), as well as the water intake for the Aletschgletscher catchment (B) and sediment trap below the Gornergletscher catchment (D). Note that both glaciers terminate near bedrock gorges. Approximate locations of photographs (A,C) are given in Figure 1.
2.1. Gornergletscher Catchment
The Gornergletscher catchment is 80 km2 in area (Figures 1B,D), with glaciers covering roughly two-thirds of that area (Bauder et al., 2007). An ophiolite complex, including mafic crystalline rocks, comprises the catchment's bedrock (Swisstopo, 2005). The glacier has a maximum elevation of 4600 m a.s.l. and its terminus lies at approximately 2300 m a.s.l. The maximum thickness of the glacier is 450 m (Sugiyama et al., 2008). Gornergletscher has been the site of numerous subglacial hydrological studies (e.g., Röthlisberger, 1972; Collins, 1979; Sugiyama et al., 2008). Several of these studies focused on a lake, Gornersee, that formed annually at the confluence of Grenzgletscher and Gornergletscher, and on the annual subglacial outburst from the lake (Huss et al., 2007; Sugiyama et al., 2008). In recent years the lake has failed to form; however, a different ice marginal lake forms slightly downstream and drains annually (Figure 1A). Additionally, since the early 1970's, Gornergletscher has been the site of research into subglacial sediment processes and availability (e.g., Collins, 1979, 1989, 1996; Bezinge, 1987)
A water intake (45° 59′ 25″ N, 7° 43′ 49″ E), part of the Grand Dixence hydropower scheme, collects all proglacial water discharge, except when the intake is over-topped by high water discharge. Grand Dixence S.A. has provided water discharge measurements collected at 15 minute intervals since 1969. Precipitation data have been recorded by MeteoSwiss1 in Zermatt (1638 m a.s.l., 4 km from the glacier terminus). A gravel trap constructed at the water intake slows incoming water, and thus larger sediment clasts are deposited here; the trap prevents them from entering the tunnel network (Figure 2D). The captured water then flows to an additional gravel trap and is split and routed through two separate sand traps, where our instrumentation is housed (Section 3.1, Figure 2D). The traps are flushed frequently and the flushing times and fill-levels are recorded. We use this information to estimate bedload transport (discussed in Section 3.2).
A unique series of suspended sediment discharge measurements (not bedload) beginning in the early 1970's exists for the Gornergletscher catchment (Bezinge, 1987; Collins, 1990, 1996). These data were collected by gravimetrically determining sediment concentration in water samples collected at hourly resolution (Collins, 1990, 1996). We use these data to explore the drivers of annual sediment discharge quantities and potential decadal-scale variations in sediment discharge. Over this period from 1972 to 1990, seasonal estimates of sediment discharge from certain years have been constrained by digitizing the published plots and using values found in Bezinge (1987), Collins (1990, 1996); see Table 1. During those seasons when the mass totals presented in Table 1 of Collins (1990) exceed those found by the digitized graphics from the same publication, the totals from Table 1 of Collins (1990) are used because we assume his tabulated values are more accurate than our plot digitization. Within this dataset, gaps exist spanning from weeks to multiple years, and the periods of data collection often do not span the entire melt season. Furthermore, the substantial incongruence between instrumentation and measurement techniques (e.g., Orwin and Smart, 2005; Felix et al., 2013) suggests that variations between the present study (seasons 2016 and 2017, Section 3.1) and historical data could be attributed in part to different instrumentation and measuring techniques.
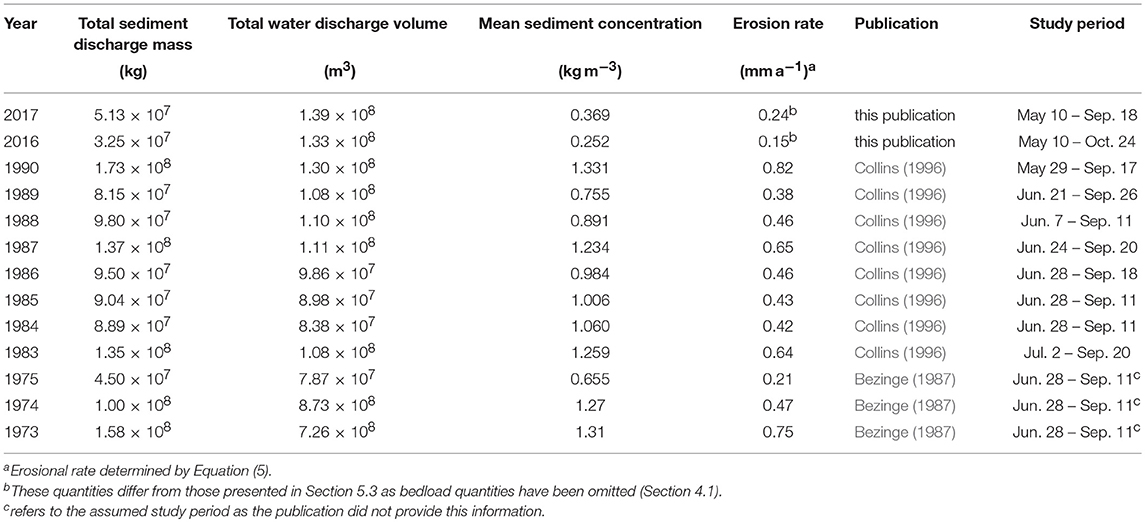
Table 1. Summary of annual sediment and hydrological data from the Gornergletscher catchment.
2.2. Aletschgletscher Catchment
The Aletsch catchment is approximately 198 km2 in area (Figures 1A,C) and is 60% glacierized with a crystalline substrate (Swisstopo, 2005). It consists of three glacierized sub-catchments: the Grosser Aletschgletscher (135 km2), the Mittelaletschgletscher (15 km2), and the Oberaletschgletscher (40 km2) catchments. The maximum ice thickness exceeds 800 m at Konkordiaplatz, which is the confluence of the tributary glaciers creating Grosser Aletschgletscher (Bauder et al., 2007). This overdeepening at Konkordiaplatz may reduce the ability of subglacial water to transport sediment out of the catchment (Creyts et al., 2013; Werder, 2016; Swift et al., 2018). The Mittelaletsch catchment drains into Grosser Aletschgletscher, while the Oberaletsch catchment joins the main catchment below the terminus of Grosser Aletschgletscher. Below the confluence of the Oberaletsch and Grosser Aletschgletscher catchments, water flows through the Massa gorge (Figure 1A), where water discharge was determined at 10 minute resolution by the Federal Office for the Environment2 monitoring station (46° 23′ 09″ N, 8° 00′ 25″ E). Roughly 100 m downstream of the water intake, a portion of the discharge is diverted and captured by a water intake for hydropower purposes (Figures 1A, 2A,B). Thus, our instrumentation (Section 3.1), installed at the water intake's sand trap, captures sediment from all three catchments (Figure 1A). Precipitation data were collected at Bruchji (2300 m a.s.l., 6 km from glacier terminus) by MeteoSwiss3.
3. Methods
Methods implemented to collect the suspended sediment and bedload transport data over the 2016 and 2017 seasons are discussed below. Additionally, an empirical model that relates water discharge to suspended sediment concentration/discharge is presented.
3.1. Suspended Sediment
Turbidity meters (Endress+Hauser CUS51d) were installed in the water intakes (Figures 2B,D) to record measurements of turbidity every five seconds using formazin nephelometric units. These data were then averaged and resampled at the resolution of the water discharge data (Sections 2.1 and 2.2). Upon collection of turbidity data, an empirical relationship is required to establish the sediment concentration for a given turbidity value (e.g., Felix et al., 2018). To do this, bottle samples were collected automatically when turbidity exceeded set values, so that bottle samples were collected over a wide range of sediment concentrations (Figure 3). To determine gravimetric sediment concentration in each bottle sample, the total volume of the sample was calculated from its mass, assuming a density of 1000 kg m−3. The sample was then placed in an oven where the water evaporated. The residual was weighed to yield the mass of sediment in the bottle sample. This mass divided by the sample volume yielded the sediment concentration. The sediment concentration of individual samples, and the corresponding turbidity values at the time of sample collection, were used to establish a linear relationship between turbidity and sediment concentration (e.g., Felix et al., 2018). In the Aletschgletscher catchment a linear regression value of r=0.74 (p < 0.001) is achieved, while at the Gornergletscher catchment the value is 0.85 (p < 0.001, Figure 3); the 95% confidence intervals are based upon the standard error of the calibrated relationship. In total, 67 (90) bottle samples were collected at the Aletschgletscher (Gornergletscher) catchment over the 2016 melt season.
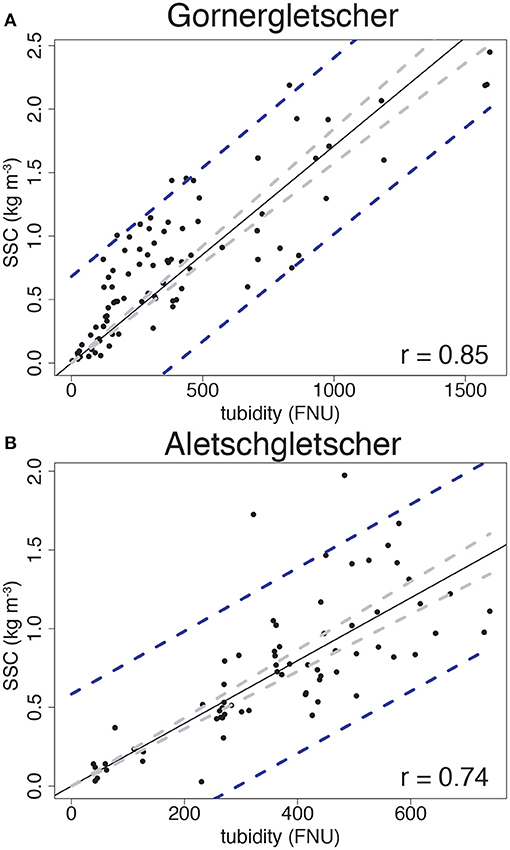
Figure 3. Calibration relationship between turbidity (formazin nephelometric unit (FNU)) and suspended sediment concentration for Gornergletscher (A) and Aletschgletscher (B). Black line represents best fit. Gray lines represent the 95% confidence interval. Blue lines represent the 95% prediction interval.
Turbidity meters in the water intakes were placed approximately 1 m below the water surface. Higher sediment concentrations likely occur lower in the water column, but logistical difficulties prevented installation at a deeper point. Suspended sediment data for 2016 spans from May 10 to October 24 for both catchments. Over the 2017 season, however, instrument failure at the Aletschgletscher catchment limited the study period from May 31 to August 31, whilst at the Gornergletscher catchment data were collected continuously between May 10 and September 18.
The sediment discharge by mass at a given time, Qsm ( kg s−1), is given by
where Qw is water discharge (m3 s−1) and SSC is suspended sediment concentration (kg m−3). Volumetric sediment discharge is given by, , where ρssc is the density of suspended sediment (assumed to be 1500 kg m−3).
The total sediment discharged over a annual period, Qstot, is,
where Qs is sediment discharge by mass or volume, Qsm or Qsv, respectively, and Δt is the sampling rate of the data in seconds.
Corresponding confidence intervals in sediment discharge were derived from the estimated standard errors for sediment concentration. The mean suspended sediment concentration, , over a time period is computed by dividing the total sediment discharge by the total water discharge, Qw.
3.2. Bedload
Sediment traps exist downstream of the water intakes to prevent large quantities of sediment from entering the hydropower infrastructure (Figures 2B,D). Each trap consists of a large basin with water flowing in on one side and leaving on the other side by over-topping. Thus, the basins slow the water, causing deposition of sediment in the bottom of each basin. At certain time-intervals or sediment fill-levels, the basin is flushed by means of an opening in the bottom. The sediment fill-levels and the times of flushing of these traps can be used to estimate the amount of sediment leaving the catchment by bedload transport, given the known geometry of the trap (e.g., Micheletti et al., 2015). At the Gorner site, sediment-trap flushing and occasionally fill levels were recorded by hydropower operators. Flushing occurred in the night following a fill-level alarm, leading, however, to underestimates of sediment inflow due to the time-lapse between the alarm and the flushing. During periods of high water discharge, the trap was flushed every night regardless of fill-level. A lower bound of bedload transport can be estimated given the protocol described above, and excluding flushing where no sediment fill-level was recorded. An upper bound of bedload can be determined by assuming full traps at the time of every flushing. Due to inconsistency in the flushing protocols, only upper and lower bounds of the seasonal totals of bedload transport were used. An assumed sediment density of ρs = 1500 kg m−3 is used to translate volumetric measurements to mass. Flushing protocols at the Aletsch site dictated that flushing occurred nightly regardless of the fill-level of the traps. Therefore, bedload transport quantities were not determined at this location.
3.3. Empirical Model
Empirical models have been previously used to describe subglacial suspended sediment concentration as a function of water discharge (e.g., Müller and Förstner, 1968; Swift et al., 2005). Here, such models are used to understand the hydraulic drivers and temporal variability of subglacial sediment discharge; notably, we examine the viability of these models to forecast the response of subglacial sediment transport under a variety of hydraulic conditions. Models including some time-dependence parameters achieve a higher correlation between modeled and observed suspended sediment concentrations (e.g., Willis et al., 1996; Swift et al., 2005). Here, a time-dependent term is added to the empirical model presented by Müller and Förstner (1968) that relates suspended sediment concentration to water discharge
where SSCm is modeled suspended sediment concentration (kg m−3), Qw is water discharge (m3 s−1) , and t is the duration (s) of glacier melt since May 10 of that year. In Equation (3), a (kg sn m−3(n+1)), b (kg sn−1 m−3(n+1)), and n (-) are empirical parameters. The modeled suspended sediment discharge by mass, Qsmm (kg s−1), is determined by
The empirical parameters of individual models runs, for a time period and site, are estimated by a least squares fit with the data using the package LsqFit.jl4. Parameters were considered significant if their standard error at the 95% confidence interval was greater than the parameter itself (Table 2). To constrain the effects of time-dependence and the sensitivity of suspended sediment discharge to water discharge, different suites of model runs were examined (A, B, and C hereafter). In suites A and B, the parameters b and n were set to zero and one, respectively, while in suite C all empirical parameters were utilized in the fit (Table 2).
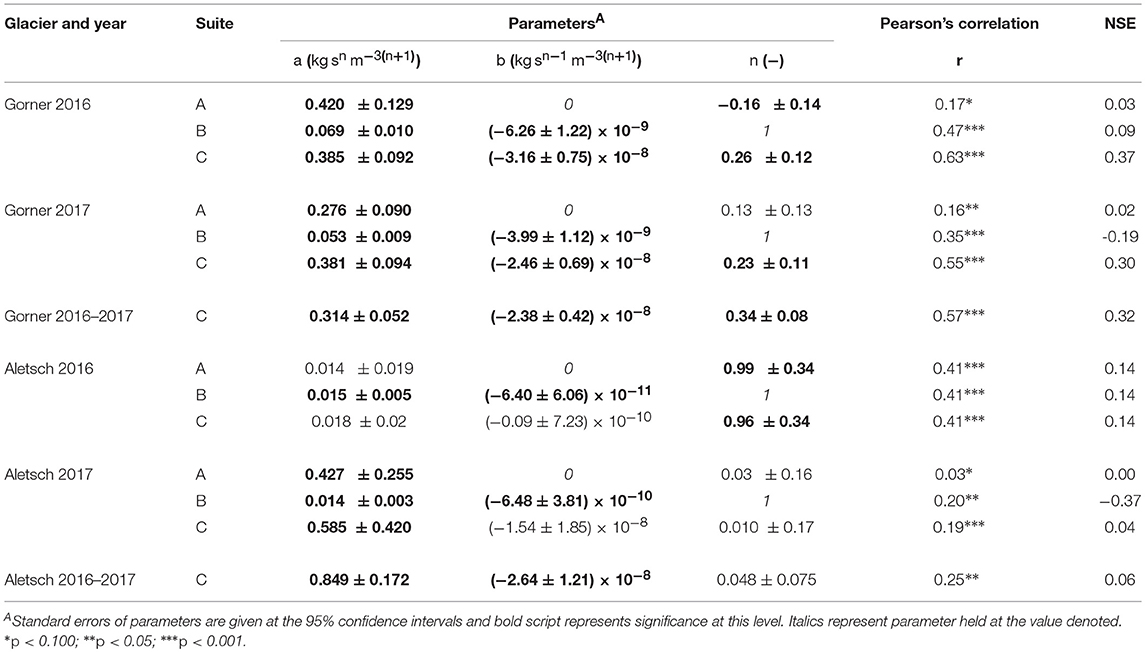
Table 2. Fitted parameters and skill metrics of the empirical models presented in Section 3.3.
The model performance is sensitive to the resolution of the sampling interval of the input data (Qw). As a result, the data were averaged over 24 h to reduce the effects of diurnal variations in sediment discharge and lags between water discharge and sediment concentration (Section 5.2.1, Table 3). To assess model performance, Pearson's correlation and the Nash-Sutcliffe (NSE) efficiency were used. Values of NSE = 1 denote a perfect match between modeled values and data, while negative values indicate performance worse than simply taking the mean of the data.
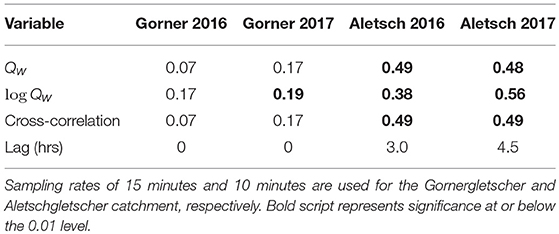
Table 3. Correlations between sediment concentration and water discharge, Qw.
4. Results
4.1. Gornergletscher Catchment
Between May 10 and October 24, 2016, 23,800±2700 m3 (95% prediction interval, Figure 3) of suspended sediment was evacuated from the Gornergletscher catchment. Sediment traps caught 1900–2400 m3 of bedload, leading to a total evacuation of 23,000–28,900 m3 of sediment over the season. The mean sediment concentration was 0.25 kg m−3. The maximum sediment concentration, 5.04±0.79 kg m−3, was recorded on May 29 and is synchronous with the drainage of an ice marginal lake from May 25 to June 2 (Figure 4), and the onset of increased water discharge. During the same period, sediment discharge reached a maximum, while water discharges remained relatively low (Figure 4). Following the middle of July, suspended sediment concentrations remained constant and thus sediment discharge varied largely in response to water discharge.
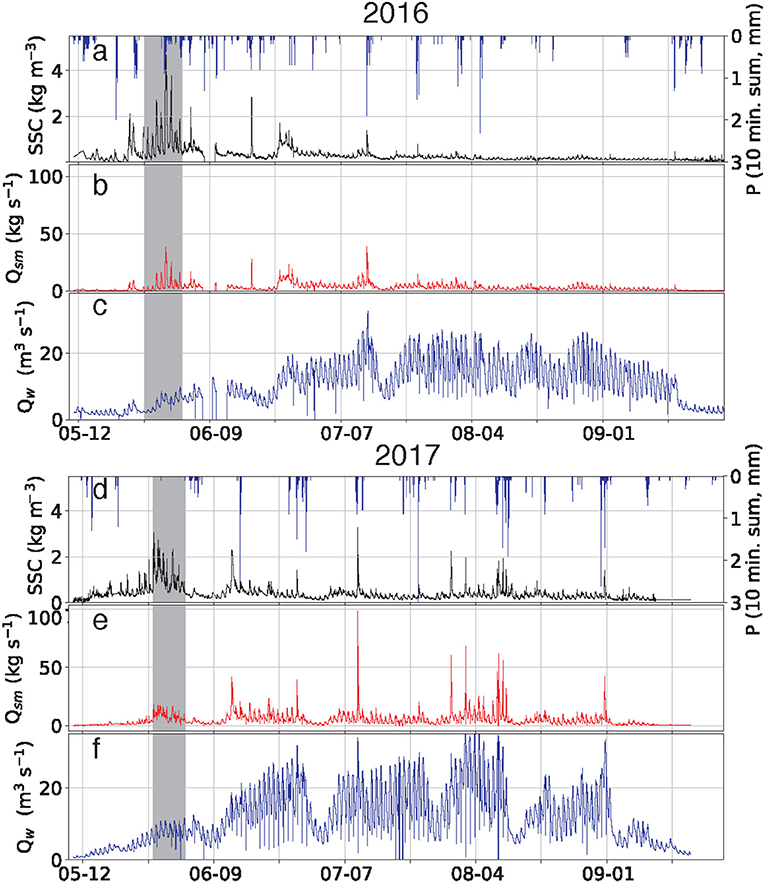
Figure 4. Time series of the Gornergletscher catchment data over the 2016 and 2017 seasons. (a,d) Suspended sediment concentration (SSC), blue bars represent precipitation (P). (b,e) Sediment discharge (Qs). (c,f) Water discharge (Qw). Gray bars indicate the periods of the ice-marginal lake drainages.
Between May 10 and September 18, 2017, 37,300±3400 m3 of suspended sediment was expelled. This is about 65% greater than the 2016 season, although the total water discharge was only 4% greater. The mean sediment concentration was 0.37 kg m−3, with a maximum of 3.27±0.73 kg m−3 occurring on July 9, a result of a precipitation event, as opposed to the lake drainage in 2016, which caused the peak sediment concentration in that season. Similar to 2016, in 2017 high sediment concentrations but lower water discharges were observed at the onset of the melt season, coincident with drainage of the ice marginal lakes (Figure 4). Unlike in the 2016 season, however, in 2017 sediment concentration and sediment discharge fluctuated strongly over the last two months of the study period, largely in association with precipitation events. A minimum amount of 1500 m3 and a maximum amount of 6600 m3 of sediment passed through the traps in 2017.
6-12% of the total sediment load was transported by bedload over both seasons. This is much lower than the roughly 40% that has been observed at Bench Glacier in Alaska (e.g., Riihimaki et al., 2005).
The eleven seasons of previous data for the Gornergletscher catchment provide the basis for a decadal-scale comparison of sediment discharge, water discharge, and mean suspended sediment concentration (Bezinge, 1987; Collins, 1990, 1996). The largest total water discharges occurred in 2016 and 2017, being 1.33×10⁸ m3 and 1.39×10⁸ m3, respectively, yet, some of the smallest amounts of sediment transport occurred over these years (Figure 5, Table 1). In contrast, the highest amounts of sediment discharge occurred in the 1980's, with the maximum amount of 111,600 m3 sediment discharge occurring in 1990 when 1.30 × 10⁸ m3 of water was discharged over the season, a similar quantity of water discharge compared to recent years. Mean seasonal sediment concentrations were substantially higher prior to the 1990's than in 2016 and 2017, with the average for the eleven examined years between 1972 and 1990 being 1.07 kg m−3, while the 2016–2017 average is 0.31 kg m−3.
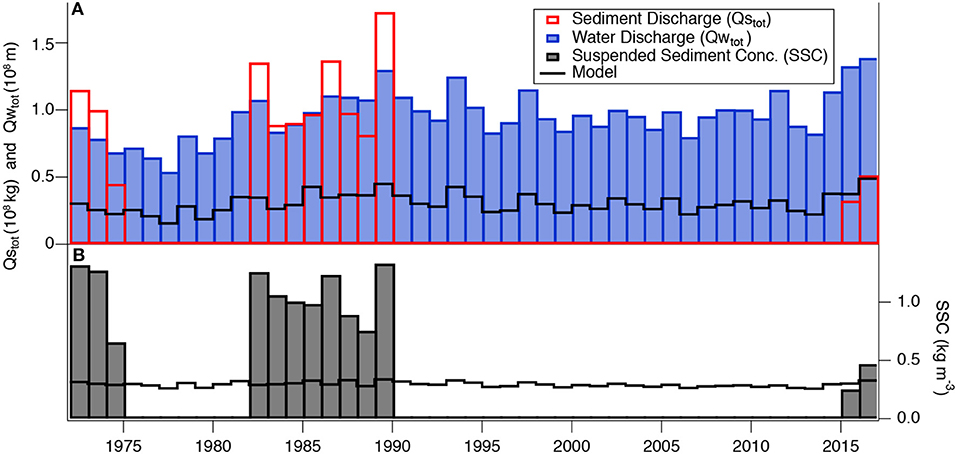
Figure 5. Historical sediment and water discharge totals (A) and mean seasonal suspended sediment concentration (B) from the Gornergletscher catchment. Data aside from the 2016 and 2017 are from previous publications (Table 1). Breaks in the plot indicate periods without measurements. Black lines are empirical model outputs described in Section 5.2.2.
4.2. Aletschgletscher Catchment
Measurements in the Aletschgletscher catchment began on May 10 and stopped on October 25, 2016. Over this period the catchment expelled 173,600±22,200 m3 of suspended sediment. The mean sediment concentration was 0.45 kg m−3. The maximum sediment concentration was 6.24±0.79 kg m−3, higher than that observed at Gornergletscher during the same season. Unlike the Gornergletscher catchment, the highest concentration was observed late in the season, from September 4–8 during a precipitation event (Figure 6). During that period, more than 37,500±1800 m3 of sediment (roughly 20% of the season's yield) was transported from the glacier. From the onset of the measurements, sediment concentration was largely steady, with occasional spikes predominantly driven by precipitation events (Figure 6). Sediment discharge mostly remained low until the middle of June. At this time, the water discharge first exceeded 50 m3 s−1 and remained high until mid-September.
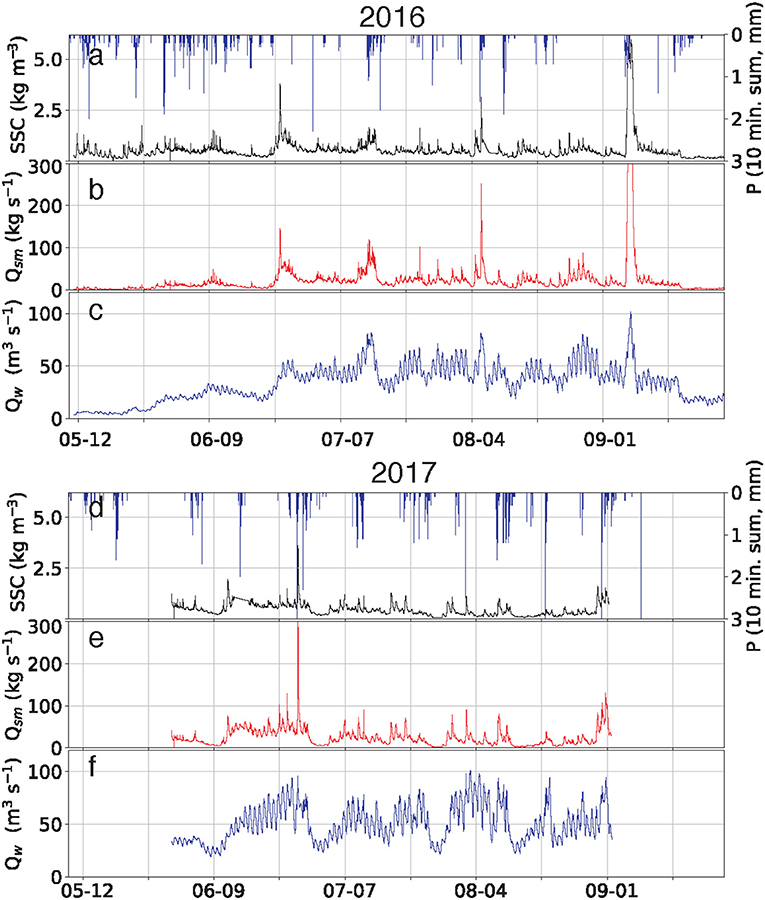
Figure 6. Time series of the Aletschgletscher catchment data over the 2016 and 2017 seasons. (a,d) Suspended sediment concentration (SSC); blue bars represent precipitation (P). (b,e) Sediment discharge (Qs). (c,f) water discharge (Qw).
Due to instrument malfunctioning, the 2017 data collection period only lasted from 31 May to 31 August. Over this time, the catchment discharged 152,000±24,300 m3 of suspended sediment. The mean sediment concentration was 0.46 kg m−3, equal to the mean concentration during the 2016 season. A maximum concentration of 3.7±0.66 kg m−3 was observed on June 26, as a result of a precipitation event.
5. Discussion
5.1. Availability of Subglacial Sediment
Through examination of specific events and the season-long relationships between water discharge and sediment dynamics, some hypotheses can be formulated regarding the availability of subglacial sediment for transport by water (Willis et al., 1996; Riihimaki et al., 2005; Swift et al., 2005).
At the Gornergletscher catchment, an ice marginal lake fills with water upon the initiation of melt, and subsequently drains. During 2016 and 2017, the lake drainage occurred slowly from the last week in May to the first week in June. This event was recorded by time-lapse photography of the ice marginal lake (unpublished data, VAW, ETH Zürich). In both years, suspended sediment concentration and sediment discharge during the lake drainage were generally higher than at any other time over the season (Figure 4). By contrast, water discharge was not especially high during these drainage events (Figures 4, 7), suggesting an enhanced ability of water to mobilize sediment (Figures 7A,B). This is likely caused by the absence of a well-developed drainage system prior to the lake drainage, due in part to the smaller water discharge (e.g., Werder and Funk, 2009). In these conditions, water can reach a larger portion of the glacier bed during the lake drainage and a greater amount of sediment is thus available for transport. A more channelized drainage system during a high discharge regime, that follows later in the season, could limit the access of water to a smaller portion of the glacier bed (Iken and Bindschadler, 1986), thus less sediment can be accessed and mobilized despite high water discharges. Additionally, there could have been increased quantities of sediment at the glacier bed early in the melt season, when these lake drainages occurred, produced by glacier sliding in the winter and spring, but not transported away yet by subglacial water (Harper et al., 2002; Herman et al., 2015).
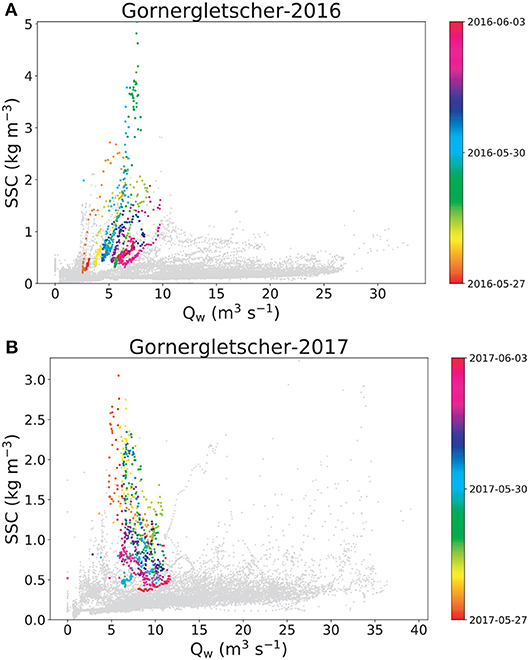
Figure 7. Relationship between water discharge (Qw) and suspended sediment concentration (SSC) at the Gornergletscher catchment during the 2016 (A) and 2017 (B) seasons. Data during lake drainages are shown by colored dots, while gray dots represent season-long relationship.
Two notable events yielding insights into the availability of subglacial sediment occurred at the Aletschgletscher catchment in 2016. Discharge and suspended sediment concentration between May 20 and June 6 show a clockwise hysteresis at lower water discharges, followed by a chaotic relationship as discharge increases (Figure 8C). The clockwise hysteresis is more pronounced at lower water discharges (below 10 m3 s−1), and a single counter-clockwise loop is located within the data (Figure 8C). Counter-clockwise loops indicate a sediment source far from the catchment outlet (Williams, 1989), possibly caused by an increased water discharge activating sediment stored in the distributed drainage system (Iken and Bindschadler, 1986). The clockwise hysteresis indicates a sediment source that can be evacuated quickly with increasing discharge and that sediment supply is limited below the glacier (Williams, 1989; Singh et al., 2005). The persistence of these loops at higher water discharges suggests that progressively more sediment is being accessed and removed as water discharge increases. This could be due in part to up-glacier migration of the drainage system. It can be speculated that the change in hysteresis after early June, might be due to the drainage system expanding to access fewer sediment sources below the glacier or extending past Konkodiaplatz, where the overdeepening makes the relationship between sediment and water more complex (e.g., Creyts et al., 2013).
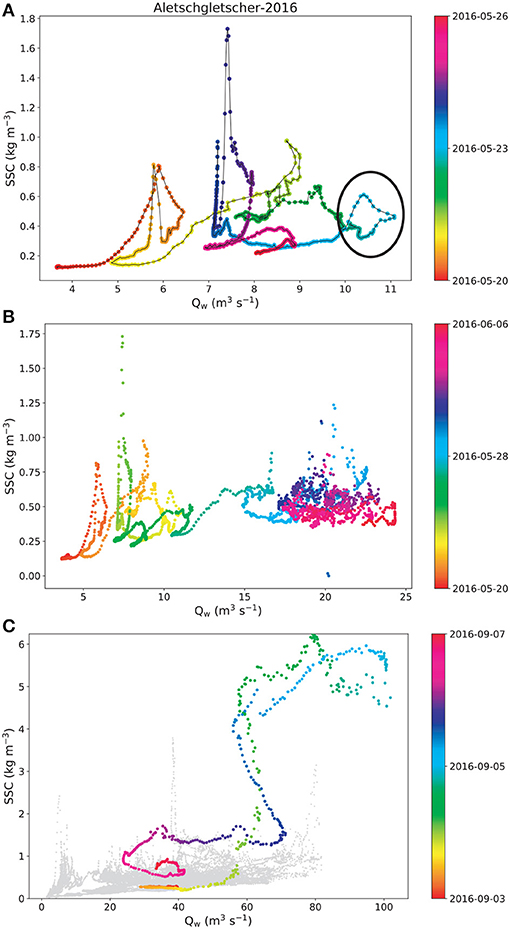
Figure 8. Relationship between water discharge (Qw) and suspended sediment concentration (SSC) for notable events in the Aletschgletscher catchment. (A) Strong hysteresis between discharge and sediment concentration in early season. Counter-clockwise loop discussed is marked. (B) Transition from strong hysteresis between discharge and sediment concentration to chaotic relationship. (C) High-precipitation event in the Aletschgletscher catchment in colored dots, with season-long relationship in gray dots.
The other notable event in Aletschgletscher's catchment is the precipitation event from September 4 to 8, 2016 (Figure 6), which produced the highest sediment concentrations during the study period and discharged 20% of the seasonal sediment yield (Section 4.2). When water discharge first exceeds 70 m3 s−1, sediment concentration sharply increases (Figure 8). Higher discharges at other times in the season did not result in similarly elevated sediment concentrations, suggesting that new sediment sources were accessed during the event. Conceivably, low water discharge prior to the event could have resulted in reduced capacity of the drainage system (Iken and Bindschadler, 1986). The rapid increase in water input could have overwhelmed the drainage system, creating high water pressures which caused both increased access of subglacial water to sediment sources (Figure 6) and high enough water velocity to transport sediment.
To assess the efficiency of water to mobilize subglacial sediment over the course of the season, cumulative amounts of sediment discharge were compared to cumulative amounts of water discharge (Figure 9). In all years, except for the Aletschgletscher catchment in 2016, the relationship shows a strongly concave–down shape, with steeper than average gradients between cumulative sediment and water discharge at the beginning of the season, and shallower than average gradients at the end of the season. This implies that water is far more efficient at transporting suspended sediment at the beginning of the melt-season compared to the end. Such a trend is documented in other work examining the Gornergletscher catchment in the 1980's (Collins, 1990). It is consistent with conceptual models for inefficient subglacial drainage systems present early in the melt season (e.g., Iken and Bindschadler, 1986), which allow for greater access by water to subglacial sediment sources. An efficient drainage system later in the season limits the access by water to these sources and leads to decreased sediment mobilization (e.g., Collins, 1996).
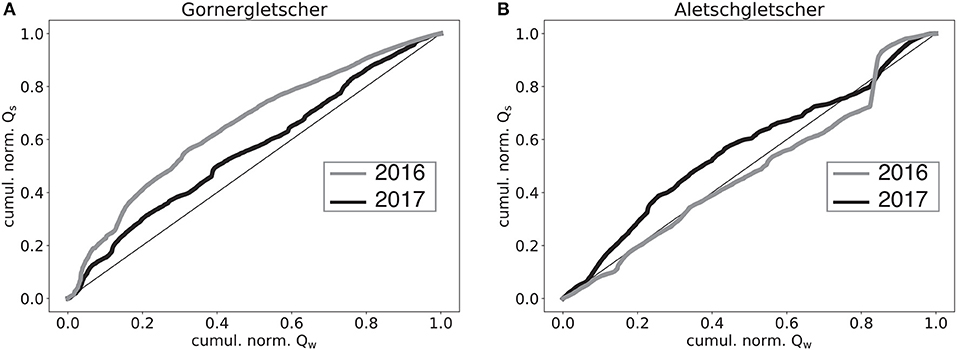
Figure 9. Normalized cumulative amounts of sediment and water for 2016 (gray) and 2017 (black) for Gornergletscher (A) and Aletschgletscher (B). Straight line represents constant relationship between water (Qw) and sediment (Qs) discharge.
The concave–down nature of this relationship at the Gornergletscher catchment is substantially more pronounced in 2016 than in 2017. This is in part due to higher sediment discharges during the 2016 lake drainage (Figures 4, 7) compared to 2017. In contrast, the Aletschgletcher catchment in 2016 experienced a relatively steady gradient between cumulative sediment and water discharge throughout the melt-season (Figure 9B), except for a very pronounced increase due to the high precipitation event (September 4–8, 2016, Figures 6A–C). A more constant relationship suggests that similar amounts of sediment are available for water transport at the glacier bed under a variety of different water discharge conditions.
5.2. Relationship of Sediment Discharge and Concentration With Water Discharge
Previous work (e.g., Richards and Moore, 2003) suggests that variations in suspended sediment concentration are largely driven by water discharge variations, while the remainder of the variations in sediment concentration are attributable to subglacial processes, such as channel reorganization. To examine such processes, this section discusses the relationships between sediment concentration/discharge and water discharge, using the hourly and seasonal data over the 2016 and 2017 seasons. For the Gornergletscher catchment, annual data spanning several decades are also considered.
5.2.1. Seasonal Time-Scales
Subglacial sediment transport occurs at far lower discharges than in fluvial systems where up to 90% of sediment is transported during short, high-discharge events (Wolman and Miller, 1960; Gintz et al., 1996; Torizzo and Pitlick, 2004). Within the data presented here, 40–55% of the total seasonal sediment transport occurs when water discharge is below the 75th percentile of annual discharge (Figure 10). Between 15 and 25% of seasonal sediment transport occurs when water discharge is below the season's median. In the Aletschgletscher catchment, only 20% of the total sediment discharged in the 2016 season is expelled when water discharges exceeded the 95th percentile (Figure 9). This suggests far greater availability and/or easier mobilization of sediment in the subglacial environment than in fluvial counterparts, possibly due to deformation and englacial transport and deposition of till into subglacial conduits (Walder and Fowler, 1994; Swift et al., 2005; Gimbert et al., 2016). The majority of sediment transport from the glacier bed occurs when water discharge is in the highest 25th percentile of the season. This suggests that subglacial sediment discharge is highly sensitive to the hydrograph shape, and that high discharges and the pressurized nature of subglacial water flow produce a more complex relationship between sediment and water discharge (Walder and Fowler, 1994). As a result, projections of sediment discharge based on hydrological forecasts and empirical relationships could be highly sensitive to climatic variability, since the latter has a strong influence on water discharge (e.g., Barnett et al., 2005).
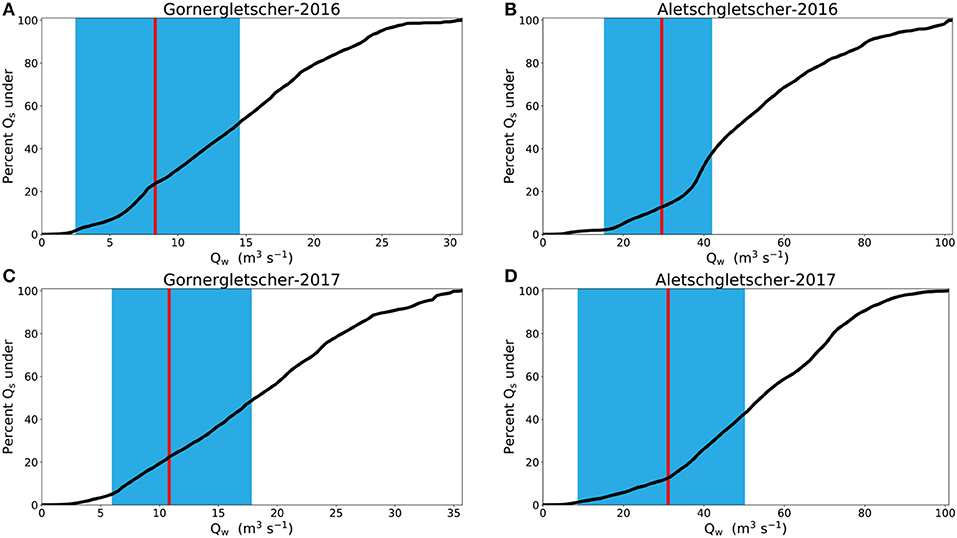
Figure 10. Percentage of sediment transport (Qs) occurring under a given water discharge (Qw) for both catchments in 2016 (A,B) and 2017 (C,D). The blue regions represent 25th and 75th quantiles of Qw, while red lines represent median values. Note that at the Aletschgletscher catchment, minimum water discharge values at the beginning of the 2017 season are not present due to instrument malfunctioning, and that this also leads to exaggerated mean values of water discharge when compared to 2016.
To examine the relationship between sediment concentration and water discharge, the cross-correlation between the two datasets was considered (Table 3). The largest correlations, for the Gornergletscher catchment, were found with a lag in discharge at the resolution of the data (15 min), while at the Aletschgletscher catchment, lags of between 3 and 4.5 h were found (note, however, that correlation values are only slightly improved from those without lag). The lag at the Aletschgletscher catchment could be due to increased access to sediment caused by increasing water pressures (due to the rising limb of the hydrograph) and access to higher amounts and continued sediment input prior to the falling limb of the hydrograph.
Multivariate techniques and parameterization of water discharge (e.g., time since last peak discharge) have been used to explain a large portion of the variability between sediment concentration and discharge from glaciers (Willis et al., 1996; Swift et al., 2005). Here, implementation of the empirical model presented in Section 3.3 is used to understand processes influencing subglacial sediment discharge from the respective glaciers. At the Gornergletscher catchment, omission of the time-dependent parameter in the empirical model (b in Equation 3, suite A in Table 2), results in poor Nash-Sutcliffe efficiency (NSE) and correlation (Table 2). In the other cases (suites B and C in Table 2), time dependence substantially increases the correlation between modeled and measured sediment concentration, although NSE can remain low in suite B. Inclusion of parameter n (suite C in Table 2) modifies the effect of water discharge on suspended sediment concentration, generally causing substantial increases in NSE and further increases in correlation. The significance of the time-dependence parameter, b, underscores the evolution of subglacial sediment availability at this glacier (Figure 9). Additionally, the lower values for exponent n, suggest a muted response in sediment concentration with respect to variations in discharge (Table 3), which could also suggest more limited amounts of sediment available for transport below the glacier.
At Aletschgletscher, the model performs less well. Addition of the time-dependent parameter, b, has a much more variable effect and results in an uneven response in the skill. Values of b are much smaller at the Aletschgletscher catchment compared to the Gornergletscher catchment, suggesting that the sediment availability remains more steady across the season (Figure 9). When parameter n is considered at Aletschgletscher (suites A and C), other parameters are generally not significant (an exception being 2017, suite A). The variability in the significance and values of the empirical parameters across both years at both glaciers, along with the skill metrics, show that the empirical relationships presented here poorly model the observed data. It is quite likely that other empirical relations would perform similarly.
5.2.2. Analysis of the Long-Term Time Series of Subglacial Sediment Transport in the Gornergletscher Catchment
The high sediment discharges for Gornergletscher, found in 1973, 1983, and 1990, are not particularly remarkable at the regional scale (Costa et al., 2018). Since 1987, the Rhone catchment, in which the Gornergletscher lies, has been experiencing increased sediment concentrations and water discharge following atmospheric warming and related snow and glacier melt (Costa et al., 2018). This increase is also observed in the sediment discharge from the Gornergletscher catchment (Section 4.1, Figure 5, Costa et al., 2018) identified 1987 as a year of especially high sediment discharge. At Gornergletscher, however, the 1987 sediment discharge is only slightly above average. A large increase in sediment discharge was observed in the Rhone catchment between 2008 and 2015 (Costa et al., 2018), prior to the installation of our instruments. The low sediment discharge years from Gornergletscher in 2016 and 2017, however, do not fit into the trend observed in the Rhone catchment (Costa et al., 2018). This suggests that regional trends in sediment dynamics may not be indicative of the behavior of individual glaciers, unlike other glaciologic processes such as glacier mass balance (e.g., Huss, 2012; Pellicciotti et al., 2014).
Subglacial sediment transport does not appear to be sensitive to water discharge over decadal periods (Figure 5, Table 1). However, as 2016 and 2017 have the highest seasonal water discharges and the lowest sediment discharges, year-to-year variability may be influenced by changes in water discharge. This could be due to smaller lake drainages in recent years (Bianchi, 2016), which evacuate smaller amounts of sediment. Additionally, the increase in sediment discharge from the Gornerglestcher catchment in the 1980's, compared to 1974 and 1975, could be a result of the onset of increasing water discharge and glacier melt. Similarly, a period of consistent water discharge in the 1970's was followed by a general increase in the early 1980's (Farinotti et al., 2012), after which high amounts of annual sediment discharge are common (Figure 5). Coincident increases of both water discharge and sediment transport suggest that, while subglacial sediment dynamics are not especially sensitive to water quantities, they are sensitive to changes in hydrologic regime or climate (e.g. Koppes and Montgomery, 2009). Glacier retreat and augmented water discharge may have caused a short-term increase in sediment transport in the subglacial environment of the Gornergletscher catchment, followed by relative stability caused by sediment exhaustion. A similar progression has been observed in proglacial environments, where, after deglacierization, sediment discharge first increases and then decreases again after stabilization of the proglacial area (e.g., Ballantyne, 2002; Lane et al., 2017; Delaney et al., 2018).
To assess the ability of our empirical model to capture longer term variations in subglacial sediment discharge from Gornergletscher, the model presented in Section 3.3 was calibrated to data from 2016 to 2017. The corresponding parameters are given in row 7, Table 2. The output of the empirical model underestimates the measured sediment discharge in the 1970's and 1980's by about two-thirds (Figure 5, Table 1). This suggests that water discharge alone is a poor indicator for sediment discharge. Alternatively, sediment discharge could be far more sensitive to changes in the ability of the water to access the glacier bed and the sediment stored there.
5.3. Regional and Interannual Variability in Erosion Rates Across the Swiss Alps
Measured specific erosion rates across the Swiss Alps show considerable regional variability (e.g., Bezinge, 1987; Anselmetti et al., 2007; Meile et al., 2014; Stutenbecker et al., 2017; Delaney et al., 2018). The measurements presented here add to these data and further show substantial spatial and temporal variability in erosion rates. Rates presented here are assumed to capture the entire melt season and are calculated using the relation
where ė is the erosion rate (mm a−1), Qstot is the total volume of sediment discharged over one year (m3 a−1) as determined from Equation (2), A is the area of the catchment (m2), ρs is the density of sediment, assumed to be 1500 kg m−3, and ρb is the density of bedrock, assumed to be 2650 kg m−3 (e.g., Anselmetti et al., 2007).
Taking the Gornergletscher catchment area as 80 km2, the sediment discharge inferred earlier (Section 4.1) yields a specific erosion rate of 0.16–0.20 mm a−1 for the 2016 season and 0.25–0.33 mm a−1 for the 2017 season. These values are substantially lower than the specific erosion rates inferred for melt seasons in the 1980's, which range from 0.82 to 0.38 mm a−1 (Section 4.1, Table 1). The rates are roughly a third of the 1 mm a−1 reported for the Vispa catchment, in which the Gornergletscher lies (Stutenbecker et al., 2017).
Given a catchment area of 198 km2, a specific erosion rate of 0.43 mm a−1 can be inferred from the Aletschgletscher catchment over the 2016 season. In 2017, 0.49 mm of bedrock was eroded over the foreshortened study period (Section 4.2); 0.34 mm of bedrock was eroded over the same dates in 2016. This demonstrates greater erosion rates in 2017 over the peak of the melt season compared to 2016. From 1990 to 2002 the catchment discharged an estimated 340,000– 470,000 m3 a−1 of sediment (Morris and Fan, 1998; Meile et al., 2014), resulting in erosion rates between 1.01 mm a−1 and 1.39 mm a−1, close to those determined by Stutenbecker et al. (2017) using other techniques. Multi-beam echo-soundings of the Gebidum reservoir, below the Aletschgletscher, and an estimated reservoir retention of 50% (Brune, 1953), suggest that 212,000–262,000 m3 of sediment was deposited annually in the reservoir from 2013 to 2016 (unpublished VAW, ETH Zürich data). This results in erosion rates of 0.63 mm a−1– 0.78 mm a−1 for the Aletschgletscher catchment. Assuming that roughly 40% (Riihimaki et al., 2005) of the total sediment transport could have occurred as bedload transport, which is not measured at this location, the erosion rates from the suspended sediment data (Section 4.2) is within the range found by the multi-beam echo-soundings. The high erosion in the Aletschgletscher catchment could be the result of elevated sediment availability to transport by meltwater compared to the Gornergletscher catchment (Section 5.2.1, Figure 9). However, sediment availability could change over several years, leading to a reduction in catchment erosion rate.
The specific erosion rates determined in this study for the Gornergletscher and Aletschgletscher catchments are low compared to previous measurements for the same catchments. On the one hand, this could be due to our poor observational constraints on bedload sediment transport from these catchments in this study. On the other hand, sediment exhaustion and response to climatic change (Section 5.2.2) could result in lower erosion rates at present compared to earlier decades (e.g., Sziło and Bialik, 2018). Increased sediment discharges and erosion rates are, in fact, thought to have taken place in the 1980's and 1990's at both sites (see the previous paragraph and Section 5.2.2). In other regions of the Swiss Alps, erosion rates of about 1 mm a−1 (Anselmetti et al., 2007; Wittmann et al., 2007; Stutenbecker et al., 2017; Delaney et al., 2018) have been measured, although data collected by Wittmann et al. (2007) and Stutenbecker et al. (2017) shows substantial regional variability. Our results show that temporal variations in erosion can be significant (e.g., Kirchner et al., 2001), with catchment erosion rates for individual glaciers varying up to 40% between two seasons and by more that 50% over decadal time scales.
6. Conclusions
We presented high resolution sediment discharge measurements from the Gornerglestcher and Aletschgletscher catchments in the Swiss Alps over the 2016–2017 seasons, and compared these measurements with hydrological parameters and external datasets to make assessments of the availability of subglacial sediment, drivers of subglacial sediment discharge and possible decadal changes in sediment discharge. The amounts of sediment expelled from the catchments vary greatly between the two glaciers. This mainly results from the difference in catchment area. Specific erosion rates are 0.3–0.5 mm a−1 in the Aletschgletscher catchment and 0.2–0.3 mm a−1 in the Gornergletscher catchment, and vary by nearly 50% across different years in both locations. These erosion rates are smaller than those estimated across the European Alps (Hallet et al., 1996; Anselmetti et al., 2007; Wittmann et al., 2007; Hinderer et al., 2013; Stutenbecker et al., 2017; Delaney et al., 2018). This is possibly due to regional and temporal variability across the measurements or, possibly because our estimates are based primarily on measurements of suspended sediment, instead of bedload transport. The high erosion rates observed presently in the Aletschgletscher catchment could, additionally, be due to increased subglacial sediment availability (Section 5.2.1, Figure 9).
Our data suggest that sediment is available for transport in the subglacial environment through a variety of hydrological conditions. This is in contrast to fluvial systems, where a greater proportion of sediment is transported in high flows (Figure 10, e.g., Wolman and Miller, 1960). Several indicators suggest that the availability of subglacial sediment evolves during the season, with more sediment available for transport at the beginning of the season compared to the end, particularly in the Gornergletscher catchment. The relationship between cumulative water and sediment discharge exhibits a concave–down shape across both glaciers (Figure 9), showing that water at the beginning of the season is more efficient at transporting sediment. This could be due to the formation of a channelized drainage system as the melt season progresses (Iken and Bindschadler, 1986), which localizes water to specific patches of the glacier bed, where channels persist later in the season.
Water discharge and sediment discharge data presented here show that there is no straightforward empirical way to relate water discharge and sediment dynamics between the two studied glaciers. Seasonal evolution of sediment availability and sensitivity of water discharge to sediment concentration should be considered. The variability in the seasonal evolution of sediment availability between the Gornergletscher catchment and the Aletschgletscher catchment suggests that processes at the glacier bed—including drainage system efficiency and access of meltwater to sediment—control sediment discharge. This implies that inferring sediment discharge from hydrology alone is difficult and prone to large uncertainty, and that making estimates of future sediment discharge in this empirical framework could be problematic. These observations, along with earlier work examining subglacial sediment availability (Willis et al., 1996; Riihimaki et al., 2005; Swift et al., 2005), indicate that subglacial sediment availability may vary greatly from glacier to glacier and even between seasons.
If the relationship between water discharge and sediment is inconsistent, the ability of empirical models to forecast sediment transport is limited. Additionally, parameterizing subglacial sediment discharge in this manner across multiple glaciers is similarly restricted. The capacity of water to transport sediment is dictated by the velocity of water flowing along the glacier bed (e.g., Meyer-Peter and Müller, 1948; Engelund and Hansen, 1967). In glacial environments, water velocity is a function of the glacier surface slope and gradient of the hydraulic potential, as the water is assumed to be pressurized by the deformation of the overlying glacier ice (e.g., Walder and Fowler, 1994). Over longer periods, subglacial sediment must also be created by means of quarrying and abrasion by debris-laden ice (Alley et al., 1997). These processes are usually assumed to be related to the glacier's sliding velocity and size (Hallet, 1979; Alley et al., 1997; Herman et al., 2015), which will also change as a glacier retreats.
Linking hydrological quantities and sediment discharge using physical principles by implementing modeling frameworks, such as those presented by Walder and Fowler (1994), Creyts et al. (2013), and Carter et al. (2017) hold promise. This approach would quantify the interplay between subglacial hydrology and subglacial sediment dynamics, and enable more robust projections of the evolution of future sediment discharge from glacierized basins.
Author Contributions
ID designed the project, collected and analyzed the data and prepared the manuscript. AB and MW contributed to data collection and project design. DF provided critical oversight of the project, assisted with data analysis and manuscript preparation.
Conflict of Interest Statement
The authors declare that the research was conducted in the absence of any commercial or financial relationships that could be construed as a potential conflict of interest.
Acknowledgments
This work was funded by the Swiss National Science Foundation (SNF) National Research Programme (NRP) 70 Energy Turnaround, Project No.153927. We thank hydropower operators Alpiq, Kraftwerk Aletsch and Grand Dixance S.A. for their logistical support in data collection and use of runoff and sediment trap data. Runoff data for analysis of the Aletschgletscher catchment and precipitation data from both catchments were made available by the Swiss Federal Office for the Environment. M. Plötze offered laboratory space and assistance for analysis of water samples. F. Lindner assisted with bottle sample collection. D. Ehrbar assisted with bottle sample collection, laboratory analysis and commented on a previous version of this manuscript. D. Felix provided many useful insights into suspended sediment measurements. M. Funk and M. Jackson commented on an early version of this manuscript. The comments from the three reviewers, particularly P.M. Lefeuvre, and the editor, F. Ng, contributed greatly to the manuscript. We are especially grateful to the late D. Collins for his prolonged measurements of sediment discharge from the Gornergletscher catchment.
Footnotes
1. ^http://www.meteoswiss.admin.ch/home.html.
2. ^https://www.bafu.admin.ch/bafu/en/home.html.
References
Alley, R. B., Cuffey, K. M., Evenson, E. B., Strasser, J. C., Lawson, D. E., and Larson, G. J. (1997). How glaciers entrain and transport basal sediment: physical constraints. Q. Sci. Rev. 16, 1017–1038. doi: 10.1016/S0277-3791(97)00034-6
Anselmetti, F. S., Bühler, R., Finger, D., Girardclos, S., Lancini, A., Rellstab, C., et al. (2007). Effects of Alpine hydropower dams on particle transport and lacustrine sedimentation. Aquat. Sci. 69, 179–198. doi: 10.1007/s00027-007-0875-4
Ballantyne, C. K. (2002). A general model of paraglacial landscape response. Holocene 12, 371–376. doi: 10.1191/0959683602hl553fa
Barnett, T. P., Adam, J. C., and Lettenmaier, D. P. (2005). Potential impacts of a warming climate on water availability in snow-dominated regions. Nature 438, 303–309. doi: 10.1038/nature04141
Bauder, A., Funk, M., and Huss, M. (2007). Ice-volume changes of selected glaciers in the Swiss Alps since the end of the 19th century. Ann. Glaciol. 46, 145–149. doi: 10.3189/172756407782871701
Bendixen, M., Iversen, L. L., Bjørk, A. A., Elberling, B., Westergaard-Nielsen, A., Overeem, I., et al. (2017). Delta progradation in Greenland driven by increasing glacial mass loss. Nature 550:101. doi: 10.1038/nature23873
Bezinge, A. (1987). “Glacial meltwater streams, hydrology and sediment transport: the case of the Grande Dixence hydroelectricity scheme,” in Glacio-Fluvial Sediment Transfer: An Alpine Perspective, eds A. M. Gurnell and M. J. Clark (Chichester: John Wiley and Sons), 473–498.
Bianchi, M. (2016). Rekonstruktion der alljhrlichen Ausbruche des Gornersees fur die Periode 2004-2015. Diploma thesis, ETH Zürich.
Brune, G. M. (1953). Trap efficiency of reservoirs. Eos Trans. Am. Geophys. Union 34, 407–418. doi: 10.1029/TR034i003p00407
Carter, S. P., Fricker, H. A., and Siegfried, M. R. (2017). Antarctic subglacial lakes drain through sediment-floored canals: Theory and model testing on real and idealized domains. Cryosphere 11, 381–405. doi: 10.5194/tc-11-381-2017
Church, M., and Ryder, J. M. (1972). Paraglacial sedimentation: a consideration of fluvial processes conditioned by glaciation. Geol. Soc. Am. Bull. 83, 3059–3072. doi: 10.1130/0016-7606(1972)83[3059:PSACOF]2.0.CO;2
Collins, D. N. (1979). Sediment concentration in melt waters as an indicator of erosion processes beneath an Alpine glacier. J. Glaciol. 23, 247–257. doi: 10.1017/S0022143000029877
Collins, D. N. (1989). Seasonal development of subglacial drainage and suspended sediment delivery to melt waters beneath an Alpine glacier. Ann. Glaciol. 13, 45–50. doi: 10.1017/S026030550000762X
Collins, D. N. (1990). “Seasonal and annual variations of suspended sediment transport in meltwaters draining from an Alpine glacier,” in Proceedings of two Lausanne Symposia, Vol. 193 (London: IAHS), 439–446.
Collins, D. N. (1996). A conceptually based model of the interaction between flowing meltwater and subglacial sediment. Ann. Glaciol. 22, 224–232. doi: 10.1017/S0260305500015469
Costa, A., Molnar, P., Stutenbecker, L., Bakker, M., Silva, T. A., Schlunegger, F., et al. (2018). Temperature signal in suspended sediment export from an Alpine catchment. Hydrol. Earth Syst. Sci. 22, 509–528. doi: 10.5194/hess-22-509-2018
Creyts, T. T., Clarke, G. K. C., and Church, M. (2013). Evolution of subglacial overdeepenings in response to sediment redistribution and glaciohydraulic supercooling. J. Geophys. Res. Earth Surface 118, 423–446. doi: 10.1002/jgrf.20033
Delaney, I., Bauder, A., Huss, M., and Weidmann, Y. (2018). Proglacial erosion rates and processes in a glacierized catchment in the Swiss Alps. Earth Surface Process. Landfroms 43, 765–778. doi: 10.1002/esp.4239
Engelund, F., and Hansen, E. (1967). A Monograph on Sediment Transport in Alluvial Streams. Technical report, Technical University of Denmark.
Farinotti, D., Pistocchi, A., and Huss, M. (2016). From dwindling ice to headwater lakes: could dams replace glaciers in the European Alps? Environ. Res. Lett. 11:054022. doi: 10.1088/1748-9326/11/5/054022
Farinotti, D., Usselmann, S., Huss, M., Bauder, A., and Funk, M. (2012). Runoff evolution in the Swiss Alps: projections for selected high-alpine catchments based on ENSEMBLES scenarios. Hydrol. Process. 26, 1909–1924. doi: 10.1002/hyp.8276
Felix, D., Albayrak, I., Abgottspon, A., and Boes, R. M. (2016). “Optimization of hydropower plants with respect to fine sediment focusing on turbine switch-offs during floods,” in 28th IAHR symposium on Hydraulic Machinery and Systems, Vol. 49 (Bristol: IOP Publishing).
Felix, D., Albayrak, I., and Boes, R. (2018). In-situ investigation on real-time suspended sediment measurement techniques: turbidimetry, acoustic attenuation, laser diffraction (LISST) and vibrating tube densimetry. Int. J. Sed. Res. 33, 3–17. doi: 10.1016/j.ijsrc.2017.11.003
Felix, D., Albayrak, I., and Boes, R. M. (2013). Laboratory investigation on measuring suspended sediment by portable laser diffractometer (LISST) focusing on particle shape. Geo Marine Lett. 33, 485–498. doi: 10.1007/s00367-013-0343-1
Fenn, C. R. and Gomez, B. (1989). Particle size analysis of the sediment suspended in a proglacial stream: Glacier de Tsijiore Nouve, Switzerland. Hydrol. Process. 3, 123–135. doi: 10.1002/hyp.3360030203
Geilhausen, M., Morche, D., Otto, J., and Schrott, L. (2013). Sediment discharge from the proglacial zone of a retreating Alpine glacier. Zeitschrift für Geomorphol. Suppl. Iss. 57, 29–53. doi: 10.1127/0372-8854/2012/S-00122
Gimbert, F., Tsai, V. C., Amundson, J. M., Bartholomaus, T. C., and Walter, J. I. (2016). Subseasonal changes observed in subglacial channel pressure, size, and sediment transport. Geophys. Res. Lett. 43, 3786–3794. doi: 10.1002/2016GL068337
Gintz, D., Hassan, M. A., and Schmidt, K. H. (1996). Frequency and magnitude of bedload transport in a mountain river. Earth Surface Process. Landf. 21, 433–445. doi: 10.1002/(SICI)1096-9837(199605)21:5<433::AID-ESP580>3.0.CO;2-P
Guillon, H., Mugnier, J. L., and Buoncristiani, J. F. (2017). Proglacial sediment dynamics from daily to seasonal scales in a glaciated Alpine catchment (Bossons glacier, Mont-Blanc massif, France). Earth Surface Process. Landf. 43, 1478–1495. doi: 10.1002/esp.4333
Guillon, H., Mugnier, J. L., Buoncristiani, J. F., Carcaillet, J., Godon, C., Prud'homme, C., et al. (2015). Improved discrimination of subglacial and periglacial erosion using 10Be concentration measurements in subglacial and supraglacial sediment load of the Bossons Glacier (Mont Blanc Massif, France). Earth Surface Process. Landf. 40, 1202–1215. doi: 10.1002/esp.3713
Hallet, B. (1979). A theoretical model of glacial abrasion. J. Glaciol. 23, 39–50. doi: 10.1017/S0022143000029725
Hallet, B., Hunter, L., and Bogen, J. (1996). Rates of erosion and sediment evacuation by glaciers: a review of field data and their implications. Global Planet. Change 12, 213–235. doi: 10.1016/0921-8181(95)00021-6
Harper, J. T., Humphrey, N. F., and Greenwood, M. C. (2002). Basal conditions and glacier motion during the winter/spring transition, Worthington Glacier, Alaska, U.S.A. J. Glaciol. 48, 42–50. doi: 10.3189/172756502781831629
Herman, F., Beyssac, O., Brughelli, M., Lane, S. N., Leprince, S., Adatte, T., et al. (2015). Erosion by an alpine glacier. Science 350, 193–195. doi: 10.1126/science.aab2386
Hinderer, M., Kastowski, M., Kamelger, A., Bartolini, C., and Schlunegger, F. (2013). River loads and modern denudation of the Alps a review. Earth Sci. Rev. 118, 11–44. doi: 10.1016/j.earscirev.2013.01.001
Hodson, A. J., and Ferguson, R. I. (1999). Fluvial suspended sediment transport from cold and warm-based glaciers in Svalbard. Earth Surface Process. Landf. 24, 957–974. doi: 10.1002/(SICI)1096-9837(199910)24:11<957::AID-ESP19>3.0.CO;2-J
Huss, M. (2012). Extrapolating glacier mass balance to the mountain range scale: the European Alps 1900–2100. Cryosphere 6, 713–727. doi: 10.5194/tc-6-713-2012
Huss, M., Bauder, A., Werder, M., Funk, M., and Hock, R. (2007). Glacier-dammed lake outburst events of Gornersee, Switzerland. J. Glaciol. 53, 189–200. doi: 10.3189/172756507782202784
Iken, A., and Bindschadler, R. A. (1986). Combined measurements of subglacial water pressure and surface velocity of Findelengletscher, Switzerland: conclusions about drainage system and sliding mechanism. J. Glaciol. 32, 101–119. doi: 10.1017/S0022143000006936
Kirchner, J. W., Finkel, R. C., Riebe, C. S., Granger, D. E., Clayton, J. L., King, J. G., et al. (2001). Mountain erosion over 10 yr, 10 k. y. , and 10 m.y. time scales. Geology 29:591. doi: 10.1130/0091-7613(2001)029<0591:MEOYKY>2.0.CO;2
Koppes, M., Hallet, B., Rignot, E., Mouginot, J., Wellner, J. S., and Boldt, K. (2015). Observed latitudinal variations in erosion as a function of glacier dynamics. Nature 526, 100–103. doi: 10.1038/nature15385
Koppes, M. N., Hallet, B., and Anderson, J. (2009). Synchronous acceleration of ice loss and glacial erosion, Glaciar Marinelli, Chilean Tierra del Fuego. J. Glaciol. 55, 207–220. doi: 10.3189/002214309788608796
Koppes, M. N., and Montgomery, D. R. (2009). The relative efficacy of fluvial and glacial erosion over modern to orogenic timescales. Nat. Geosci. 2, 644–647. doi: 10.1038/ngeo616
Lane, S. N., Bakker, M., Gabbud, C., Micheletti, N., and Saugy, J. (2017). Sediment export, transient landscape response and catchment-scale connectivity following rapid climate warming and alpine glacier recession. Geomorphology 277, 210–227. doi: 10.1016/j.geomorph.2016.02.015
Mao, L., Dell'Agnese, A., Huincache, C., Penna, D., Engel, M., Niedrist, G., et al. (2014). Bedload hysteresis in a glacier-fed mountain river. Earth Surface Process. Landf. 39, 964–976. doi: 10.1002/esp.3563
Meile, T., Bretz, N. V., Imboden, B., and Boillat, J. L. (2014). “Reservoir sedimentation management at Gebidem Dam (Switzerland),” in Reservoir Sedimentation, eds J. S. A, G. Cesare, J., M. F., and M. Pfister (London: CRC Press) 245–255.
Meyer-Peter, E., and Müller, R. (1948). Formulas for Bedload Transport. Hydraulic Engineering Reports, International Association for Hydro-Environment Engineering and Research.
Micheletti, N., Lambiel, C., and Lane, S. N. (2015). Investigating decadal-scale geomorphic dynamics in an Alpine mountain setting. J. Geophys. Res. 120, 2155–2175. doi: 10.1002/2015JF003656
Morris, G. L., and Fan, J. (1998). Reservoir Sedimentation Handbook: Design and Management of Dams, Reservoirs, and Watersheds for Sustainable Use. New York, NY: McGraw Hill Professional.
Müller, G., and Förstner, U. (1968). General relationship between suspended sediment concentration and water discharge in the Alpenrhein and some other rivers. Nature 217, 244–245. doi: 10.1038/217244a0
Orwin, J. F., and Smart, C. C. (2005). An inexpensive turbidimeter for monitoring suspended sediment. Geomorphology 68, 3–15. doi: 10.1016/j.geomorph.2004.04.007
Østrem, G. (1975). “Sediment transport in glacial meltwater streams,” in Glaciofluvial and Glaciolacustrine Sedimentation, eds A. Jopling and B. McDonald (Tulsa, OK: Special Publications of SEPM), 101–122.
Pellicciotti, F., Carenzo, M., Bordoy, R., and Stoffel, M. (2014). Changes in glaciers in the Swiss Alps and impact on basin hydrology: current state of the art and future research. Sci. Total Environ. 493, 1152–1170. doi: 10.1016/j.scitotenv.2014.04.022
Raymond-Pralong, M., Turowski, J. M., Rickenmann, D., and Zappa, M. (2015). Climate change impacts on bedload transport in alpine drainage basins with hydropower exploitation. Earth Surface Process. Landf. 40, 1587–1599. doi: 10.1002/esp.3737
Richards, G., and Moore, R. D. (2003). Suspended sediment dynamics in a steep, glacier-fed mountain stream, Place Creek, Canada. Hydrol. Process. 17, 1733–1753. doi: 10.1002/hyp.1208
Rickenmann, D. (2001). Comparison of bed load transport in torrents and gravel bed streams. Water Resour. Res. 37, 3295–3305. doi: 10.1029/2001WR000319
Riihimaki, C. A., MacGregor, K. R., Anderson, R. S., Anderson, S. P., and Loso, M. G. (2005). Sediment evacuation and glacial erosion rates at a small alpine glacier. J. Geophys. Res. 110:F03003. doi: 10.1029/2004JF000189
Röthlisberger, H. (1972). Water pressure in intra– and subglacial channels. J. Glaciol. 11, 177–203. doi: 10.1017/S0022143000022188
Singh, P., Haritashya, U. K., and Ramasastri, K. S. N K (2005). Diurnal variations in discharge and suspended sediment concentration, including runoff-delaying characteristics, of the Gangotri Glacier in the Garhwal Himalayas. Hydrolog. Process. 19, 1445–1457. doi: 10.1002/hyp.5583
Stott, T., and Mount, N. (2007). Alpine proglacial suspended sediment dynamics in warm and cool ablation seasons: implications for global warming. J. Hydrol. 332, 259–270. doi: 10.1016/j.jhydrol.2006.07.001
Stutenbecker, L., Delunel, R., Schlunegger, F., Silva, T. A., Šegvić, B., Girardclos, S., et al. (2017). Reduced sediment supply in a fast eroding landscape? A multi-proxy sediment budget of the upper Rhône basin, Central Alps. Sedimen. Geol. 375, 105–119. doi: 10.1016/j.sedgeo.2017.12.013
Sugiyama, S., Bauder, A., Huss, M., Riesen, P., and Funk, M. (2008). Triggering and drainage mechanisms of the 2004 glacier-dammed lake outburst in Gornergletscher, Switzerland. J. Geophys. Res. 113:F04019. doi: 10.1029/2007JF000920
Swift, D. A., Cook, S. J., Graham, D. J., Midgley, N. G., Fallick, A., Storrar, R., et al. (2018). Terminal zone glacial sediment transfer at a temperate overdeepened glacier system. Quat. Sci. Rev. 180, 111–131. doi: 10.1016/j.quascirev.2017.11.027
Swift, D. A., Nienow, P. W., and Hoey, T. B. (2005). Basal sediment evacuation by subglacial meltwater: suspended sediment transport from Haut Glacier d'Arolla, Switzerland. Earth Surface Process. Landf. 30, 867–883. doi: 10.1002/esp.1197
Sziło, J., and Bialik, R. J. (2018). Grain size distribution of bedload transport in a glaciated catchment (Baranowski Glacier, King George Island, Western Antarctica). Water 10:360. doi: 10.3390/w10040360
Torizzo, M., and Pitlick, J. (2004). Magnitude-frequency of bed load transport in mountain streams in Colorado. J. Hydrol. 290, 137–151. doi: 10.1016/j.jhydrol.2003.12.001
Walder, J. S., and Fowler, A. (1994). Channelized subglacial drainage over a deformable bed. J. Glaciol. 40, 3–15. doi: 10.1017/S0022143000003750
Werder, M. A. (2016). The hydrology of subglacial overdeepenings: a new supercooling threshold formula. Geophys. Res. Lett. 43, 2045–2052. doi: 10.1002/2015GL067542
Werder, M. A., and Funk, M. (2009). Dye tracing a jökulhlaup: II. testing a jökulhlaup model against flow speeds inferred from measurements. J. Glaciol. 55, 899–908. doi: 10.3189/002214309790152375
Williams, G. (1989). Sediment concentration versus water discharge during single hydrologic events in rivers. J. Hydrol. 111, 89–106. doi: 10.1016/0022-1694(89)90254-0
Willis, I. C., Richards, K. S., and Sharp, M. J. (1996). Links between proglacial stream suspended sediment dynamics, glacier hydrology and glacier motion at Midtdalsbreen, Norway. Hydrol. Process. 10, 629–648. doi: 10.1002/(SICI)1099-1085(199604)10:4<629::AID-HYP396>3.0.CO;2-6
Wittmann, H., von Blanckenburg, F., Kruesmann, T., Norton, K. P., and Kubik, P. W. (2007). Relation between rock uplift and denudation from cosmogenic nuclides in river sediment in the Central Alps of Switzerland. J. Geophys. Res. 112:F04010. doi: 10.1029/2006JF000729
Keywords: alpine sediment dynamics, subglacial sediment, subglacial hydrology, sediment transport, glacier hydrology, erosion rates
Citation: Delaney I, Bauder A, Werder MA and Farinotti D (2018) Regional and Annual Variability in Subglacial Sediment Transport by Water for Two Glaciers in the Swiss Alps. Front. Earth Sci. 6:175. doi: 10.3389/feart.2018.00175
Received: 12 March 2018; Accepted: 10 October 2018;
Published: 31 October 2018.
Edited by:
Felix Ng, University of Sheffield, United KingdomReviewed by:
Leigh A. Stearns, University of Kansas, United StatesQiao Liu, Institute of Mountain Hazards and Environment (CAS), China
Pierre-Marie Lefeuvre, University of Oslo, Norway
Copyright © 2018 Delaney, Bauder, Werder and Farinotti. This is an open-access article distributed under the terms of the Creative Commons Attribution License (CC BY). The use, distribution or reproduction in other forums is permitted, provided the original author(s) and the copyright owner(s) are credited and that the original publication in this journal is cited, in accordance with accepted academic practice. No use, distribution or reproduction is permitted which does not comply with these terms.
*Correspondence: Ian Delaney, ZGVsYW5leUB2YXcuYmF1Zy5ldGh6LmNo