 Beatrice Moroni1*
 Olafur Arnalds2
 Pavla Dagsson-Waldhauserová2,3
 Stefano Crocchianti1
 Riccardo Vivani4
 David Cappelletti1
- 1Department of Chemistry, Biology and Biotechnology, University of Perugia, Perugia, Italy
- 2Agricultural University of Iceland, Hvanneyri, Iceland
- 3Faculty of Environmental Sciences, Czech University of Life Sciences Prague, Prague, Czechia
- 4Department of Pharmaceutical Sciences, University of Perugia, Perugia, Italy
This work aims to identify the geochemical and mineralogical markers of Icelandic dust and to differentiate it from the dust of local origin deposited at the Ny-Ålesund station. We characterized representative sediment samples from Iceland and Svalbard and compared them to a set of aerosol samples collected in Ny-Ålesund to check the existence and type of the mineralogical markers. The sediment samples were analyzed by X-ray diffraction (XRD) to detect the mineralogical constrain of the geochemical markers. Both aerosol and sediment samples were examined by scanning electron microscopy coupled with EDS microanalysis (SEM-EDS) and image analysis to detect and to provide a morpho-chemical characterization of the mineralogical markers of dust provenance. Comparison between local and Icelandic sediments reveals the metal oxide particles as the most representative and distinguishing mineralogical/phase markers for Iceland dust sources. In particular, we have considered the magnetite-chromite and the magnetite-ülvospinel associations as marker facies of the tholeiitic magmatic series and the presence of volcanic glass as a further indicator of provenance from Iceland. The morphochemical characteristics of the metal oxide particles in the aerosol samples compared to those of the sediment samples have proved to be a powerful tool to separate Icelandic dust from other sources for dust. In particular, the small size, higher grain boundary complexity and lower Fe/Cr ratios suggest the influence of anthropogenic sources, well in accordance with the results of air mass backward trajectories which reveal a main contribution from industrialized areas in Eurasia. This study shows the reliability of the geochemical characterization of the metal oxide particles for the identification of the source regions of dust. In addition it provides an evidence that Icelandic dust can be transported long range to Svalbard confirming the importance of High Latitude Dust sources.
Introduction
The Arctic is experiencing a dramatic impact of the present climate change; an effect referred to as the ‘Arctic amplification’ (Serreze and Francis, 2006). The mechanisms of this phenomenon are not well established, but variations in the snow- and ice-covered areas, and the resulting albedo changes seem to play a primary role in the process (Screen and Simmonds, 2010; Serreze and Barry, 2011).
It has been suggested that mineral dust contributes to ‘Arctic amplification’ (Lambert et al., 2013). Light-absorbing particulate deposited on snow can reduce surface albedo and enhance the melting of snow and ice. Mineral dust can also affect the radiative forcing in the Arctic by scattering and absorbing solar and thermal radiation (direct effect), and by acting as condensation nuclei for ice and water droplets (indirect effect).
The primary identified High Latitude sources of dust reaching the Arctic are Alaska, Canada, Greenland, and Iceland (Bullard et al., 2016; Groot Zwaaftink et al., 2016; Meinander et al., 2016). Smaller high-latitude dust sources influencing the Arctic have been identified in Siberia, Kamchatka, and over the Svalbard Norwegian archipelago. The Svalbard dust sources comprise both natural sediments suspended from dry riverbeds and anthropogenic sources from coal mines, both activated at the end of the dry summer season (Dörnbrack et al., 2010).
Iceland, with its vast active dust emission areas, strong winds year round and high frequency of dust days is the most important and the best-studied high-latitude dust area in the Northern hemisphere (Arnalds et al., 2016; Bullard et al., 2016). Iceland is a volcanic province with intense eruptive activity generating fresh basaltic materials that are subjected to aeolian and glacial processes in extensive desert areas (Sigmarsson and Steinthórsson, 2007; Arnalds, 2010). Studies on global and regional air mass atmospheric circulation reveal a significant contribution from Iceland in the air masses reaching the Arctic (Groot Zwaaftink et al., 2016, 2017; Baddock et al., 2017; ; Kylling et al., 2018; Figure 1). Airborne measurements of Icelandic dust show a high proportion of submicron particles which are prone to travel long distances (Dagsson-Waldhauserova et al., 2014, 2016).
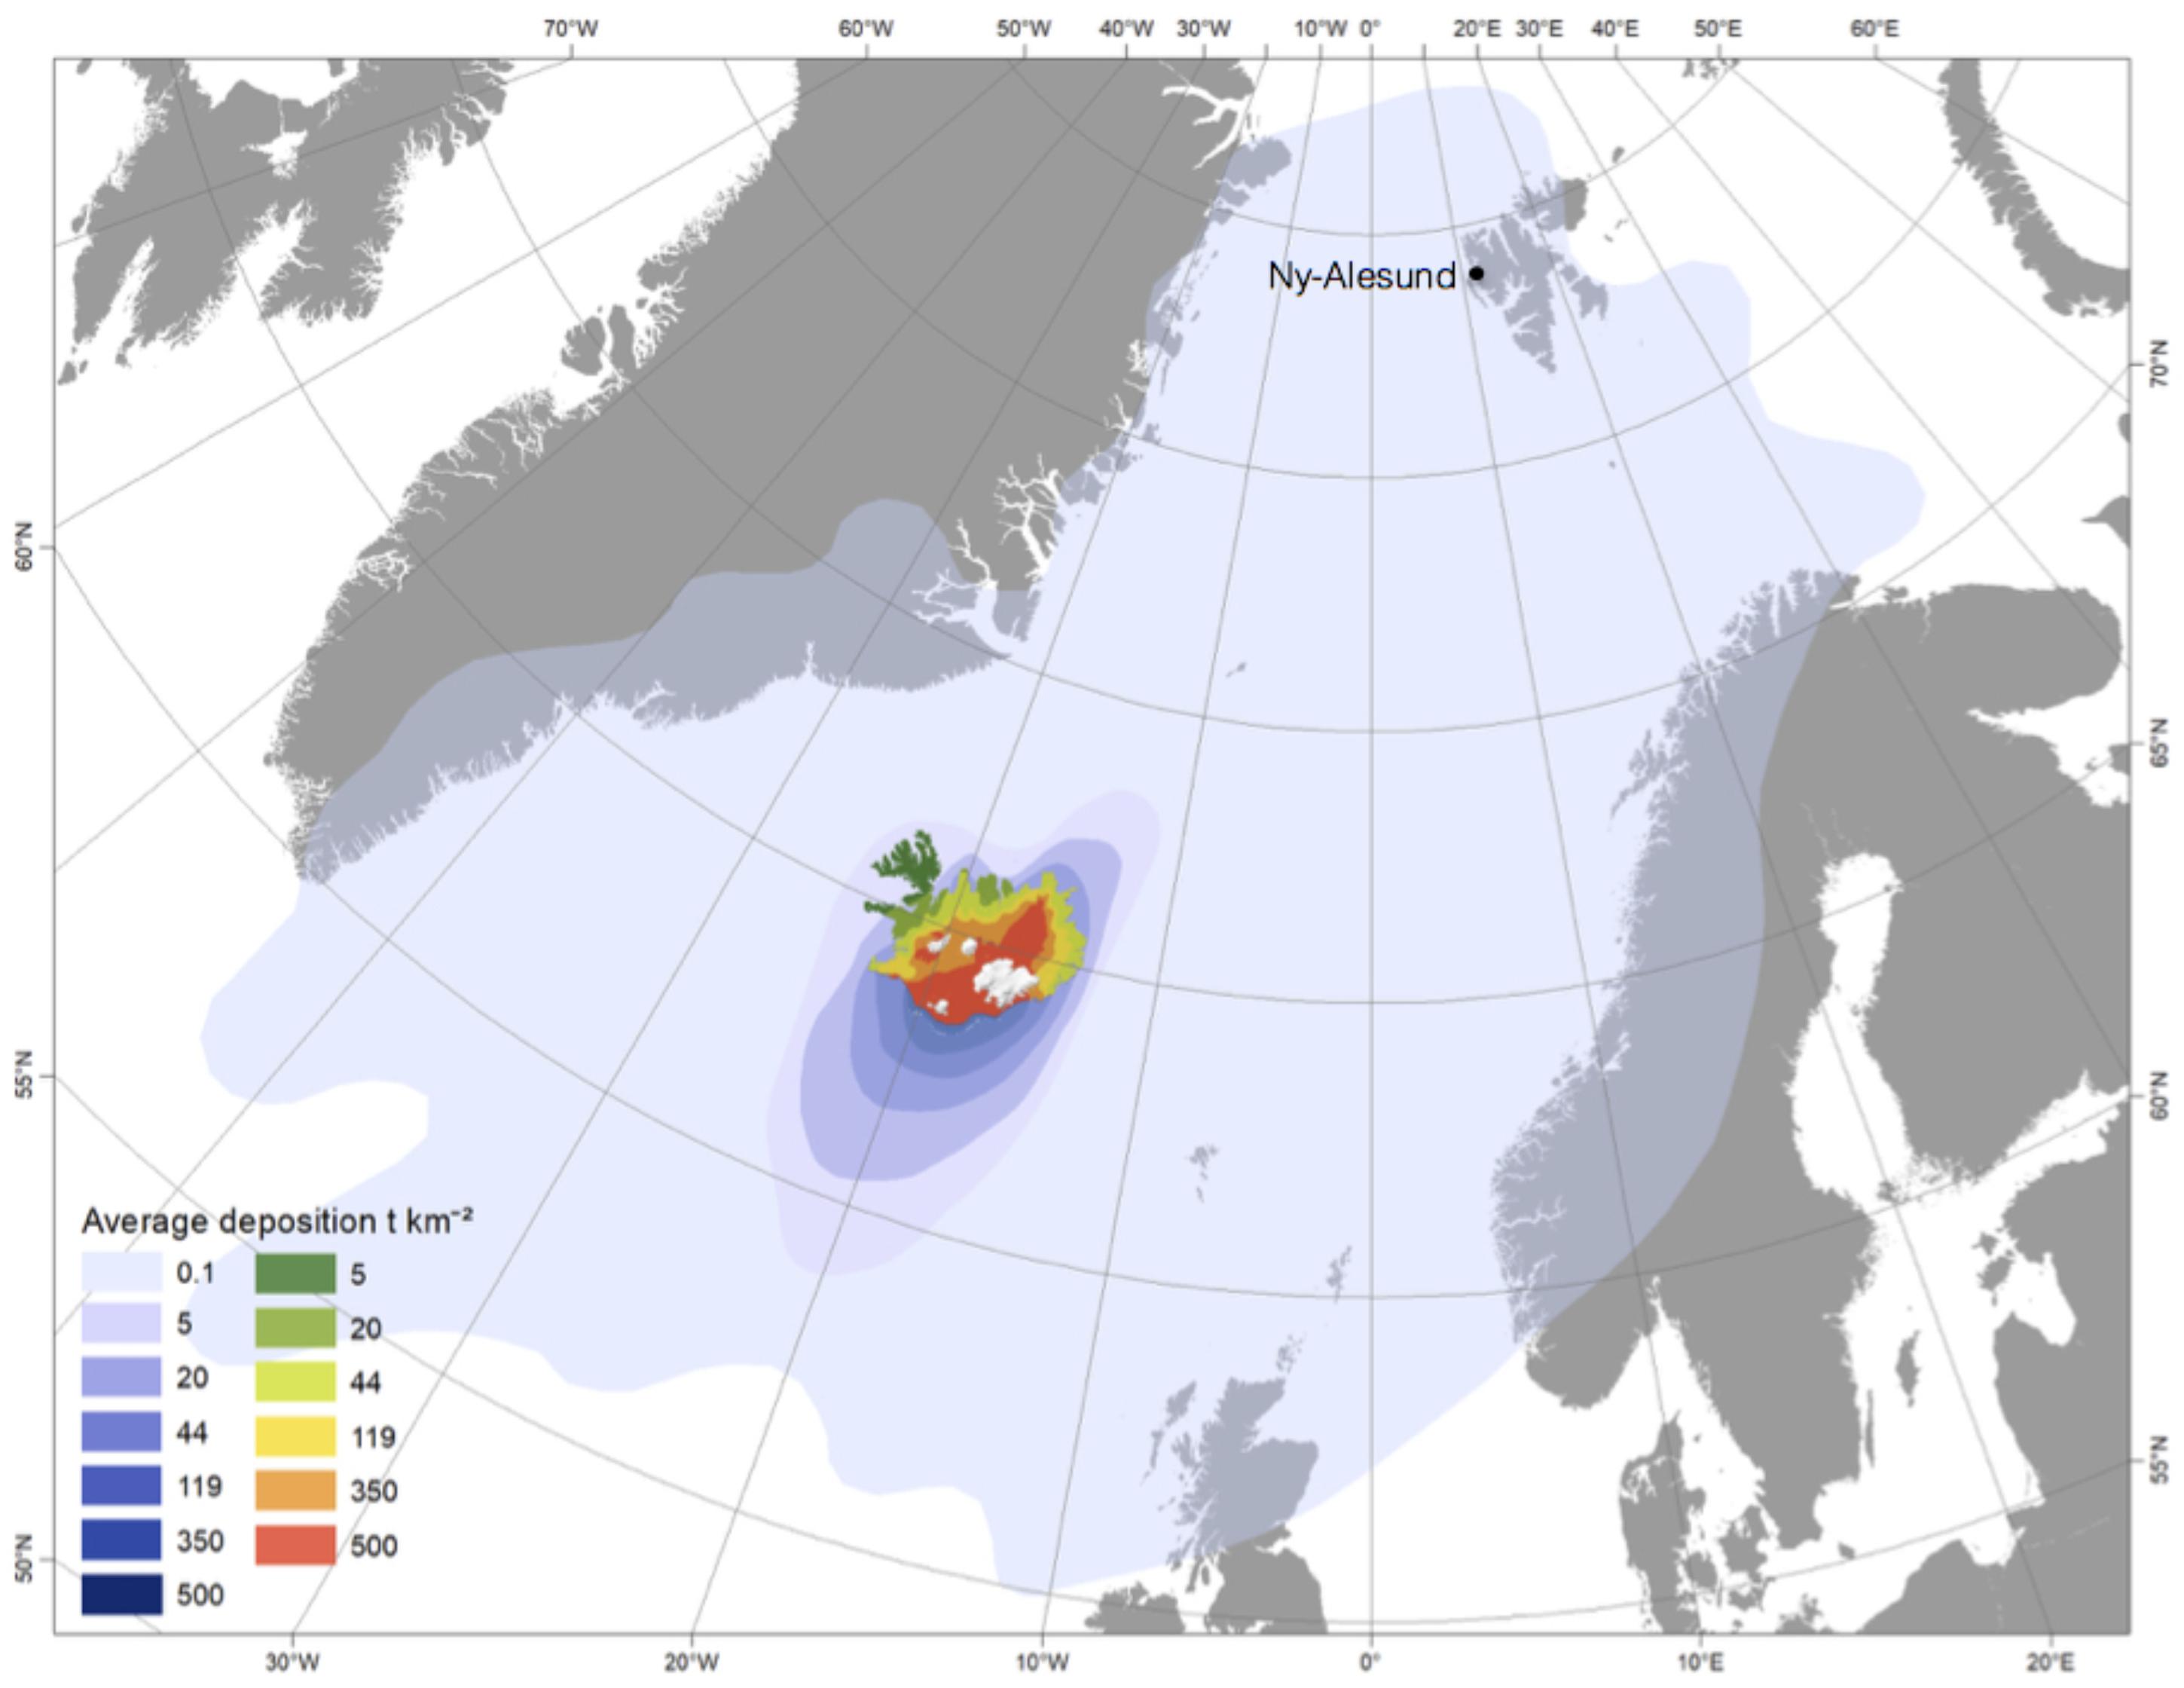
FIGURE 1. Map of average distributions of dust and volcanic ash around Iceland with main dust sources in Iceland. The map is extended from the dust depostion map by Arnalds et al. (2014) including low dust deposition class from the calculations of Groot Zwaaftink et al. (2017).
Despite these facts, studies assessing the mineralogical and the geochemical fingerprints of Icelandic dust are rare. Most of them focus on detritus matrices, both fresh and altered, collected in the proximity of the volcanic complexes (e.g., Baratoux et al., 2011). Other papers address the characterization of long-range transported volcanic ash emitted during the eruptions (e.g., Óladóttir et al., 2008). Volcanic ash, however, cannot be considered as dust since it is directly emitted in the atmosphere in few isolated events instead of being frequently uplifted from the surface.
This work aims to identify the geochemical and mineralogical markers of Icelandic dust and to differentiate it from the dust of local origin deposited at Ny-Ålesund (Svalbard). We have characterized representative sediment samples from Iceland and Svalbard and compared them to a set of aerosol samples collected in Ny-Ålesund in 2011 to check the existence and type of the mineralogical markers.
Background, Samples, and Methods
Geological Setting and Geomorphology
The Brøgger Peninsula
Ny-Ålesund is a Polar research town located on the Brøgger peninsula in Spitsbergen (Figure 1). The geology of the Brøgger peninsula (Dallmann, 2015) is characterized by a pile of thrust sheets of Permo-Carboniferous siliciclastic (sandstones and conglomerates) to carbonate (limestones and dolostones) rock formations with alternating shale levels. The thrust sheets overlie a pre-Devonian basement of low-grade metapelites (mica schists and phyllites) and marbles with minor gneissic units. In the Ny-Ålesund area, the stratigraphic sequence continues with Early Triassic dark shales overlain by a Palaeocenic succession of conglomerates, sandstones, and shales with exploitable coal seams.
Glacier retreat around the Kongsfjorden since the early-1900s has left behind large moraine fields. The loose sediments in the area of Ny-Ålesund consist of slope deposits, recent moraines, weathering material, and marine deposits. The deposits are of different extent and thickness and involve different bedrock types.
Iceland
Iceland is a volcanic island characterized by basaltic volcanic activity associated with about 30 active volcanic systems (Thordarson and Höskuldsson, 2008). Many of the most active systems are glaciated, such as the Katla, Grímsvötn, and Bár arbunga systems. These lead to the formation of hyaloclastis by the interaction of magma and ice/water (e.g., Jakobsson and Gudmundsson, 2008), and rivers draining these glaciers are loaded with sediments made of poorly crystallized basaltic grains of tholeiitic and transitional alkaline composition (Jakobsson et al., 2008). The primary dust sources, reviewed by Arnalds et al. (2016) are often at glacial margins of the most active volcanoes, such as Dyngjusandur (Bárarbunga volcanic system), Mýrdalssandur and Mælifellssandur (Katla volcanic system), and Skeiarársandur (Grímsvötn volcanic system). These dust sources are capable of producing up to 1 M tons of basaltic dust in single storms under the most extreme conditions (Arnalds et al., 2014). Pyroxenes, plagioclases, and olivines usually dominate the mineralogy, however, often poorly crystallized and sometimes with “pure” volcanic glass (e.g., Jakobsson et al., 2008; Baratoux et al., 2011).
Loose Sediment Samples
Five samples from the low terraces near Ny-Ålesund, and three samples from “sandur planes” in Iceland are considered in this paper. These samples were chosen to represent a strictly local and a remote well-established dust sources, respectively. They do not, however, represent all the variety of the dust sources in the two regions.
The samples from Ny-Ålesund were collected on the outskirts of the research town in July 2015. Summer is the best period for sampling due to the best exposure and drier conditions of the ground surface after the strong drainage consequent to deglaciation. The samples are of different origin and nature as for the geological/stratigraphic features and the mechanisms of formation/deposition (Table 1).
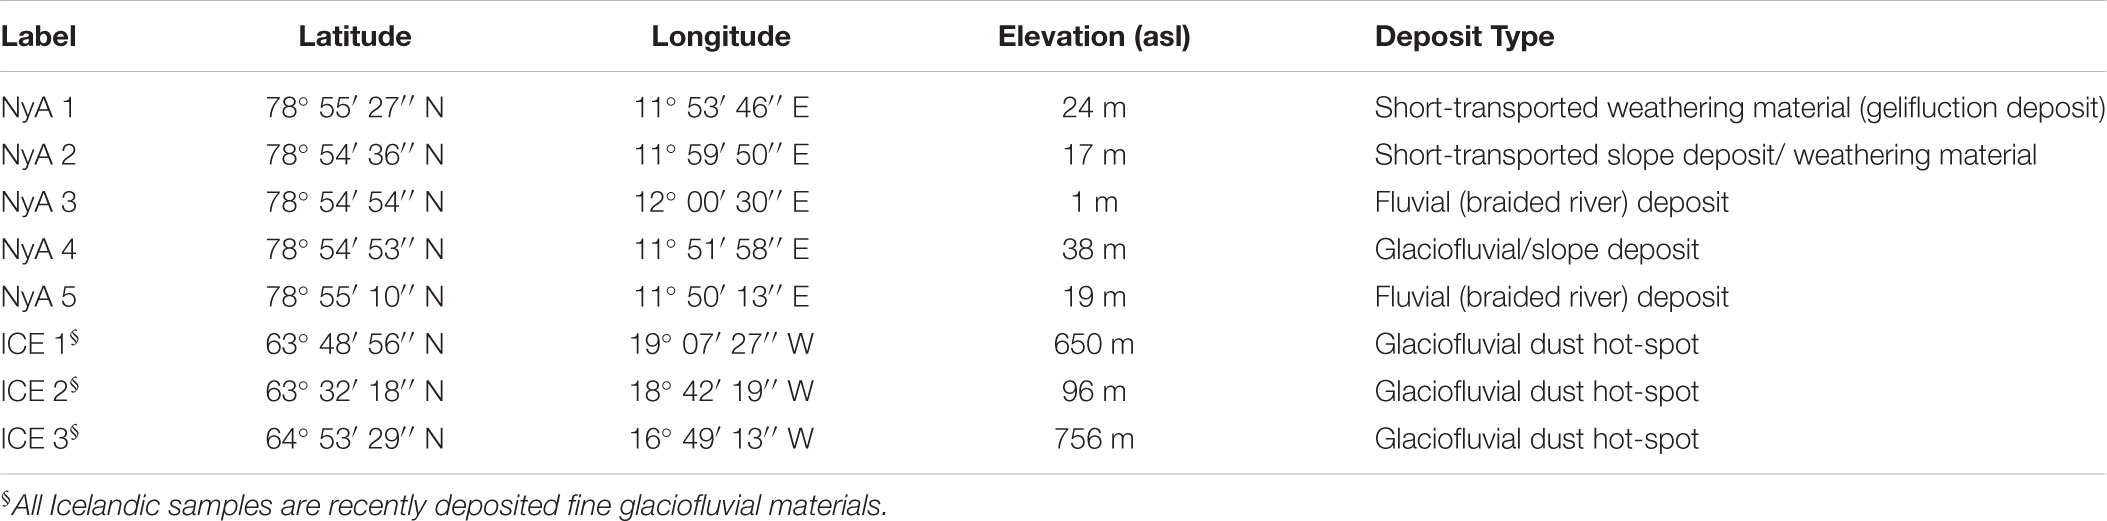
TABLE 1. Location of sediment sampling sites by Ny-Ålesund (NyA) and in Iceland (ICE).
The samples from Iceland were collected in three different sites in the southern and the north-eastern part of the island (Table 1). ICE1 refers to Mælifellssandur dust hot spot in South Iceland, a 50–60 km2 unstable glaciofluvial highland plain at 550–650 m elevation. It was collected in 2013. ICE2 is a sample from Myrdalssandur, active 60 km2 glacio-fluvial lowland plain under Katla volcano in South Iceland. ICE3 refers to Dyngjusandur in NE Iceland, the largest and most active of the Icelandic dust sources, providing dust directly to the Arctic region (Dagsson-Waldhauserova et al., 2013). Dyngjusandur dust plumes extend several hundred km from the desert (Arnalds, 2010). The active aeolian sandsheet covered an area of 270 km2 with up to 10 m thick sediments (Mountney and Russell, 2004), but new lava from the Holuhraun eruption in 2014–2015 covered about 85 km2 of the surface. The sample was collected in 2016. Samples 1 and 2 originate from the Katla volcanic system, (transitional alkali basalt and poorly crystalline), sample 3 is from Dyngjusandur, dominated by the Bárarbunga volcanic system (tholeiitic basalt and poorly crystalline, see Baratoux et al., 2011).
The sediments were dry sieved for grain size analysis using a stack of 11 sieves from 8 to 325 mesh (nominal sieve opening of 0.044, 0.088, 0.105, 0.297, 0.35, 0.50, 1.19, 1.41, 1.68, 2.00, and 2.38 mm). Results of the particle-size analysis revealed a variably sorted sandy granulometry for the Ny-Ålesund samples and a silty granulometry for the Iceland samples (Figure 2). Decreasing granulometry and increasing sorting generally follow the deposit type of the sediments from slope (low sorting) to fluvial (medium sorting) and glacio-fluvial (high sorting) sediment types.
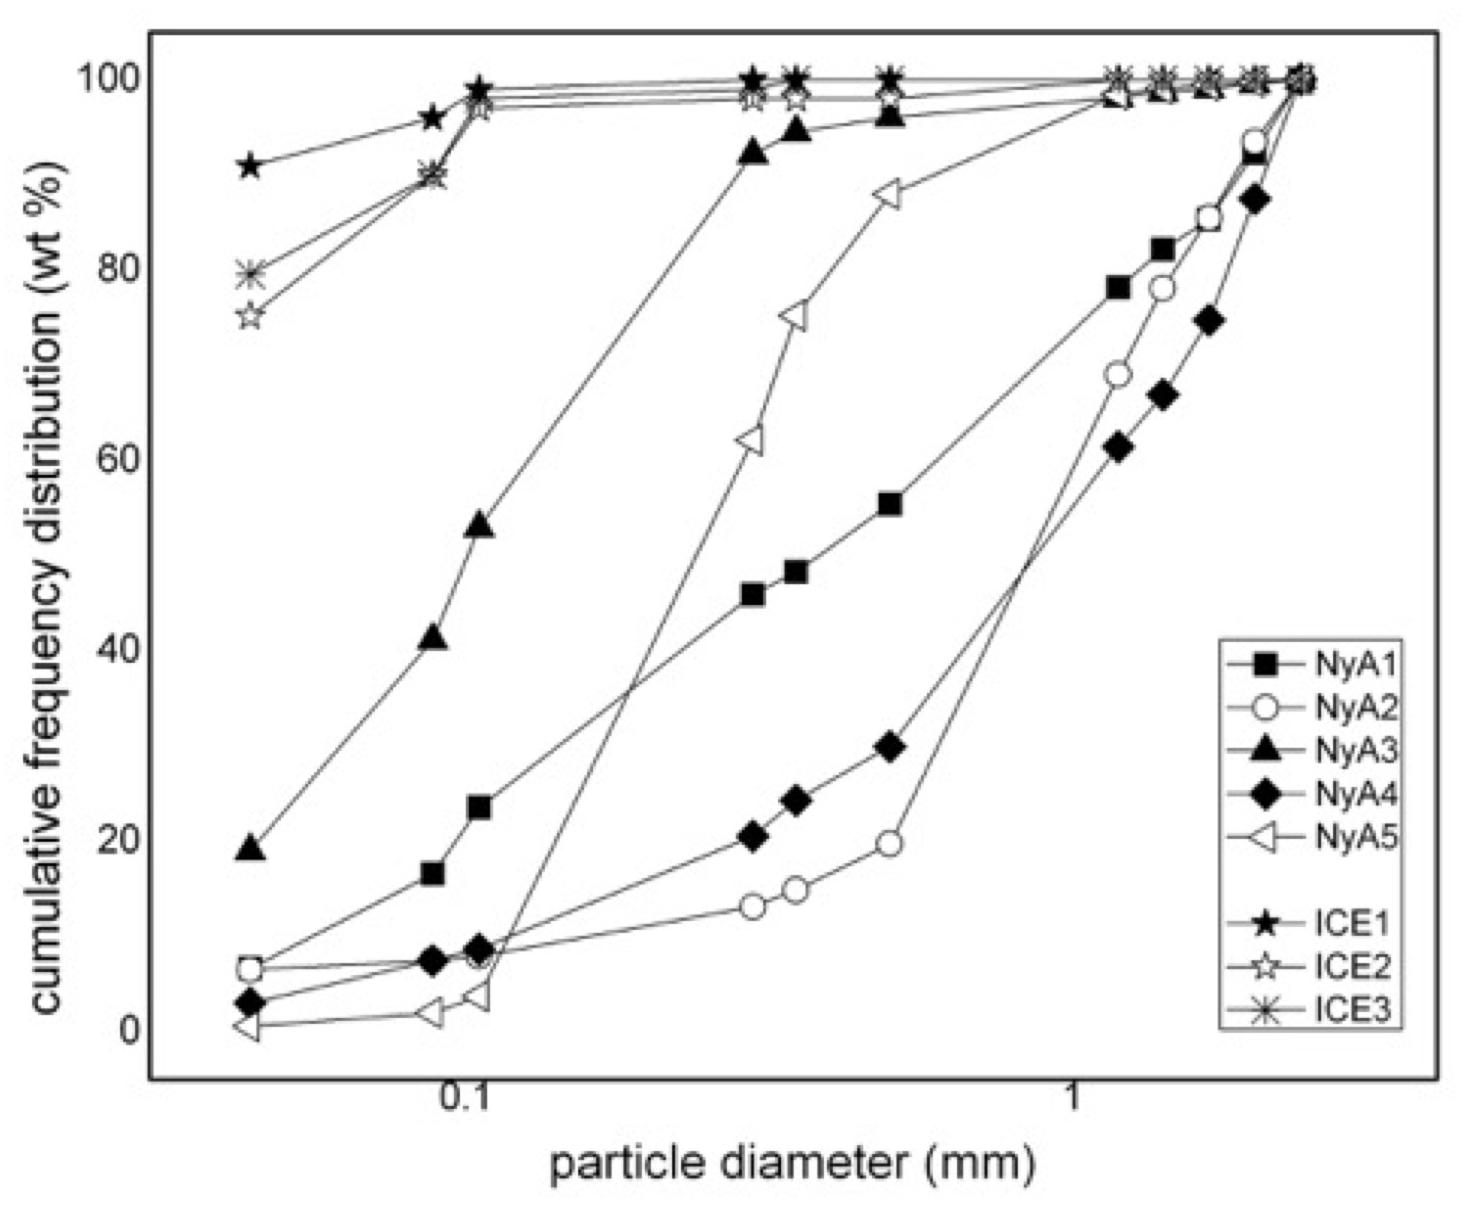
FIGURE 2. Particle size distribution curves for the sediment samples from Ny-Alesund (NyA) and Iceland (ICE).
After sieving the finest fraction of the sediment was splitted and passed over a shaking magnetic plate to retain the magnetic fraction. This latter operation was performed to obtain sediment enriched in the metal oxide particles.
Dust Emission and Air Mass Transport Activity
General Trend
The first estimates on dust emission production from Iceland range from 4 to 40 Mt per year of which about 7% can reach the high Arctic (>80 N, Arnalds et al., 2014; Groot Zwaaftink et al., 2017). Severe dust storms produce >300 000 t of dust, while the most severe wind erosion event reached aeolian transport of 11 t m-1, about 1 million t of material transported during 24 h (Arnalds et al., 2013, 2014). Long-term dust frequency in Iceland based on synoptic weather codes resulted in 135 dust days per year in 1949–2011 with increasing trends in NE Iceland since 1990 (Dagsson-Waldhauserova et al., 2014).
The Arctic dust events from the NE Iceland are typically warm, occurring during summer/autumn (May–September) under mild southwesterly winds, while the subarctic dust events from the S Iceland are mainly cold, occurring during winter/spring (March–May) and during strong northeasterly winds (Dagsson-Waldhauserova et al., 2014). About half of the dust events in S Iceland occurred in winter or at subzero temperatures. The main dust source for the NE Iceland is Dyngjusandur desert, while the most active dust sources in the S Iceland are Myrdalssandur, Landeyjarsandur, Hagavatn, and Maelifellssandur (Arnalds et al., 2016).
According to the established climatologies of the mean pressure distribution in the Arctic region (e.g., Liljequist, 1970), the trajectory climatology for Svalbard shows the North Atlantic and Eurasia as the main source regions of the air masses from winter to spring, and the Arctic region over Greenland, the North Atlantics (including Iceland) and the area surrounding Svalbard in the following period (Eneroth et al., 2003).
Phenomenologies in 2011
Long-term frequency of dust days in Iceland shows that the year 2011 was below average in dust days compared to the period 1949–2011 (Dagsson-Waldhauserova et al., 2014). Meteorological records of dust emission in 2011 report 21 dust days in NE Iceland and 69 dust days in the south of the island. In the northeast of Iceland, dust days occurred mainly in spring and summer with a peak in June and July. In southern Iceland, instead, the dust days mostly occurred in spring with highest numbers in April and May. That is in good accordance with the general trend obtained in the South Iceland (Prospero et al., 2012; Dagsson-Waldhauserova et al., 2014; Bullard et al., 2016). Duration of the dust events was quite different in the two sectors, namely in NE Iceland, a total of 11 out of 21 events lasted not about 3 h of the day whereas in S Iceland, a significant part of the dust events (28 out of 69 dust days) lasted more than half a day.
Results of back-trajectory (BT) analysis identify 23 days in 2011 characterized by air mass circulation passing over Iceland before reaching Ny-Ålesund. Six days were in winter (January and March), eight in spring (April), five in late summer (August to September), and four in winter (November). The winter air tracks affected the NW side of Iceland for up to 6 h during the day. The spring tracks passed over the S of Iceland and lasted 6 to 24 h while those in summer lapped the NW and SE coasts of the island for less than half a day and autumn tracks involved different sectors over the island and different time spans (6–24 h) over the day.
Combined evaluation of the dust emission and the BT data sets revealed April as the most favorable period for Icelandic dust advection over Svalbard due to the convergence between maximum frequency of dust events and maximum probability of air mass circulation over Iceland.
Aerosol Samples
Aerosol samples were collected at the Grüvebadet site, an Italian research facility located 800 m SW from the Ny-Ålesund village. The station has been active since 2009 and is devoted to the study of the physical and chemical properties of the Arctic aerosol (Cappelletti et al., 2016). The site is equipped with a set of sampling devices (i.e., PM10 low and medium-volume samplers, four-stage and 12-stage impactors with daily and four-day resolution) operating with various filter media.
Aerosol samples were collected in the second half of April 2011. In particular, air mass BT analysis revealed an air mass circulation from North America passing over Iceland on both April 18 and 26, and circulation from the Arctic/Atlantic ocean with some part from Greenland and Iceland arriving in Svalbard on April 22 and 29 (Figure 3). Looking to the BT patterns, the contribution from Iceland to the dust load is expected to be high on April 26 when a channeled air flow originating in the Arctic ocean crossed the North American continent at high altitude before experiencing a steep descending motion over Iceland up to the Svalbard archipelago. On the other hand, the dust contribution from Iceland is expected to be low on April 18 for the presence of an atmospheric circulation from the Siberian coasts on that day. A mix of Greenland and Iceland contributions is expected to occur on April 22 and 29 when two distinct air mass circulations had passed at low height upon Greenland and Iceland before converging over Svalbard.
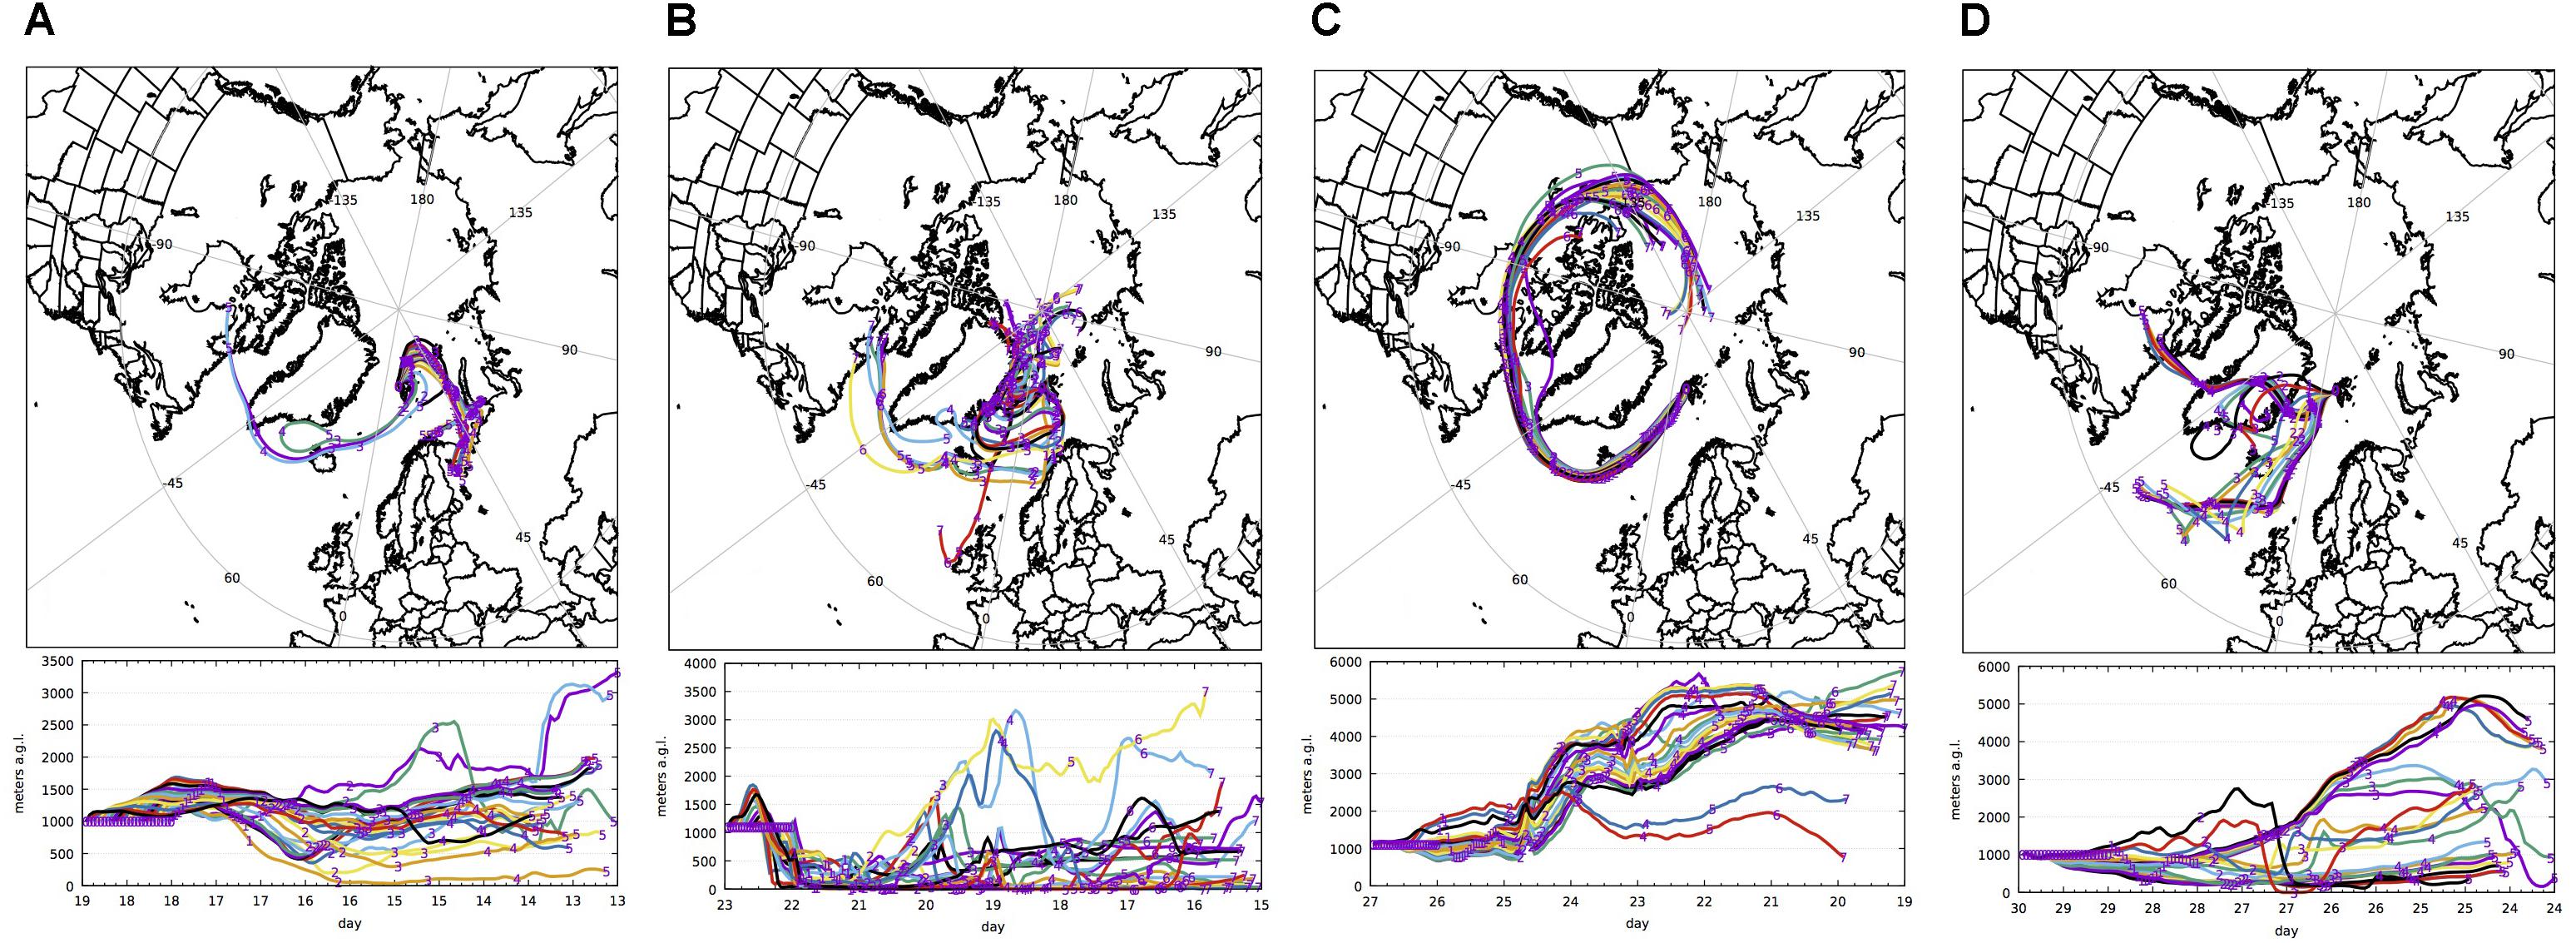
FIGURE 3. Plots of 120 h back trajectories of April 18 (A), 22 (B), 26 (C), and 29 (D), 2011 ending at 1000 m a.g.l. (April 18 and 29) and at 1100 m a.g.l. (April 22 and 26) upon Ny-Ålesund.
The desert Dyngjusandur in the NE Iceland was actively producing dust at the end of April 2011 (Table 2) and was responsible for the significant dust load observed in that period. The SYNOP codes from the weather station in Grimsstadir reported dust codes on April 30, but there was a gap in observations for the previous weeks. There is only one aerosol station in NE Iceland, which is located in Akureyri and provides PM10 concentrations. Although Akureyri is not located in the center of the pathways of dust storms from Dyngjusandur, it has captured episodes of increased PM10 on 14, 24, 26, and 27 April. BT analysis from Svalbard suggested that air parcels passing over NE Iceland on April 14, 24 and 26 reached Ny-Ålesund on April 18, 26, and 29, respectively. The BTs from Svalbard on April 22 passed South Iceland on April 18/19 when no dust was observed in Iceland. Dust was also detected at altitude 2–3 km above NE Iceland by CALIPSO on April 24/25 2011, shortly after the backward trajectory was passing Iceland. These are strong indications that Icelandic dust could have been transported to Svalbard during these periods.
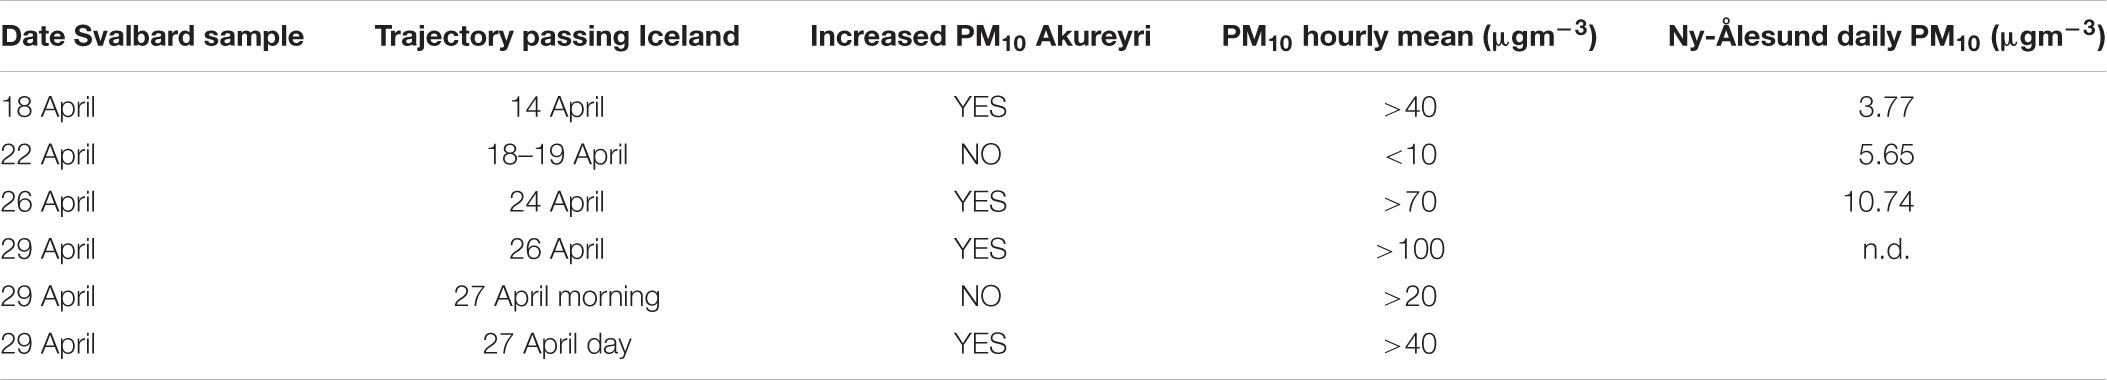
TABLE 2. Dates of dust days in Iceland and corresponding PM10 concentrations at Akureyri and dust load in Ny-Ålesund.
The aerosol samples were collected 2 m above ground level using a DEKATI 4-stage (>10, 10–2.5, 2.5–1, <1 μm ranges) medium volume impactor (flow rate 29 L min-1) operating with polycarbonate membranes (stages 1 to 3; Ø = 25 mm) and Teflon filters (stage 4; Ø = 47 mm). A progressive increase of the temperature characterized the synoptic conditions during sampling, relative humidity and pressure mean levels due to the orographically channeled wind. Sporadic to persistent cloud decks were also recorded at a different height above the ground level related to local orography and the persistent temperature inversion in the lower troposphere. A list of the samples with relevant features and corresponding environmental conditions is reported in Table 3.

TABLE 3. Characteristics (time and duration) and environmental conditions of aerosol sampling.
X-Ray Powder Diffraction Spectroscopy
The phase composition of the sediment samples was investigated by X-ray powder diffraction (XRD) using a PANalytical X’Pert Pro diffractometer, with the Ni-filtered CuKα radiation (40 kV, 40 mA). The goniometer operated in Bragg-Brentano geometry and was equipped with an X’Celerator fast detector. Samples were grinded in an agate mortar and carefully sideloaded onto a zero-background sample holder. Data were collected in the 3 – 120° 2theta range using a 0.017° step scan and 100 s counting time.
Qualitative phase analysis was performed using the ICDD PDF2 database under the X’Pert Highscore software. The weight fraction of the amorphous component of the Icelandic samples was determined by an indirect method using a Rietveld refinement procedure: a weighed amount of fully crystalline internal standard (in this case silicon, about 10% w/w) was added to the samples, and a quantitative phase analysis, with the Rietveld method, was performed. The procedure involved the refinement of scale factors, background, profile parameters, and if required, also a careful refinement of unit cell parameters, when little misfits between literature and experimental data were detected.
The refinement of scale factors per each crystalline phase allowed to determine the weight fractions of phases, referred to the crystalline fraction of samples. The knowledge of the added weight fraction of internal standard allowed to calculate the weight fractions referred to the whole sample, using the following equation:
where xi,c is the recalculated actual weight fraction of phase i, xi, and xs are the refined weight fractions of phase i and the internal standard, respectively, and xs,w is the actual added weight of the internal standard. The weight fraction, xa, of the amorphous component was then calculated following the method by Gualtieri et al. (2006):
The patterns used for Rietveld refinements were collected in the 4 – 80° 2theta range using a 0.033° step scan and 3000 s counting time. Rietveld refienements were carried out using the GSAS software (Larson and von Dreele, 2001).
Scanning Electron Microscopy
Individual particle analyses were performed by scanning electron microscopy coupled with energy-dispersive X-ray microanalysis (SEM-EDS). The aerosol samples were prepared by cutting single portions (∼10 mm × 10 mm) from the central part of the polycarbonate sampling filters and mounting them on to SEM aluminum stubs using double-sided carbon tape. The loose sediment samples were prepared by mounting a small aliquot of the magnetically separated sediment directly onto the double-sided carbon tape. Both sample types were finally coated with a 100–150 Å carbon film to provide electrical conductivity and prevent charge build-up during the exposure to the electron beam.
Scanning electron microscopy imaging was performed using a ZEISS Supra 25 microscope equipped with a field emission gun and a GEMINI column employed at a variable voltage (0.5–15 kV) and magnification (500 to 350 000 ×) to distinguish particle types and textural details. The instrument is also equipped with an X-ray dispersive spectrometer (QUANTAX EDS microanalysis system coupled with ESPRIT software for data treatment). EDS spectra (spot size 5, working distance 8.5 mm) were collected for 90 s and the elemental composition obtained after standardless matrix correction provided by the ESPRIT software. Values lower than 0.1 wt% (SEM detection limit) were omitted.
Manually selected particles in the digitalized images underwent image analysis (IA) using the software Image Tool 3.01 and a set of morphological parameters for each particle grain was obtained. In particular, we consider the Feret diameter (FD) and the shape factor (SF). According to Russ (1995), the FD is the diameter of a circle having the same area as the object:
while the SF is defined as the reciprocal of the roundness:
A and P are the area and the perimeter of the geometrical projection of a particle within the image. FD and SF, thus, provide a measurement of the mean grain size and the border complexity of grains, respectively. The analytical precision, obtained from triplicate measurements of selected particles at different magnification (5000, 10000, and 20000×), is better than 2% for FD and better than 5% for the SF.
Results and Discussion
Mineral Chemistry and Phase Composition of the Loose Sediment Samples
The five samples from Ny-Ålesund (hereafter NyA) contain the following mineral phases: dolomite, calcite, quartz, albite, and the sheet silicates vermiculite, muscovite, and clinochlore. NyA1 and NyA5 contain all the above phases in comparable amounts except for calcite, which is practically absent in NyA1. NyA2 is mainly composed of quartz with less albite, clinochlore, muscovite, and vermiculite and negligible calcite and dolomite amounts. NyA3 contains a minimal amount of calcite while NyA4 is dominated by quartz, calcite, and dolomite with only a small amount of muscovite and less clinochlore, albite and vermiculite. A rough estimate of the phase amounts in the samples based on the relative intensities of reflections is reported in Table 4.
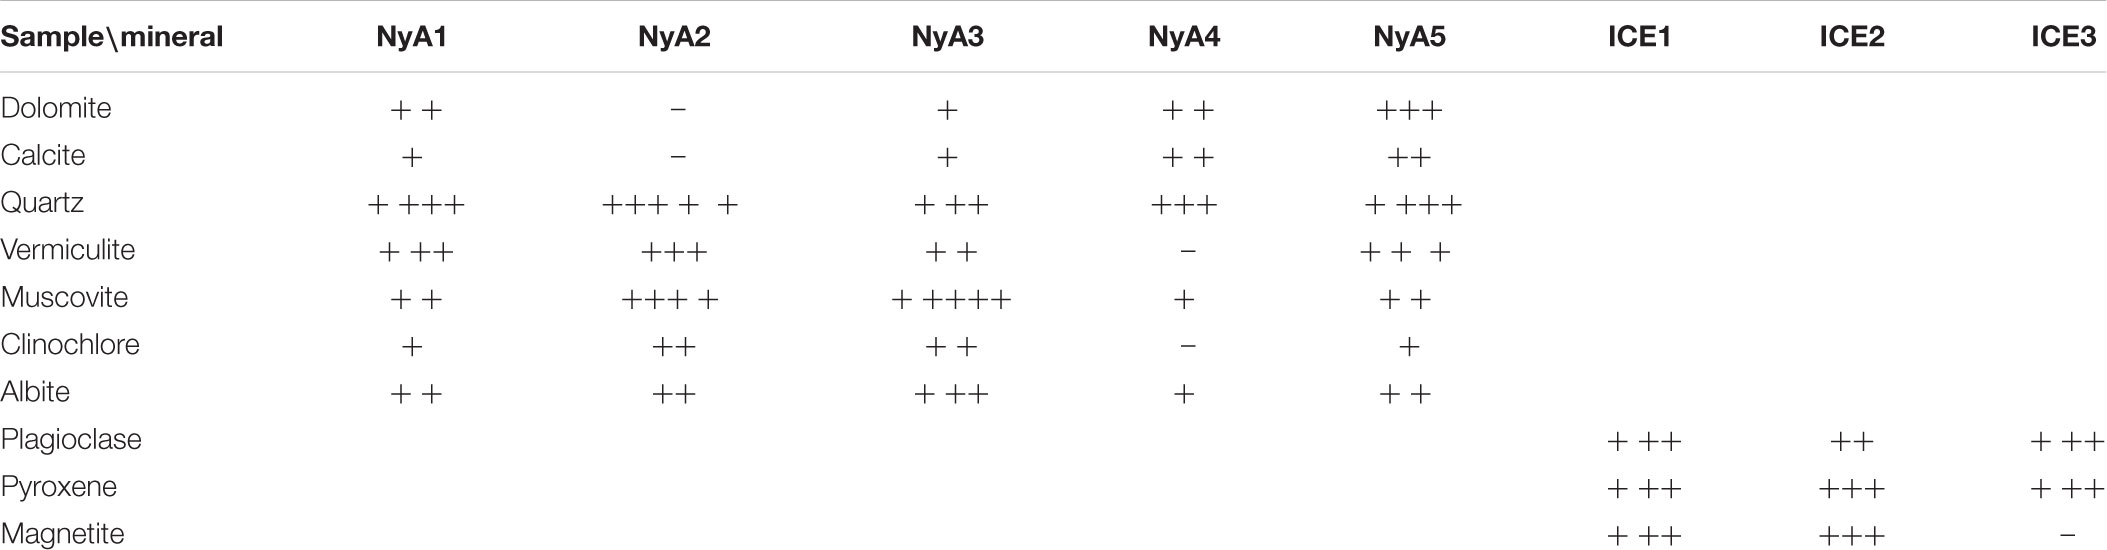
TABLE 4. Raw estimation of phase amounts in the samples, based on the relative intensities of XRD reflections.
The sheet silicates show two distinct patterns of composition related to the amounts of the ferromagnesian and the alkali elements with respect to the Al amounts (Figure 4). The first pattern, corresponding to the higher Mg/Al and Fe/Al ratios, can be ascribed to trioctahedral micas (biotite and phlogopite) and mica-like minerals (trioctahedral chlorites and Mg-vermiculite) these latter being enriched in Fe and depleted in Mg in respect to the reference minerals. This pattern is in good accordance with the mineralogy and the paragenesis of the underlying rocks (Dallmann, 2015). The second pattern, corresponding to the lower Mg/Al and Fe/Al ratios, can be ascribed to dioctahedral mica (muscovite) and mica-like minerals (mixed-layer illite-smectite). This pattern is characterized by a positive correlation between Fe and alkali amounts which suggests higher amounts of Fe3+ in respect to the Fe2+ amounts (a typical feature of illite/smectite minerals). Illite-smectite is one of the most common clay minerals in sedimentary rocks and a prime component in many soils as a weathering product of basic rocks.
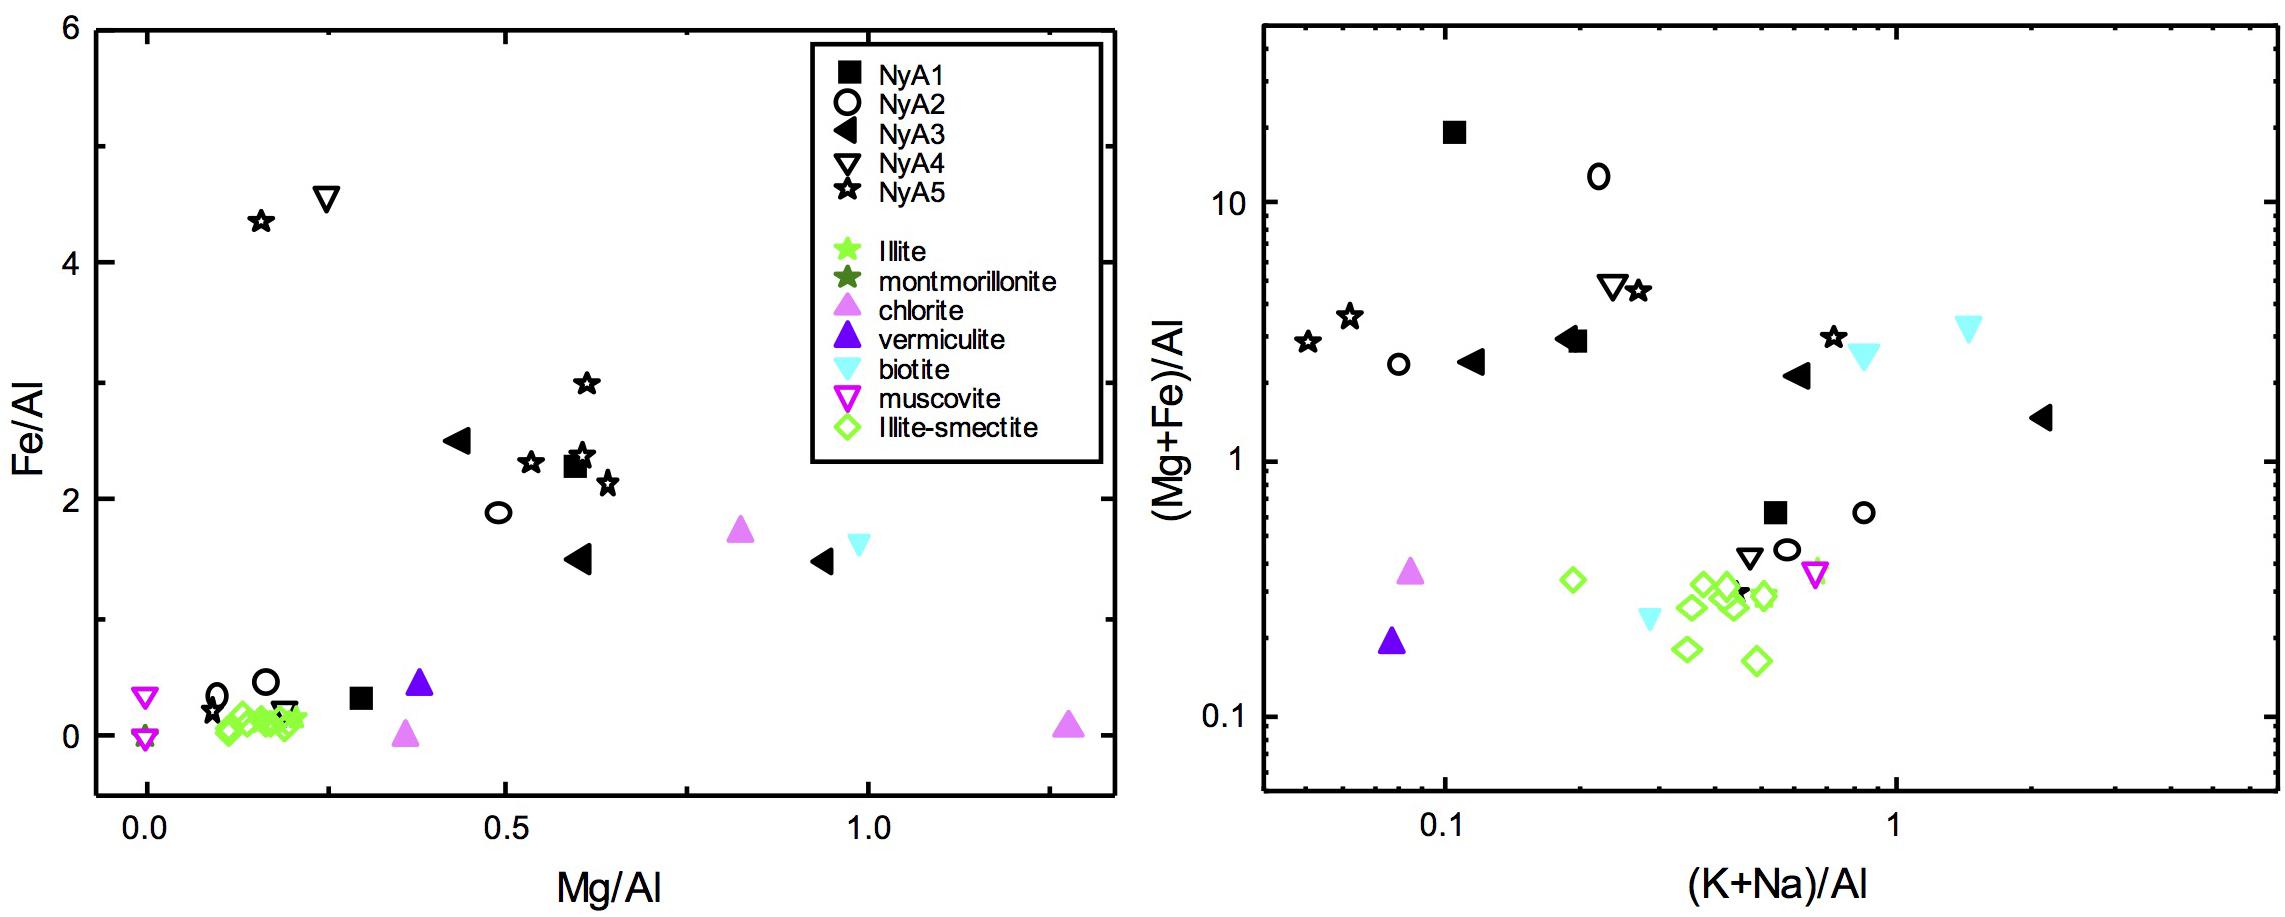
FIGURE 4. Chemical composition by SEM-EDS microanalysis of the sheet minerals in the loose sediment samples from Ny-Ålesund (NyA). Analyses of reference sheet minerals (Srodon et al., 1986; Deer et al., 1992; http://www.webmineral.com) are reported for comparison.
SEM-EDS investigations revealed the presence of monazite, zircon, apatite, baryte, iron sulfate, Fe, Ti, Cu, and Zn ores as accessory phases (Figures 5, 6). All these phases are well within the geological context. In particular monazite and zircon, two heavy minerals somewhat stable against meteoric and intrastratal solutions, are compatible with metapelitic schist basement rocks involved in prolonged fluvial transport (Hodson and Ferguson, 1999). The same occurs for the metal (Fe, Ti, Cu, and Zn) ores whereas apatite documents the raising of a submerged marine shelf area and the development of the coastal terrace after deglaciation (Cook and Kiaerner, 2008; Ottesen et al., 2010). Baryte and iron sulfate are related to the coal formations in which they can originate by syngenetic processes and by pyrite oxidation, respectively (Michelsen and Khorasani, 1991).
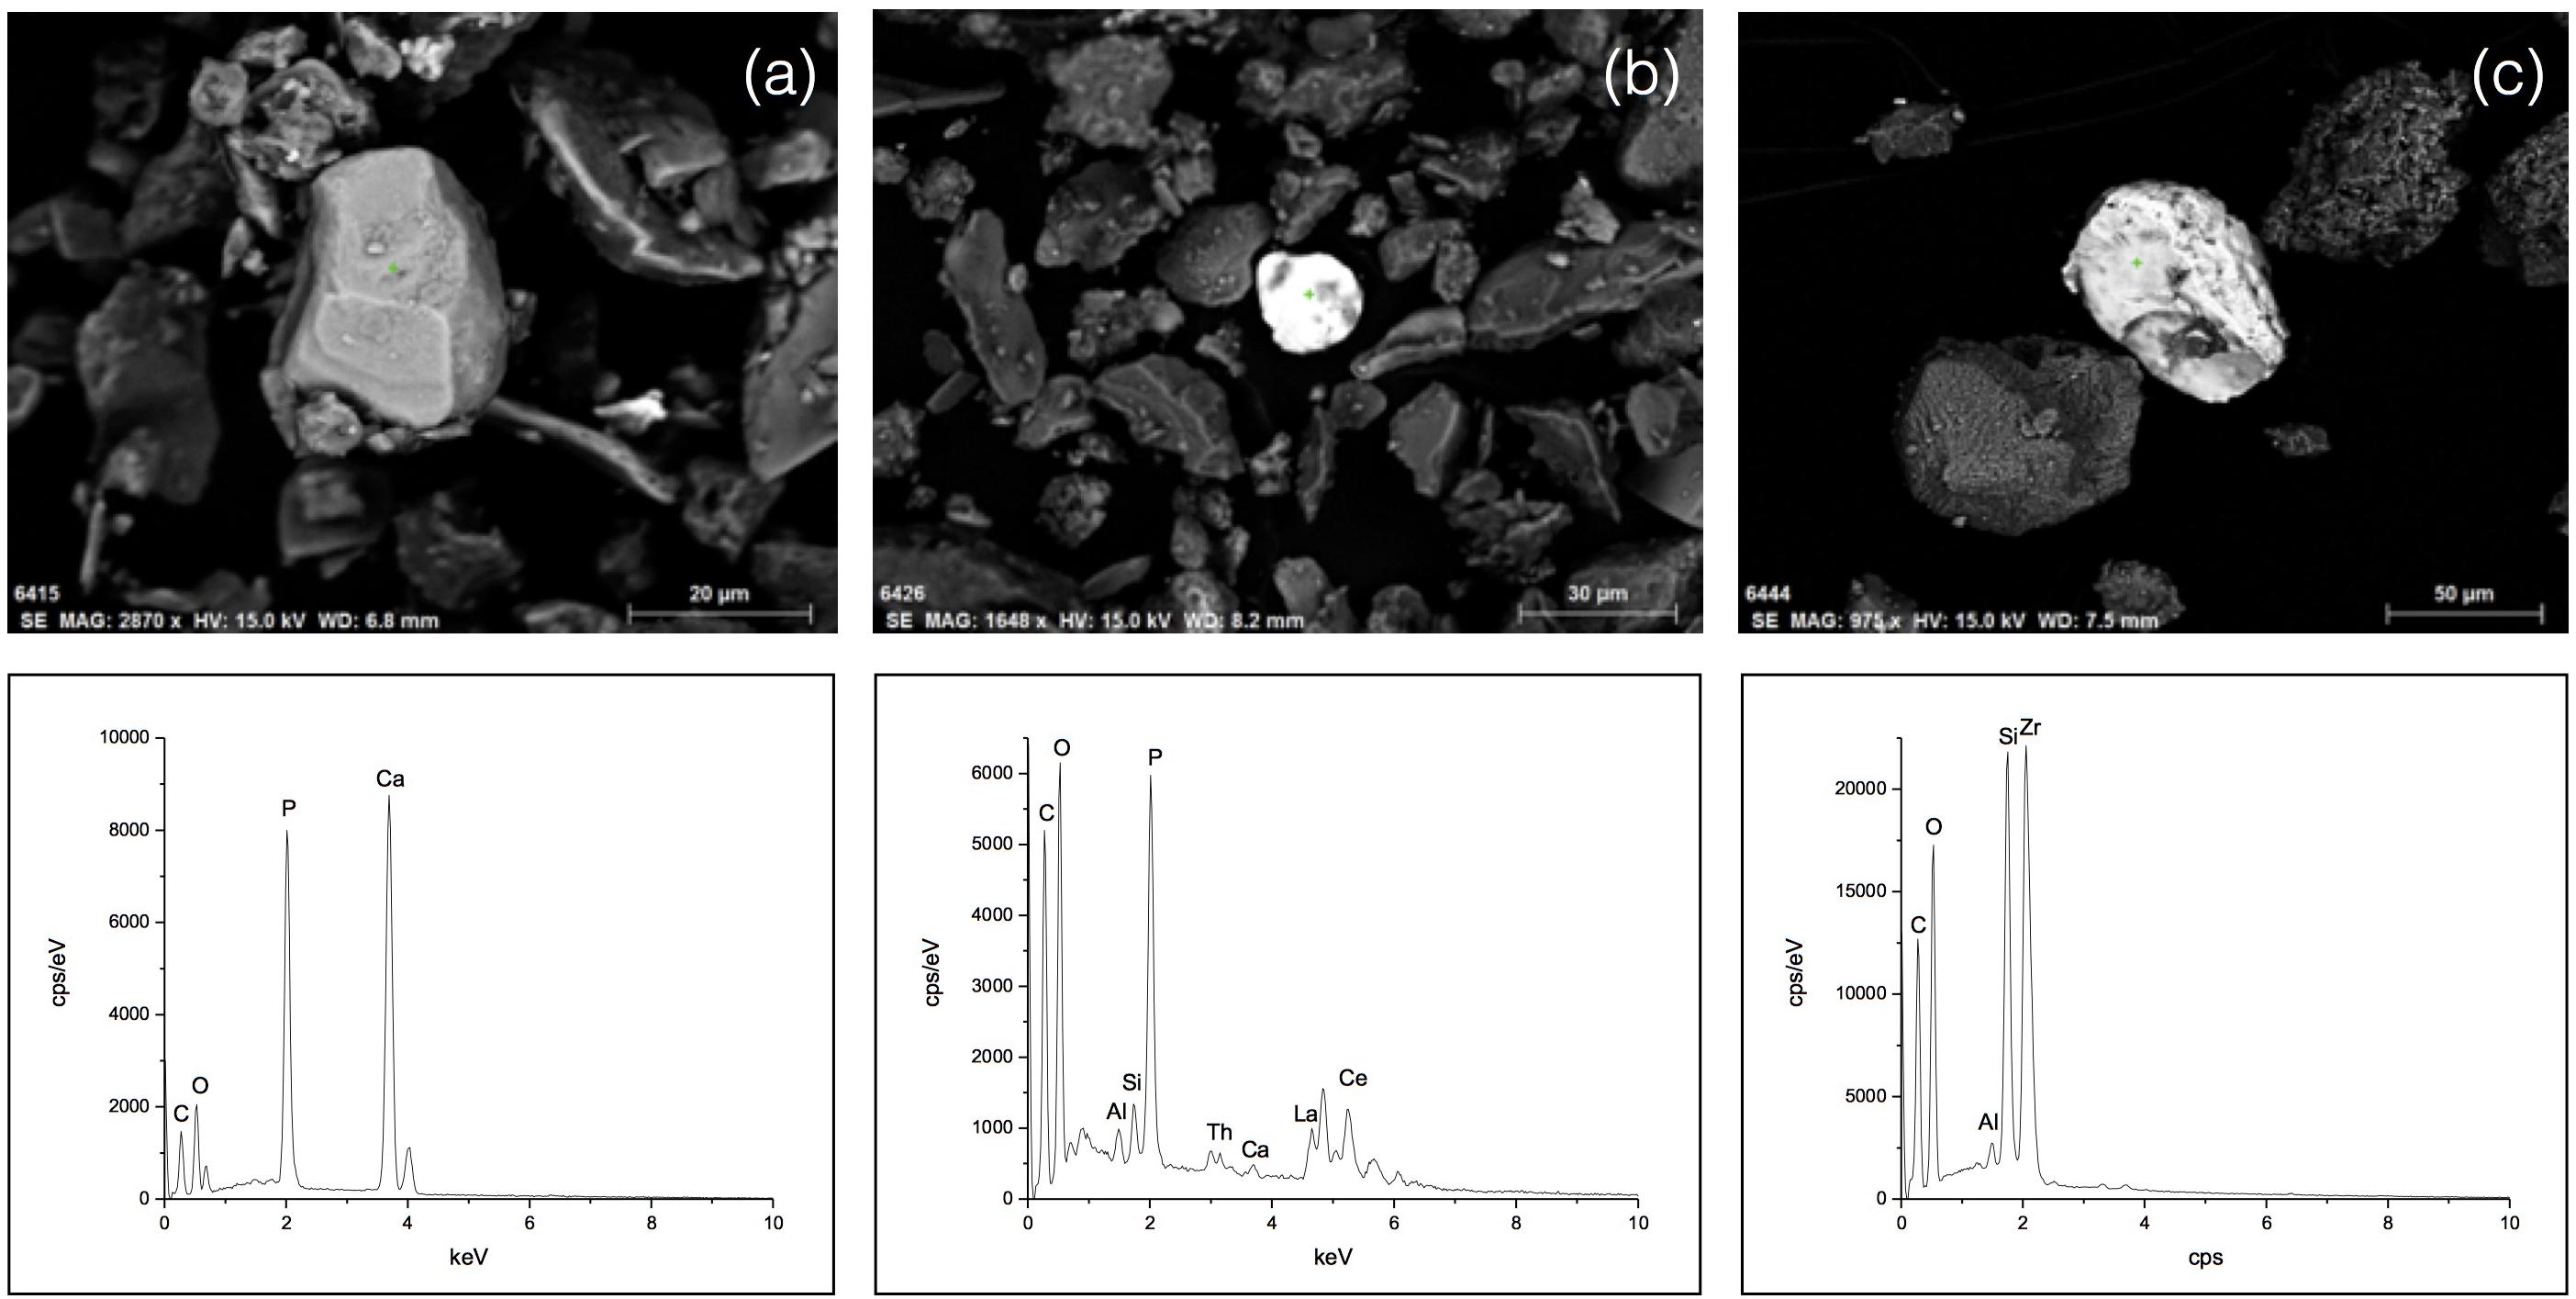
FIGURE 5. Scanning electron microscopy micrographs and EDS spectra of (a) apatite, (b) monazite, and (c) zircon grains in NyA sediments. The green crosses mark the spot analysis.
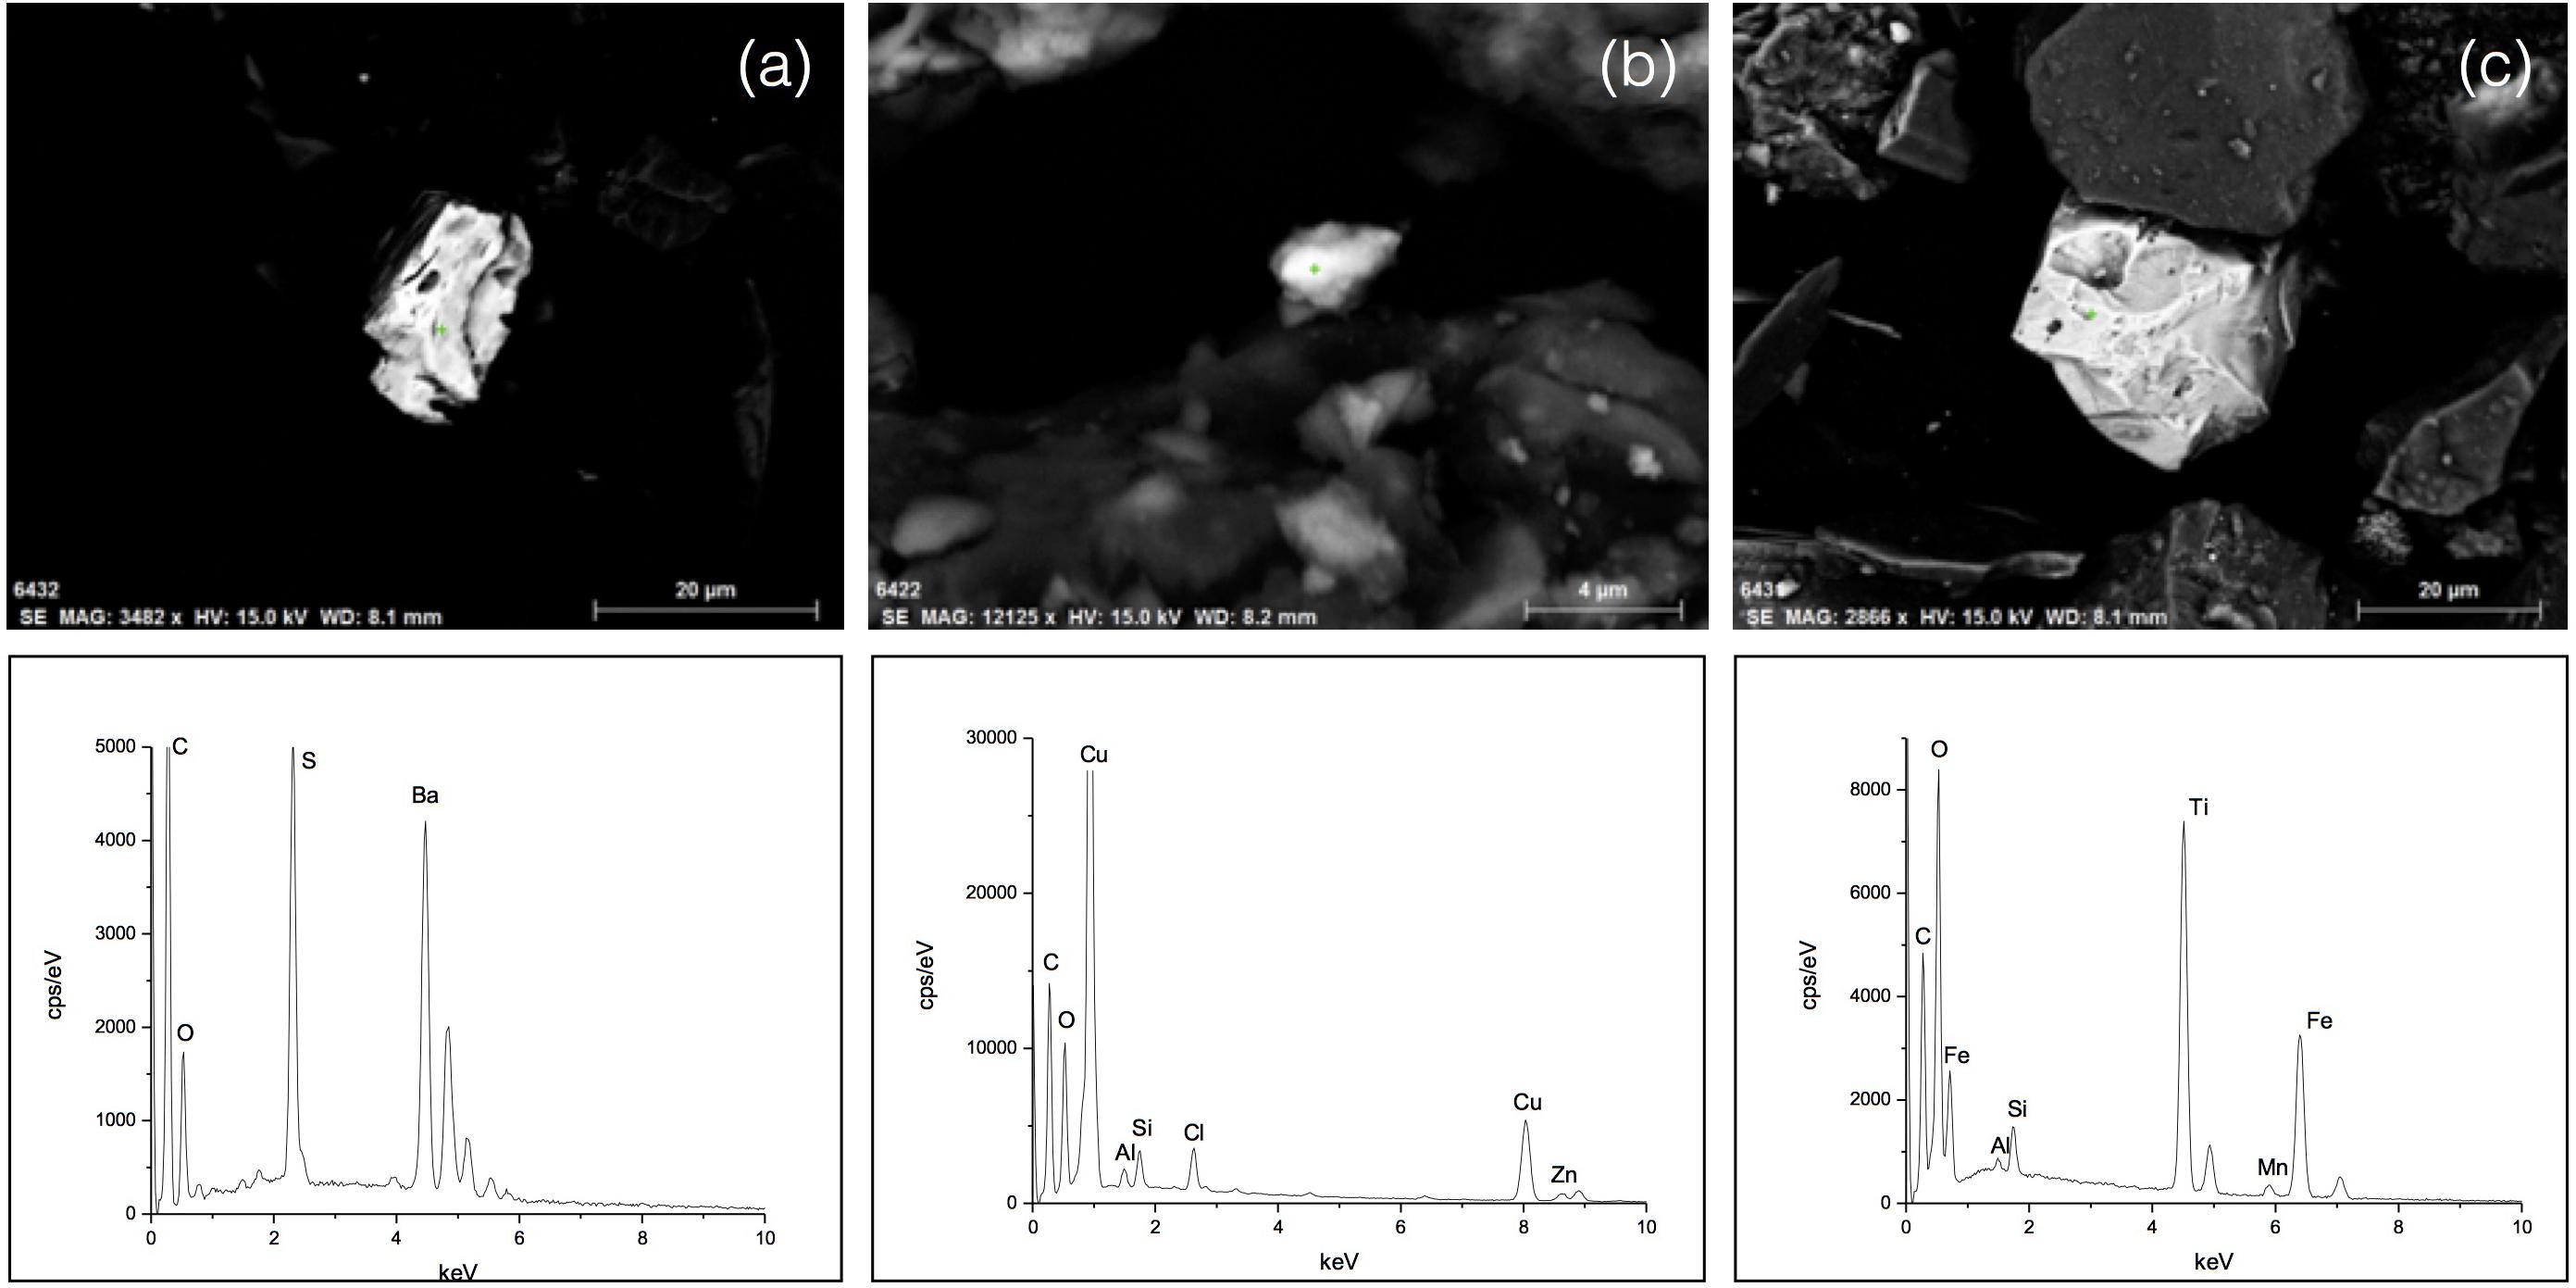
FIGURE 6. Scanning electron microscopy micrographs and EDS spectra of (a) baryte, (b) Cu-Zn ore, and (c) Fe-Ti oxide grains in NyA sediments. The green crosses mark the spot analysis.
The XRD patterns of the three Icelandic samples (hereafter ICE) show the presence of plagioclase, pyroxene and a small amount of magnetite spinel over a bell-shaped background due to the remarkable presence of an amorphous phase. The Rietveld refinements provided the following weight fractions of the amorphous phase: 81% (ICE1), 87% (ICE2), and 79% (ICE3). The plagioclase has a labradorite-andesine composition; the pyroxene is an augite whereas magnetite shows a variable composition within the magnetite-ülvospinel series (Figures 7a–d). Results of SEM-EDS investigations also revealed the presence of abundant Fe-Cr-Ni-bearing hyaloclastic fragments (Figures 7e,f). These results are comparable to the findings for Mælifellssandur discussed by Dagsson-Waldhauserova et al. (2014), but Baratoux et al. (2011) separated their Dyngjusandur samples into pyroxene, plagioclase, olivine, and volcanic glass as the significant four phases.
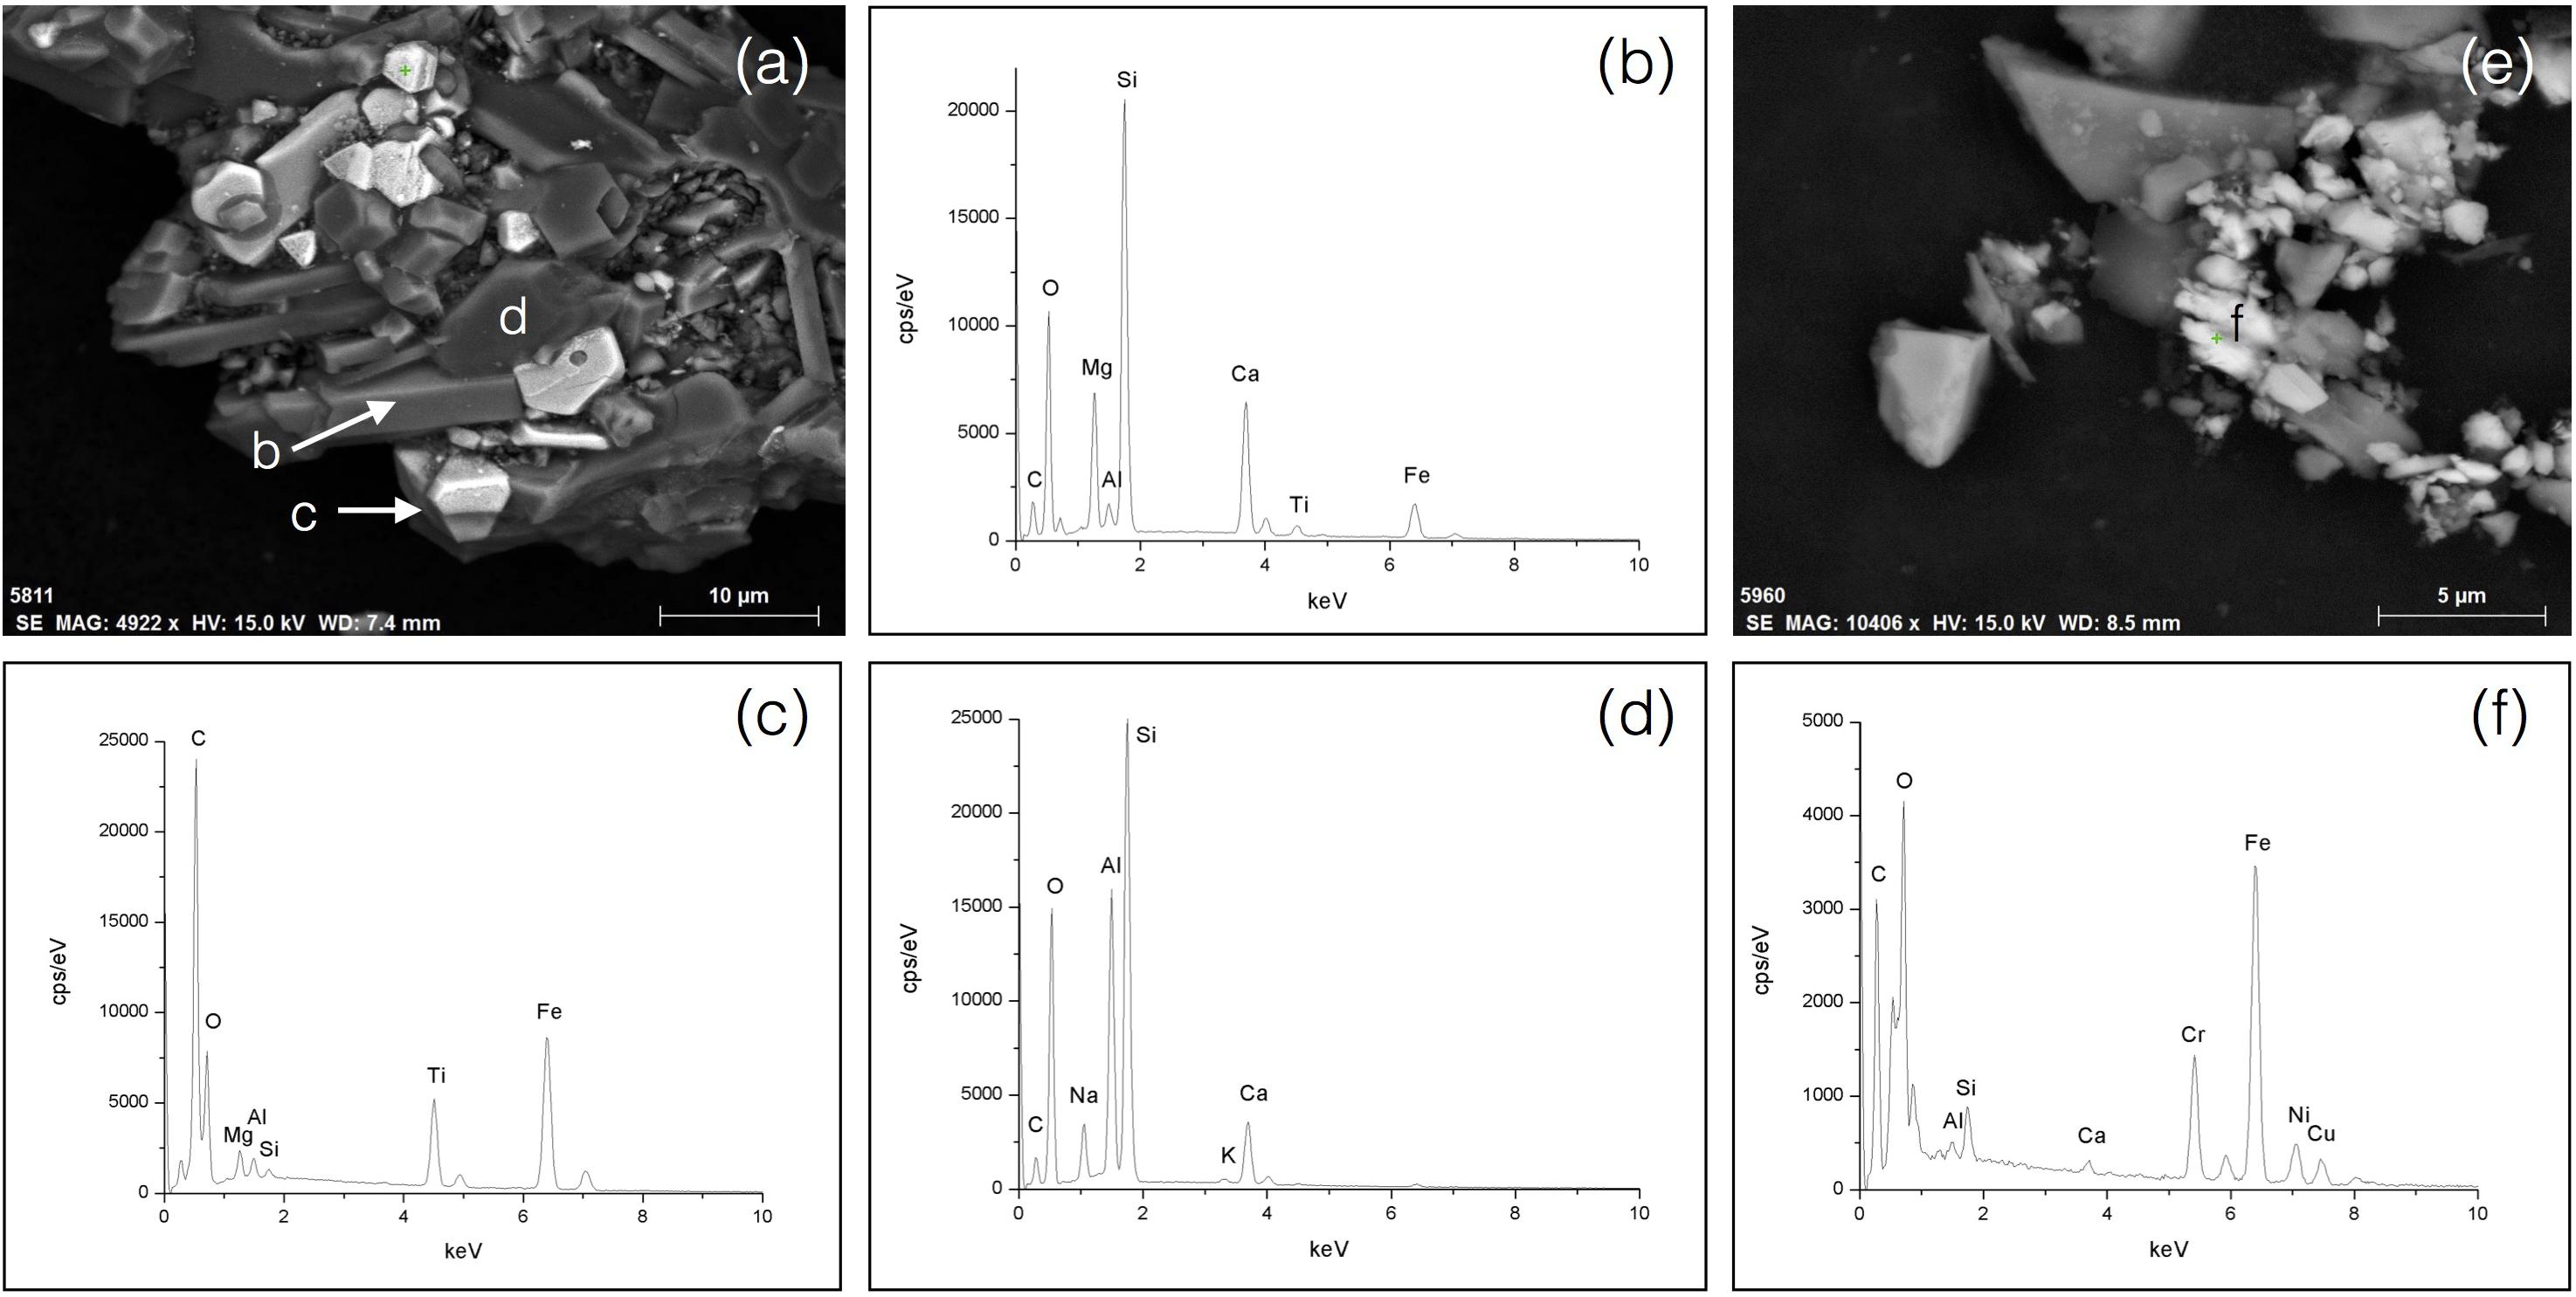
FIGURE 7. Scanning electron microscopy micrographs and EDS spectra of representative phases of ICE sediments: (a) rock fragment containing augite clinopyroxene (b), magnetite-ülvospinel (c) and andesine-labradorite plagioclase (d); (e,f) Fe-Cr-Ni-bearing hyaloclastic fragments. The green crosses mark the spot analysis.
Aerosol vs. Sediment Samples
The aerosol samples show a more varied and complex composition for the five main particle types, namely, silicates, metal oxides, carbonates, sulfates, and chlorides.
The silicates consist of quartz, feldspar, and sheet minerals. The sheet minerals show a range of composition from dioctahedral to trioctahedral micas and mica-like minerals (muscovite, mixed-layer illite-smectite, biotite, and chlorites; Figure 8). A large part of the sheet minerals in the aerosol samples of April 18 and 29 are dioctahedral while the sheet minerals of April 22 and 26 tend to the trioctahedral type. The composition of the sheet minerals is within the range of variation of the NyA samples.
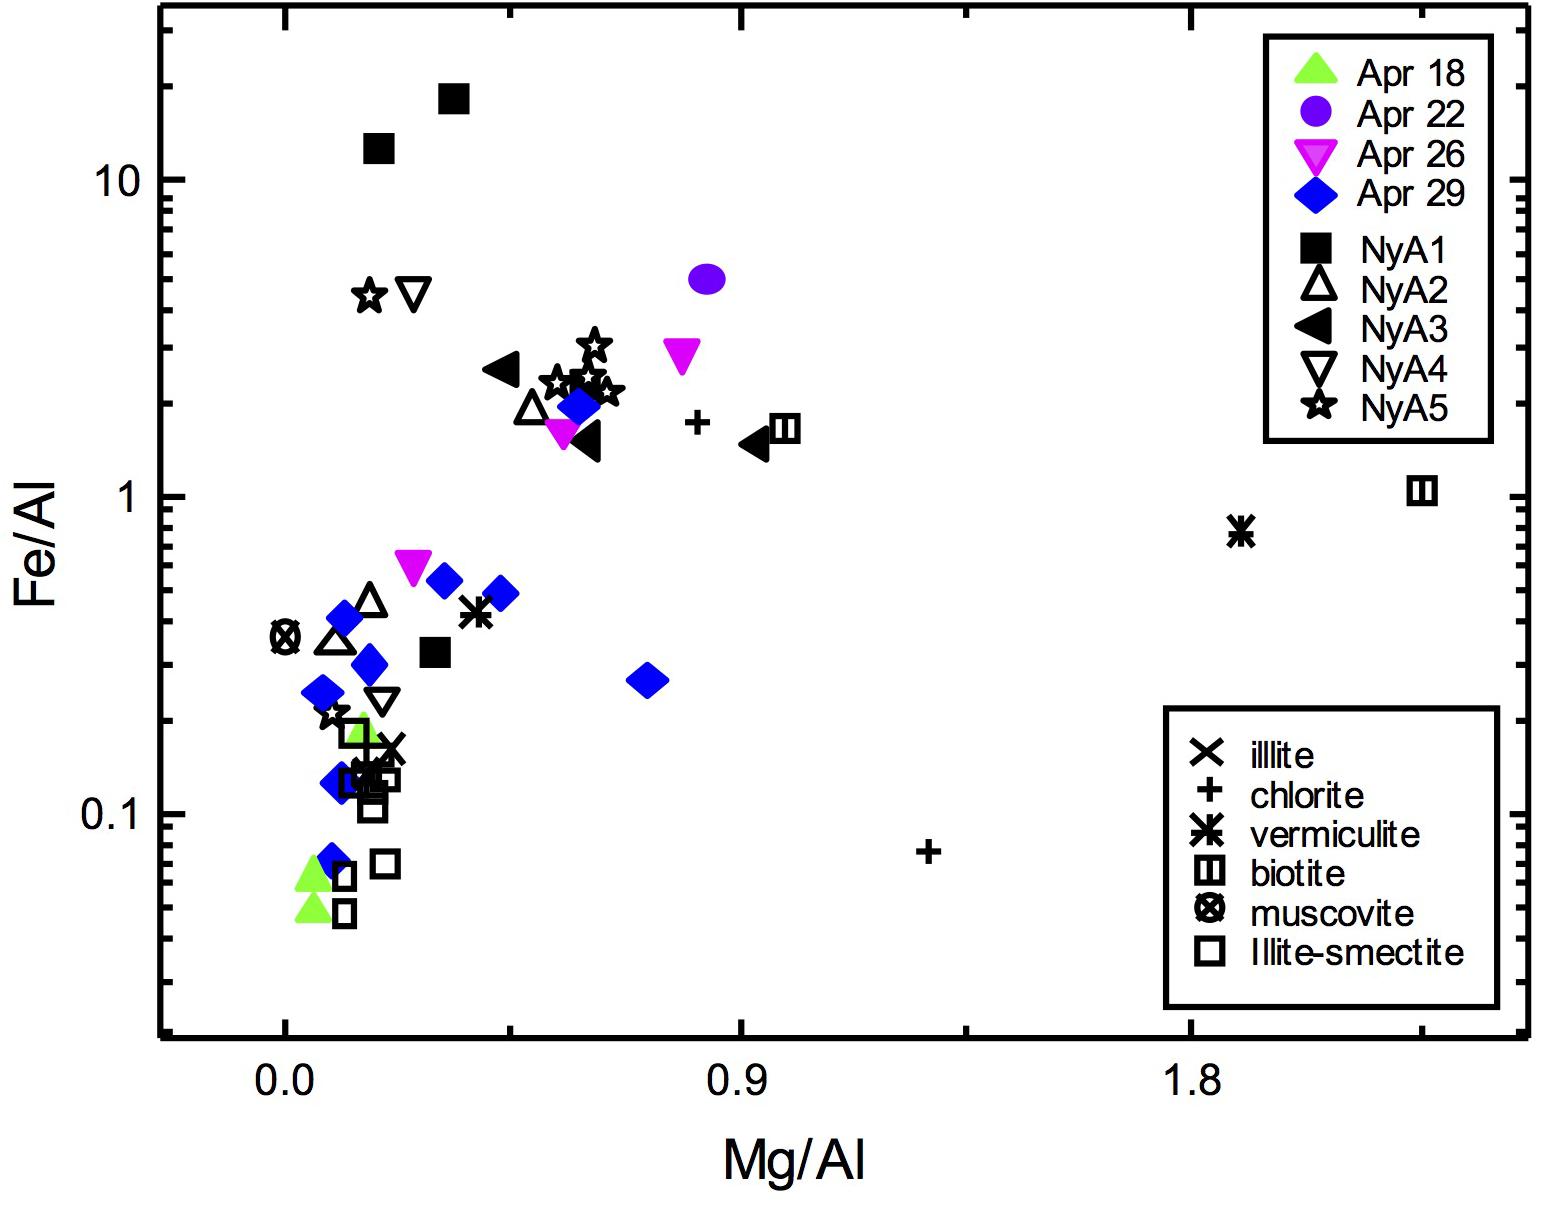
FIGURE 8. Chemical composition by SEM-EDS microanalysis of the sheet minerals in the aerosol samples compared to the composition of NyA sediments and reference minerals.
The metal oxide particles are mainly composed of Fe, Ti, Fe-Cr, Fe-Ti, and Fe-Cr-Ti along with oxygen. The Fe-Cr particles are typically smooth and angular in shape though variable in size and contain trace amounts of Si, Al, and Ca (Figures 9a,b, 10). They are very similar to the glass particles found in the volcanic sands from Iceland (Figures 7e,f). S and alkali elements (Na, Mg and K; Figures 9c,d) are frequently found in these particles, likely the result of internal mixing with sulfate nanoparticles. The Fe-Ti particles are micrometric to sub-micrometric particles frequently wrapped by internally mixed sulfates and chlorides (Figures 9e,f, 10). In the ternary diagram of Figure 11 the composition of the metal oxides fits the ranges for magnetite-ülvospinel (Fe2+Fe3+2O4-Fe2+2TiO4) and magnetite-chromite (Fe2+Fe3+2O4-Fe2+Cr2O4) spinels, or is compatible with ilmenite (FeTiO3) and rutile (TiO2). While the spinel facies is typical of the Icelandic sediments, ilmenite and rutile are found in the sediments from Ny-Ålesund. The Fe and the Fe-Cr-Ti particles are mostly submicron in size and show a wide range of variation in shape while the Ti particles are typically submicrometric and roundish in shape (Figure 10).
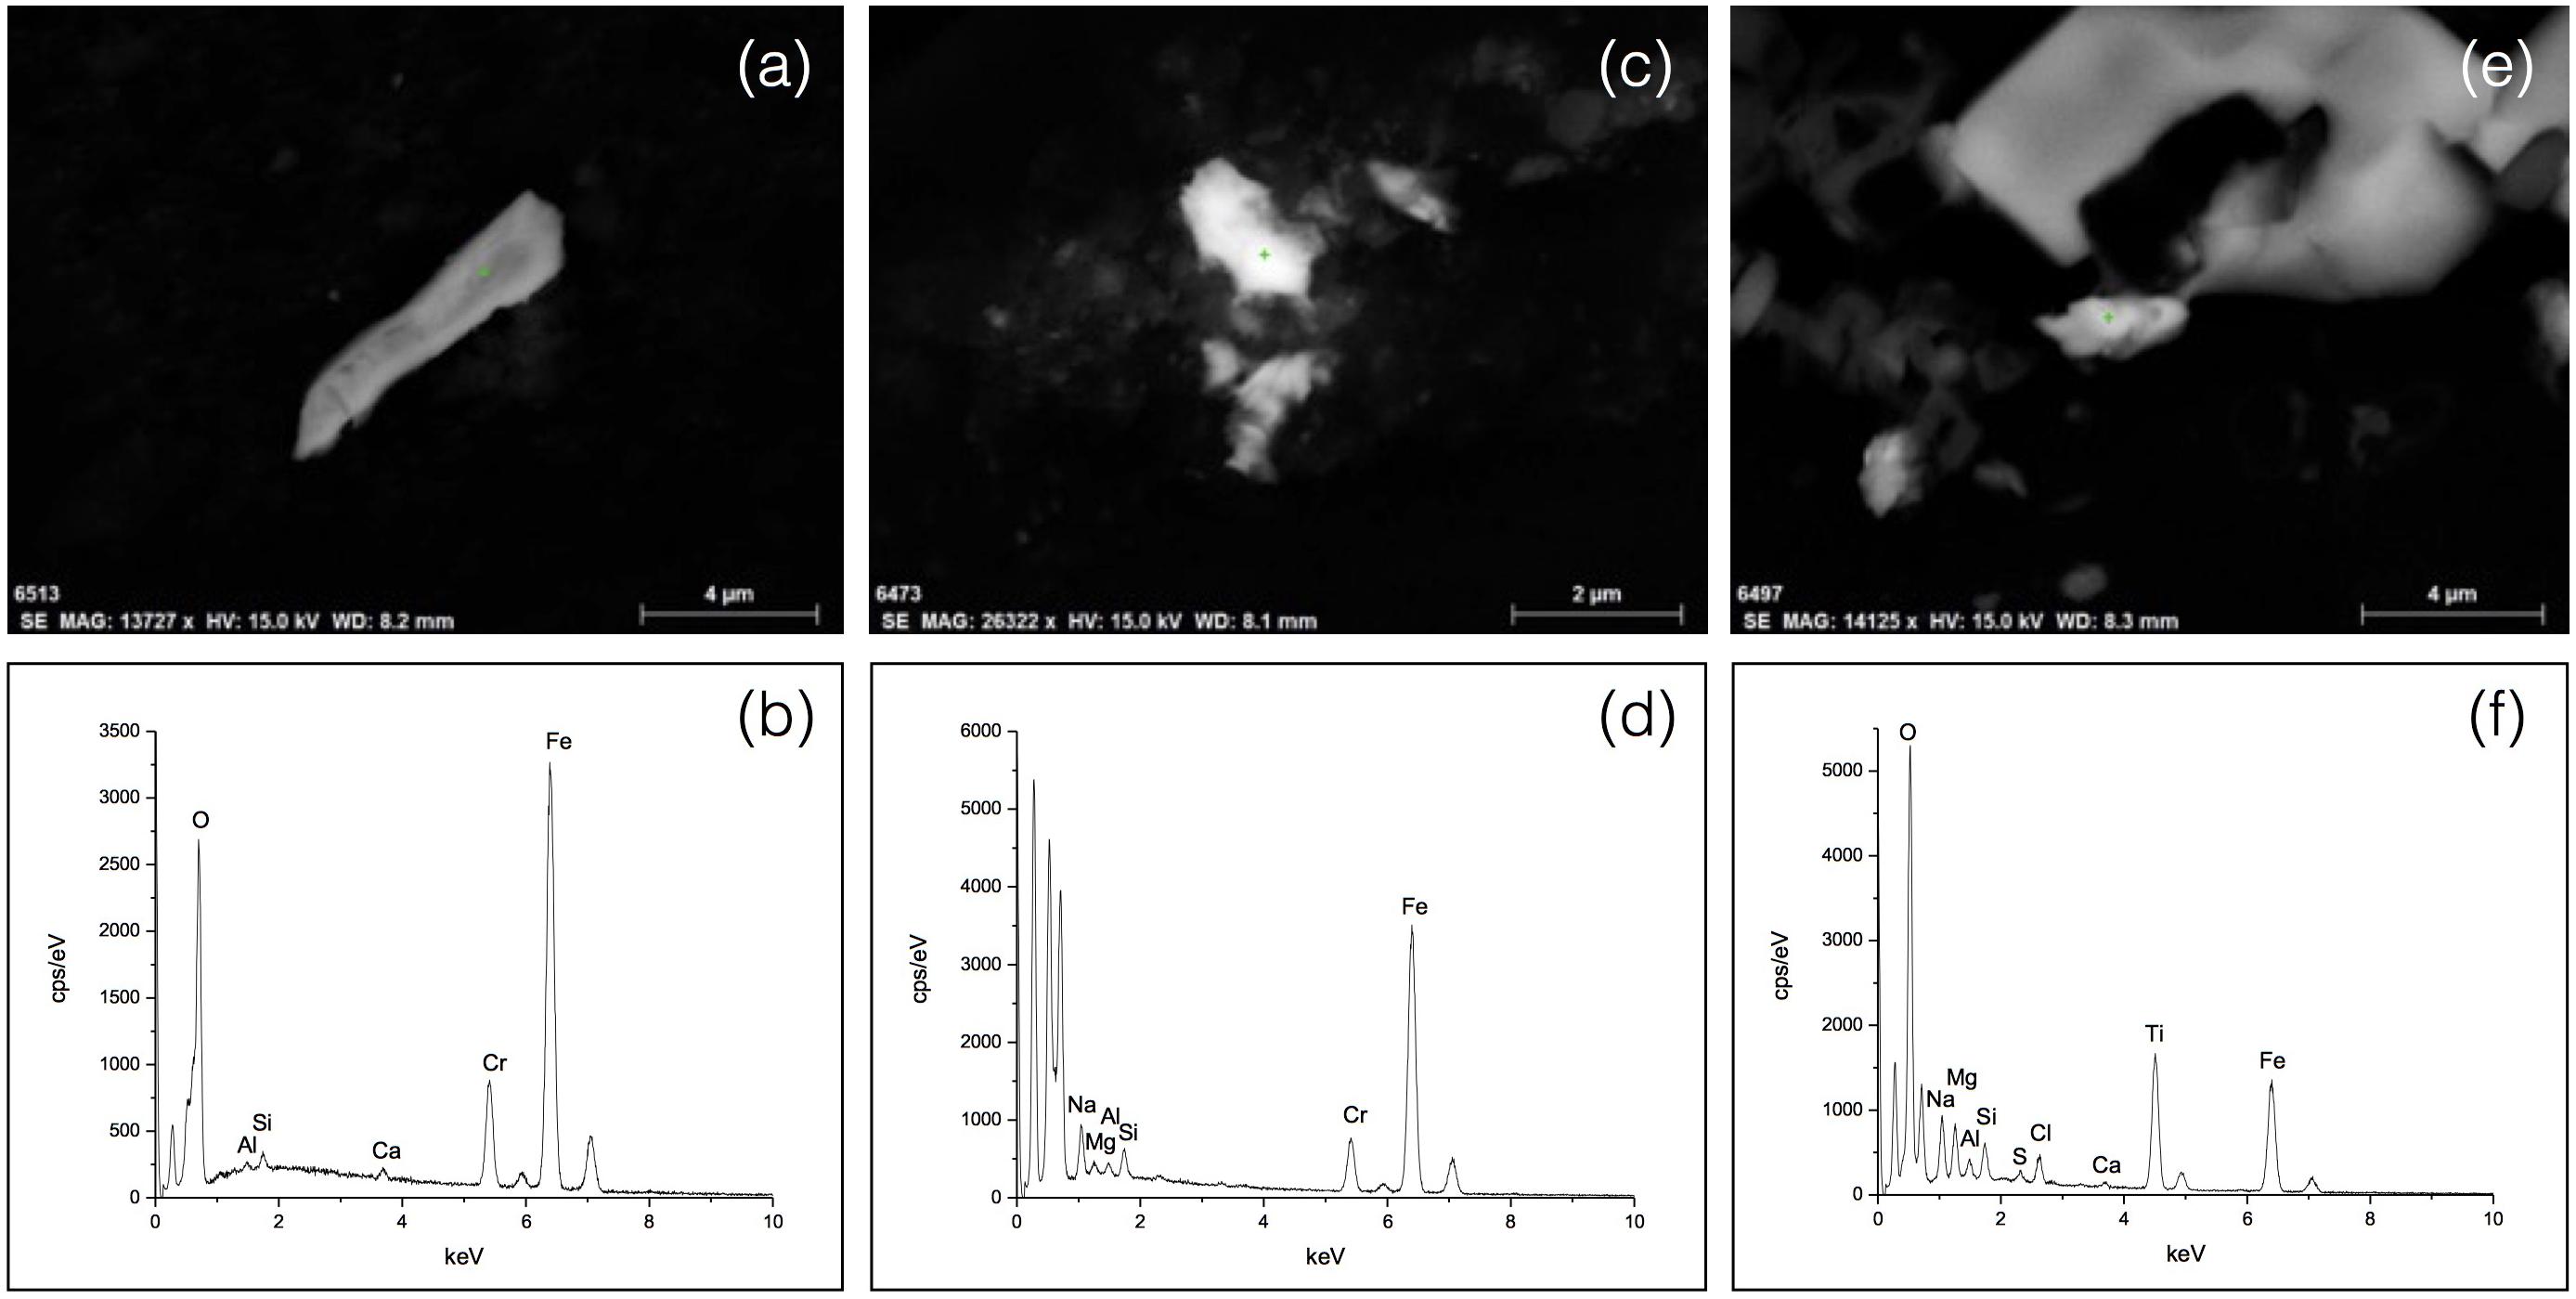
FIGURE 9. Scanning electron microscopy micrographs and EDS spectra of (a,b) a Fe-Cr bearing hyaloclastic fragment, (c,d) a Fe-Cr bearing fragment internally mixed with alkaline sulfate, and (e,f) aTi-Fe bearing metal oxide particle externally mixed with alkaline sulfate, sodium chloride and silicate minerals. The green crosses mark the spot analysis.
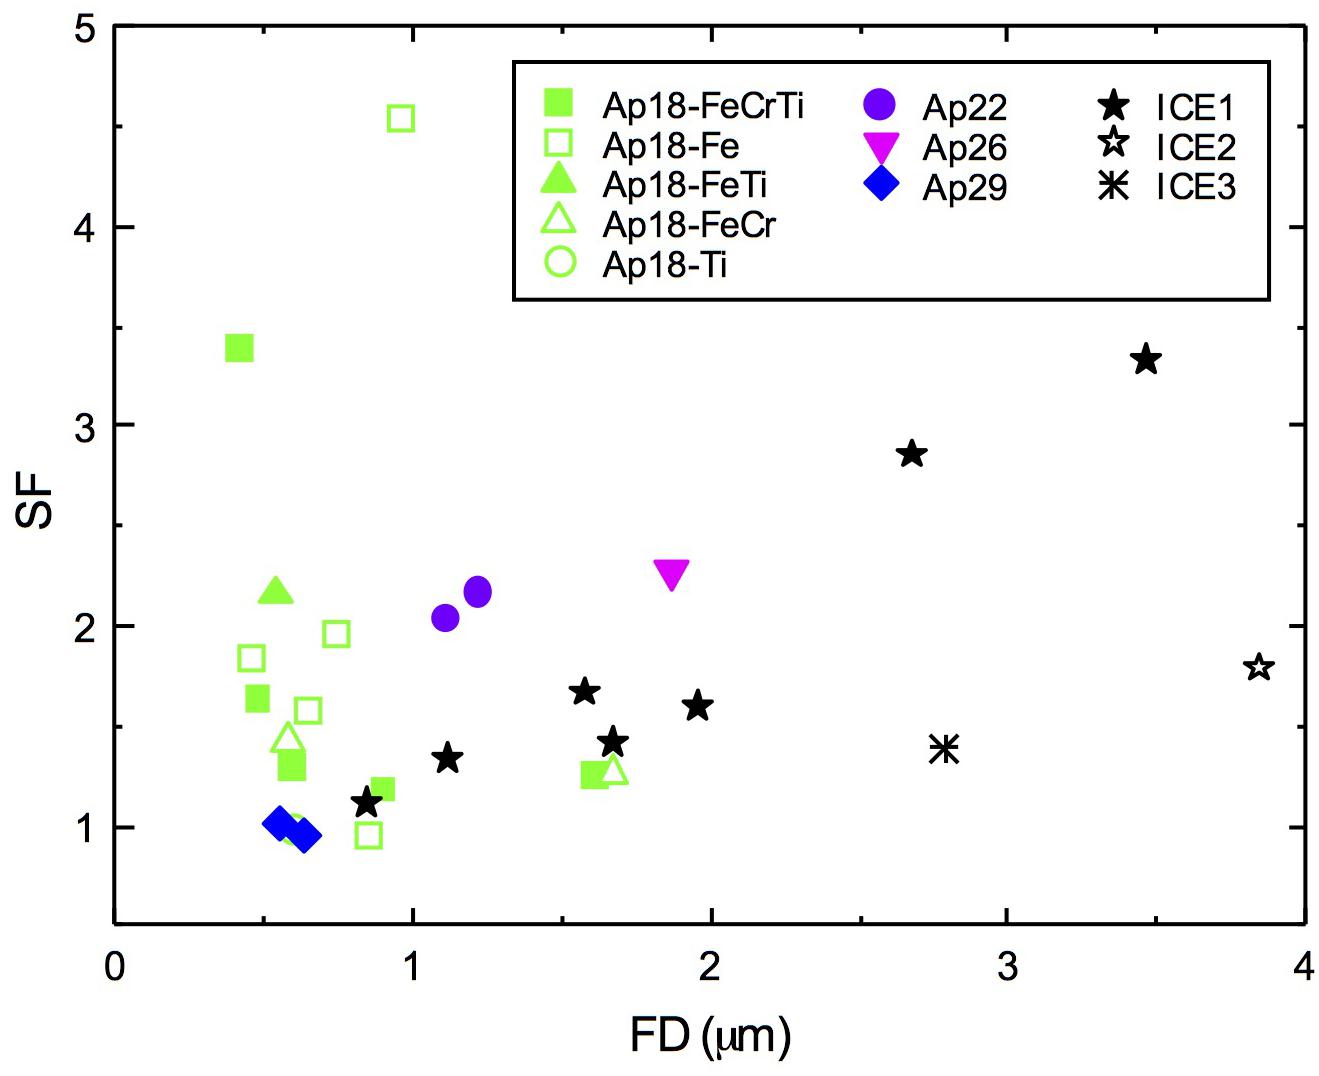
FIGURE 10. Plot of the Feret diameter (FD) vs. the shape factor (SF) of aerosol and sediment samples.
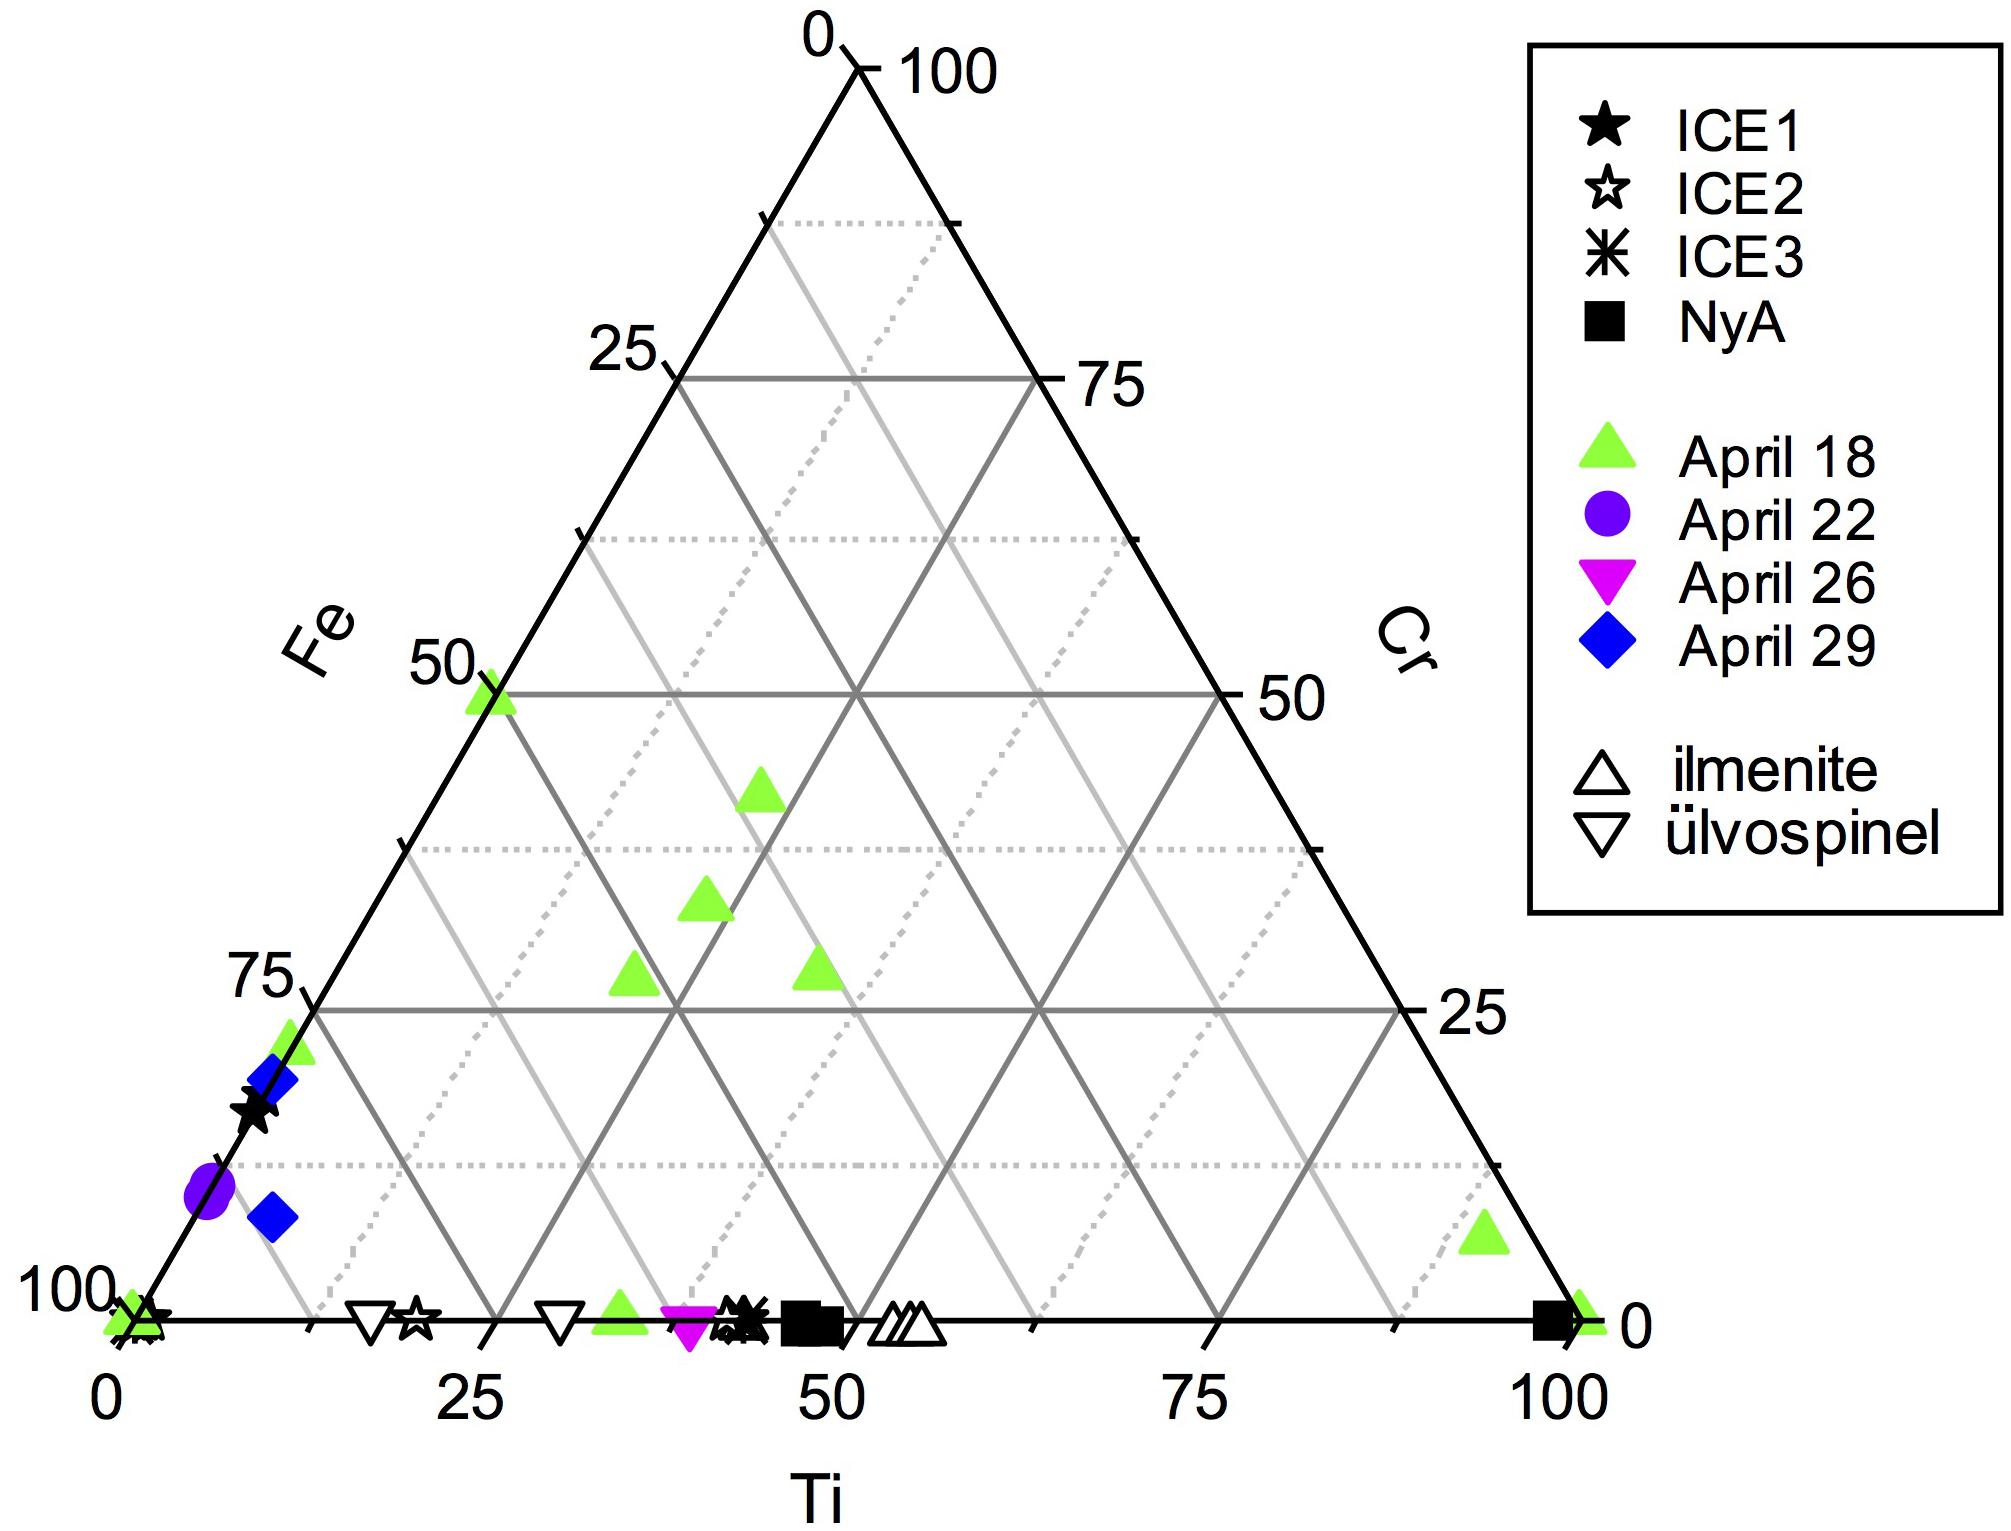
FIGURE 11. Ternary diagram Ti-Cr-Fe of the chemical composition of the metal oxide particles in the aerosol samples. Data from SEM-EDS microanalysis. The composition of NyA and ICE sediments and of reference mineral are also reported for comparison. The composition of rutile fits the right corner of the triangle.
Amongst the other particle types, the carbonates are represented by calcite and dolomite while the sulfates and chlorides consist of gypsum, alkali sulfate, and sodium chloride. These minerals are fine (mean diameter < 2.5 μm) to coarse grained (mean diameter > 2.5 μm), the carbonates do generally exhibit a rounded shape while the sulfates and chlorides are generally idiomorphic. The carbonates are very similar in size and shape to those found in the NyA sediments.
Dust Sources
The dust sources under consideration are, indeed, very different. Iceland is characterized by volcanic desert terrains dominated by aeolian processes while Svalbard islands host a core metamorphic basement and a sedimentary cover subjected to glacial and alluvial fan transport and deposition. The mineralogical association and particle size distribution of the sediments reflect such a different origin. In particular, augite clinopyroxene, plagioclase, magnetite, and volcanic glass fragments are distinguishing phases of the Icelandic sediments while the mineralogical associations quartz-muscovite-chlorite-albite and calcite-dolomite are characteristic features of the low-grade metamorphic complexes and the sedimentary terrains in Svalbard. The Icelandic materials are well sorted by the intense action of the wind; the poor sorting of the sediments from Ny-Ålesund reflects the influence of glacial to alluvial transport on the origin and evolution of the sediments. It is clear that the Icelandic facies is very typical as a member of the tholeiitic magmatic series whereas the mineralogical association found at Ny-Ålesund has not the same diagnostic value because the constituent minerals are all somewhat common in many geological contexts and, thus, they cannot be univocally associated with the local metamorphic origins. The nature of the sheet minerals cannot be employed, at least at this level, to make any distinction between the source regions for the lack of diagnostic/significant amounts of the sheet minerals in the Icelandic aeolian sediments and soils in general (Arnalds, 2015).
When considering the aerosols in respect to the loose sediment samples the metal oxide particles turn out to be a main marker of the Icelandic terrains. In particular, the presence of metal bearing glass particles points to a provenance from a volcanic instead of a plutonic tholeiitic complex (e.g., the Skaergaard ultramafic plutonic complex in Greenland; McBirney, 1996). This fact opens up the possibility to discriminate the contributions from Iceland and Greenland when both sites are potential source regions of dust. That is the case of the aerosol samples collected on April 22 and April 29 for which BT analysis revealed a possible contribution from both eastern Greenland and Iceland.
The glass phase and its relative abundance in the dust can indicate a provenance from different localities in Iceland. In particular, the glass enrichment in our samples suggests that the dust may have been raised in the air from formations of volcanic sands remarkably enriched in hyaloclastites such as the Dyngjusandur deposits in Northeast Central Iceland (Baratoux et al., 2011).
The chemical composition of the metal oxide particles is a further discriminative parameter of the provenance of dust. In fact, the metal oxide particles of April 22, 26 and, partly, of April 29 are very similar to the metal oxide ICE particles whereas the sample of April 18 has a more variable composition due to the presence of distinct Fe-Ti-Cr-bearing particles and aggregates. In this latter case, in particular, the lower Fe and higher Cr relative amounts along with the small size and higher grain boundary complexity in respect to the other particles suggest some influence of anthropogenic sources (e.g., Liu et al., 2018). Such a distinction can be ascribed to the variability of the source region of dust as is the case of the sample of April 18 for which the results of the BT analysis revealed a provenance from the Siberian coasts and only a minor contribution from Iceland. This further supports the reliability of the geochemical characterization of the metal oxide particles for the identification of the source regions of dust.
The glass particles are generally quite large, elongated and irregular shaped. The same results were found in samples from suspended Icelandic dust (Dagsson-Waldhauserova et al., 2014, 2015). This suggests a possible influence of the shape in favoring the uplift of the hyaloclastic volcanic sands due to local baric fields. Other phases in the loose Icelandic sediments, such as plagioclase and augite, show a similar shape. Thus, it is also important to consider the shape, specific weight and the size of the particle types. The specific weight, ρs, of the glass particles is extremely variable depending on porosity and weathering (Wolff-Boenisch et al., 2004; Franzson et al., 2010). The variable shape and density along with the much higher abundance of glass compared to the other phases in the Icelandic dust (Dagsson-Waldhauserova et al., 2014) can explain the presence and the abundance of the glass phase in the aerosol samples.
The size of the glass particles can be related to the dust plume formation and wind motion. According to Dagsson-Waldhauserova et al. (2014), dust plumes originating in Iceland show two maxima of the particle number concentration in the size range 0.3–0.337 μm and 1.5–5 μm in diameter during the dust peaks. The aerosol sample of April 26, which contains dust emitted during a storm in Iceland, reflects this condition with the relatively larger grain size of the particles (Figures 9e, 10) in respect to the other samples.
The small dust particles are easily transported by the air masses after uplifting from ground level and are prone to remain suspended due to their small size before deposition on the ground. This is the case of the aerosol sample of April 29 which contains a minimal number of metal oxide particles despite its likely derivation from a dust storm in Iceland. In a previous paper (Moroni et al., 2015) we have shown the remarkable presence on that day of metal oxide particles a few hundred meters from the ground giving rise to a layered aerosol structure due to local convective conditions. It is, thus, likely that the aerosol particles, once approaching the receptor, be entrapped in the lower troposphere and reach the ground at a variable rate depending on the local synopsis.
Dust Load Estimates
Having established the existence and the recognizability of the Icelandic dust contribution in the aerosol a further step can be to establish the extent of this contribution. Although the quantification of the Icelandic dust contribution is beyond the scope of this paper we have estimated the Icelandic dust load from the PM10 using the following approach.
For the days identified as belonging to Icelandic dust episodes, the daily net Icelandic dust load has been obtained by subtracting the background value to the PM10 value recorded on that day. To calculate the background concentration during the days affected by Icelandic contributions, two different statistical indicators have been used, i.e., the average value of a time series and the moving percentile 50. The average value has been calculated from the PM10 values registered 7 (and 15) days before and 7 (and 15) days after the intrusion (excluding dust days). The moving percentile 50 has been calculated for the PM10 concentrations registered during 15 days before and 15 days after the dust day (excluding dust days).
We have performed these calculations on the 2011 dust days for which the PM10 concentrations are available. The dust load values obtained (Table 5) are negative in all the samples except for those of April 22, 23, and 26. The dust load values of these samples obtained using different procedures of calculation are quite similar though very different from one sample to the other. Such a disparity confirms our previous observations on the different extent of the Icelandic contribution in different days.
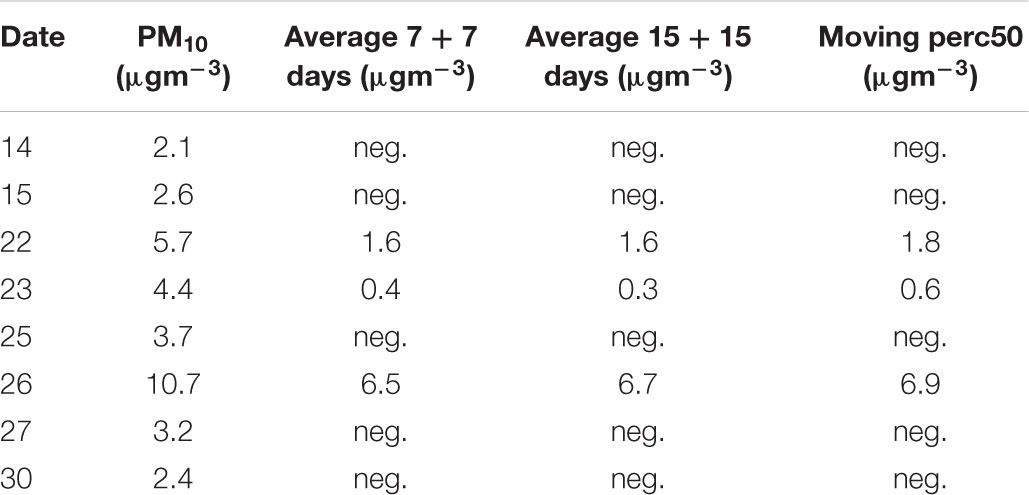
TABLE 5. Dust load estimates for April 2011.
Compared to the PM10 mass concentration registered from April to September 2011 the extent of the Icelandic mass contribution results about 2% of the total mass, and turns to about 7% in April. This means that the Icelandic contribution to the aerosol at Ny-Ålesund, though small to moderate in the long term, cannot be neglected especially during spring.
Conclusion
In this paper, we have evaluated the possibility of identifying the provenance of aerosols reaching the Arctic region at Ny-Ålesund based on the phase composition and the mineral chemistry of dust compared to reference sediment samples.
Comparison between local and Icelandic sediments reveals the metal oxide glass particles as the most representative and distinguishing mineralogical/phase markers for Iceland dust sources. In particular, we have considered the magnetite-chromite and the magnetite-ulvospinel associations as marker facies of the tholeiitic magmatic series and the presence of volcanic glass as a further indicator of provenance from Iceland rather than from tholeiitic plutonic districts such as Skaergaard, Greenland. However, the question remains about the actual origin of tholeiitic aerosols from Greenland both due to the lack of useful comparison samples and due to the lack of information on the presence of exposed soil/rock surfaces free from snow during spring (late April). The results of this preliminary study confirm that metal oxide particles are useful markers of sources and geographic provenance, provided that geochemical/morphochemical database of representative particle populations from different sources/source areas, both local/regional and long-range, is available.
This study provides an evidence that significant amounts of Icelandic dust can be transported long range to Svalbard showing the importance and the impact of High Latitude Dust sources.
Author Contributions
BM was responsible for NyA samples and data collection, granulometric analysis, SEM-EDS microanalysis, and general interpretation of the results; she conceived the paper and was the primary author of the manuscript. PD-W provided the ICE samples, PD-W and OA described the geological setting and geomorphology of Iceland and discussed the results in the light of previous experience on the ground. SC performed air mass back trajectory analysis and discussed the results with BM. RV provided XRD analyses and Rietveld refinement. DC gave a critical revision of the manuscript.
Funding
OA and PD-W was funded by the Icelandic Research Fund (Rannis) Grant No. 152248-051 and supported by Vinir Vatnajokuls. DC, BM, and SC was funded by the project SIDDARTA (CUP project id: I52F17001230001).
Conflict of Interest Statement
The authors declare that the research was conducted in the absence of any commercial or financial relationships that could be construed as a potential conflict of interest.
Footnotes
References
Arnalds, O. (2010). Dust sources and deposition of aeolian materials in Iceland. Icel. Agric. Sci. 23, 3–21.
Arnalds, O., Dagsson-Waldhauserova, P., and Olafsson, H. (2016). The Icelandic volcanic aeolian environment: processes and impacts—a review. Aeolian Res. 20, 176–195. doi: 10.1016/j.aeolia.2016.01.004
Arnalds, O., Olafsson, H., and Dagsson-Waldhauserova, P. (2014). Quantification of iron-rich volcanogenic dust emissions and deposition over ocean from Icelandic dust sources. Biogeoscience 11, 6623–6632. doi: 10.5194/bg-11-6623-2014
Arnalds, O., Thorarinsdottir, E. F., Thorsson, J., Dagsson-Waldhauserova, P., and Agustsdottir, A. M. (2013). An extreme wind erosion event of the fresh Eyjafjallajokull 2010 volcanic ash. Nat. Sci. Rep. 3:1257. doi: 10.1038/srep01257
Baddock, M. C., Mockford, T., Bullard, J. E., and Thorsteinsson, T. (2017). Pathways of high-latitude dust in the North Atlantic. Earth Planet. Sci. Lett. 459, 170–182. doi: 10.1016/j.epsl.2016.11.034
Baratoux, D., Mangold, N., Arnalds, O., Bardintzeff, J.-M., Platevoet, B., Grégorie, M., et al. (2011). volcanic sands of Iceland – diverse origins of aeolian sand deposits revealed at Dyngjusandur and Lambahraun. Earth Surf. Proc. Land. 36, 1789–1808. doi: 10.1002/esp.2201
Bullard, J. E., Baddock, M., Bradwell, T., Crusius, J., Darlington, E., Gaiero, D., et al. (2016). High-latitude dust in the earth system. Rev. Geophys. 54, 447–485. doi: 10.1002/2016RG000518
Cappelletti, D., Azzolini, R., Langone, L., Ventura, S., Viola, A., Aliani, S., et al. (2016). Environmental changes in the Arctic: an Italian perspective. Rend. Lincei. 27, 1–6. doi: 10.1007/s12210-016-0555-1
Cook, N., and Kiaerner, T. (2008). “Mineralogy and paragenesis of selected base metal deposits,” in Proceedings 33rd International Geological Congress (2008), Session AAA-11 Metallogeny of the Arctic Region, Oslo.
Dagsson-Waldhauserova, P., Arnalds, O., and Olafsson, H. (2013). Long-term frequency and characteristics of dust storm events in Northeast Iceland (1949-2011). Atmos. Environ. 77, 117–127. doi: 10.1016/j.atmosenv.2013.04.075
Dagsson-Waldhauserova, P., Arnalds, O., Olafsson, H., Hladil, J., Skala, R., Navratil, T., et al. (2015). Snow-dust storm a case study from Iceland, March 7th 2013. Aeolian Res. 16, 69–74. doi: 10.1016/j.aeolia.2014.11.001
Dagsson-Waldhauserova, P., Arnalds, O., Olafsson, H., Skrabalova, L., Sigurdardottir, G. M., and Branis, M., et al. (2014). Physical properties of suspended dust during moist and low wind conditions in Iceland. Icel. Agric. Sci. 27, 25–39.
Dagsson-Waldhauserova, P., Magnusdottir, A. Ö., Olafsson, H., and Arnalds, O. (2016). The spatial variation of dust particulate matter concentrations during two Icelandic dust storms in 2015. Atmosphere 7:77. doi: 10.3390/atmos7060077
Dallmann, W. K. (2015). Geoscience Atlas of Svalbard. Report Series No. 148. TromsØ: The Norsk Polarinstitutt.
Deer, W. A., Howie, R. A., and Zussman, J. (1992). An Introduction to the Rock-Forming Minerals. London: Longman Group UK.
Dörnbrack, A., Stachlewska, I. S., Ritter, C., and Neuber, R. (2010), Aerosol distribution around Svalbard during intense easterly winds. Atmos. Chem. Phys. 10, 1473–1490. doi: 10.5194/acpd-9-16441-12009
Eneroth, K., Kjellström, E., and Holmén, K. (2003). A trajectory climatology for Svalbard: investigating how atmospheric flow patterns influence observed tracer concentrations. Phys. Chem. Earth 28, 1191–1203. doi: 10.1016/j.pce.2003.08.051
Franzson, H., Gufinnsson, G. H., Helgadóttir, H. M., and Frolova, J. (2010). “Porosity, density and chemical composition relationships in altered Icelandic hyaloclastites”, in Water-Rock Interaction, eds P. Birkle and I. S. Torres-Alvarado (London: Taylor & Francis Group), 199–202.
Groot Zwaaftink, C. D., Arnalds, O., Dagsson-Waldhauserova, P., Eckhardt, S., Prospero, J. M., and Stohl, A. (2017). Temporal and spatial variability of Icelandic dust emission and atmospheric transport. Atmos. Chem. Phys. 17, 10865–10878. doi: 10.5194/acp-17-10865-2017
Groot Zwaaftink, C. D., Grythe, H., Skov, H., and Stohl, A. (2016). Substantial contribution of northern high-latitude sources to mineral dust in the Arctic. J. Geophys. Res. Atmos. 121, 13,678–13,697. doi: 10.1002/2016JD025482
Gualtieri, M. L., Prudenziati, M., and Gualtieri, A. F. (2006). Quantitative determination of the amorphous phase in plasma sprayed alumina coatings using the rietveld method. Surf. Coat. Technol. 201, 2984–2989. doi: 10.1016/j.surfcoat.2006.06.009
Hodson, A. J., and Ferguson, R. I. (1999). Fluvial suspended sediment transport from cold and warm-based glaciers in Svalbard. Earth Surf. Proc. Land. 24, 957–974. doi: 10.1002/(SICI)1096-9837(199910)24:11<957::AID-ESP19>3.0.CO;2-J
Jakobsson, S. P., and Gudmundsson, M. T. (2008). Subglacial and intraglacial volcanic formations in Iceland. Jökull 58, 179–196.
Jakobsson, S., Jónasson, K., and Sigursson, I. (2008). The three igneous rocks in Iceland: a review. Jökull 58, 117–138.
Kylling, A., Groot Zwaaftink, C. D., and Stohl, A. (2018). Mineral dust instantaneous radiative forcing in the Arctic. Geophys. Res. Lett. 45, 4290–4298. doi: 10.1029/2018GL077346
Lambert, F., Kug, J.-S., Park, R. J., Mahowald, N., Winckler, G., and Abe-Ouchi, A., et al. (2013). The role of mineral-dust aerosols in polar temperature amplification. Nat. Clim. Chang. 3, 487–491. doi: 10.1038/nclimate1785
Larson, C., and von Dreele, R. B. (2001). Generalized Crystal Structure Analysis System. Los Alamos, NM: Los Alamos National Laboratory.
Liu, H., Yan, Y., Chang, H., Chen, H., Liang, L., Liu, X., et al. (2018). Magnetic signatures of natural and anthropogenic sources of urban dust aerosol. Atmos. Chem. Phys. Discuss. doi: 10.5194/acp-2018-452
McBirney, A. R. (1996). “The skaergaard intrusion”, in Layered Intrusions, ed. R. G. Cawthorn (Amsterdam: Elsevier Science), 147–180. doi: 10.1016/S0167-2894(96)80007-8
Meinander, O., Dagsson-Waldhauserova, P., and Arnalds, O. (2016). Icelandic volcanic dust can have a significant influence on the cryosphere in Greenland and elsewhere. Polar Res. 35:31313. doi: 10.3402/polar.v35.31313
Michelsen, J. K., and Khorasani, G. K. (1991). A regional study of coals from Svalbard: organic facies, maturity and thermal history. B Soc. Géol. Fr. 162, 385–397.
Moroni, B., Becagli, S., Bolzacchini, E., Busetto, M., Cappelletti, D., Crocchianti, S., et al. (2015). Vertical profiles and chemical properties of aerosol particles upon Ny-Ålesund (Svalbard Islands). Adv. Meteorol. 2015:292081. doi: 10.1155/2015/292081
Mountney, N. P., and Russell, A. J. (2004). Sedimentology of cold climate Aeolian sand sheet deposits in the Askja region of northeast Iceland. Sediment. Geol. 166, 223–244. doi: 10.1016/j.sedgeo.2003.12.007
Óladóttir, B. A., Sigmarsson, O., Larsen, G., and Thordarson, T. (2008). Katla volcano, Iceland: magma composition, dynamics and eruption frequency as recorded by Holocene tephra layers. Bull. Volcanol. 70, 475–493. doi: 10.1007/s00445-007-0150-5
Ottesen, R. T., Bogen, J., Finne, T. E., Andersson, M., Dallmann, W. K., and Eggen, O. A., et al. (2010). Geochemical Atlas of Norway, Part 2: Geochemical Atlas of Spitsbergen. Chemical Composition of Overbank Sediments. Trondheim: Geological Survey of Norway.
Prospero, J. P., Bullard, J. E., and Hodgkins, R. (2012). High latitude dust over the North Atlantic: inputs from Icelandic proglacial dust storms. Science 335, 1078–1082. doi: 10.1126/science.1217447
Screen, J. A., and Simmonds, I. (2010). The central role of diminishing sea ice in recent Arctic temperature amplification. Nature 464, 1334–1337. doi: 10.1038/nature09051
Serreze, M. C., and Barry, R. G. (2011). Processes and impacts of Arctic amplification: a research synthesis. Glob. Planet. Chang. 77, 85–96. doi: 10.1016/j.gloplacha.2011.03.004
Serreze, M. C., and Francis, J. A. (2006). The arctic amplification debate. Clim. Chang. 76, 241–264. doi: 10.1007/s10584-005-9017-y
Sigmarsson, O., and Steinthórsson, S. (2007). Origin of Icelandic basalts: a review of their petrology and geochemistry. J. Geodyn. 43, 87–100. doi: 10.1016/j.jog.2006.09.016
Srodon, J., Morgan, D. J., Eslinger, E. V., Eberl, D. D., and Karlinger, M. R. (1986). Chemistry of illite/smectite and end-member illite. Clays Clay Miner. 34, 368–378. doi: 10.1346/CCMN.1986.0340403
Keywords: atmospheric aerosol, Arctic region, loose sediment vs. aerosol samples, X-ray diffraction, scanning electron microscopy, mineral chemistry, metal oxide particles
Citation: Moroni B, Arnalds O, Dagsson-Waldhauserová P, Crocchianti S, Vivani R and Cappelletti D (2018) Mineralogical and Chemical Records of Icelandic Dust Sources Upon Ny-Ålesund (Svalbard Islands). Front. Earth Sci. 6:187. doi: 10.3389/feart.2018.00187
Received: 23 August 2018; Accepted: 12 October 2018;
Published: 05 November 2018.
Edited by:
Paolo Censi, Università degli Studi di Palermo, ItalyReviewed by:
Pierpaolo Zuddas, Sorbonne Universités, FranceYigal - Erel, Hebrew University of Jerusalem, Israel
Copyright © 2018 Moroni, Arnalds, Dagsson-Waldhauserová, Crocchianti, Vivani and Cappelletti. This is an open-access article distributed under the terms of the Creative Commons Attribution License (CC BY). The use, distribution or reproduction in other forums is permitted, provided the original author(s) and the copyright owner(s) are credited and that the original publication in this journal is cited, in accordance with accepted academic practice. No use, distribution or reproduction is permitted which does not comply with these terms.
*Correspondence: Beatrice Moroni, Yi5tb3JvbmlAdGlzY2FsaS5pdA==