 David Boutelier*
 David Beckett
- School of Environmental and Life sciences, University of Newcastle, Newcastle, NSW, Australia
Three-dimensional analog experiments are employed to explore how self-sustaining subduction may initiate along an oceanic transform fault. The models include a realistic spatial distribution of plate thickness, strength, and buoyancy of the lithosphere near an oceanic transform fault characteristic of the spreading rate. Convergence is imposed across the transform fault and strain in the model lithosphere is quantified using a surface Particle Imaging Velocimetry system. A force sensor is employed to defined when a self-sustaining subduction regime is generated. Cylindrical experiments reveal that subduction polarity is controlled by the buoyancy gradient and the strengths of the plates. With no inclined weak zones, imposed orthogonal compression results in the nucleation of a new fault in the weakest plate leading to the young and positively buoyant plate subducting. However, with an inclined weak zone, the buoyancy contrast controls subduction polarity with the most negatively buoyant plate subducting and a self-sustaining subduction regime obtained after ~300 km of imposed shortening. This situation is obtained when including an inverted triangular weak zone on top of the transform fault associated with the serpentinization of the crust and mantle. In non-cylindrical experiments, taking into account the change along strike of plate strength and buoyancy, the capacity of the transform fault to generate a self-sustaining subduction regime is greatly reduced. Subduction initiates simultaneously with opposite polarity at the two extremities of the transform segment and, at depth, a lithospheric tear is produced that separates the two subducting slabs. In the center of the transform fault, the lack of buoyancy or strength contrast between the two plates leads to multiple thrusts with variable polarities, overlapping each other, and each accommodating too little shortening to become the new plate boundary. This indicates that additional mechanical work is required in the center of the transform fault which prevents the establishment of a self-sustaining subduction regime.
1. Introduction
Subduction initiation is a fundamental component of the plate tectonic theory, yet how subduction starts remains controversial (e.g., Stern, 2002, 2004; Gerya, 2011a,b, and references therein).
The gravitational instability of the oceanic lithosphere is generally thought to be the main driving force of subduction (e.g., Vlaar and Wortel, 1976). Due to surface cooling, the oceanic lithosphere becomes denser than the underlying asthenospheric mantle some 10–50 Ma after its formation at a mid-ocean ridge (Oxburgh and Parmentier, 1977; Cloos, 1993; Afonso et al., 2007). Because continental passive margins contain the oldest and thus presumably the most gravitationally unstable seafloor, they were first proposed as preferred sites of spontaneous subduction initiation (Dewey, 1969; Karig, 1982). However, despite the abundance of active and passive margins, no conclusive evidence for a transition from passive to active have been identified. This lack of evidence for initiation of subduction at a passive margin is explained by the fact that the bending and shear strength of the lithosphere, particularly where it is old and thick, is generally thought to be too high to permit spontaneous subduction initiation (Mueller and Phillips, 1991; Regenauer-Lieb et al., 2001; Mart et al., 2005; Nikolaeva et al., 2010).
Oceanic transform faults and fracture zones have then been proposed as alternative sites for spontaneous subduction nucleation because they are thought to be mechanically much weaker than passive margins and the large buoyancy gradient across these faults because of the difference in the age of the lithosphere, was thought to facilitate foundering (e.g., Stern, 2002, 2004). However, even across weak oceanic transform faults, the strength of the lithosphere has been shown to be still too large to permit spontaneous collapse (Mueller and Phillips, 1991; Toth and Gurnis, 1998). Self-sustaining subduction, defined as subduction driven by the negative buoyancy of the sinking lithosphere, may however be achieved if at least ~100 to 150 km of convergence can be imposed on an oceanic fracture zone with sufficient buoyancy gradient across the fault (Hall et al., 2003; Gurnis et al., 2004). This is because a minimum length of negatively buoyant lithosphere must be subducted in order to generate sufficient downward slab pull force to overcome the shear strength of the fault zone and the bending resistance of the lithosphere. These interesting results however did not take into account the fact that the age of the lithosphere and therefore its strength and buoyancy not only varies across the oceanic fault zone, but also along the strike of the fault since many oceanic transform fault link segments of spreading ridges.
Here we investigate using three-dimensional analog models how the spatial distribution of strength and buoyancy along and across an oceanic transform fault zone affects the polarity of subduction and whether self-sustaining subduction can be obtained. We designed three-dimensional analog experiments in which two oceanic lithospheric plates are separated by a weak transform fault and convergence is imposed in the horizontal direction perpendicular to the strike of the fault. The spatial distribution of plate thickness and buoyancy are varied along and across the strike of the transform fault, and whether self-sustaining subduction is obtained is assessed using a force sensor.
2. Buoyancy Distribution
The lithospheric plate thickness can be estimated from the age of seafloor (Müller et al., 1997, 2008) using the half-space cooling equation (Turcotte and Schubert, 1982):
where T is the temperature at depth z and time t, T0 is the surface temperature, Tm is the temperature of the mantle, and κ is the thermal diffusivity.
Using the temperature at the base of the lithosphere, this equation yields the thickness of the plate where zl is the depth of the base of the lithosphere (m). With κ = 1 × 10⁻⁶ m2 s−1, a simple relationship between plate thickness H (km) and age A (Ma) can be obtained:
Assuming an oceanic crust with thickness Hc = 7 km and density ρc = 2, 800 kg m−3, a mantle lithosphere of variable thickness with density ρl = 3, 330 kg m−3, a sub-lithospheric mantle with density ρl = 3, 250 kg m−3, the average density () and dimensionless relative buoyancy (b) of the lithospheric plate can then be calculated:
and
with ρa the density of the underlying mantle (asthenosphere). Since we are interested in the spatial distribution of thickness and buoyancy along and across oceanic transform faults for the purpose of informing the design of three-dimensional analog models, we calculated average density and buoyancy profiles along and across transform fault zones linking fast or slow spreading ridges (Figure 1).
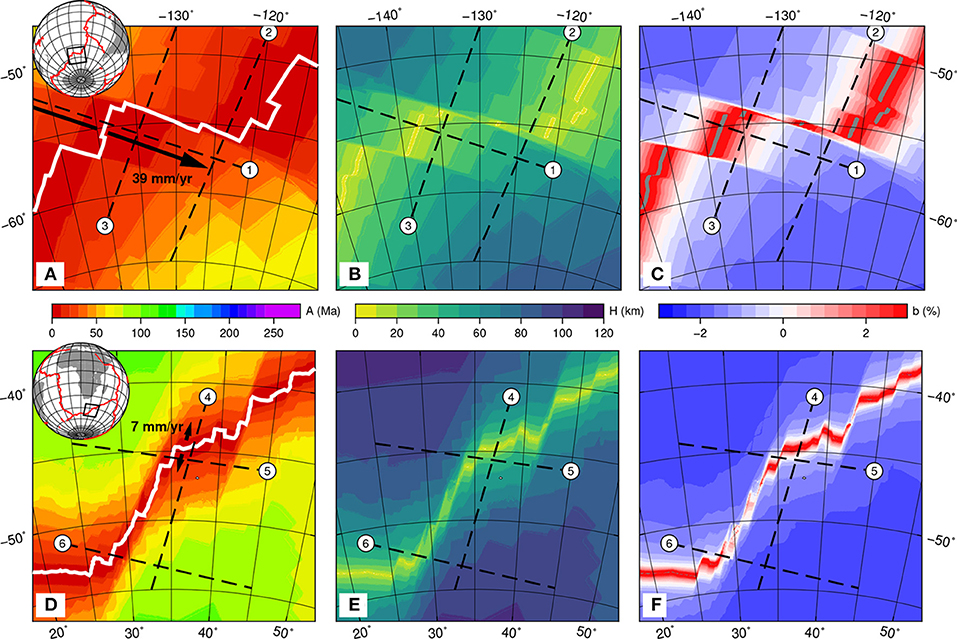
Figure 1. Maps of seafloor age (Müller et al., 1997, 2008), plate thickness and buoyancy relative to underlying mantle for fast spreading ridge separating the Pacific and Antarctic plates (A–C), or slow spreading ridge separating the Africa and Antarctic plates (C,E,F). Half spreading rates from GSRM (Kreemer et al., 2003, 2014). Points labeled 1–6 refer to profiles in Figure 2. Plate thickness and relative buoyancy are calculated using the half-space cooling model and the simple plate structure discussed in the text.
The maps demonstrate that, regardless of the spreading rate, a buoyancy gradient do exist across the oceanic transform fault when considering plate segments in the vicinity of the boundary (< 100 km). The profiles (Figure 2) reveal that on one side of the transform fault the buoyancy is positive, indicating that the plate is more buoyant than the underlying mantle, while on the other side of the transform fault the buoyancy of the lithosphere is negative, the plate is less buoyant than the underlaying mantle. The maps (Figure 1) and profiles (Figure 2) also demonstrate that the sign of the gradient, indicating on which side the negatively buoyant and positively buoyant plates are, changes along the strike of the transform. For example along the transform segment of the plate boundary separating the Africa and Antarctica plates, the most negatively buoyant lithosphere is on the Africa side of the transform near the northern end of the transform segment. However the most negatively buoyant plate is on the Antarctica side near the southern end the same transform segment. A similar reversal of the sign of the buoyancy gradient is observed for the transform segment linking the fast spreading ridges separating the Pacific and Antarctica plates.
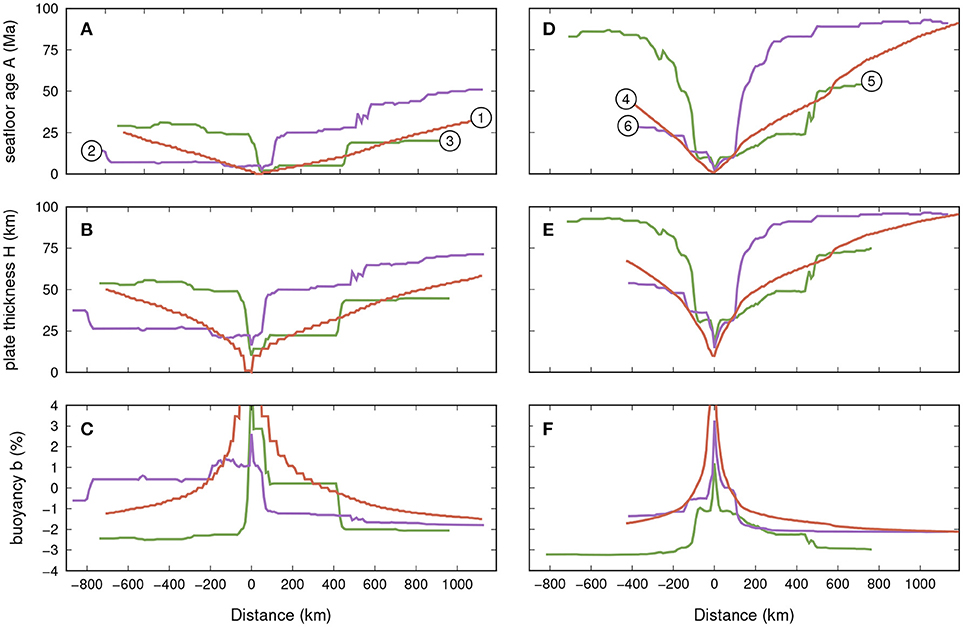
Figure 2. Profiles of seafloor age, plate thickness, and plate buoyancy relative to the underlying mantle for the examples of the fast spreading ridge (A–C) and slow spreading ridge (D–F). The numbers in white circles are the points plotted in Figure 1 to locate the end of the profile.
Furthermore, with faster spreading the plates are significantly younger on both side of the transform fault. Because the rate of plate cooling and thickening reduces with the plate age, the thickness, and buoyancy differences associated with small age differences across the fast transform are amplified. The difference in buoyancy across the fault is more important for a fast spreading (~2% for the fast segment vs. ~0.5−1.0% for the slow segment).
If one assumes that the polarity of a subduction zone initiated along a transform fault is a function of the buoyancy gradient, one should expect that subduction initiates with opposite polarity at the two extremities of each transform segment. How would these hypothetical subduction zones connect and how this affects the establishment of a self-sustaining subduction remain open questions.
3. Model Set-Up
3.1. General Modeling Scheme
We employ a simplified kinematic framework whereby the effect of the shear traction caused by the drag of the asthenosphere on the lithosphere (Funiciello et al., 2003a,b; Royden and Husson, 2006) is replaced by a piston that imposes a constant-rate convergence (Boutelier and Oncken, 2011).
An important characteristic of the large strain deformation of the lithosphere is its ability to produce and maintain lithospheric-scale shear zone. In the brittle layers of the lithosphere strain localization is well described by a Mohr-Coulomb rheology. However, strain localization also occurs in the ductile regime, and may be promoted by strain softening mechanisms such as dynamic recrystallization and development of crystallographic preferred orientations (e.g., Hansen et al., 2012a,b; Montési, 2013), and/or shear heating (e.g., Poirier, 1980; Montési, 2002; Regenauer-Lieb et al., 2008). However, the softening functions associated with these mechanisms are still debated (Rutter, 1999; De Bresser et al., 2001; Montési and Hirth, 2003; Oncken et al., 2012). In our model lithosphere, an equivalent strain localization process is employed using specially designed ductile strain-softening elasto-plastic materials (Boutelier and Oncken, 2011). The materials are composed of various quantities of paraffin wax, vaseline, and paraffin oil held together with a highly branched alpha-olefin polymer. The density is adjusted with the addition of a clay powder, which binds with the oil-based matrix via a water-in-oil surfactant (phosphatidylcholine). The compositions of the materials employed in this study are provided in Table 1.
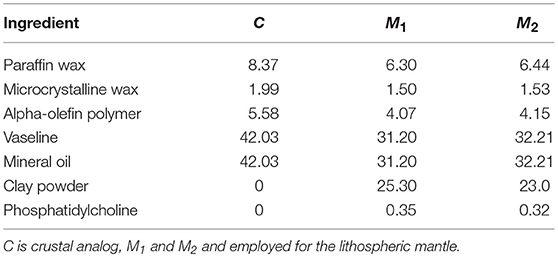
Table 1. Compositions of the employed analog materials (weight %).
3.2. Scaling
We adopt a length scaling factor L* = Lm/Ln = 2.86 ×10⁻⁷ (subscript m and n refer to model and nature respectively) that means that 1 cm in the model represents 35 km in nature. The scaling factor for densities is ρ* = 3.08 × 10⁻¹ and 1,000 kg m−3 represents 3,250 kg m−3. Hydrostatic pressure, ρgz, where depth z scales with length, sets the scaling factor for stress σ* (Buckingham, 1914). Since the experiments are carried out under normal gravitational acceleration (i.e., g* = 1 and gm = gn = 9.81 m.s−2), σ* = ρ*×L* = 8.79 × 10⁻⁸. Consequently, a flow stress of 10 MPa at the bottom of the lithosphere is 0.879 Pa in the model, while a flow stress of 500 MPa in the stronger parts of the lithosphere corresponds to 43.95 Pa in the model. Since strength decreases with depth within each layer because of the imposed temperature gradient, we use the strength averaged over the layer thickness for scaling of stress (see Table 2).
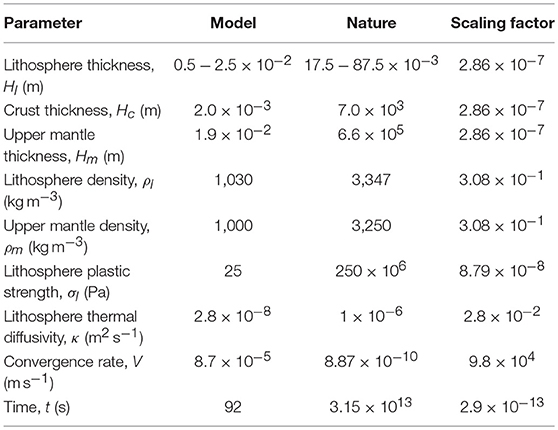
Table 2. Parameter values employed in the models, corresponding values in Nature, and scaling factors.
The time scale factor is chosen in order to scale the relative temperature variations associated with deformation (Chemenda et al., 2000; Boutelier et al., 2002). The imposed velocity controls the advection of heat in the model. In order to maintain the balance between advection and diffusion of heat, the dimensionless ratio VL/κ (i.e., Peclet number) must be the same in the model and nature, where V is the convergence velocity and κ is the thermal diffusivity. Time is then simply defined in a kinematic sense using the dimensionless ratio Vt/L. Our hydrocarbon compounds have a thermal diffusivity of 2.8 × 10⁻⁸ m2 s−1 (Boutelier and Oncken, 2011). Assuming that rocks have a thermal diffusivity of 1 × 10⁻⁶ m2 s−1 (Turcotte and Schubert, 1982), κ* = 2.8 × 10⁻² and V* = κ*/L* = 9.8 × 10⁴. This scaling factor means that a natural subduction velocity of 2.8 cm yr−1 (i.e., 8.87 × 10⁻¹⁰ m s−1) is 8.7 × 10⁻⁵ m s−1 in the model. The scaling factor for time is t* = L*/V* = 2.92 × 10⁻¹², which means that 1 Ma in nature (i.e., 3.15 × 10¹³ s) is 92 s in the model. The parameter values adopted for the experiments, scaled to nature and the scaling factors are listed in Table 2.
3.3. Model Setup
The model includes two lithospheric plates resting on a low-viscosity asthenosphere (Figure 3). Both plates are made of temperature-sensitive elasto-plastic materials with strain softening described above and are subjected to a constant vertical thermal gradient resulting in a reduction of strength with depth (Boutelier and Oncken, 2011).
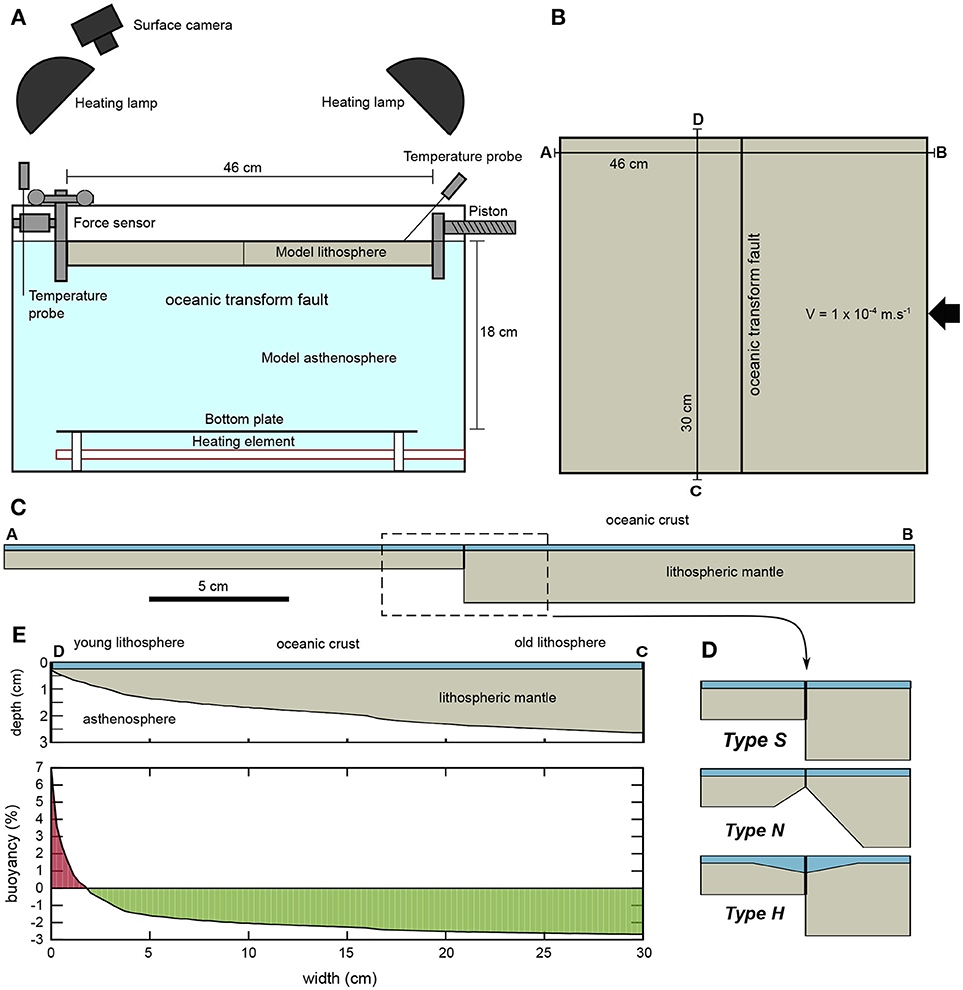
Figure 3. Sketches of the model setup. (A) vertical cross-section of the experimental apparatus. (B) map view of the model. The two plates are separated by a vertical cut representing the oceanic transform fault. (C) vertical cross-section of the model lithosphere perpendicular to the transform fault near the edges of the model. One plate is young and thin whereas the other is old and thick. (E) vertical cross-section parallel to the transform fault. The age of the plate and its thickness vary along strike. The thickness of the oceanic crust remains constant, it is the lithospheric mantle thickness which changes, leading to the appropriate spatial distribution of buoyancy. (D) the transform fault may be or three different types. Type-S: the transform is a straight vertical cut. Type-N: the transform has a notch, the lithospheric thickness is locally reduced under the fault. Type-H: the crust is hydrothermally altered around the fault zone leading to a triangular zone of weak, low-density serpentinite.
Four infrared emitters equipped with large diffusers are placed above the four corners of the experimental tank and are oriented toward the center of the model surface. The duration of the heat pulses generated by the infrared emitters is calculated by a thermo-regulator that receives a reading of the surface temperature Ts from a thermal probe (Figure 3A). Thermal imaging has demonstrated that this configuration provides a surface temperature field that is relatively constant (±0.1°C) in time and homogeneous (±0.2°C) in space (Boutelier and Oncken, 2011). Furthermore the infrared emitters do not produce any visible light and the cameras monitoring the model deformation do not detect the emitted infrared waves. The light required to obtain sufficiently contrasted images of the model surface for Particle Imaging Velocimetry processing (Adam et al., 2005; Boutelier, 2016) is produced by 5 W LEDs, which do not contribute to the surface heating. The temperature of the sub-lithospheric mantle (Ta) is maintained and controlled using an electrical heating element at the bottom of the experimental tank, a thermal probe and a second thermo-regulator.
The model includes two plates separated by a transform fault zone, which at it simplest is a vertical cut (Figures 3B–D). The spatial distribution of buoyancy is modeled using two layers for the oceanic lithosphere (Figure 3E). The oceanic crust is 2 mm (equivalent to 7 km in nature) and 870 kg m−3, while the lithospheric mantle underneath is of variable thickness and has density of either 1,030 or 1,040 kg m−3. The mature oceanic lithosphere is 2 to 3 cm-thick (70–100 km) and its average density is thus 1,019–1,029 kg m−3. Its buoyancy relative to the underlaying mantle is thus −1.9 to −2.9% (Cloos, 1993). However, a young oceanic lithosphere with a thickness of only 1 cm (35 km) has an average density of 998 to 1,006 kg m−3 and the buoyancy relative to the underlaying mantle is +0.2 to −0.6%. Younger lithosphere, closer to the spreading ridge is even thinner and more positively buoyant (Figure 3E). This setup thus allows varying simulatenously the bending strength and negative buoyancy of the plate as a function of its thickness which in nature is a function of the age (Figure 3E). In addition the use of two lithospheric mantle materials with nearly identical composition (see Table 1) allows us to vary independently the plate strength, buoyancy, and thickness, although in nature both plate strength and buoyancy are linked to plate thickness and age. Rheological tests indicate that the two mantle materials have statistically indistinguishable plastic strengths, but a significant density difference of 10 kg m−3. This is because only the amount of clay powder was varied between the lithospheric mantle analog materials and the change was small (only 2%). This change has a significant impact on the density because density is mostly controlled by the relative amount of clay with respect to all other ingredients combined, while the strength is more impacted by the relative amounts of the waxes, oil, and polymers.
Two series of experiments are presented. In the first series, the models are cylindrical. A thickness and buoyancy gradient is implemented across the transform fault zone, but it does not vary along the strike of the fault. This series was design to test the validity of the assumption that subduction polarity can be estimated from the sign of the buoyancy gradient. In the second series, the buoyancy gradient changes along and across the transform fault.
3.4. Particle Imaging Velocimetry
Precise spatio-temporal strain monitoring is obtained using the Particle Imaging Velocimetry (PIV) technique, a non-intrusive method for accurate measurement of instantaneous velocity fields using digital image correlation (Adam et al., 2005; Boutelier, 2016). We employ a PIV system equipped with a 36-megapixel DSLR camera enabling spatial resolution of the displacement of < 0.1 mm with a temporal resolution of 10 s. The surface views of the model are precisely corrected and calibrated using a checkerboard pattern on a calibration board with 900 control points distributed across the image space. The corrected views are further enhanced before correlation. The background value is removed using a gaussian filter and the intensities of the particles placed at the surface of the model are normalized. The FFT (Fast Fourier Transform) algorithm is used to transform the sub-areas of two successive images into the frequency domain (Smith, 1999). Multiplying the real and imaginary parts of the first image with the real and imaginary parts of the second image generates the real and imaginary parts of the correlation map in the frequency domain. The Inverse FFT completes the operation and yields the correlation map in the spatial domain, where the value of each pixel is the measure of how well the two images match when shifted by the coordinates of the point. The sub-pixel position of the correlation peak is measured by fitting a gaussian curve (Nobach and Honkanen, 2005). A multipass approach with progressively decreasing interrogation window size, and window deformation is employed to yield dense vector fields together with sub-pixel precision on displacement vectors (Adam et al., 2005; Boutelier, 2016). The produced vector field are filtered out using minimum and maximum values of the velocity components, maximum standard deviation for each velocity component as well as a universal outlier (Westerweel and Scarano, 2005). Discarded vectors are interpolated using a diffusion/Laplacian model solved using a finite difference scheme with boundary values (Boutelier, 2016).
The velocity field obtained from PIV makes the computation of horizontal strain-rate components (Exx/Δt, Eyy/Δt, Exy/Δt) straightforward. Eij is the incremental strain component (with i, j being x or y coordinate vectors), defined as the gradient of the i component of the vector displacement D in the direction j (i.e., Eij = ΔDi/Δj). Δt is the time increment between correlated images. The topography generated in the models is generally below 2 mm while the top camera is placed 100 cm above the model surface, therefore topography does not interfere significantly with the calculation of horizontal strain using a simple 2D PIV technique (Adam et al., 2005; Boutelier, 2016).
4. Results
23 experiments have been performed varying multiple parameters (Table 3). Here we detail 4 representative experiments and summarize the insights from the other experiments. Table 4 provides a quantification of the force evolution in each experiment. The parameters employed for this quantification are illustrated in Figure 4, and scaled-up values are provided in Table 4 for comparison with previous work.
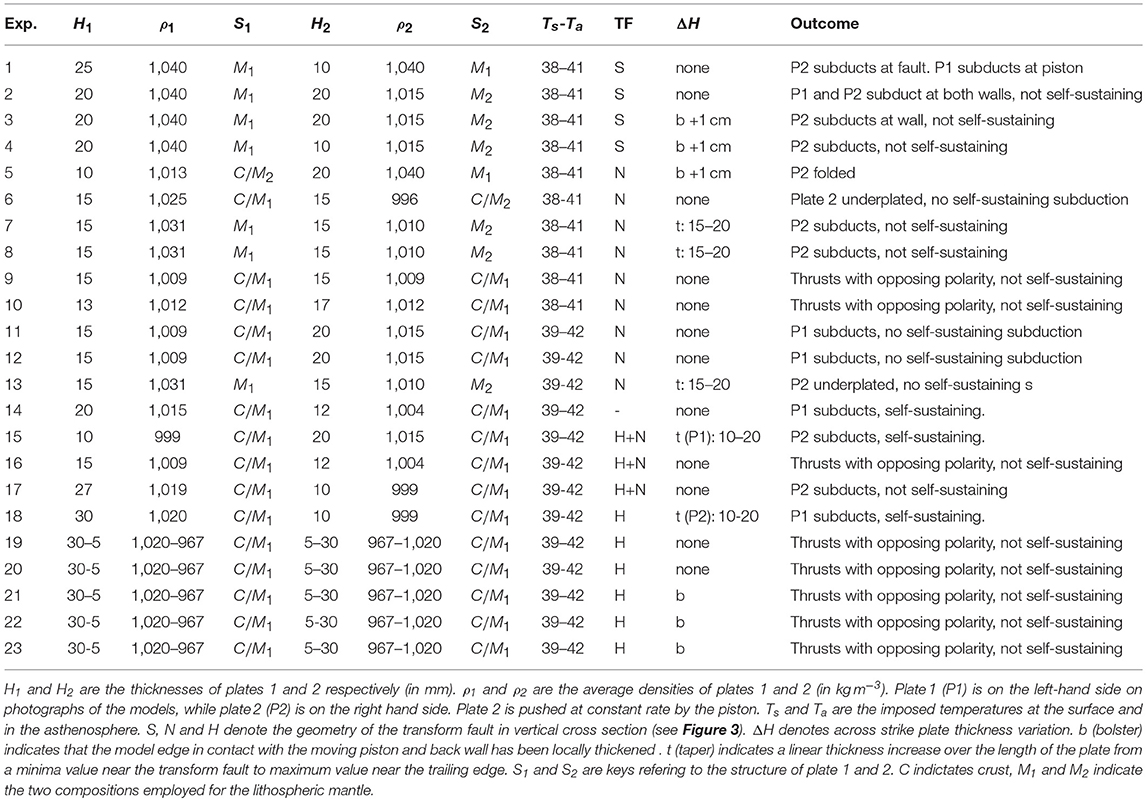
Table 3. List of experiments.
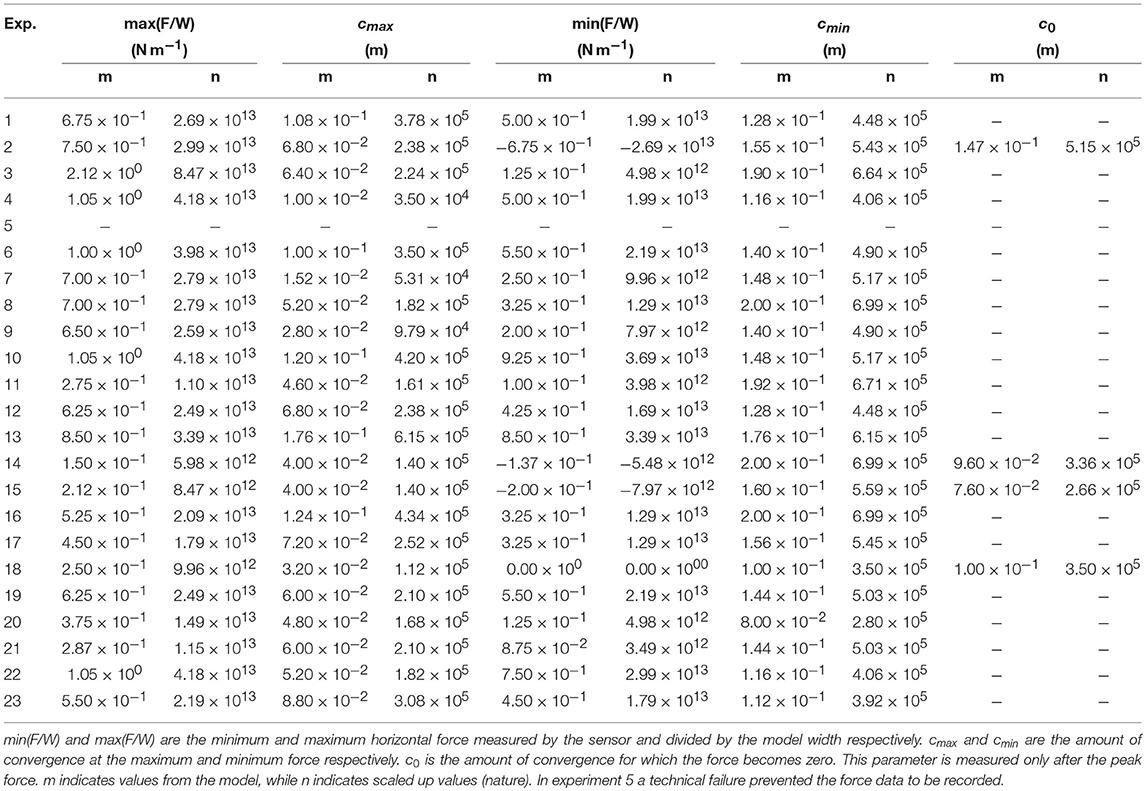
Table 4. Force measured in experiments.
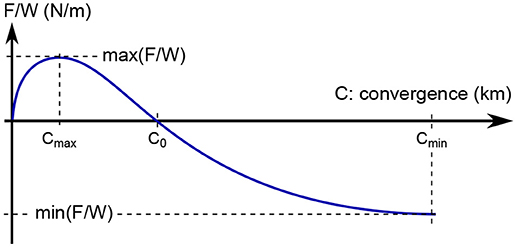
Figure 4. Sketch of the parameters characterizing the force evolution in the experiments, reported in Table 4.
4.1. Cylindrical Models
In the first series of experiments, the buoyancy of the plates varies across the transform fault but not along its strike. This series investigate how the difference in thickness and buoyancy across the fault determines the polarity of the subduction when convergence is imposed perpendicular to the fault.
4.1.1. Experiment 11
On the right hand side of the transform fault, the lithospheric plate is 20 mm thick and the average density is 1,015 kg m−3. The relative buoyancy to the underlaying mantle is therefore −1.5%. On the other side of the transform fault, the lithospheric plate is 15 mm and the average density is 1,009 kg m−3. The relative buoyancy to the underlaying mantle is therefore −0.9%. Shortening is accommodated by two oppositely dipping fault zones nucleating from the base of the pre-existing vertical cut representing the transform fault (Figure 5A). Shortening was also accommodated in a third fault zone near the trailing edge of the thin plate (Figures 5B,C). From the begining of the experiment, the fault dipping toward the thick plate accomodated more shortening than its conjugate. At about 400 s most of the imposed shortening is accomodated in a single thrust resulting in the subduction of the thin, less negatively buoyant plate under the thick, more negatively buoyant plate (Figures 5D,E). The record of the horizontal force shows a positive (compressional) and increasing value until about 600 s. The force value remained at the peak (11 × 10−2 N) until ~1,000 s then steadily decreased until the end of the experiment but remained positive (Figure 5F).
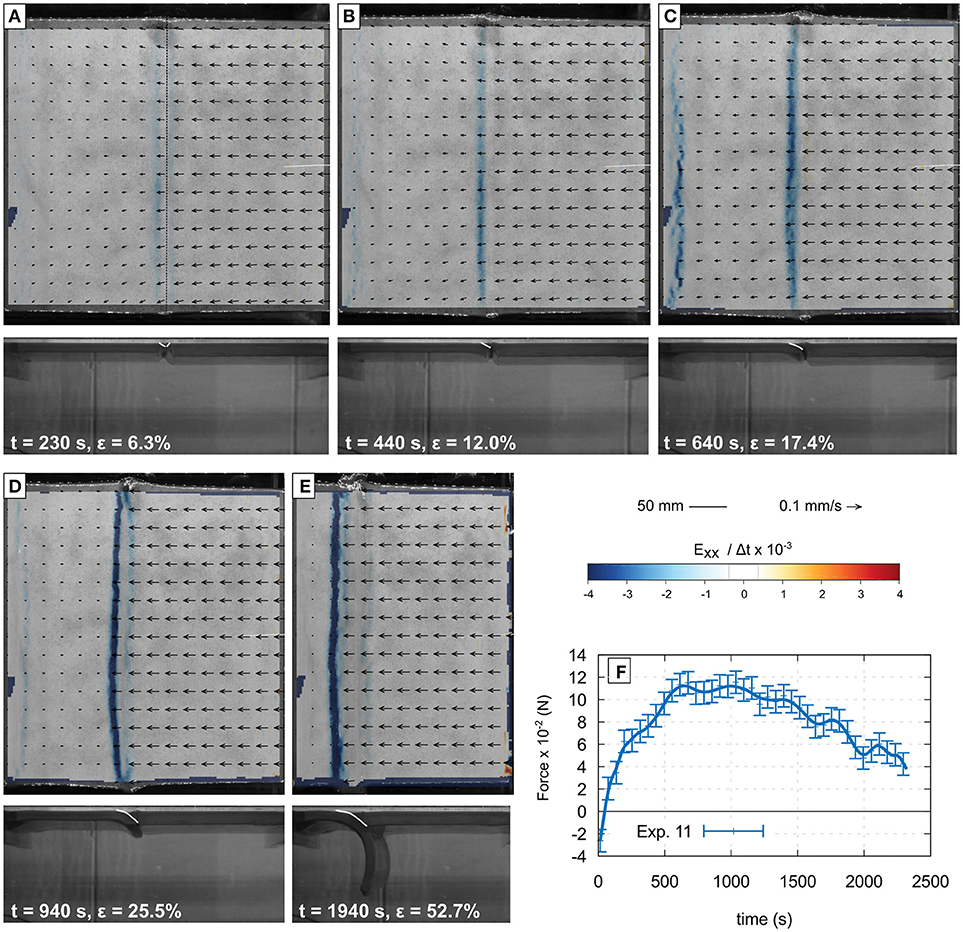
Figure 5. Successive stages of Exp. 11. Panels (A–E) show the surface view of the deformed model with PIV vectors, and convergence-parallel horizontal shortening rate. Panel (F) shows the evolution of the force measured at the trailing edge of the plate on the left-hand side. Despite being more negatively buoyant, the thicker right-hand side plate becomes the overriding plate. White lines on side views delineate the active faults. ϵ is the bulk shortening.
4.1.2. Experiment 14
This model includes not two but three plates separated by inclined, rounded, and lubricated fault zones. The model is designed to test the polarity of subduction when convergence does not require the formation of new inclined thrust faults but can employ pre-existing weak zones. Two oceanic lithospheric plates with different thicknesses and buoyancies are placed with the third plate in between which includes two oppositely dipping, lubricated, round cuts. The right-hand plate is 12 mm thick and its density is 1,004 kg m−3 (i.e., b = −0.4%), while the left-hand plate is 20 mm thick and its density is 1,015 kg m−3 (i.e., b = −1.5%). The center plate is up to 15 mm thick in the center but tapers owing to two curved weak zones. The curvature radius of the weak zones is 7-cm as in previous subduction experiments performed by Boutelier and Cruden (2016). The density of the center plate is 1,004 kg m−3. The center plate is 100 mm long and like all other plates 40 cm wide. Imposed convergence is initially accommodated in both inclined cuts (Figures 6A,B), but the fault allowing the subduction of the thicker and more negatively buoyant plate accommodates more shortening. At 700 s convergence becomes exclusively accommodated by the fault allowing the burial of the thicker plate (Figures 6C–E). At 500 s, the horizontal force reaches a peak value (6 × 10⁻² N), and then decreases steadily until 1,500 s (Figure 6F). At about 1,200 s the recorded force becomes negative, indicating that the pull generated by the negative buoyancy of the subducted slab now overcomes the bending strength and shear along the plate boundary. Following Gurnis et al. (2004) we interpret this signature as subduction become self-sustaining, being driven by the negative buoyancy of the slab. At 1,500 s, the force goes back up to zero (Figure 6F), while the tip of the subducted slab touches the rigid plate simulating the high viscosity lower mantle. The force then decreases again, as the slab rolls over (Boutelier and Cruden, 2016).
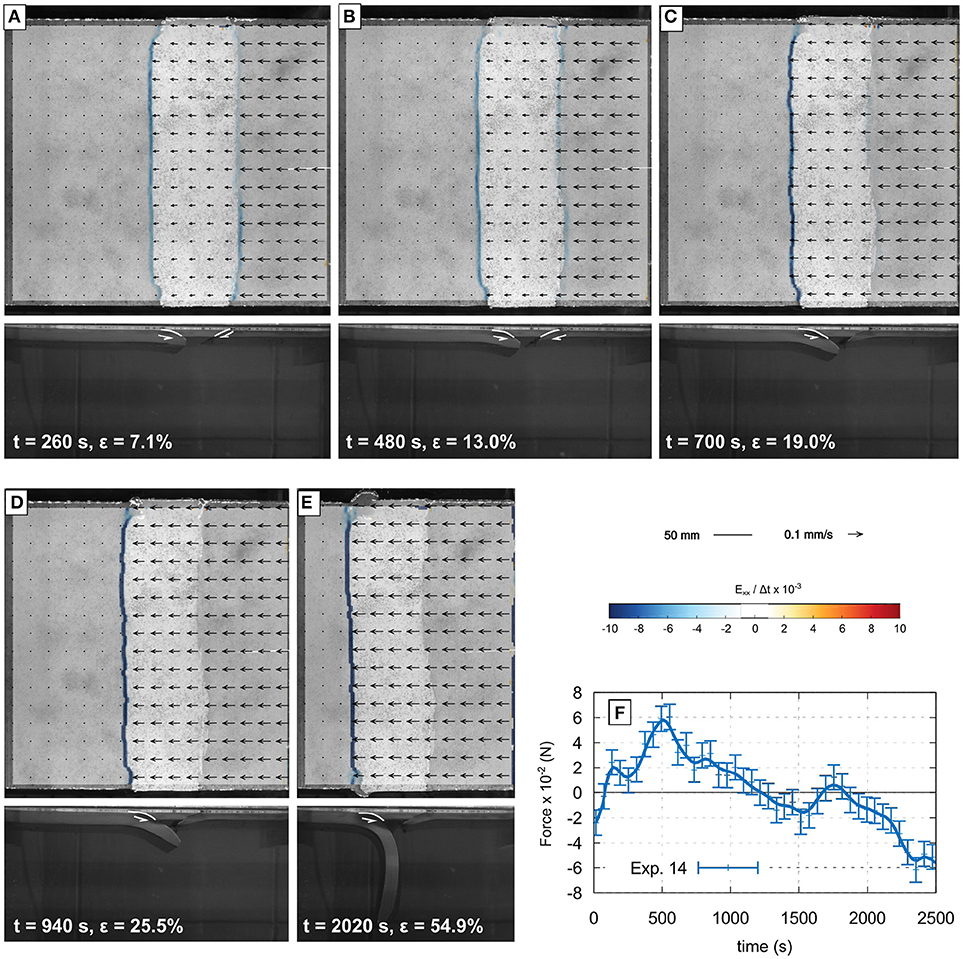
Figure 6. Successive stages of Exp. 14. Panels (A–E) show the surface view of the deformed model with PIV vectors, and convergence-parallel horizontal shortening rate. Panel (F) shows the evolution of the force measured at the trailing edge of the plate on the left-hand side. This unique three-plates experiment shows that when weak inclined faults pre-exist, the thick and most negatively buoyant plate subducts.
4.1.3. Experiment 15
This experiment is similar to Experiment 14, but the two oppositely dipping weak zones are now collapsed into a small triangular zone sitting across and on top of the transform fault zone. This setup attempts to simulate the mechanical effect of hydrothermal alteration of the oceanic lithosphere around the fault zone. At the fault zone, fluids can percolate to some 10–15 km-depth causing deep mechanical weakening via serpentinization, whereas only 10–20 km away from the oceanic transform fault the maximum depth that alteration can reach decreases (Roland et al., 2010). We simplified this spatial distribution of hydrothermal alteration and employed two half triangles made of the oceanic crust material, separated from the rest of the plates by a weak inclined interface (i.e., lubricated with paraffin oil during the making of the model). The depth of the inverted triangle was 4 mm (equivalent 14 km), and the half width of the inverted triangle was 5 mm (equivalent to 17.5 km). While both plates have the same weak triangular zone atop the transform zone, the right-hand plate is 20 mm thick and its buoyancy is 1,015 kg m−3 (i.e., b = −1.5%), while the left-hand plate is only 10 mm thick and its density is 999 kg m−3 (i.e., b = +0.1%). Convergence is accommodated in the weak zones surrounding the transform fault, and rapidly a new fault propagate from the alteration triangle allowing the subduction of the thicker and more negatively buoyant lithosphere (Figures 7A–E). The peak force (8 × 10⁻² N) is measured at 500 s, and decreases rapidly after to reach zero at 1,000 s. The force remains near zero until about 1,400 s, and then decreases rapidly again (Figure 7F).
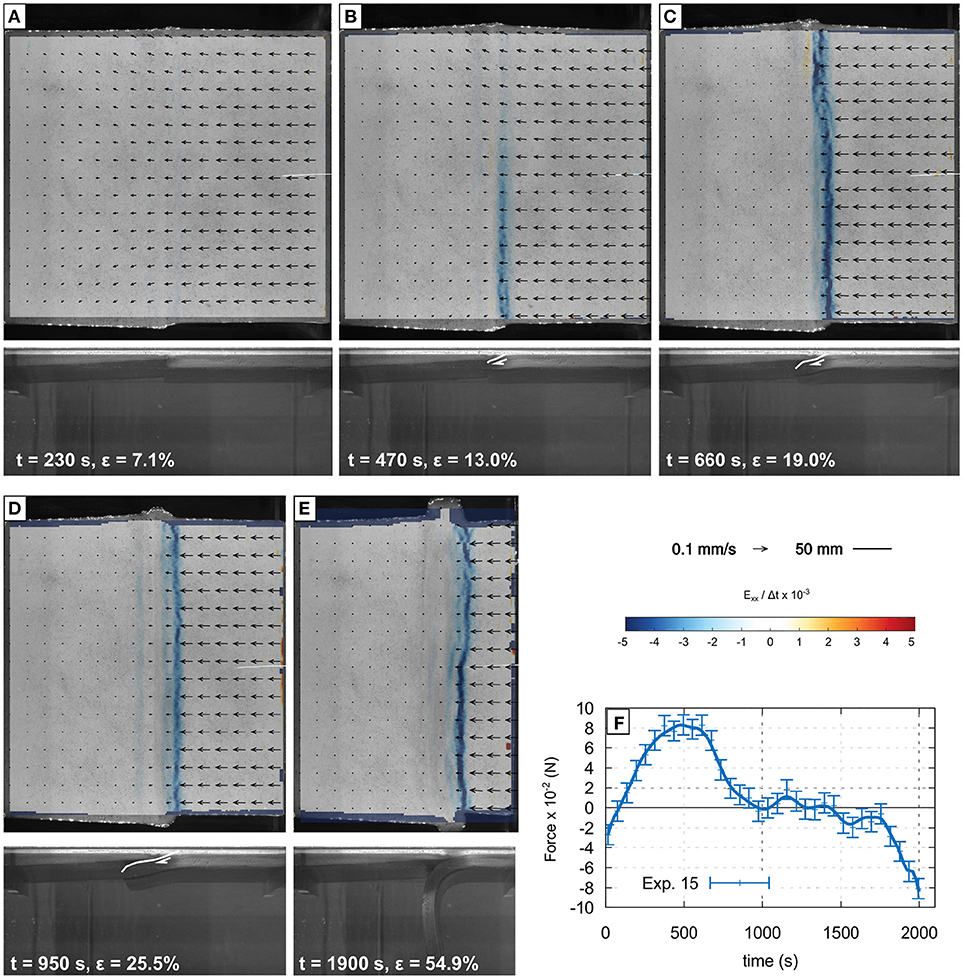
Figure 7. Successive stages of Exp. 15. Panels (A–E) show the surface view of the deformed model with PIV vectors, and convergence-parallel horizontal shortening rate. Panel (F) shows the evolution of the force measured at the trailing edge of the plate on the left-hand side. Owing to the weak inverted triangle atop the transform fault, the control on the polarity of subduction exerted by plate strength is diminshed and the thick and most negatively buoyant plate becomes the subducting plate.
4.1.4. Type-N Models
In theses experiments (Exp. 5–13) the lithosphere is thinned below the transform fault. The maps of the age of the seafloor show that the transform segment is not always perfectly perpendicular to the spreading segment. Therefore, some transform segments may actually be bounded by very young lithosphere near the transform fault. Accounting for this observation, we thinned the lithosphere and created a steep transition from very young at the plate boundary to much older a few ten km away from the fault (Figure 3D). In experiment 5 the plate thickness was 5 mm within a 1 cm wide notch with vertical sides. In all other experiments with a notch the plate thickness increased linearly away from the transform fault where the tickness was 5 mm. The sides of the notch were inclined at 60°. No other parameter of the notch structure were varied. The notch resulted in focusing the deformation into the transform fault and away from the trailing edges of both plates. In a number of experiments the thin plate failed first and often it failed near its trailing edge. The thinning of the mantle lithosphere below the transform prevented this undesired effect. However, around the transform faults, two oppositely dipping faults nucleated and the thinnest and weakest plate generally failed first thus becoming the lower plate. We therefore concluded that implementing a notch below the transform fault did not affect the polarity of subduction initiation but only focused deformation in the transform zone, and therefore away from the trailing edge. Another possibility to achieve the same outcome was to progressively increase the plate thickness away from the transform.
4.1.5. Surface Temperature
As the first experiments (Exp. 1–10) revealed that the thin plate, despite being positively buoyant, generally failed first and became the lower plate, we decreased the relative importance of the plate mechanical strength by increasing the surface temperature. This leads to an important reduction in strength, while maintaining buoyancy gradient across the boundary. However, the same outcome was systematically obtained: the thin plate breaks first and becomes the lower plate despite the buoyancy gradient. We concluded that the outcome of the experiments did not derive from excessive plate strength relative to buoyancy, but because of the strength difference between the thin and thick plates. Adding a weak oceanic crust layer at the model surface provided a more realistic strength profile, but did not change the situation.
4.1.6. Type-H Models
These models are similar to detailed Experiment 15 (Figure 7). An inverted triangle of oceanic crust is implemented on top of the transform zone simulating the hydrothermal alteration of crust and mantle causing mechanical weakening which extended further away from the faut zone near the surface than at depth. With inclined weak zones, the relative strength of the thin or thick plates did not matter as much since both are equally weak along the inverted triangular zone. Therefore the strength control over subduction polarity is lessened and it is the thick plate which becomes the lower plate because it is more negatively buoyant. We note that the triangular zone only affect the formation of the inclined thrust, not the bending of the plate itself. Therefore our results suggest that it is not the plate bending strength which controlled the polarity in experiments without the inclined weak zones, but the plastic shear strength which must be overcome to generate a new thrust.
4.2. Non-Cylindrical Models
The non-cylindrical models include a plate thickness and buoyancy variation in the horizontal direction parallel to the transform fault (Figure 3). The thickness and buoyancy variations are mirrored across the fault such that the buoyancy contrast across the fault changes sign along the fault.
The experiment was reproduced four times with similar parameters and obtained slightly different behaviors. However, the recorded horizontal force is systematically higher than obtained in cylindrical models at the same stage and the force did not become negative, indicating that self-sustaining subduction regime was not obtained.
In all non-cylindrical experiments, imposed convergence produced two oppositely dipping thrusts at the ends of the transform fault, where the relative buoyancy contrast was largest (Figure 8). The thrusts initiated near the edges of the model and propagated laterally along the transform fault toward the model interior. The thrusts then connected near the middle of the model width via a tear.
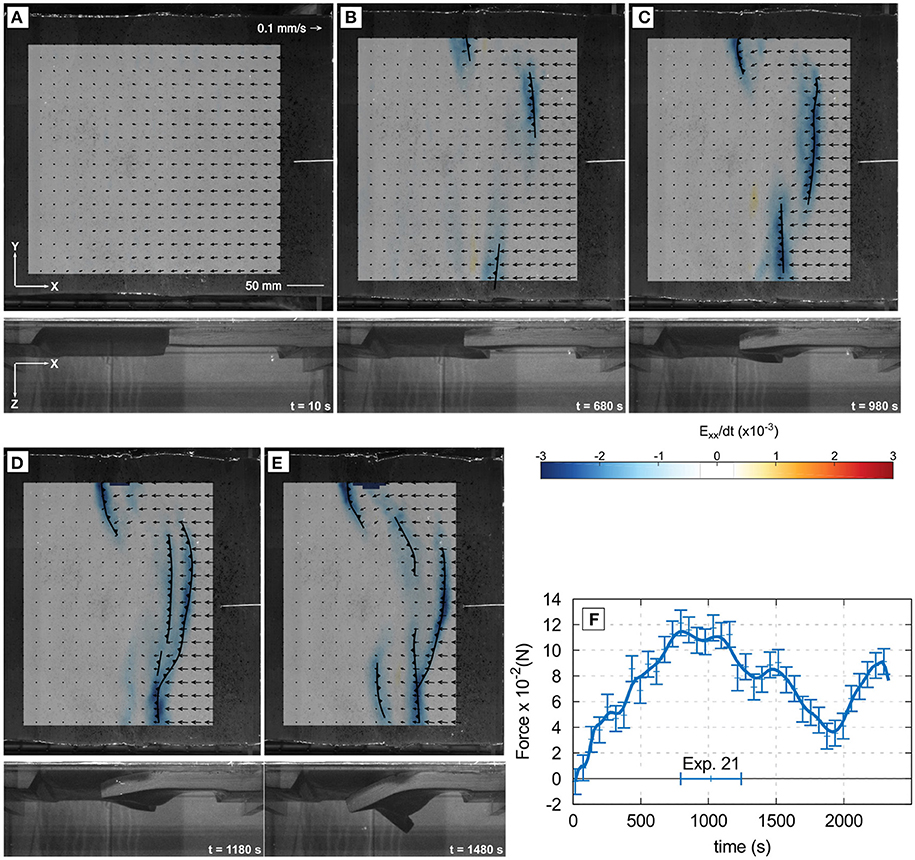
Figure 8. Successive stages of Exp. 21. Panels (A–E) show the surface view of the deformed model with PIV vectors, and convergence-parallel horizontal shortening rate. Panel (F) shows the evolution of the force measured at the trailing edge of the plate on the left-hand side. The variation of plate thickness and buoyancy along teh strike of the transform fault resuslted in generation of multiple faults.
Experiment 21 (Figure 8) had a third thrust initiated near the center of the model width but further away from the transform fault than the two thrusts formed near the model edges. As the three thrust faults propagated laterally the central fault overlapped and then connected with the side thrust with the same polarity. This created a long thrust fault accross most of the model width. However, it never resulted in a single structure accomodating all the convergence as obtained in the cylindrical models, but a network of faults accomodating the shortening, and causing block rotation and distributed horizontal shear (Figure 8). Although Exp. 21 provided the lowest horizontal force of all the non-cylindrical experiments, the measured force never became negative. The collapse of the model associated with the retreat of one of the thrust (Figure 8e) does indicate that the subducted slab is locally generating a large downward pull and driving retreat. However, near the center of the model, subduction is not yet self-sustaining and several thrusts with the same polarity are active, indicating that there is a large compressional horizontal stress.
The non-cylindrical experiments generally display several thrust faults accomodating shortening near the center of the model. In Experiment 21 these thrusts are dipping in the same direction but in the others, the thrusts are dipping in opposite direction, facing the former transform fault. Only near the edges of the model, is the shortening generally accommodated by a single thrust achieving sufficient cumulated shortening to produce a sufficiently long subducted slab to generate a significant downward pull.
5. Discussion
5.1. Polarity of Subduction
Our scaled analog experiments demonstrate that in the absence of a suitably oriented weak zone, induced subduction initiation at a transform fault by orthogonal convergence at constant rate requires the nucleation of a new thrust near the transform fault. This indicates that the transform fault zone could be preserved and former transform fault zone could be in the forearc basement of induced subduction zones. This possibility of paleo transform fault parallel to the trench in the forearc domain might constitute a major weak zone if the convergence in the subduction zone later becomes oblique. Such feature could localize strain partitioning in the forearc instead of the arc during the formation of a sliver such as in Sumatra-Java (Beck, 1991; Cochran, 2010; Haq and Davis, 2010; Lallemand, 2014).
Another important consequence of the mentionned-above experimental observations is that without a suitably oriented weak zone, plastic failure and the nucleation of the new plate boundary systematically occurs in the weakest plate, which is the younger and thinner plate. Our experiments thus confirm the previous findings of Gurnis et al. (2004), that deformation concentrates within the young plate. In our cases this deformation led to the young and weak plate systematically becoming the lower plate. An inclined thrust initiates preferentially from the bottom of the transform fault through the thin plate, allowing the underthrusting of the thin plate. This prefered polarity is similar to previous shortening experiments of single layer (Boutelier and Oncken, 2011), and is due to the fact that the opposite polarity of a thrust through the thin plate would either build a large topographic high above the thick plate or require its bending downward or a combination of both (Figure 9). During incipient failure the plastic fault dipping toward the thick plate is thus favored because the opposite polarity requires additional mechanical work. When the thin plate is subducted, the monitored horizontal force in the plates never became negative, and therefore we conclude that the self-sustaining subduction regime was not achieved.
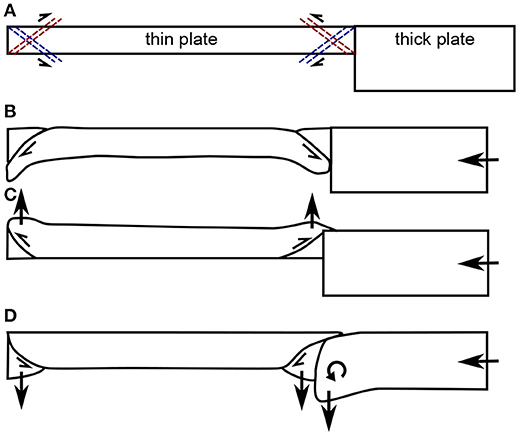
Figure 9. Plastic failure initiation in the thin plate. (A) plastic failure may initiate simulatenously at both ends of the thin plate, and two conjugate thrusts may be formed originating from either the top or bottom of the plate end. (B) prefered polarity allows the subduction of the tin plate from both ends. Conjugate thrusts lead to build-up of topographic highs (C) and/or bending down of the thick plate (D).
Experiments 6, 7, and 8 suggest that without a plate thickness variation, the less negatively buoyant plate subduct because of a strength contrast between the plates (Table 3). This strength difference could be due to the different compositions employed for the mantle lithosphere to cause a negative buoyancy difference. An increase in strength associated with an increase in density is indeed likely, as adding filler tends to increase both the density and the plastic strength. However rheological tests indicate that the two employed materials have indistinguishable plastic yield stresses. We therefore acknowledge a bias in the experimental results that may be associated with the low repetition number. The strength difference between the plates associated exclusively with plate thickness change is evident in experiments 11, 12, and 15–23, since the same materials were employed for both plates (see Table 3). Then, in the absence of a pre-existing inclined weak zone, deformation occured systematically in the thin plate because it is weaker, and led to its subduction underneath the thick plate. Without any possible strength difference between the plates, when the same materials were employed for both plates and the same constant thickness was employed for both plates, many thrusts were formed simulatenously and self-sustaining subduction regime could not be achieved (e.g., exp. 9 and 16, Tables 3, 4).
Following Gurnis et al. (2004), we implemented pre-existing dipping weak zones to determine the polarity of the created thrust and also confirm that in this case the most negatively buoyant plate generally does become the lower plate despite also having the largest bending strength. We collapsed the weak zones into a narrow inverted triangle on top of the transform fault zone simulating the mechanical effect of hydrothermal alteration around the transform fault. Aqueous fluids penetrate the crust and the lithosphere around the transform fault, and the maximum depth which the fluid and therefore alteration reaction can reach decreases away from the transform fault. The hydrothermal alteration weakens the crust and mantle and therefore two weak zones may exist on either side of the transform that dip toward the fault. Our experiments show that this approximate spatial distribution of strength around the transform fault associated with hydrothermal alteration is sufficient to remove the need to create a new thrust through undeformed lithosphere material and therefore the polarity of subduction becomes primarily controlled by the buoyancy gradient across the transform fault. The fault dipping toward the thin plate (red in Figure 10) requires the bending of the thick plate but cuts through the hot and hence weak bottom part of the thin plate, while the fault dipping toward the thick plate requires cutting through the colder and stronger thicker plate. Our models indicate that both faults form at the surface of the model, but the fault dipping toward the thin plate rapidly becomes dominant and therefore must require the least mechanical work. This allows the thick negatively buoyant plate to subduct and the slab pull force to increase with time and shortening, eventually leading to self sustaining subduction in the case of cylindrical models.
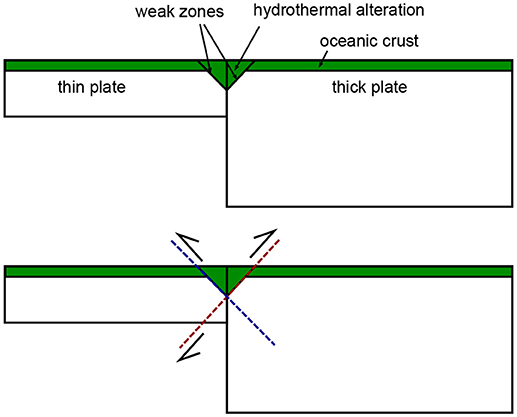
Figure 10. Plastic failure initiation around hydrothermally altered transform fault. Top: simplified model structure around the transform fault. Bottom: two conjugate faults created along the pre-existing weak zones consitituting the limits of the hydrothermally altered crust and mantle.
5.2. Forced Initiation and Self-Sustaining Subduction
Like in previous numerical simulations by Gurnis et al. (2004), self-sustaining subduction, or subduction driven by the negative buoyancy of the subducted slab, has been obtained in our analog experiments after a critical amount of convergence is imposed (Table 4). The simulations of Gurnis et al. (2004) employed a visco-elasto-plastic rheological model of the lithosphere and viscous upper mantle that can not be reproduced in our analog setup. Instead we employed an elasto-plastic with strain softening rheology for the lithosphere and an inviscid asthenosphere. The rate-independant rheological model for the lithosphere in the analog experiments is required for the rate of advection associated with deformation to be scaled with the rate of heat diffusion via the Peclet number. The viscosity of the asthenosphere was shown to not be a controlling parameter of the investigated process in the simulations of Gurnis et al. (2004), but the parametrization of the ductile softening is important and poorly constrained. The convergence rate was shown to be an important factor for nucleation of self-sustaining subduction throughout an homogeneous plate by Gurnis et al. (2004). However, the differences between our models and the simulations by Gurnis et al. (2004) are not simply due to the rate since we have used rates equivalent to 2.8 cm/year while Gurnis et al. (2004) employed a similar convergence rate of 2.0 cm/year.
In several of our analog experiments the peak stress is reached after some ~500 s and ~4.25 cm of imposed convergence, which scales to ~5.4 Ma and ~150 km (Table 4) and fits very well with the previous results of Gurnis et al. (2004). The magnitude of the peak force in our cylindrical models is ~1 × 10⁻² N, which gives ~2.75 × 10⁻² N m−1 and scales up to ~1.1 × 10¹² N m−1 (Table 4). This magnitude of the force per linear length of trench compares well with the previous values of Gurnis et al. (2004) (~2−4 × 10¹² N m−1), but are significantly lower than the values obtained by Bonnardot et al. (2008), Hassani et al. (1997), or Martinod et al. (2016) (up to ~2 × 10¹³ N m−1).
However, in our analog experiments, the compressive horizontal force in the model lithosphere did not decrease as rapidly as in some of the simulations of Gurnis et al. (2004), and therefore the force in the model did not become negative before some 1,000 s and 85 mm of imposed convergence which scales up to 10.8 Ma and 297 km (Exp. 15, Figure 7). Therefore we conclude that with our strain softening analog materials (see Boutelier and Cruden, 2016), self-sustaining subduction does not start with only 100 to 150 km of imposed convergence but requires at least ~300 km.
A shorter minimal length of imposed shortening would be obtained for a more efficient softening mechanism in the lithosphere, or if the downward pull is enhanced. This could result from metamorphic reactions (eclogitization) causing the negative buoyancy of the subducted slab to increase (e.g., Doin and Henry, 2001) or flow in the mantle assisting the downward movement of the slab instead of resisting it (e.g., Boutelier and Cruden, 2008; Baes and Sobolev, 2017).
5.3. Buoyancy Gradient Along the Fault
Our experiments indicate that the buoyancy gradient along the transform fault causes the formation of at least two oppositely-dipping thrust faults at the ends of the transform segment. In several experiments the two thrusts propagated toward the model interior and connected via a tear of the subducted slabs at depth. Since both slabs are continuously subducted the tear must propagate in both directions at the same rate as convergence. At the model surface a broad area of shear and vertical axis rotation is observed between the subduction zones. This behavior was obtained for age differences of up to 25 Myr across the transform fault. If the age difference across the fault is larger, for example when the spreading rate was lower, the plate thickness difference may be larger but the buoyancy difference lower because the thickness and buoyancy change with age rapidly when the plate is young, slowly when the plate is old (Figure 2). It is therefore unclear whether large mega transform faults associated with protracted slow spreading such as observed in the central Atlantic or Indian ocean would facilitate subduction where the age difference is larger. However, regardless of the rate of spreading and associated spatial distribution of lithospheric plate ages, the across-strike buoyancy gradient must change sign along the strike of the transform fault. Therefore we suggest that the observed formation of two thrusts at the edges of the transform fault, with opposite polarities and propagating toward the center of the transform will occur regardless of the rate of spreading prior to the inversion of the trasnform. This is because the pattern of changing the sign of the buoyancy gradient across the fault exist regardless of the spreading rate and it is the controlling parameter leading to the formation of the two thrusts with opposite polarities.
In our non-cylindrical experiments the horizontal force measured at the trailing edge of the left-hand plate was generally higher than obtained in the cylindrical experiments and never became negative. The retreat of the trench in parts of the models, in particular near the edges, demonstrates that the slab locally pulls downward and therefore one would expect to measure a horizontal tension in the plates (Boutelier and Oncken, 2011; Boutelier and Cruden, 2013). However, in the center of the model where there is little thickness and buoyancy contrast between the two plates across the transform fault, several thrusts faults may be created and active, demonstrating that the system is in a strongly compressional stress state. As several thrusts are formed, each accomodates a fraction of the total convergence and none produce a sufficiently long subducted slab to generate a downward pull. The side views show two developping slabs and therefore at least one tear allowing these to lengthen. We postulate that the slab tear and the central compressional domain in the model prevent the model from becoming self-sustaining. Although the slab pull increases at the edges of the model, in the center the plate deformation including the tears require mechanical work and therefore external forcing to continue.
6. Concluding Remarks
We have modeled the most simple geometrical configuration for a transform fault zone to become a subduction zone. We have confirmed that in the absence of a suitably oriented weak zone, imposed convergence results in deformation of the thinner, younger plate. This deformation manifests itself in a inclined thrust initiated from the bottom of the transform fault through the thin plate, and allowing the underthrusting of the thin plate.
We have demonstrated that the buoyancy gradient and plate thickness or strength gradient across the fault associated with the age difference does control the polarity if a suitably oriented weak zone can be employed to thrust the young, thin and positively buoyant plate over the old, thick and negatively buoyant plate. We have shown that the buoyancy gradient across the fault appear to depend on the rate of spreading prior to inversion, but even with a significant buoyancy gradient, a weak zone is required.
Then we have demonstrated that the simple fact that the buoyancy gradient changes sign along the strike of the fault prevent the establishement of a self-sustaining subduction zone because two subduction zones with opposite polarity are created from both ends of the transform segment and a broad zone of lithospheric deformation, including several thrusts is formed in the center which resist spontaneous subduction. It appears that the idea of a transform fault zone becoming a major self-sustaining subduction zone is flawed because the three-dimensional nature of the object was not sufficiently taken into account. However, we must acknowledge that there are other geometrical characteristics of transform faults and subduction zones that must be investigated such as relative scale of the transform and spreading segments, as well as obliquity and diachronicity of convergence.
We conclude that subduction is more likely to be initiated at transform faults that do not link segments of a spreading ridge but separate a continental and oceanic plate or constitute the transform edge of a retreating back-arc basin. For example, the Hunter fault zone marks the south-eastern edge of the North-Fidji basin and formed because of the retreat of the New Hebrides subduction hinge (Charvis and Pelletier, 1989; Schellart et al., 2006; Patriat et al., 2015). However, this fault now separates the young lithosphere of the North-Fidji back-arc basin from the significantly older oceanic lithosphere of the South-Fidji basin. There could therefore be a suitable buoyancy gradient, which however does not vary along strike in the manner described in this study. Another example, is the western termination of the Aleutian subduction zone in a transform fault separating the old pacific oceanic lithosphere from the stretched north-american continental lithosphere.
Finally, the magmatic arc may also be considered as a more favorable site of subduction initiation. Collision of the Ontong-Java plateau with the Vitiaz trench resulted in the initiation of the New-Hebrides subduction zone in the back of the arc (e.g., Mann and Taira, 2004). A similar scenario has been proposed for the initiation of the Carribean subduction zone. The collision of an oceanic plateau with an “andean” east-dipping subduction caused the nucleation of a new subduction with reversed polarity in the magmatic arc, which accomodated the eastward movement of the caribbean plate (Pindell et al., 2005; Pindell and Kennan, 2009). As the magmatic arc often rifts to open backarc basins, they can rapidly shorten when a buoyant object arrives in the trench causing a new subduction via subduction polarity reversal (Boutelier et al., 2003).
Author Contributions
DBo designed the project, developed the methods, analyzed the results and wrote the manuscript. DBe built the models, and ran the experiments.
Conflict of Interest Statement
The authors declare that the research was conducted in the absence of any commercial or financial relationships that could be construed as a potential conflict of interest.
Acknowledgments
We acknowledge support by the University of Newcastle.
References
Adam, J., Urai, J., Wieneke, B., Oncken, O., Pfeiffer, K., Kukowski, N., et al. (2005). Shear localisation and strain distribution during tectonic faulting-new insights from granular-flow experiments and high-resolution optical image correlation techniques. J. Struct. Geol. 27, 283–301. doi: 10.1016/j.jsg.2004.08.008
Afonso, J.-C., Ranalli, G., and Fernàndez, M. (2007). Density structure and buoyancy of the oceanic lithosphere revisited. Geophys. Res. Lett. 34:L10302. doi: 10.1029/2007GL029515
Baes, M., and Sobolev, S. V. (2017). Mantle flow as a trigger for subduction initiation: a missing element of the Wilson cycle concept. Geochem. Geophys. Geosyst. 18, 4469–4486. doi: 10.1002/2017GC006962
Beck, M. E. (1991). Coastwise transport reconsidered: lateral displacements in oblique subduction zones, and tectonic consequences. Phys. Earth Planet. Interiors 68, 1–8. doi: 10.1016/0031-9201(91)90002-Y
Bonnardot, M.-A., Hassani, R., and Tric, E. (2008). Numerical modelling of lithosphere-asthenosphere interaction in a subduction zone. Earth Planet. Sci. Lett. 272, 698–708. doi: 10.1016/j.epsl.2008.06.009
Boutelier, D. (2016). TecPIV – A MATLAB-based application for PIV-analysis of experimental tectonics. Comput. Geosci. 89, 186–199. doi: 10.1016/j.cageo.2016.02.002
Boutelier, D., Chemenda, A., and Burg, J.-P. (2003). Subduction versus accretion of intra-oceanic volcanic arcs: insight from thermo-mechanical analogue experiments. Earth Planet. Sci. Lett. 212, 31–45. doi: 10.1016/S0012-821X(03)00239-5
Boutelier, D., Chemenda, A., and Jorand, C. (2002). Thermo-mechanical laboratory modelling of continental subduction: first experiments. J. Virt. Explorer 6, 61–65.
Boutelier, D., and Cruden, A. (2008). Impact of regional mantle flow on subducting plate geometry and interplate stress: insights from physical modelling. Geophys. J. Int. 174, 719–732. doi: 10.1111/j.1365-246X.2008.03826.x
Boutelier, D., and Cruden, A. (2013). Slab rollback rate and trench curvature controlled by arc deformation. Geology 41, 911–914. doi: 10.1130/G34338.1
Boutelier, D., and Cruden, A. (2016). Slab breakoff: insights from 3D thermo-mechanical analogue modelling experiments. Tectonophysics 694, 197–213. doi: 10.1016/j.tecto.2016.10.020
Boutelier, D., and Oncken, O. (2011). 3-D thermo-mechanical laboratory modeling of plate-tectonics: modeling scheme, technique and first experiments. Solid Earth 2, 35–51. doi: 10.5194/se-2-35-2011
Buckingham, E. (1914). On physically similar systems; illustrations of the use of dimensional equations. Phys. Rev. 4, 345–376. doi: 10.1103/PhysRev.4.345
Charvis, P., and Pelletier, B. (1989). The northern New Hebrides back-arc troughs: history and relation with the North Fiji basin. Tectonophysics 170, 259–277. doi: 10.1016/0040-1951(89)90275-8
Chemenda, A. I., Burg, J.-p., and Mattauer, M. (2000). Evolutionary model of the Himalaya-Tibet system: geopoem. Earth Planet. Sci. Lett. 174, 397–409. doi: 10.1016/S0012-821X(99)00277-0
Cloos, M. (1993). Lithospheric buoyancy and collisional orogenesis: subduction of oceanic plateaus, continental margins, island arcs, spreading ridges, and seamounts. Geol. Soc. Am. Bull. 105, 715–737. doi: 10.1130/0016-7606(1993)105<0715:LBACOS>2.3.CO;2
Cochran, J. R. (2010). Morphology and tectonics of the Andaman Forearc, northeastern Indian Ocean. Geophys. J. Int. 182, 631–651. doi: 10.1111/j.1365-246X.2010.04663.x
De Bresser, J. H. P., Ter Heege, J. H., and Spiers, C. J. (2001). Grain size reduction by dynamic recrystallization: can it result in major rheological weakening? Int. J. Earth Sci. 90, 28–45. doi: 10.1007/s005310000149
Dewey, J. F. (1969). Continental margins: a model for conversion of Atlantic type to Andean type. Earth Planet. Sci. Lett. 6, 189–197. doi: 10.1016/0012-821X(69)90089-2
Doin, M. P., and Henry, P. (2001). Subduction initiation and continental crust recycling: The roles of rheology and eclogitization. Tectonophysics 342, 163–191. doi: 10.1016/S0040-1951(01)00161-5
Funiciello, F., Faccenna, C., Giardini, D., and Regenauer-Lieb, K. (2003a). Dynamics of retreating slabs: 2. Insights from three-dimensional laboratory experiments. J. Geophys. Res. 108:2207. doi: 10.1029/2001JB000896
Funiciello, F., Morra, G., Regenauer-Lieb, K., and Giardini, D. (2003b). Dynamics of retreating slabs: 1. Insights from two-dimensional numerical experiments. J. Geophys. Res. 108:2206. doi: 10.1029/2001JB000898
Gerya, T. (2011a). Future directions in subduction modeling. J. Geodyn. 52, 344–378. doi: 10.1016/j.jog.2011.06.005
Gerya, T. (2011b). “Intra-oceanic subduction zones,” in Arc-Continent Collision, eds D. Brown and P. D. Ryan (Berlin; Heidelberg: Springer Verlag), 23–51.
Gurnis, M., Hall, C., and Lavier, L. (2004). Evolving force balance during incipient subduction. Geochem. Geophys. Geosyst. 5:Q07001. doi: 10.1029/2003GC000681
Hall, C. E., Gurnis, M., Sdrolias, M., Lavier, L. L., and Müller, R. (2003). Catastrophic initiation of subduction following forced convergence across fracture zones. Earth Planet. Sci. Lett. 212, 15–30. doi: 10.1016/S0012-821X(03)00242-5
Hansen, L. N., Zimmerman, M. E., Dillman, A. M., and Kohlstedt, D. L. (2012a). Strain localization in olivine aggregates at high temperature: a laboratory comparison of constant-strain-rate and constant-stress boundary conditions. Earth Planet. Sci. Lett. 333–334, 134–145. doi: 10.1016/j.epsl.2012.04.016
Hansen, L. N., Zimmerman, M. E., and Kohlstedt, D. L. (2012b). The influence of microstructure on deformation of olivine in the grain-boundary sliding regime. J. Geophys. Res. Solid Earth 117, 1–17. doi: 10.1029/2012JB009305
Haq, S. S. B., and Davis, D. M. (2010). Mechanics of fore-arc slivers: insights from simple analog models. Tectonics 29, 1–14. doi: 10.1029/2009TC002583
Hassani, R., Jongmans, D., and Chéry, J. (1997). Study of plate deformation and stress in subduction processes using two-dimensional numerical models. J. Geophys. Res. B Solid Earth 102, 17951–17965. doi: 10.1029/97JB01354
Karig, D. E. (1982). Initiation of subduction zones: implications for arc evolution and ophiolite development. Geol. Soc. Lond. 10, 563–576. doi: 10.1144/GSL.SP.1982.010.01.37
Kreemer, C., Holt, W. E., and Haines, A. J. (2003). An integrated global model of present-day plate motions and plate boundary deformation. Geophys. J. Int. 154, 8–34. doi: 10.1046/j.1365-246X.2003.01917.x
Kreemer, C., Klein, E., Shen, Z.-K., Wang, M., Estey, L., Wier, S., and Boler, F. (2014). A geodetic plate motion and Global Strain Rate Model. Geochem. Geophys. Geosyst. 15, 3849–3889. doi: 10.1002/2014GC005407
Lallemand, S. (2014). Strain modes within the forearc, arc and back-arc domains in the Izu (Japan) and Taiwan arc-continent collisional settings. J. Asian Earth Sci. 86, 1–11. doi: 10.1016/j.jseaes.2013.07.043
Mann, P., and Taira, A. (2004). Global tectonic significance of the Solomon Islands and Ontong Java Plateau convergent zone. Tectonophysics 389, 137–190. doi: 10.1016/j.tecto.2003.10.024
Mart, Y., Aharonov, E., Mulugeta, G., Ryan, W., Tentler, T., and Goren, L. (2005). Analogue modelling of the initiation of subduction. Geophys. J. Int. 160, 1081–1091. doi: 10.1111/j.1365-246X.2005.02544.x
Martinod, J., Regard, V., Letourmy, Y., Henry, H., Hassani, R., Baratchart, S., et al. (2016). How do subduction processes contribute to forearc Andean uplift? Insights from numerical models. J. Geodyn. 96, 6–18. doi: 10.1016/j.jog.2015.04.001
Montési, L. G. (2013). Fabric development as the key for forming ductile shear zones and enabling plate tectonics. J. Struct. Geol. 50, 254–266. doi: 10.1016/j.jsg.2012.12.011
Montési, L. G., and Hirth, G. (2003). Grain size evolution and the rheology of ductile shear zones: from laboratory experiments to postseismic creep. Earth Planet. Sci. Lett. 211, 97–110. doi: 10.1016/S0012-821X(03)00196-1
Montési, L. G. J. (2002). A unified description of localization for application to large-scale tectonics. J. Geophys. Res. 107:2045. doi: 10.1029/2001JB000465
Mueller, S., and Phillips, R. (1991). On the initiation of subduction. J. Geophys. Res. 96, 651–665. doi: 10.1029/90JB02237
Müller, R. D., Roest, W. R., Royer, J. Y., Gahagan, L. M., and Sclater, J. G. (1997). Digital isochrons of the world's ocean floor. J. Geophys. Res. 102, 3211–3214. doi: 10.1029/96JB01781
Müller, R. D., Sdrolias, M., Gaina, C., and Roest, W. R. (2008). Age, spreading rates, and spreading asymmetry of the world's ocean crust. Geochem. Geophys. Geosyst. 9, 1–19. doi: 10.1029/2007GC001743
Nikolaeva, K., Gerya, T. V., and Marques, F. O. (2010). Subduction initiation at passive margins: numerical modeling. J. Geophys. Res. 115:B03406. doi: 10.1029/2009JB006549
Nobach, H., and Honkanen, M. (2005). Two-dimensional Gaussian regression for sub-pixel displacement estimation in particle image velocimetry or particle position estimation in particle tracking velocimetry. Exp. Fluids 38, 511–515. doi: 10.1007/s00348-005-0942-3
Oncken, O., Boutelier, D., Dresen, G., and Schemmann, K. (2012). Strain accumulation controls failure of a plate boundary zone: linking deformation of the Central Andes and lithosphere mechanics. Geochem. Geophys. Geosyst. 13:Q12007. doi: 10.1029/2012GC004280
Oxburgh, E. R., and Parmentier, E. M. (1977). Compositional and density stratification in oceanic lithosphere-causes and consequences. J. Geol. Soc. 133, 343–355. doi: 10.1144/gsjgs.133.4.0343
Patriat, M., Collot, J., Danyushevsky, L., Fabre, M., Meffre, S., Falloon, T., et al. (2015). Propagation of back-arc extension into the arc lithosphere in the southern New Hebrides volcanic arc. Geochem. Geophys. Geosyst. 16, 3142–3159. doi: 10.1002/2015GC005717
Pindell, J., Kennan, L., Maresch, W. V., Stanek, K.-P., Draper, G., and Higgs, R. (2005). Plate-kinematics and crustal dynamics of circum-Caribbean arc-continent interactions: tectonic controls on basin development in Proto-Caribbean margins.Geol. Soc. Spec. Pap. 394, 7–52. doi: 10.1130/0-8137-2394-9.7
Pindell, J. L., and Kennan, L. (2009). Tectonic evolution of the Gulf of Mexico, Caribbean and northern South America in the mantle reference frame: an update. Geol. Soc. Lond. 328, 1–55. doi: 10.1144/SP328.1
Poirier, J. (1980). Shear localization and shear instability in materials in the ductile field. J. Struct. Geol. 2, 135–142. doi: 10.1016/0191-8141(80)90043-7
Regenauer-Lieb, K., Rosenbaum, G., and Weinberg, R. F. (2008). Strain localisation and weakening of the lithosphere during extension. Tectonophysics 458, 96–104. doi: 10.1016/j.tecto.2008.02.014
Regenauer-Lieb, K., Yuen, D. a., and Branlund, J. (2001). The initiation of subduction: criticality by addition of water? Science 294, 578–580. doi: 10.1126/science.1063891
Roland, E., Behn, M. D., and Hirth, G. (2010). Thermal-mechanical behavior of oceanic transform faults: implications for the spatial distribution of seismicity. Geochem. Geophys. Geosyst. 11:Q07001. doi: 10.1029/2010GC003034
Royden, L. H., and Husson, L. (2006). Trench motion, slab geometry and viscous stresses in subduction systems. Geophys. J. Int. 167, 881–905. doi: 10.1111/j.1365-246X.2006.03079.x
Rutter, E. (1999). On the relationship between the formation of shear zones and the form of the flow law for rocks undergoing dynamic recrystallization. Tectonophysics 303, 147–158. doi: 10.1016/S0040-1951(98)00261-3
Schellart, W., Lister, G., and Toy, V. (2006). A Late Cretaceous and Cenozoic reconstruction of the Southwest Pacific region: Tectonics controlled by subduction and slab rollback processes. Earth Sci. Rev. 76, 191–233. doi: 10.1016/j.earscirev.2006.01.002
Smith, S. (1999). The Scientist and Engineer's Guide to Digital Signal Processing. San Diego,CA: California Technical Publishing.
Stern, R. J. (2004). Subduction initiation: spontaneous and induced. Earth Planet. Sci. Lett. 226, 275–292. doi: 10.1016/S0012-821X(04)00498-4
Toth, J., and Gurnis, M. (1998). Dynamics of subduction initiation at preexisting fault zones. J. Geophys. Res. 103, 18053–18067. doi: 10.1029/98JB01076
Turcotte, D., and Schubert, G. (1982). Geodynamics: Applications of Continuum Physics to Geological Problems. New York, NY: John Wiley and Sons.
Vlaar, N., and Wortel, M. (1976). Lithospheric aging, instability and subduction. Tectonophysics 32, 331–351. doi: 10.1016/0040-1951(76)90068-8
Keywords: analog modeling, subduction, subduction initiation, oceanic fault, serpentinization, buoyancy, lithosphere
Citation: Boutelier D and Beckett D (2018) Initiation of Subduction Along Oceanic Transform Faults: Insights From Three-Dimensional Analog Modeling Experiments. Front. Earth Sci. 6:204. doi: 10.3389/feart.2018.00204
Received: 14 June 2018; Accepted: 30 October 2018;
Published: 27 November 2018.
Edited by:
Mélody Philippon, UMR5243 Géosciences Montpellier, FranceReviewed by:
Diane Arcay, Centre National de la Recherche Scientifique (CNRS), FranceAndres Folguera, Universidad de Buenos Aires, Argentina
Copyright © 2018 Boutelier and Beckett. This is an open-access article distributed under the terms of the Creative Commons Attribution License (CC BY). The use, distribution or reproduction in other forums is permitted, provided the original author(s) and the copyright owner(s) are credited and that the original publication in this journal is cited, in accordance with accepted academic practice. No use, distribution or reproduction is permitted which does not comply with these terms.
*Correspondence: David Boutelier, ZGF2aWQuYm91dGVsaWVyQG5ld2Nhc3RsZS5lZHUuYXU=
orcid.org/0000-0002-9383-4156