 Charalampos Charalampidis1*
 Andrea Fischer2
 Michael Kuhn3
 Astrid Lambrecht1Christoph Mayer1
 Konstantinos Thomaidis4
 Markus Weber5
- 1Bavarian Academy of Sciences and Humanities, Munich, Germany
- 2Institute for Interdisciplinary Mountain Research, Austrian Academy of Sciences, Innsbruck, Austria
- 3Institute of Atmospheric and Cryospheric Sciences, University of Innsbruck, Innsbruck, Austria
- 4Department of Earth Sciences, Uppsala University, Uppsala, Sweden
- 5Chair of Photogrammetry and Remote Sensing, Technical University of Munich, Munich, Germany
Glacier mass-budget monitoring documents climate fluctuations, provides context for observed glacier-geometry changes, and can provide information on the glaciers’ states. We examine the mass-budget series and available geometries of three well-documented glaciers located in the same catchment area less than 10 km from one another in the Austrian Ötztal Alps. The altitudinal profiles of the 1981–2010 average specific mass budgets of each glacier serve as climatic reference. We apply these reference mass-budget profiles on all available glacier geometries, thereby retrieving for each glacier reference-climate mass budgets that reveal in a discrete way each glacier’s geometric adjustment over time and its impact on mass loss; interpolation of the reference-climate mass budgets over the 1981–2010 period provides the glaciers’ geometry signals. The geometric mass-budget anomalies derived with respect to these geometry signals indicate decreasing mass budgets over the 1981–2010 period by 0.020 m water equivalent (w.e.) a-2, or 31% additional mass loss compared to the centered anomalies derived with respect to the 1981–2010 averages of the conventional mass-budget series. Reference-climate mass budgets with respect to 1981–2010 of older geometries highlight Hintereisferner’s adapting geometry by almost continuous retreat since 1850. Further retreat is inevitable as Hintereisferner is the furthest from a steady state amongst the three glaciers. The relatively small Kesselwandferner has been also mostly retreating, while briefly advancing in response to short-term climatic trends. In a stable 1981–2010 climate, Kesselwandferner would relatively quickly reach a steady state. Vernagtferner’s geometry since 1979 favors mass loss by thinning, primarily due to extended surge-related mass losses since 1845; this inability to retreat has led to – and will further – Vernagtferner’s disintegration.
Introduction
Glaciers are relatively sensitive climate indicators that adjust their mass according to the prevailing climate (Nye, 1960; Hoinkes and Steinacker, 1975). Mass changes eventually affect the geometry of the glacier; hence, records of glacier fluctuations contain information about past climatic conditions (Roe, 2011). For instance, the documented twentieth-century glacier retreat around the world has been proven to be a consequence of global climate warming (Dyurgerov and Meier, 2000; Vaughan et al., 2013), as the lower parts of glaciers have been experiencing increased surface melt, which over time has also affected higher elevations. Usually, glacier-length records go the furthest back in time, since they are compilations of in situ or remote-sensing observations, physical evidence such as trimlines or moraines, and cultural documentations such as historical reports or paintings. Several studies have used glacier lengths to infer climate fluctuations (e.g., Oerlemans, 1994, 2005; Leclercq and Oerlemans, 2012; Lüthi, 2014). Glacier-length changes have the advantage of being a physical proxy for temperature variations – as opposed to being a biogenic proxy like tree rings or corals (Jones et al., 2009) – and as such, they do not require calibration on instrumental temperature records (e.g., Leclercq and Oerlemans, 2012). However, since length responses lag the actual climate forcing, glacier-length records are a climate proxy with decadal or coarser resolution that require large samples.
The most appropriate way to document the climatic impact on glaciers is mass-budget monitoring (e.g., Braithwaite and Olesen, 1989; Dowdeswell et al., 1997; Braithwaite and Zhang, 1999b; Vincent et al., 2004). A glacier’s mass budget is determined primarily by the climate at the glacier-surface area that forces mass changes via surface accumulation and ablation on annual timescale (Cogley et al., 2011; Burke and Roe, 2014; Charalampidis et al., 2015). The climatic control over a glacier’s annual mass budget is manifested on the glacier surface as the net effect of winter precipitation and summer melt (Hock, 2005), a good indicator of which is summer air temperature (Braithwaite et al., 1992; Van As et al., 2016), especially for continental glaciers (Kuhn, 1984).
Glacier mass budgets are influenced by the geometric adjustment of the glacier-ice volume to the effects of topographic relief (i.e., terrain), and the ever-changing surface topography (Oerlemans, 1997; Giesen and Oerlemans, 2010). The glacier-geometry adjustment determines over time the mass gain or mass loss at the glacier surface. The timescale of a glacier’s geometric adjustment is at least decadal, while it increases for larger and/or more continental glaciers of narrow altitudinal range, located in colder and drier climates (Jóhannesson et al., 1989; Harrison et al., 2001; Oerlemans, 2001; Roe and Baker, 2014). In the case of the Greenland and Antarctic ice sheets that are large ice masses not contained by terrain, geometric adjustments occur generally on millennial timescale (Benn and Evans, 1998; Helsen et al., 2012), even though recent findings suggest that in a rapidly warming climate this might be an overestimation (e.g., Holland et al., 2008; Favier et al., 2014; Mouginot et al., 2015). Due to the time- and capital-intensive nature of glacier mass-budget monitoring in remote locations, very few glaciers worldwide have (sub-) annual measurements. Despite this apparent disadvantage, there are available glacier mass-budget records that may consist of over 50 years of observations.
Even though the mass-budget method captures the climatic impact on a glacier most appropriately, the direct, or glaciological, mass budgets include uncertainties related to the acquisition of in situ stake and snow-pit observations (Oerlemans, 2010; Zemp et al., 2013; Proksch et al., 2016). There is also considerable ambiguity in the translation of point observations into glacier-wide mass budgets (Hoinkes, 1970; Lliboutry, 1974; Østrem and Brugman, 1991); hence, different interpretations of researchers responsible for different mass-budget series, or researchers responsible for the same mass-budget series but during different periods, represent an additional source of uncertainty. Additionally, annual glacier-wide mass budgets can be either conventional or reference-surface, depending, respectively, on whether the glacier geometry used for the interpolation/extrapolation of the stake observations over the glacier surface is of the same year or not (Elsberg et al., 2001; Huss et al., 2012). Glacier mass-budget series are therefore in most cases combinations of conventional and reference-surface annual mass budgets (Cogley et al., 2011).
Several studies attempted to identify climate signals in glacier mass-budget observations. Vincent et al. (2017) evaluated the climate signal from six glaciers in the European Alps as far as 400 km apart. They analyzed clusters of mass-budget stakes below the Equilibrium-Line Altitude (ELA) – the elevation across the glacier surface where annual surface accumulation and ablation are equal (i.e., zero annual surface mass budget) – while comparing their point analysis from these ablation areas to the relative difference of the annual glacier-wide mass budgets with respect to their average. Their analysis illustrated consistency of the unbiased climate signal amongst them, with at least 52% common variance between glaciers, even over such a large distance.
The methodology proposed by Vincent et al. (2017) requires mass-budget stake observations from exact locations in the ablation areas of glaciers over long periods. This might be difficult to obtain in the case of a frequently updated stake network resulting in discontinued point locations, or a strongly adapting glacier geometry resulting in substantial altitudinal changes or missing stakes. Additionally, the ELAs of glaciers are not constant over time. In a warming climate, ablation areas expand upglacier due to the rise of the ELAs, hence the distinction between ablation- and accumulation-stake observations might become unclear over time, while the climatic impact in the high accumulation areas remains under- or unrepresented.
Earlier studies attempted glacier-wide extraction of climate signals from mass-budget observations. The concept of a reference-surface mass budget (Elsberg et al., 2001; Harrison et al., 2001) describes the surface mass budget of a fixed glacier geometry, meaning that point observations are extrapolated to the glacier surface used as reference. Reference-surface mass budgets provide the climate signal when the glacier surface was documented at the beginning of observations, and is used in every year thereafter. However, this concept results in a hypothetical mass-budget series whose difference from the conventional series is smaller than the observational and methodological uncertainties, especially for short periods such as the typical timespan of available glacier mass-budget observations.
We aim instead to quantify the impact of geometry changes on the recent mass loss of Hintereisferner, Kesselwandferner and Vernagtferner, three Austrian glaciers with long-term mass-budget monitoring located in the Ötztal Valley, along the main Alpine crest. The glaciers are located less than 10 km from one another, and have been influenced by the same local climate. We derive mass-budget anomalies with respect to the 1981–2010 period that account for the glaciers’ geometry changes, and estimate in each case the climate forcing, or the effect interannual climate variability had on each glacier. We discuss the individual responses of the glaciers to recent climate fluctuations, and investigate how mass gain and loss were impacted. Lastly, we place the recent geometry changes in a broader context by discussing the evolution of the glaciers since 1850, as well as future implications.
Materials and Methods
Theory
In many cases, it is useful to consider the altitudinal profiles of annual specific mass budgets ba (or a expressed as mass-budget rates) of a glacier (Figure 1A). These profiles, when averaged multi-annually, express the combined average effects of local climate and surrounding terrain on the glacier-surface mass budget. At the same time, the uncertainty related to the translation of point observations into glacier-wide mass budgets is averaged out, while local factors that are difficult to quantify, such as uneven distribution of accumulation due to preferential wind patterns (i.e., snowdrift), avalanche activity, shading or albedo effects, are represented in a bulk way. Such multi-annually averaged mass-budget profiles can be used as climatic reference in mass-budget analyses (e.g., Andreassen et al., 2005) or as climate forcing in ice-flow simulations (e.g., Åkesson et al., 2017), and we shall henceforth dub them reference mass-budget profiles. The value of a reference mass-budget profile ref of a glacier at elevation interval i is therefore equal to:
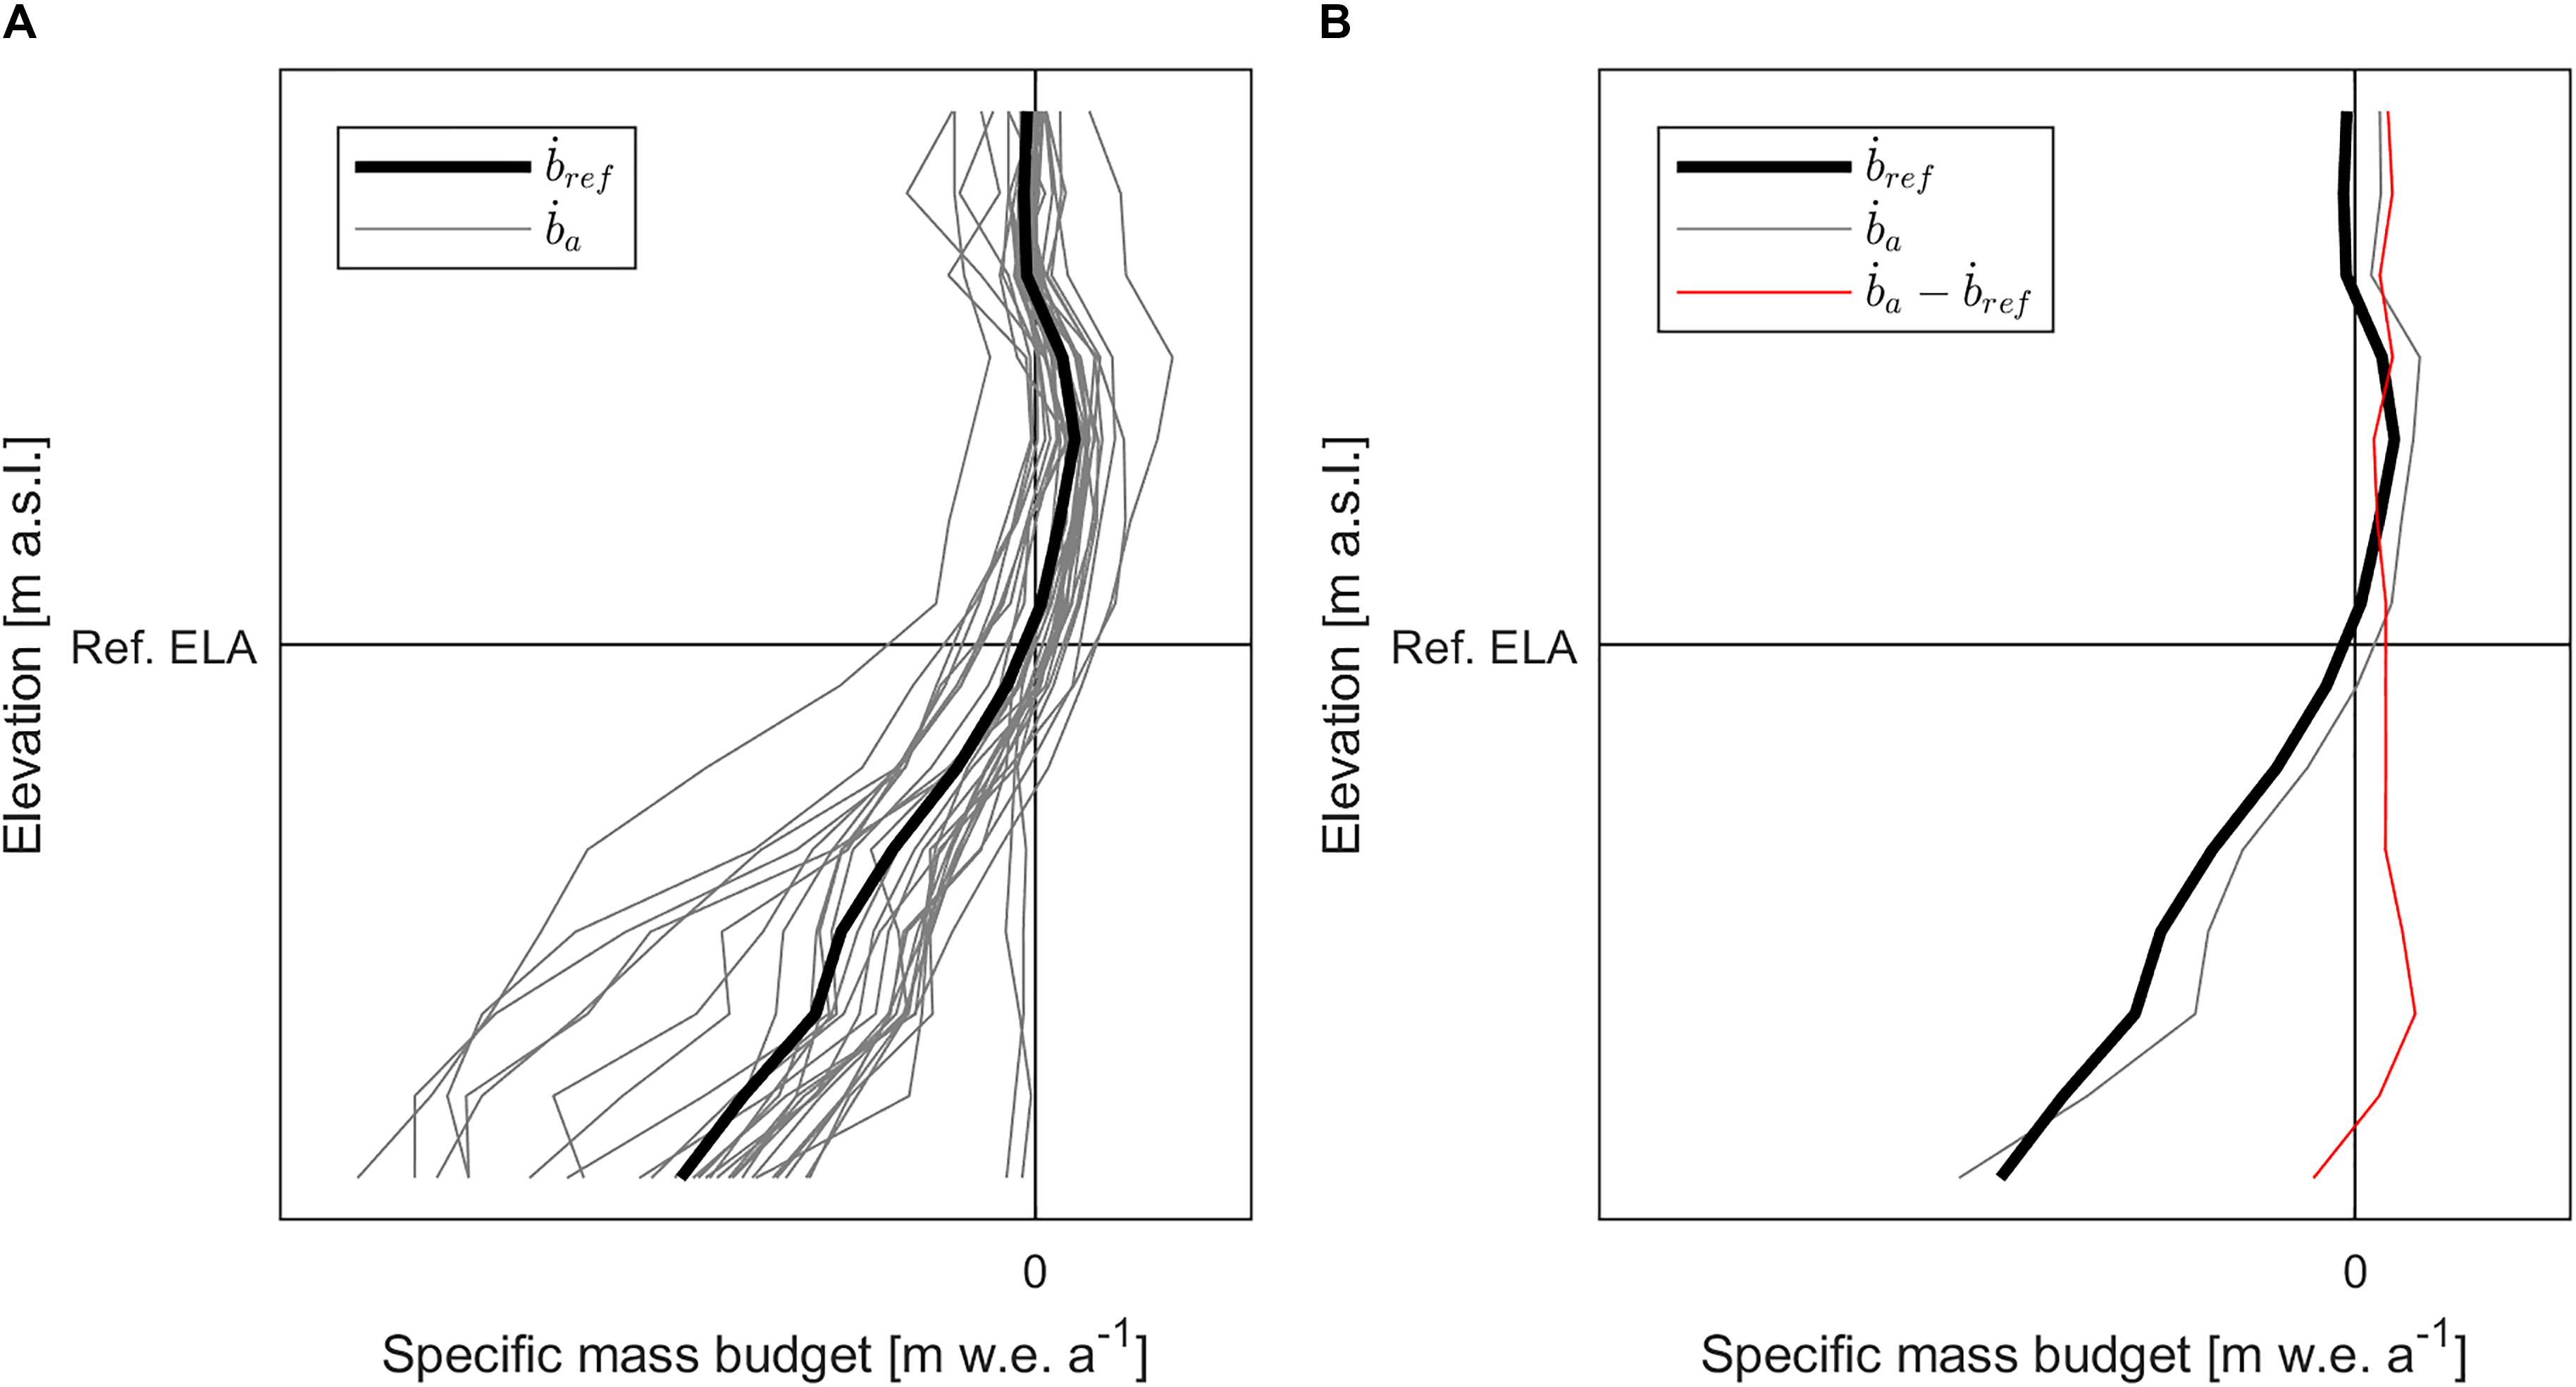
Figure 1. (A) Annual mass-budget profiles a corresponding to observations within a certain period, and their average mass-budget profile ref. The selected period of observations is considered as reference period, ref is considered as reference mass-budget profile, and its Equilibrium-Line Altitude (ELA) as reference ELA. (B) Reference mass-budget profile, annual mass-budget profile in year a, and their difference.
where ai is the annual specific mass budget in year a at the same elevation interval and N is the total number of consecutive years considered as reference period. We shall also henceforth dub reference ELA the ELA defined by a reference mass-budget profile (Figure 1A).
In theory, a glacier is in steady state when its long-term glacier-wide mass budget is equal to zero as a result of stable climate. With a conceptual simulation, Huss et al. (2012) illustrated that a stepwise positive perturbation of the climate forcing – defined as anomaly from a reference climate, and caused by decreased winter precipitation and/or increased summer air temperature – is immediately manifested on a glacier in steady state as negative glacier-wide mass budget, thereby leading to either its retreat or thinning. However, given sufficient time for the glacier’s geometric adjustment toward a new steady state, the glacier-wide mass budget gradually returns to zero (also Oerlemans, 2008). Following this principle, Charalampidis (2012) showed by utilizing a two-dimensional shallow-ice approximation model that the ice cap Langfjordjøkelen in northern Norway in 2008 would need about 300 years of substantial retreat and thinning to reach a steady state under a stable-climate assumption expressed by its 1989–2009 reference mass-budget profile. Climate variability on a simulated glacier surface can be replicated by altering the climate forcing, i.e., by perturbing a reference mass-budget profile with respect to the vertical (e.g., Charalampidis, 2012; Åkesson et al., 2017).
Ideally, ice-flow simulations reproduce the past, and forecast the future geometric adjustment of a glacier. A simulation of a glacier’s past in at least annual resolution, albeit calibrated on geometry observations such as glacier length and/or elevation, remains a hypothetical approximation. On the other hand, documented geometries in several years provide snapshots of a glacier’s actual geometric adjustment over time. Especially in the European Alps where observations are relatively abundant, glacier geometries are available since the mid-nineteenth century (Lambrecht and Kuhn, 2007; Abermann et al., 2009; Fischer et al., 2015), and in some cases there is even established annual monitoring (Klug et al., 2018). Applying reference mass-budget profiles on these snapshots results in glacier-wide mass budgets, which we shall henceforth dub reference-climate mass budgets.
A reference-climate mass budget a,ref is the glacier’s mass response in year a to the reference climate; it is essentially a measure of how far from a steady state the glacier geometry was in year a with respect to the reference climate, and is equal to:
where Sai is the glacier area at elevation interval i, na is the number of elevation intervals, and Sa is the total glacier area in the same year.
In year a, when the glacier’s geometry was documented, the reported annual mass budget a is conventional (Cogley et al., 2011) and equal to:
Differencing Equations 3 and 2 gives:
Equation 4 is an evaluation of the mass-budget anomalies with respect to the reference climate at discrete elevation intervals in year a, or the glacier’s mass response to the climatic anomaly that year (Figure 1B). In other words, expresses the glacier’s mass response relieved of the component related to the reference climate. The latter component experiences moderate interannual variations as a result of the observed glacier-geometry changes. The quantity, we shall henceforth dub geometric mass-budget anomaly. We note that is different thanΔa, which is equal to:
Equation 5 represents the anomaly of the annual glacier-wide mass budget with respect to the average in the reference period, i.e., the centered anomaly (cf. Vincent et al., 2017). The quantity is also different than mass-budget anomalies extracted with respect to multiannual moving-average filtering (e.g., Thibert et al., 2018, although their application concerned one point location on Sarennes Glacier).
Several reference-climate mass budgets of a glacier reveal in a discrete way its multidecadal geometric adjustment toward a steady state, albeit influenced by short-term (i.e., decadal) climate variability, and the subsequent impact on mass loss with respect to the reference climate. Reference-climate mass budgets in years without documented geometry can be approximated by the smooth (i.e., cubic-spline) interpolation of all known reference-climate mass budgets over the reference period, and constitute what we shall henceforth dub the glacier’s geometry signal with respect to the reference climate. Subsequently, the relative difference of the glacier’s mass-budget series with respect to the reconstructed geometry signal represents the geometric mass-budget anomalies.
As the geometry signal represents the mass response of a glacier’s surface due to the reference climate, the climate forcing on the glacier can be quantified by calculating in each year a the mass-budget residual Ra using the geometry signal as baseline:
Data Overview
Hintereisferner, Kesselwandferner and Vernagtferner drain in the same catchment area called Rofen Valley or Rofental (Strasser et al., 2018). Hintereisferner has northeasterly, Kesselwandferner has southeasterly, and Vernagtferner has southerly aspect (Figure 2). An approximately 7-km long glacier tongue stretching along a wide altitudinal range (2450–3750 m above sea level; a.s.l.) characterizes Hintereisferner. Vernagtferner has wide accumulation and ablation areas, and has surged several times in the past, for instance from 1843 to 1848 when it merged with the adjacent smaller Guslarferner and completely blocked Rofental in 1845 (Figure 2), and from 1897 to 1904 (Hoinkes, 1969; Nicolussi, 2013; Weber, 2013). In 2006, Hintereisferner was 7.40 km2, while Vernagtferner was 8.17 km2. Kesselwandferner is the smallest (3.85 km2 in 2006) and most dynamic of the three glaciers, with a relatively flat and wide accumulation area feeding a steep and narrow ablation area. Kesselwandferner was conjoined with Hintereisferner until the early twentieth century, when in 1912 the two glaciers detached (Fischer, 2010); they were briefly reunited in 1920 after a five-year advance (Kuhn et al., 1985; Leclercq et al., 2014). Kesselwandferner remained relatively stable in the second half of the 1960s; it advanced 241 m between 1971 and 1985, while it has been continuously retreating thereafter (Leclercq et al., 2014). Currently, all three glaciers hold the status reference glacier awarded by the World Glacier Monitoring Service (WGMS, 2017). The reference-glacier status implies among other conditions that “the glacier fluctuations are mainly driven by climatic factors” and are not “subject to major other influences such as avalanche, calving or surge dynamics, heavy debris cover, artificial snow production or ablation protection.”
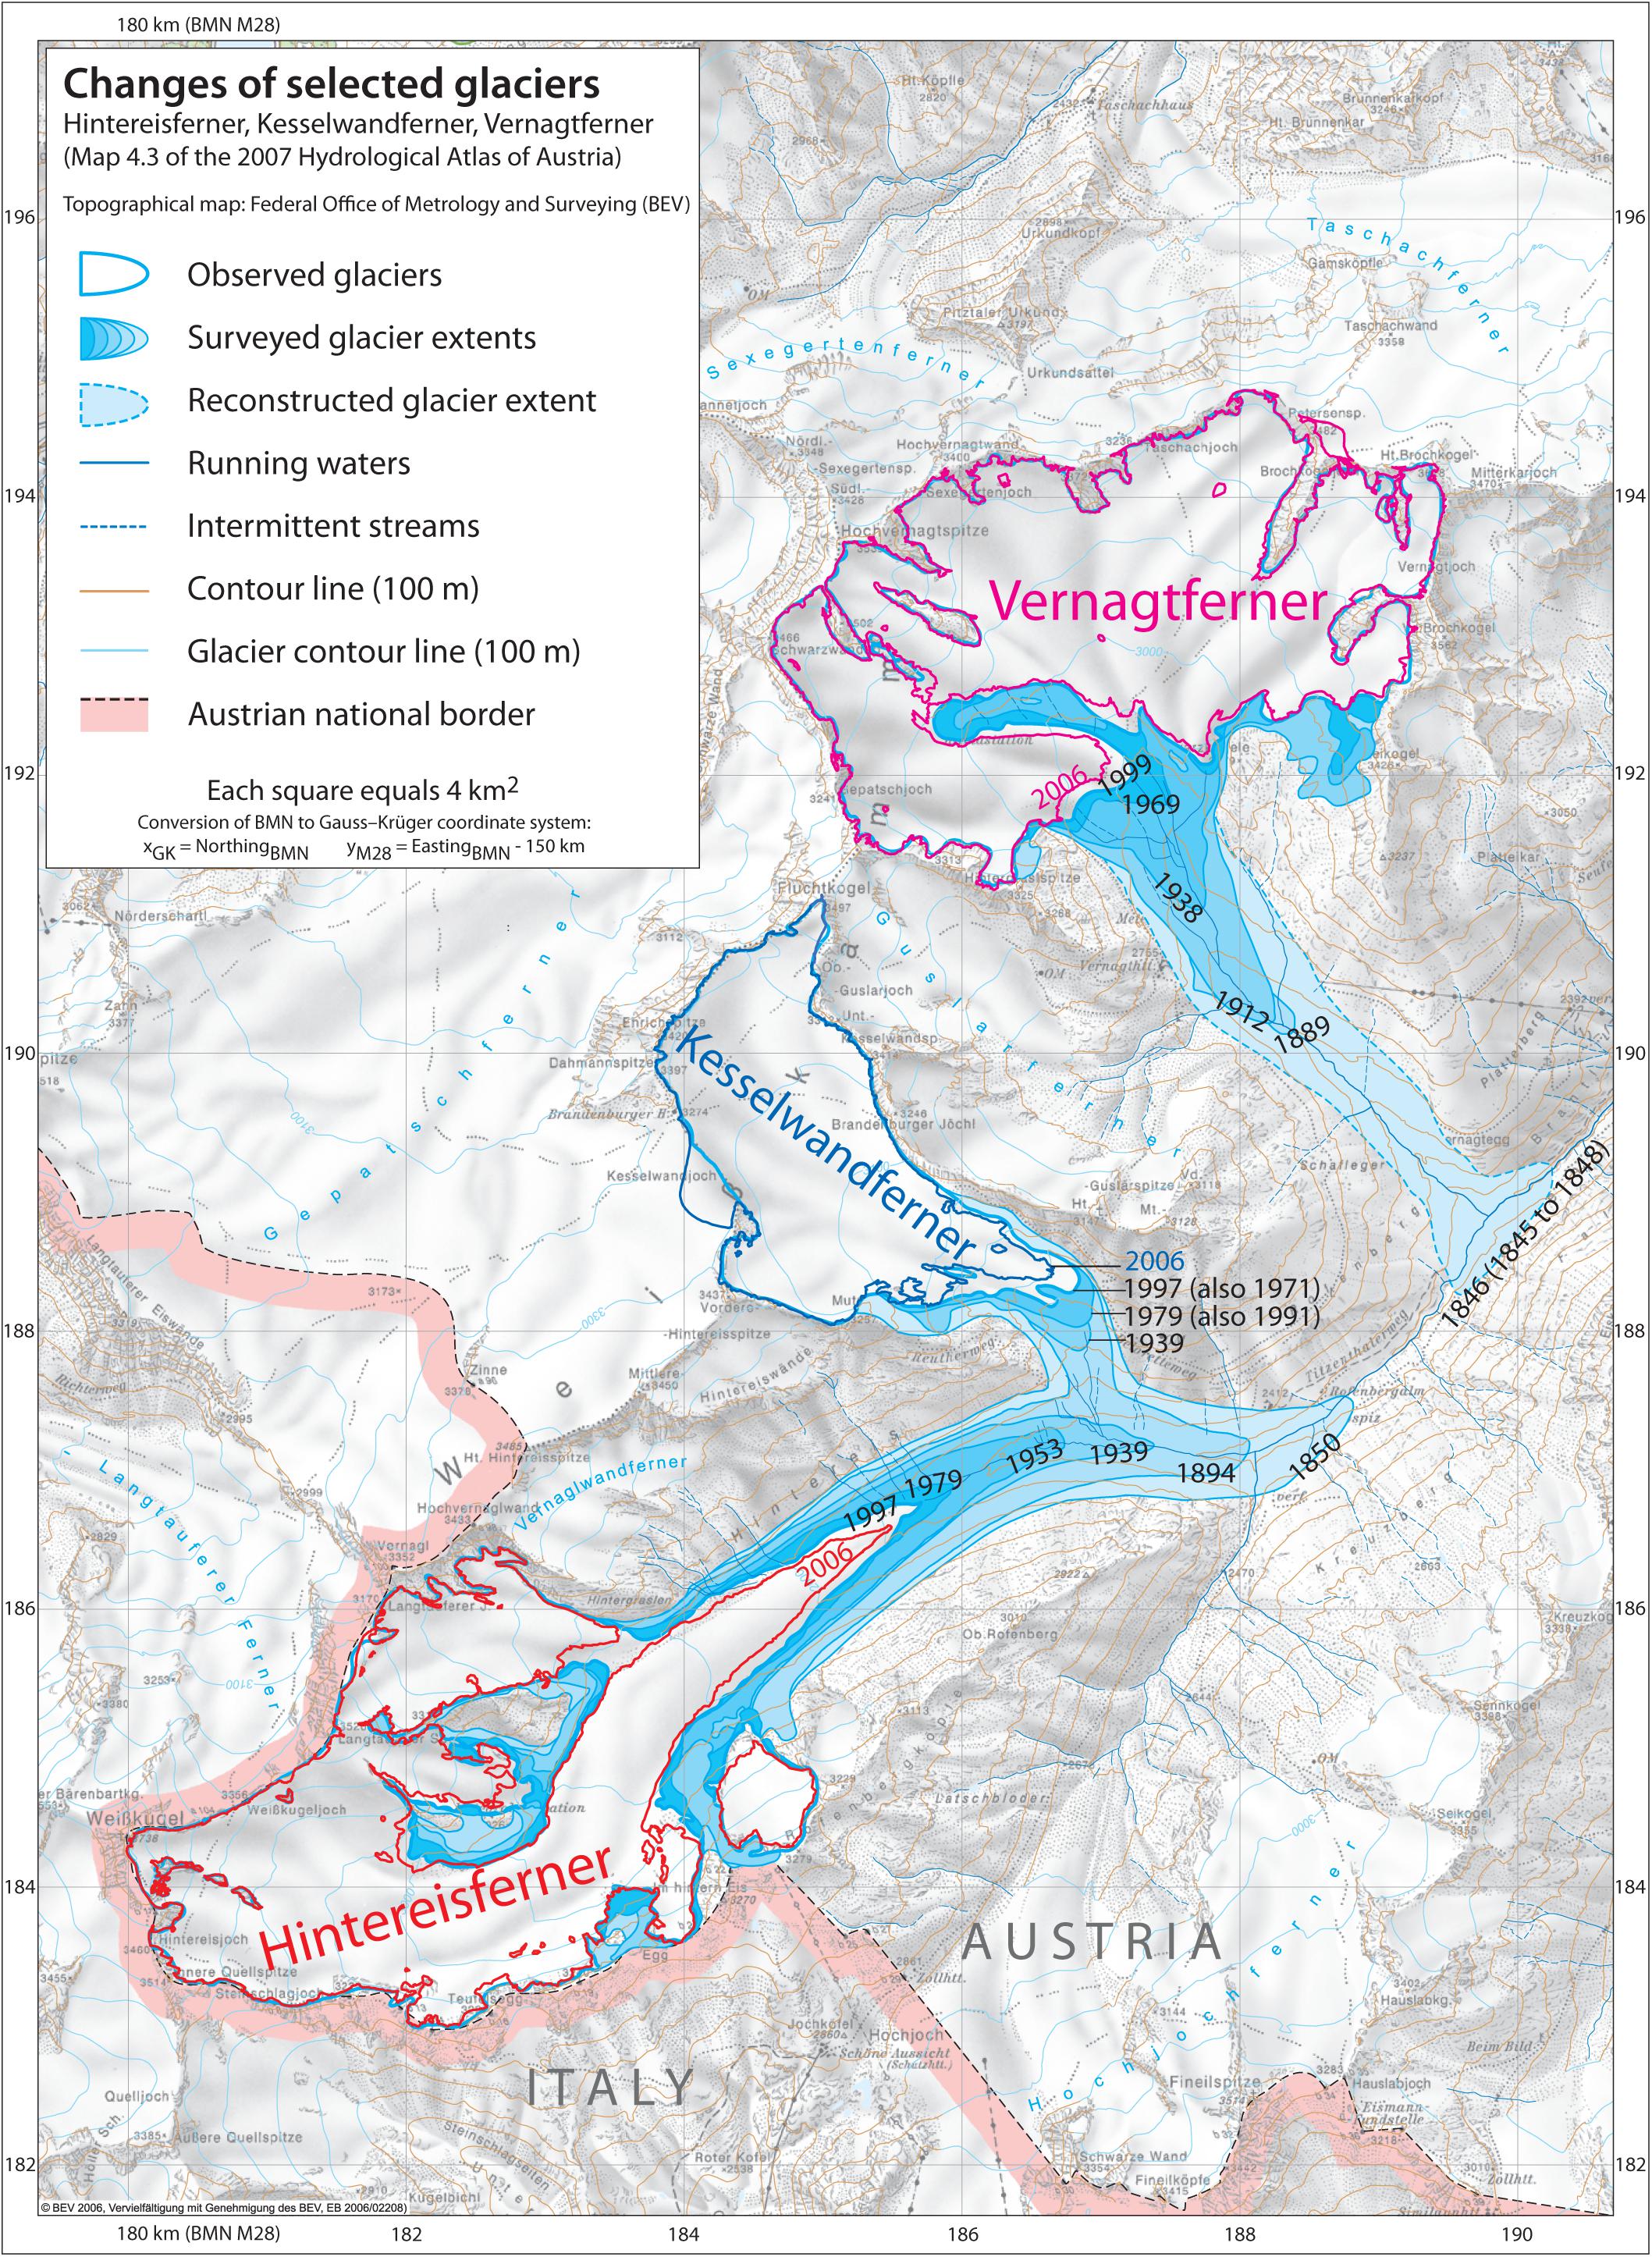
Figure 2. Hintereisferner, Kesselwandferner and Vernagtferner in the Ötztal Alps, Austria. All three glaciers drain into the Rofen Valley (Rofental).
The Institute of Atmospheric and Cryospheric Sciences (ACINN; formerly Institute of Meteorology and Geophysics) of the University of Innsbruck has been monitoring the annual mass budget of Hintereisferner and Kesselwandferner since 1952 (Hoinkes, 1970; Kuhn et al., 1999; Fischer and Markl, 2009). The Bavarian Academy of Sciences and Humanities (BAdW) has been responsible for Vernagtferner since 1964 (Reinwarth and Rentsch, 1994; Reinwarth and Escher-Vetter, 1999; Escher-Vetter et al., 2009). The determination of the annual mass budget of all three glaciers is based on the evaluation of stake readings, snow-pit observations and snow-cover maps deducted from photographic monitoring in a hydrological year between 1 October and 30 September. The annual glacier-wide product is based on altitudinally averaged mass budgets. Mass-budget variability within elevation bands is stable over long periods as it depends on geometric characteristics such as surface slope or glacier aspect that determine shading. Consequently, the altitudinal mass-budget gradients are characteristic for each glacier. All three mass budget series were reanalyzed according to Zemp et al. (2013). For further details, we refer to Fischer (2010), Mayer et al. (2013), and Zemp et al. (2013). We note that for all three glaciers basal melt is of minor importance (e.g., Haberkorn, 2011).
For all glaciers, the altitudinal profiles of annual specific mass budget are available at 50-m vertical resolution. We deducted reference mass-budget profiles, and hence reference ELAs, in the standard 30-year, 1981–2010 period (Hawkings and Sutton, 2016; Table 1). We also averaged over the 50-year, 1967–2016 period (Supplementary Table S1) resulting in less negative reference mass-budget profiles than the ones corresponding to 1981–2010. The 50-year analysis is presented only as supporting information (Supplementary Figures S1, S2 and Supplementary Tables S1, S2).
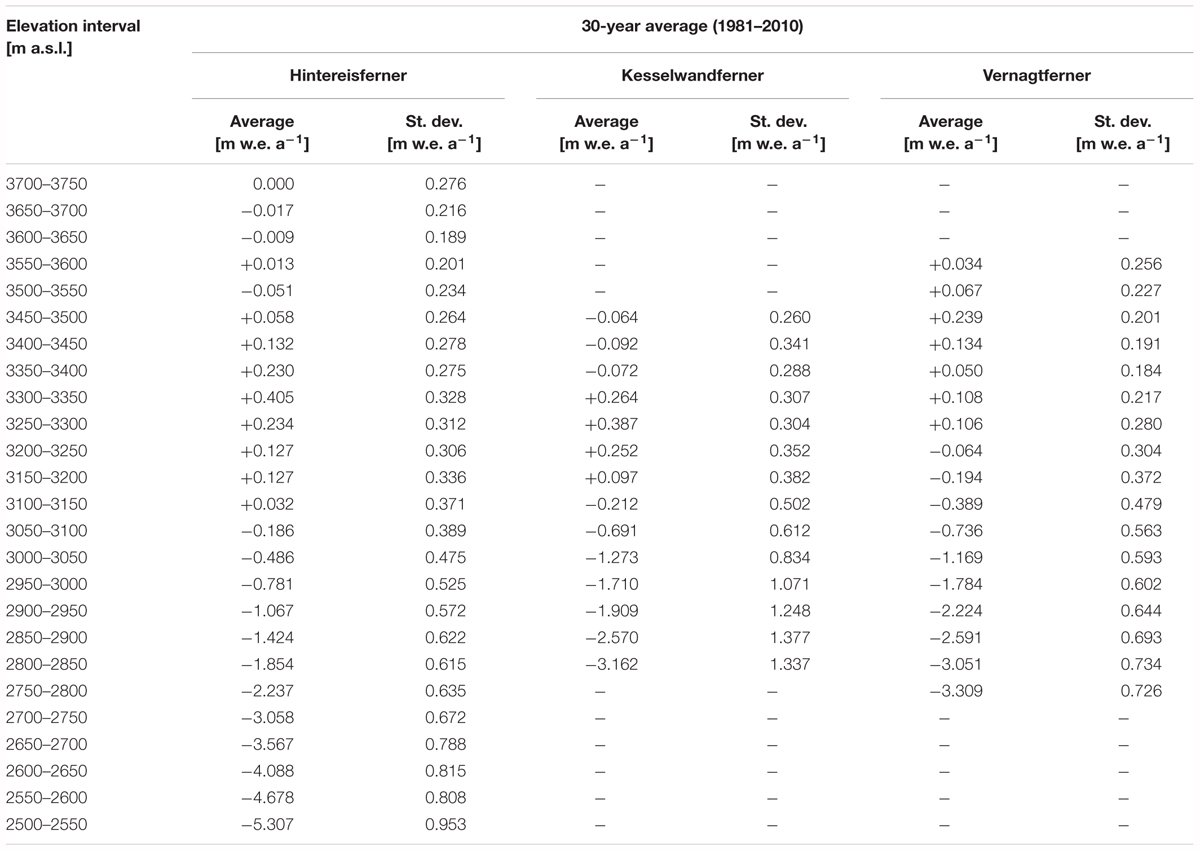
Table 1. Reference mass-budget profiles of Hintereisferner, Kesselwandferner and Vernagtferner, and their standard deviations in the standard 30-year, 1981–2010 period.
The lower part of each 1981–2010 reference mass-budget profile was extrapolated by linear regression to the lowest documented elevation interval of the respective glacier (Figure 3). Kesselwandferner had the smallest ablation area amongst the three glaciers, as these were defined by the reference mass-budget profiles; it spanned 7 elevation intervals (350 m elevation range; Table 1). Consequently, the linear regressions were based on the lowermost 350 m in each case (Table 2), and represented the reference mass-budget profiles well (R2≥ 0.99). Also, the two highest elevation intervals of Vernagtferner’s reference mass-budget profile were linearly extrapolated to 50 m higher, since the glacier has been as high as 3600–3650 m a.s.l. in the past, but has been thinning and becoming lower than these elevations over the last 30 years. At such high elevations, Vernagtferner’s reference mass budget is close to zero; hence, any uncertainty added by the short extrapolation is small. The linear nature of the fits was in accordance to well-known altitudinal gradients of climatic parameters, such as air temperature and humidity, influencing the energy balance and melt on a glacier surface (Hock, 2005). With the help of these approximations, we applied the three reference mass-budget profiles on the documented geometries of the respective glaciers (Table 3).
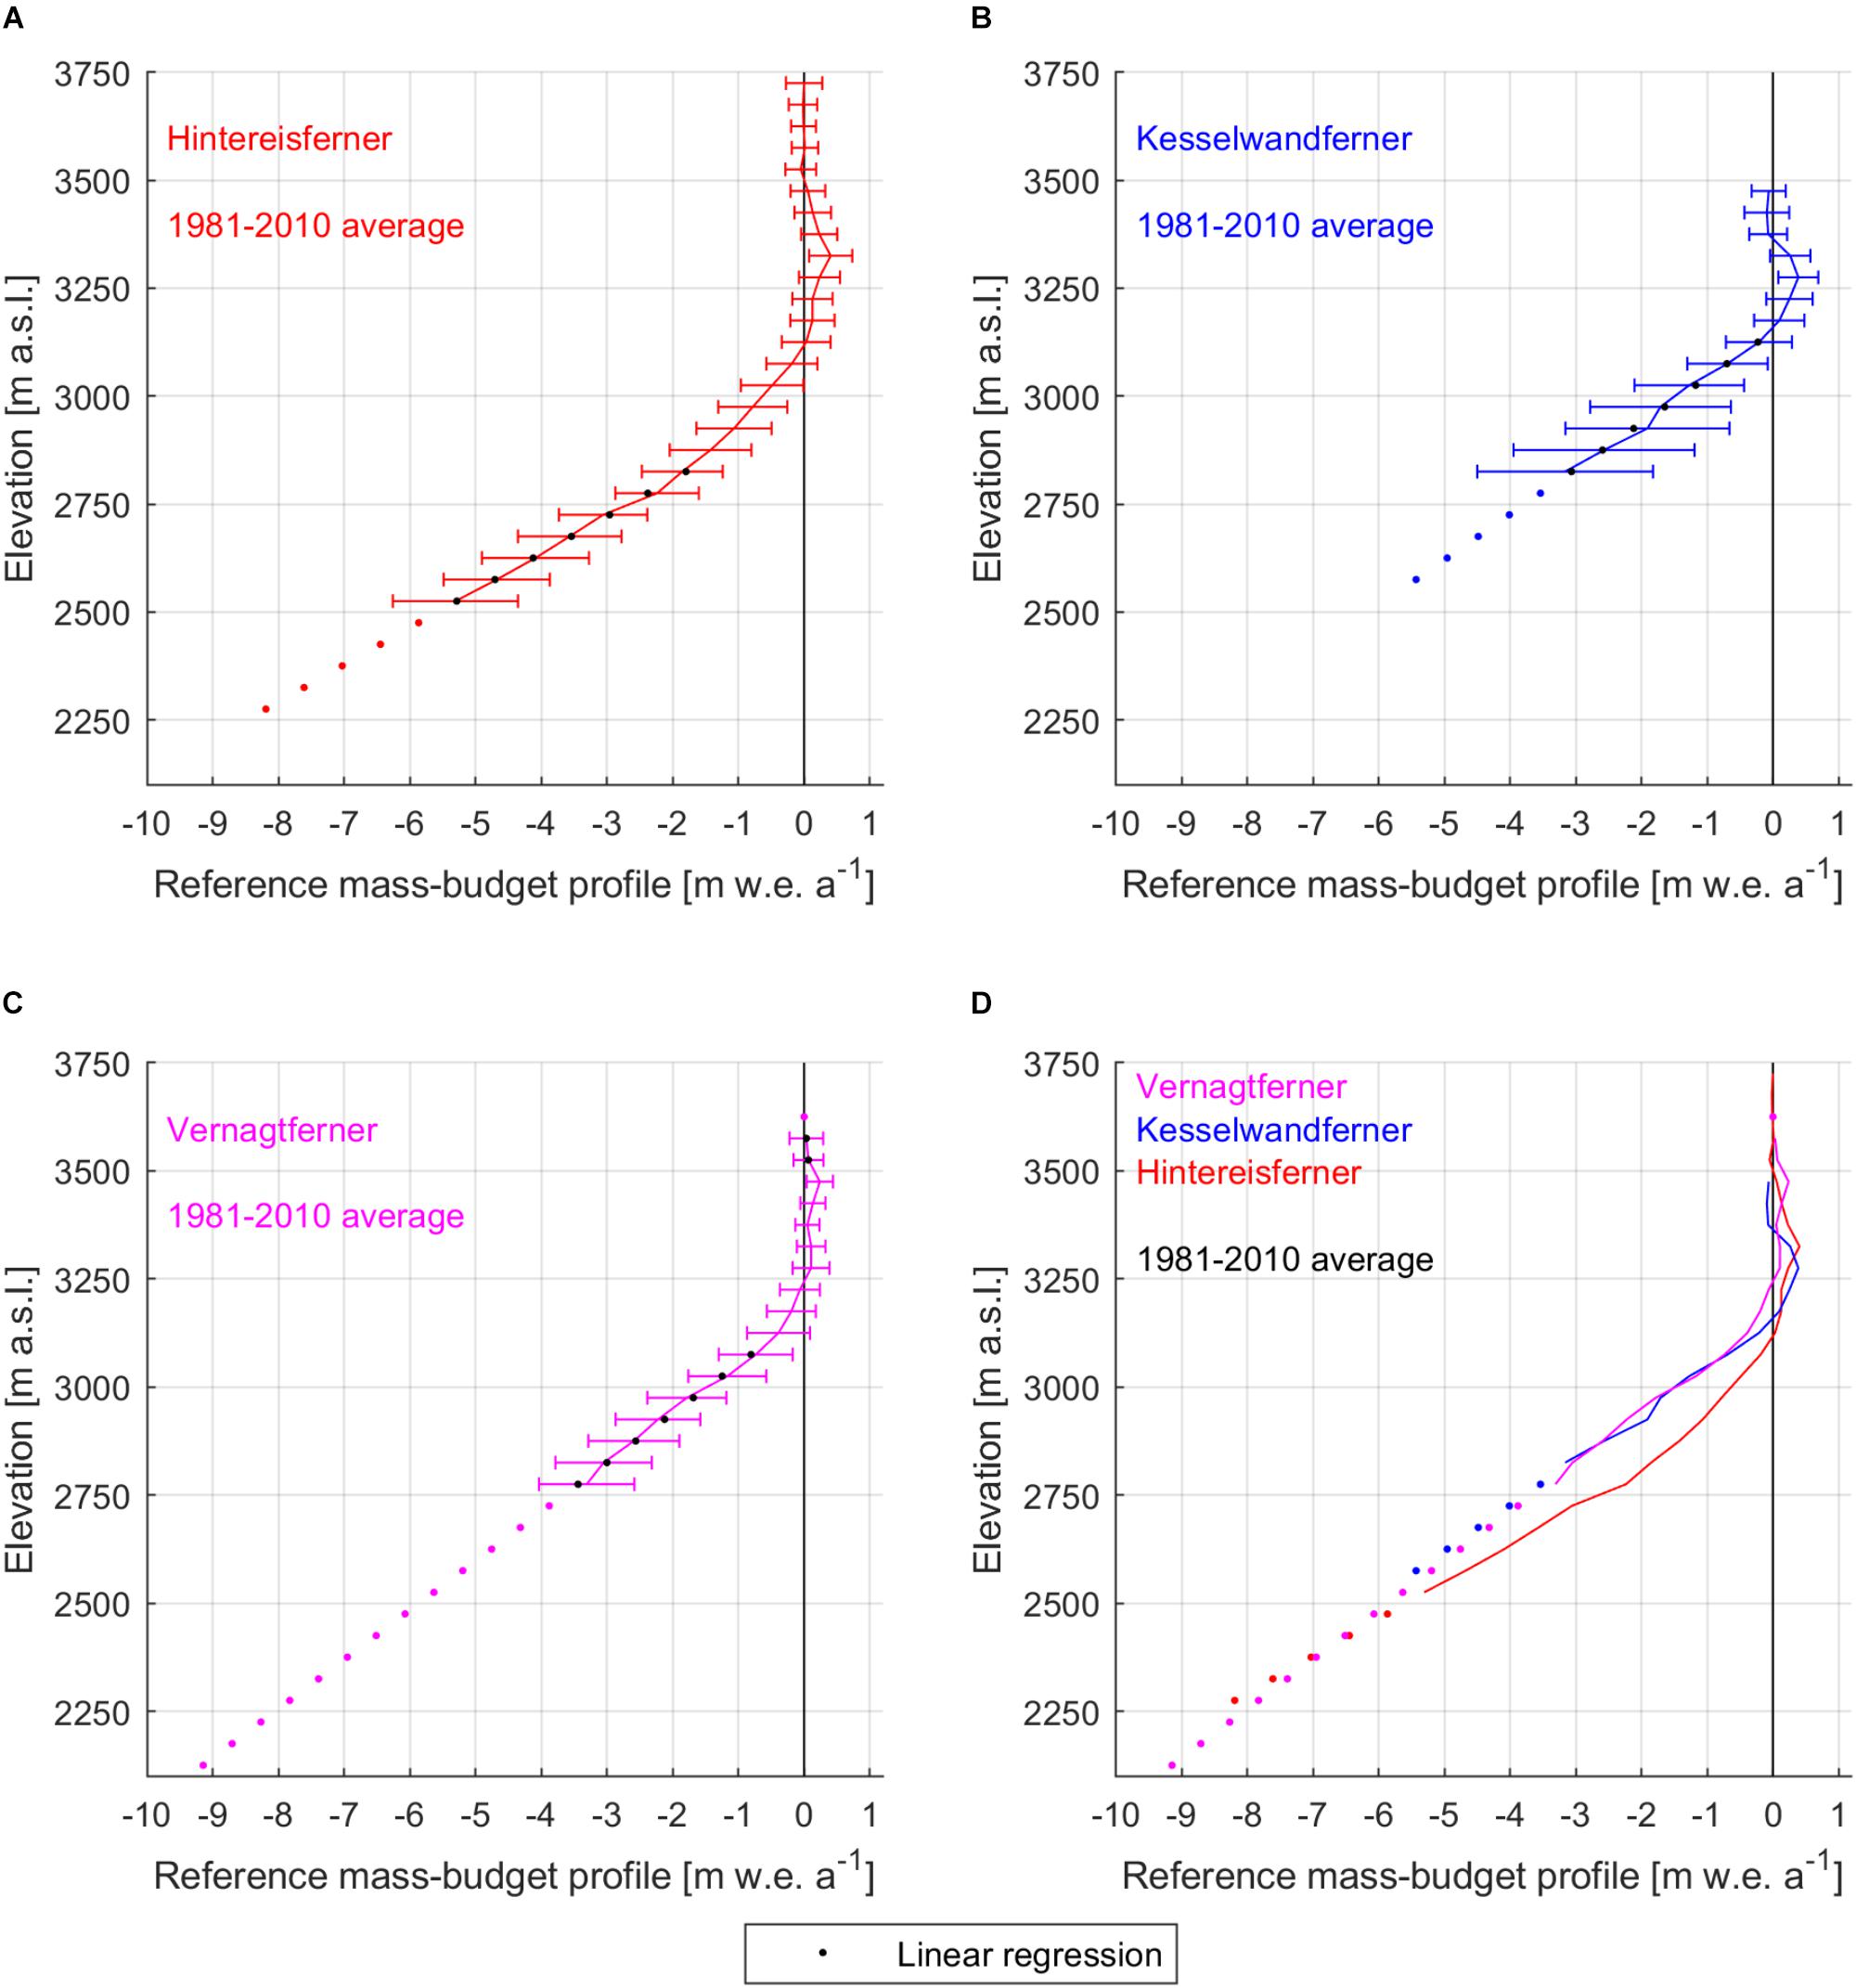
Figure 3. Reference mass-budget profiles of (A) Hintereisferner, (B) Kesselwandferner and (C) Vernagtferner, and their approximations in the standard 30-year, 1981–2010 period. Error bars indicate two standard deviations. (D) Comparison of the 1981–2010 reference mass-budget profiles of all three glaciers.
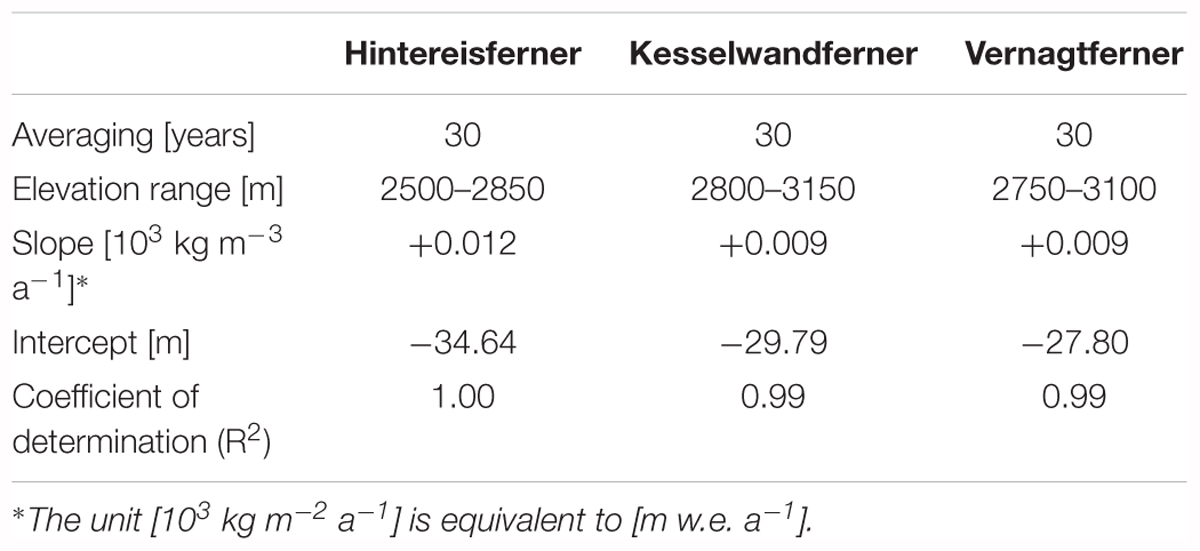
Table 2. Linear regression parameters based on certain elevation ranges below the equilibrium line for the 1981–2010 reference mass-budget profiles of Hintereisferner, Kesselwandferner and Vernagtferner: slope, intercept, and coefficient of determination (R2).
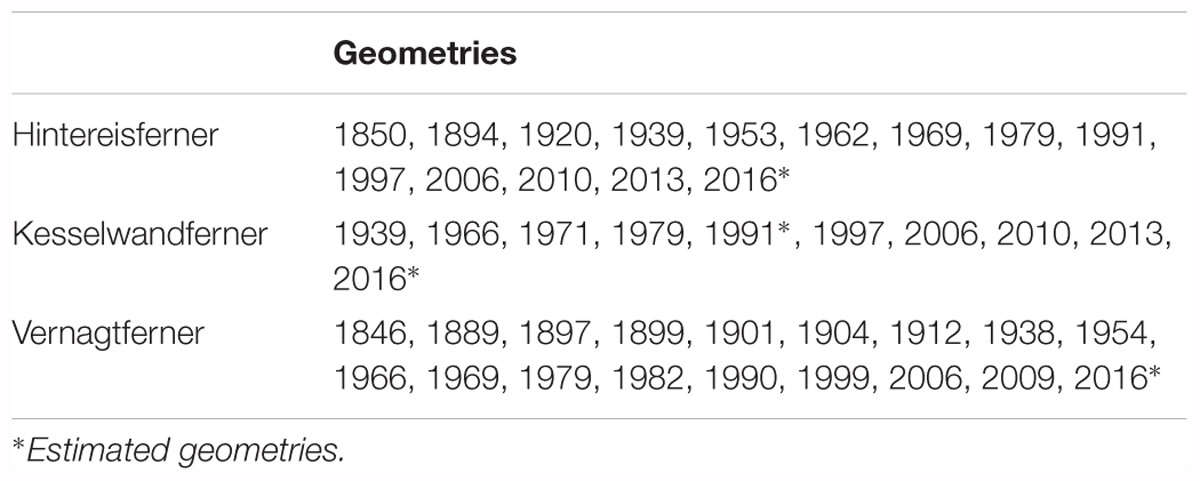
Table 3. Utilized documented geometries of Hintereisferner, Kesselwandferner and Vernagtferner.
Results
Reference Mass-Budget Profiles
The 1981–2010 reference mass-budget profiles of the three glaciers had notable similarities as well as differences (Figure 3 and Table 1). Kesselwandferner and Vernagtferner were similar between 2800 and 3100 m a.s.l., with differences less than 0.12 m w.e. a-1 per elevation interval, except at 2900–2950 m a.s.l. where the difference was 0.32 m w.e. a-1 with Kesselwandferner being more positive. In the same elevation range, Hintereisferner was less negative by 0.53 m w.e. a-1 at 3050–3100 m a.s.l. to 1.25 m w.e. a-1 at 2800–2850 m a.s.l. than the average of the other two glaciers. The reference ELA of Vernagtferner was 3250 m a.s.l.; the reference ELAs of Kesselwandferner and Hintereisferner were, respectively, 100 and 150 m lower. In the accumulation area, the mass-budget maximum of Hintereisferner was +0.41 m w.e. a-1 at 3300–3350 m a.s.l. Similarly, the mass-budget maximum of Kesselwandferner was +0.39 m w.e. a-1 at 3250–3300 m a.s.l. At these elevations, Vernagtferner was not as positive (+0.11 m w.e. a-1), while its mass-budget maximum was +0.24 m w.e. a-1 at 3450–3500 m a.s.l. For all three glaciers, the mass-budget standard deviations above 3150 m a.s.l. were smaller than 0.40 m w.e. a-1. The variability increased similarly for all three glaciers with decreasing elevation until 3050 m a.s.l. Below 3050 m a.s.l., Kesselwandferner’s mass budget distinctly stood out as the more variable one, while below 3000 m a.s.l. its mass-budget standard deviations were about double the average of the other two glaciers (greater by 90–109%), ranging between 1.07 and 1.38 m w.e. a-1.
Centered vs. Geometric Mass-Budget Anomalies
Between 1981 and 2010, Kesselwandferner was consistently the least negative amongst the three glaciers with -0.27 m w.e. a-1 average mass budget, while Vernagtferner and Hintereisferner were, respectively, about twice and three times as negative (-0.60 and -0.87 m w.e. a-1; Figures 4A,B). The agreement amongst the conventional mass-budget series (correlation coefficients R between 0.83 and 0.91) is more evident in the comparison of the centered anomalies (Figures 4C,D). The average centered mass-budget anomaly in the 1980s (1981–1990) was +0.168 m w.e. a-1, while in the 1990s (1991–2000) it was +0.004 m w.e. a-1 (a 98% decrease with respect to 1980s). On the contrary, the 2000s (2001–2010) had strongly negative average centered mass-budget anomaly (-0.172 m w.e. a-1).
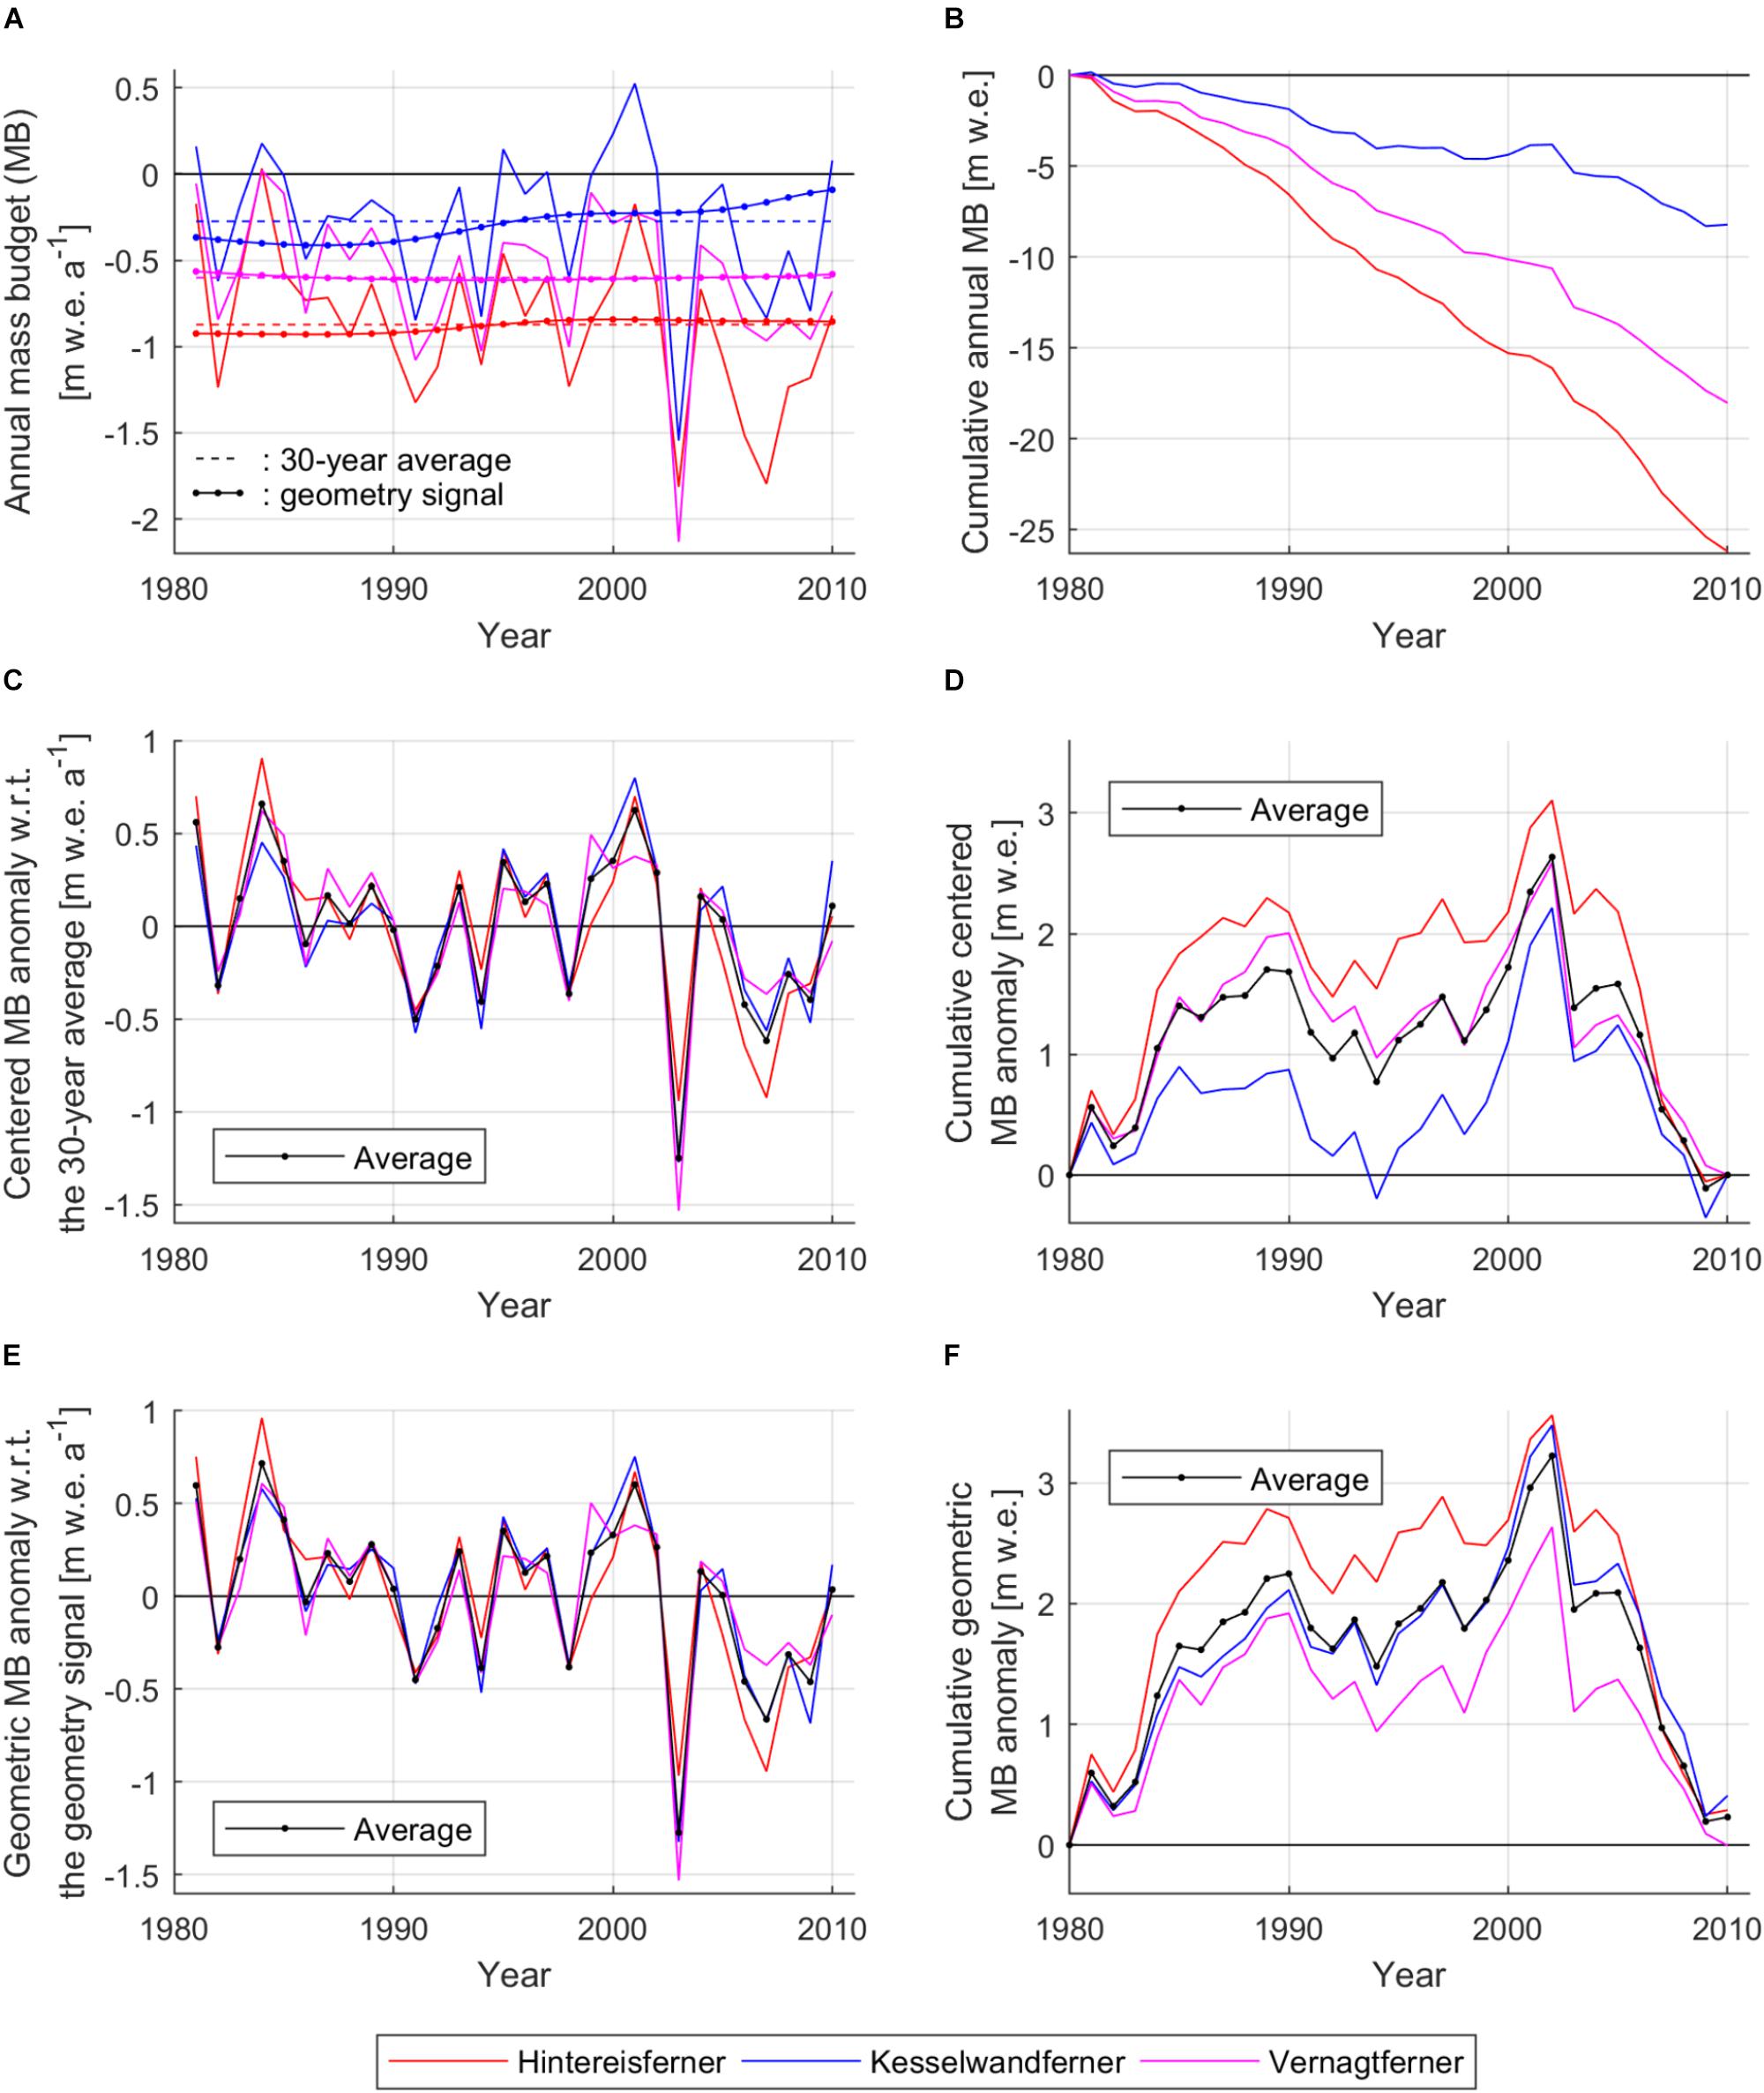
Figure 4. (A) Mass-budgets of Hintereisferner, Kesselwandferner and Vernagtferner (Fischer et al., 2013, 2014; Mayer et al., 2013) in the period 1981–2010 (correlation coefficients: RHF-KF = 0.86; RHF-V F = 0.83; RKF-V F = 0.91), their 30-year averages (MHF = –0.87 m w.e. a-1; MKF = –0.27 m w.e. a-1; MV F = –0.60 m w.e. a-1), and the geometry signals of the glaciers with respect to the same period. The averages of the geometry signals are: MHFs = –0.88 m w.e. a-1; MKFs = –0.29 m w.e. a-1; MV Fs = –0.60 m w.e. a-1. (B) Cumulative mass budgets of the three glaciers. (C) Centered mass-budget anomalies with respect to (w.r.t.) the 30-year average. The average decline over the 30-year period is –15.5⋅10-3 m w.e. a-2. (D) Cumulative centered mass-budget anomalies w.r.t. the 30-year average. (E) Geometric mass-budget anomalies w.r.t. the corresponding geometry signals (correlation coefficients: RHF-KF = 0.90; RHF-V F = 0.83; RKF-V F = 0.93). The average decline over the 30-year period is –20.3⋅10-3 m w.e. a-2. (F) Cumulative geometric mass-budget anomalies w.r.t. the corresponding geometry signals.
The geometry signals derived from the application of the reference mass-budget profiles on documented glacier geometries within the reference period (Table 3) are presented in Figure 4A (also Supplementary Table S3). The geometric mass-budget anomalies with respect to these signals are presented in Figures 4E,F. Contrary to the centered mass-budget anomalies (Figure 4C), the averages of the geometric mass-budget anomalies are not equal to zero (+0.010, +0.014 and -0.2⋅10-3 m w.e. a-1 for Hintereisferner, Kesselwandferner and Vernagtferner, respectively) because the geometry signals are nonlinear, with 1981–2010 averages not necessarily equal to the 1981–2010 average mass budgets. The average geometric mass-budget anomaly was +0.225 m w.e. a-1 in the 1980s, and +0.011 m w.e. a-1 in the 1990s (34 and 196% more positive than the respective average centered anomalies). The average geometric mass-budget anomaly in the 2000s was -0.213 m w.e. a-1, 24% more negative compared to the average centered mass-budget anomaly.
The Root-Mean-Square Deviations of the geometric mass-budget anomalies from their average in Figure 4E were 0.14, 0.09 and 0.13 m w.e. a-1 for Hintereisferner, Kesselwandferner and Vernagtferner, respectively. The application of simple linear regressions on the average curves of both the geometric and centered mass-budget anomalies in Figures 4E,C, respectively, quantified the difference between the two cases. Over the 1981–2010 period, the geometric mass-budget anomalies decreased by 20.3⋅10-3 m w.e. a-2 (Figure 4E), which is 31% more than the estimate derived from the centered mass-budget anomalies (i.e.,-15.5⋅10-3 m w.e. a-2; Figure 4C). We stress that these linear regressions represent the means of comparison of the two cases, and should not be considered as climatic trends.
Glacier Geometry and Climate Forcing
The glacier-specific climate forcings during 1981–2010 are shown in Figure 5, where positive mass-budget residuals imply enhanced mass loss, and negative mass-budget residuals imply reduced mass loss or mass gain (see Equation 6; cf. Huss et al., 2012). Climate variability impacted all three glaciers in a consistent way throughout the three decades. In all thirty years, the climate forcing on Vernagtferner (Hintereisferner) was within -104 and +76 (+114)% of the geometry signal. An exception occurred only in the extreme-melt year of 2003 (Fink et al., 2004) when the climate forcing on Vernagtferner was 254% of the geometry signal.
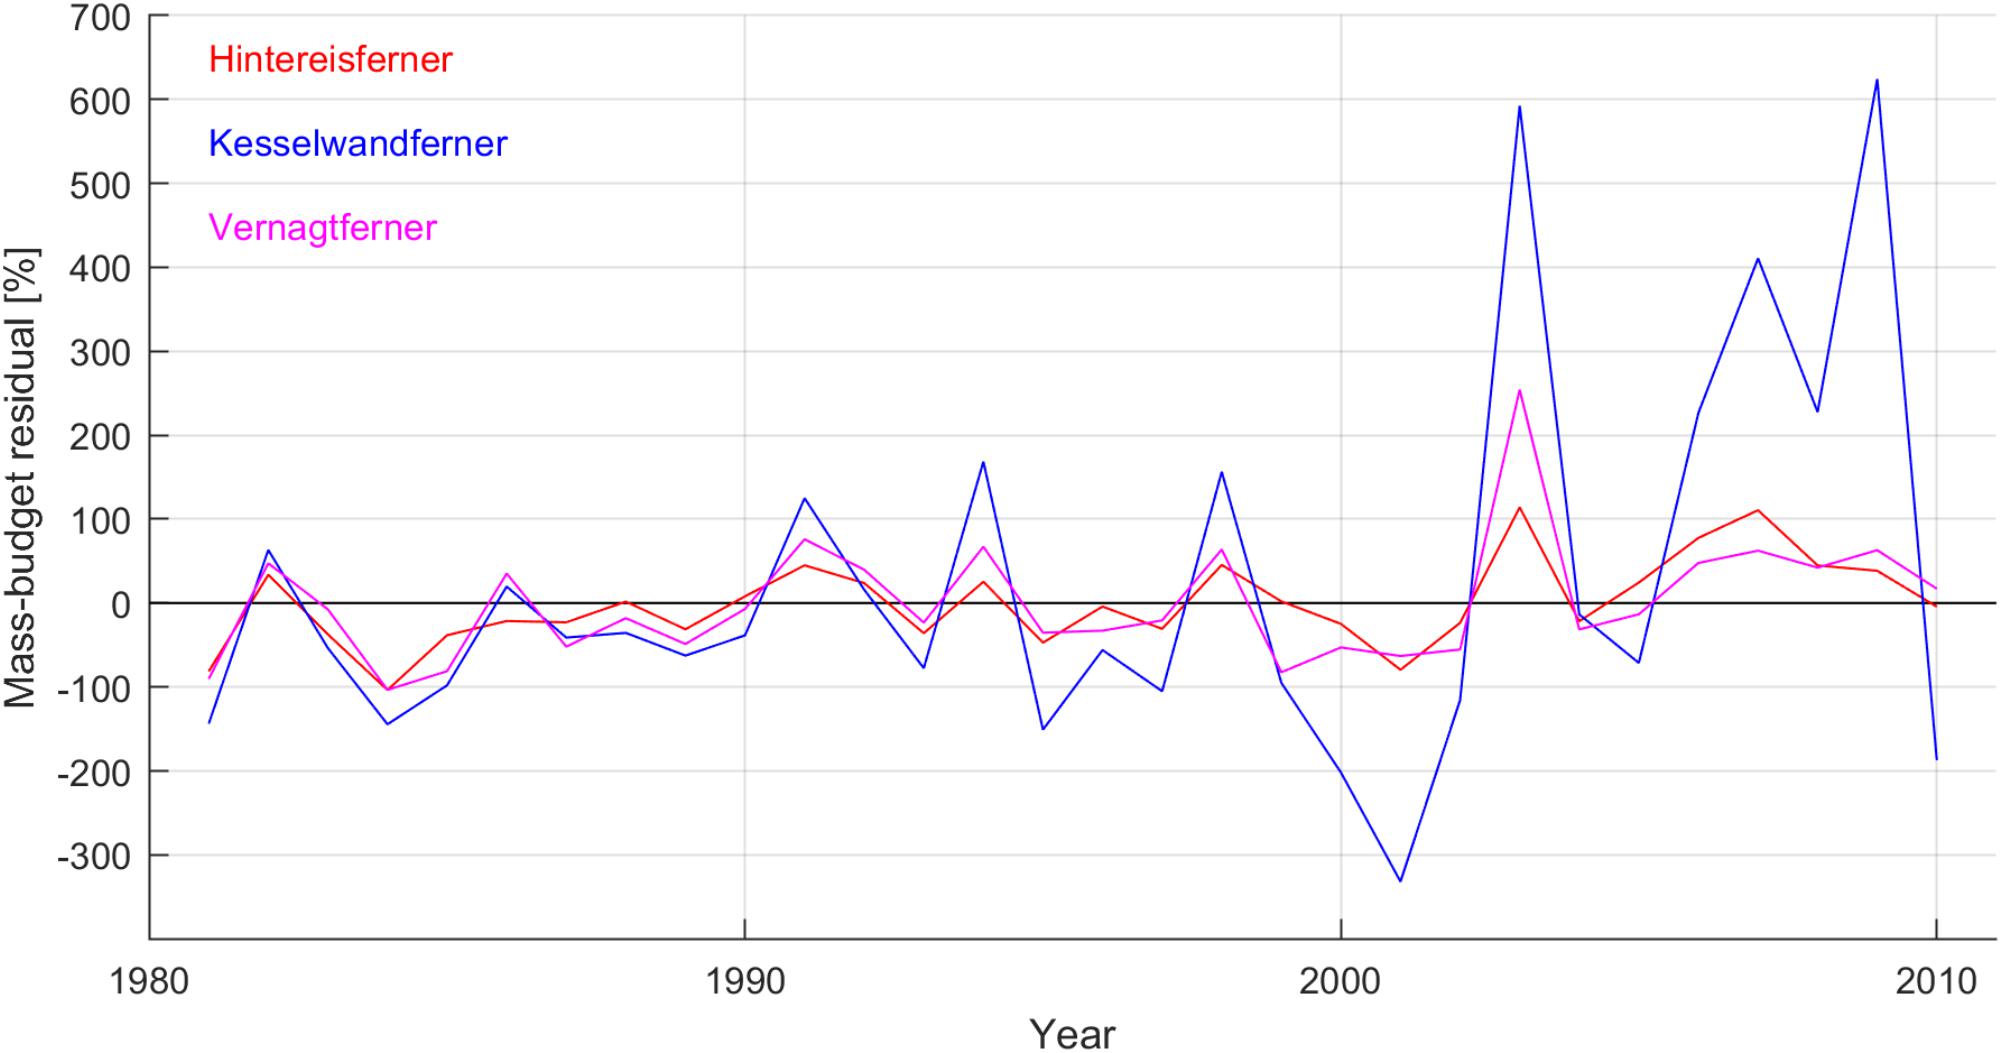
Figure 5. Mass-budget residuals using the geometry signals of Hintereisferner, Kesselwandferner and Vernagtferner as baseline. The mass-budget residuals represent the glacier-specific climate forcings in the years 1981–2010.
The effect of interannual climate variability was generally more pronounced on Kesselwandferner than on the other two glaciers. Especially between 2000 and 2010, the climate forcing on Kesselwandferner became substantially more pronounced than in the years before, while it was more than double the geometry signal in seven out of the eleven years. The pronounced climate forcing on Kesselwandferner after the year 2000 was due to its small geometry explaining less than 0.23 m w.e. a-1 mass loss in response to the reference climate (i.e., geometry signal less negative than -0.23 m w.e. a-1), and strongly negative annual mass budgets (Figure 4A).
Changing Glacier Geometries and Mass Fluxes
The geometry change of a glacier determines the area distribution of ablation and accumulation, and therefore the mass gain and loss at the glacier surface. Setting glacier geometries from different years against a reference climate reveals the alteration of the glacier’s mass fluxes due to its adapting geometry. The calculation of reference-climate mass-budgets at discrete elevation intervals of all three glaciers in specific years occurs by multiplying their elevation–area distributions in those years with the 1981–2010 reference mass-budget profiles, according to:
The geometries of all three glaciers were documented in 1979, before the beginning, and in 2006, before the end of the 1981–2010 reference period (Figures 6A,B). In the case of the 1979 geometries, the accumulation-area totals of Hintereisferner and Kesselwandferner defined by the reference ELAs were +0.559 and +0.610 Megatonne (Mt) a-1, respectively, despite their very different sizes. We note that 1 Mt equals 106 m3 of water or 0.28 m elevation change over 4 km2 uniform glacier-surface area (cf. Figure 2) assuming water and glacier-ice densities equal to 1000 and 900 kg m-3, respectively. Vernagtferner’s accumulation-area total was less than half that of Hintereisferner (0.270 Mt a-1). On the other hand, despite its larger ablation area (7.10 km2) and increased ablation per unit area below 3100 m a.s.l. (Figure 3D), Vernagtferner’s ablation-area total amounted to 62% (-5.540 Mt a-1) that of Hintereisferner, whose smaller ablation area (5.43 km2) extended by 350 m to lower and hence warmer elevations. Kesselwandferner’s ablation-area total was the smallest and equal to 2.105 Mt a-1 from its 1.72 km2 ablation area.
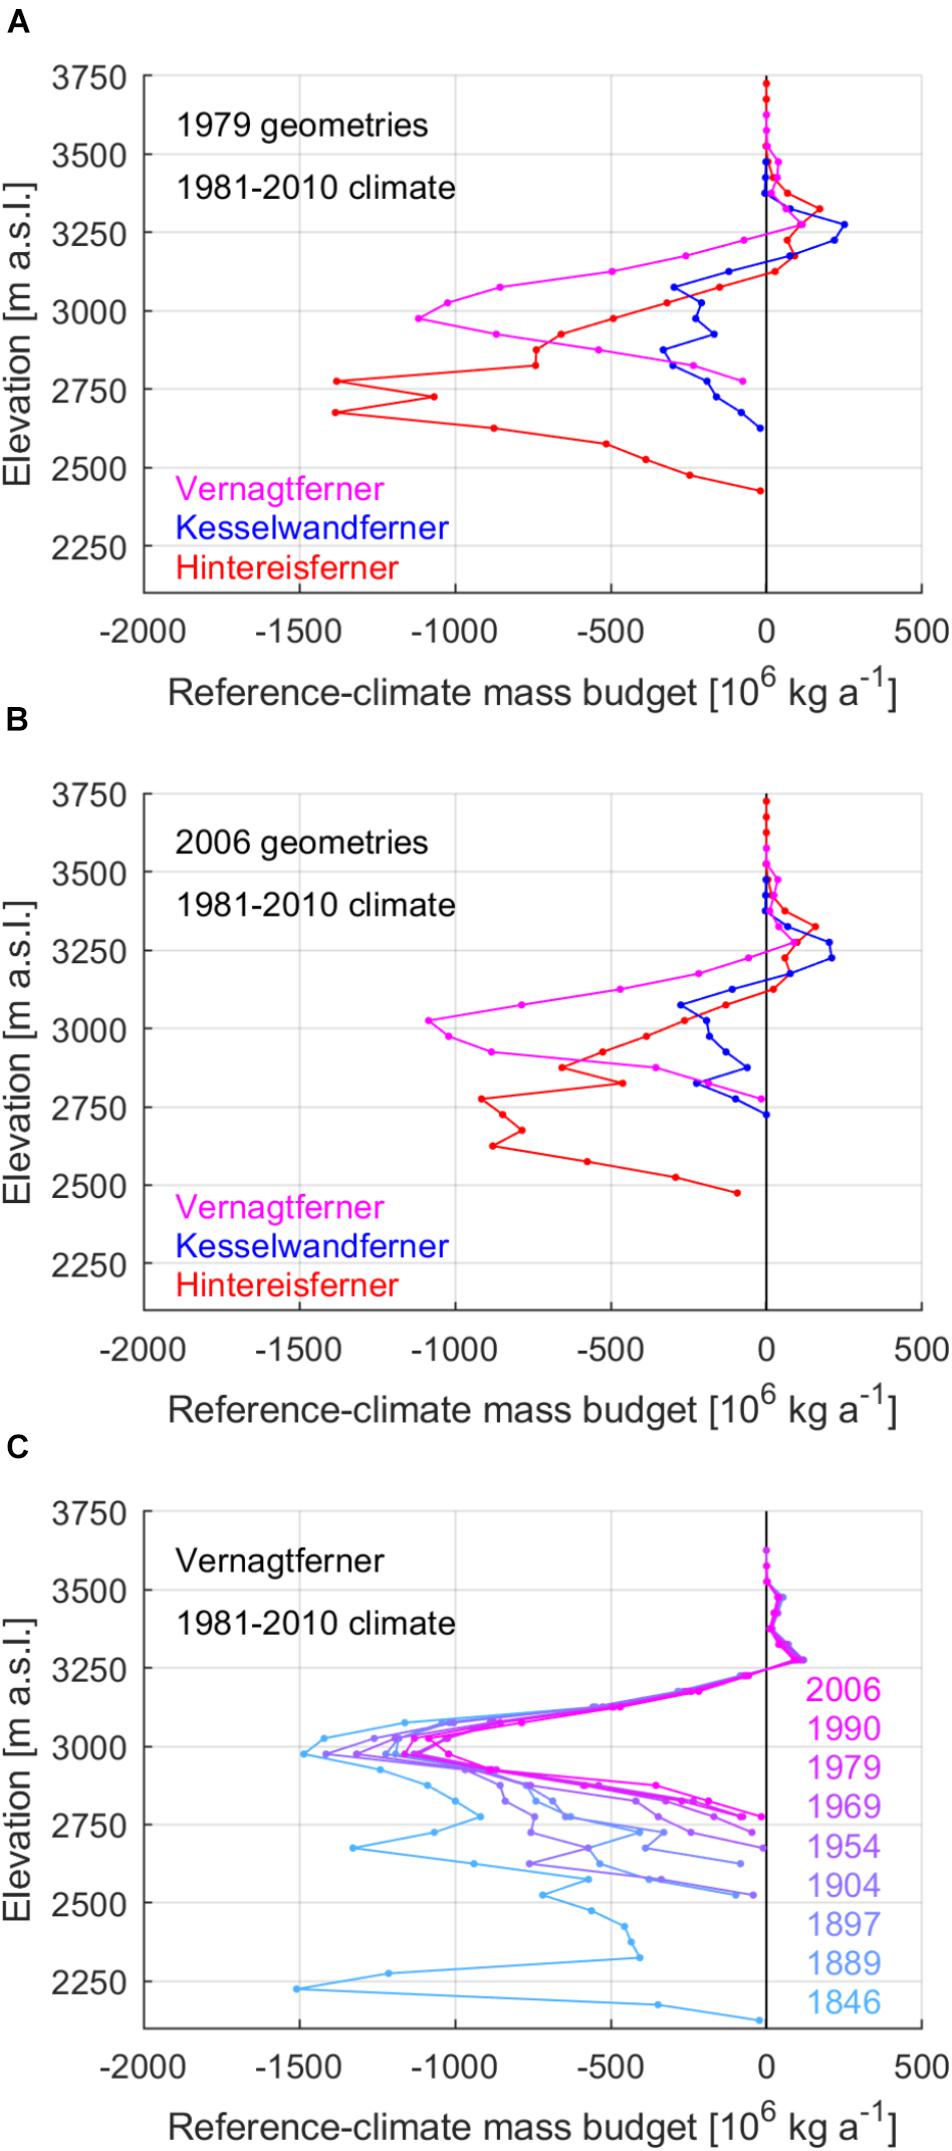
Figure 6. Reference-climate mass budgets at discrete elevation intervals of Hintereisferner, Kesselwandferner and Vernagtferner in (A) 1979 and (B) 2006 with respect to 1981–2010. (C) Several reference-climate mass budgets at discrete elevation intervals of Vernagtferner since the mid-nineteenth century with respect to 1981–2010.
In the case of the 2006 geometries, all glacier areas defined by the reference ELAs were reduced by less than 1 km2 compared to 1979, except for the ablation area of Hintereisferner (-1.18 km2) as a result of substantial retreat by 421 m (Leclercq et al., 2014). The accumulation-area totals of all glaciers were reduced by 0.068 Mt a-1 or less between 1979 and 2006. The ablation-area totals of Hintereisferner and Kesselwandferner were reduced by 24% (-2.166 Mt a-1) and 39% (-0.830 Mt a-1), respectively. We stress that these differences between 1979 and 2006 were only due to geometry changes under our stable-climate hypothesis, and not due to actual physical processes such as firnline migration.
Discussion
Recent Changes
Due to the close proximity of the three glaciers to one another, the influence of local climate on their mass budget is similar, implying that the differences amongst the 1981–2010 reference mass-budget profiles (Figure 3) are due to the glaciers’ different aspects, and geometries (Figure 2). For example, Hintereisferner’s reduced mass loss per unit area below 3100 m a.s.l. is due to its northeasterly aspect, and hence reduced solar radiation on its surface (Van de Wal et al., 1992) compared to the other two glaciers. Another example is the reduced mass budget at the higher parts of Vernagtferner compared to the other two glaciers due to its southerly aspect, and hence longer exposure to solar radiation and prolonged daily surface melt. The decreased mass-budget variability in the high areas of all three glaciers (Figure 3 and Table 1) suggests that interannual climate fluctuations and long-term trends affected mostly their ablation areas. This is because mass changes of glaciers in the European Alps are mostly driven by surface-melt – and not accumulation – variability (cf. Medwedeff and Roe, 2017). The implication is that any climatic signatures on the evolution of Alpine glaciers should be mostly contained in documented mass changes of their ablation areas. This is in agreement with the interpretation of ablation-area point mass budgets in the European Alps by Vincent et al. (2017). We note that should the observed firn depletion and disturbance of the altitudinal mass-budget gradients of the three glaciers during extreme-melt years since 2000 become more frequent, it will fundamentally alter the above norm.
A reference ELA can be used to define reference-climate Accumulation-Area Ratios (AARs; reference-climate ratios of the accumulation area to the total area of a glacier). The comparison of the 1979 and 2006 reference-climate AARs reveals the nature of the recent geometric evolution of the glaciers. The 1979 reference-climate AAR is below half for the two larger glaciers (0.40 for Hintereisferner and 0.26 for Vernagtferner), while it is 0.61 for Kesselwandferner. The 2006 reference-climate AARs of Hintereisferner and Kesselwandferner are slightly increased (0.43 and 0.65, respectively) compared to 1979, as the reduction of their ablation areas defined by the reference ELA (-1.18 and -0.36 km2, respectively) is at least 71% greater than the reductions of their accumulation areas (-0.50 and -0.21 km2, respectively). In the case of Vernagtferner, the -0.68 km2 reduction of the accumulation area as defined by the reference ELA between 1979 and 2006 is comparable to the corresponding reduction of the ablation area (-0.70 km2), and results in lower reference-climate AAR (0.22). The lower reference-climate AAR of Vernagtferner implies a reduced accumulation-area total by 25% (-0.068 Mt a-1), while the ablation-area total of the glacier is reduced only by 8% (-0.463 Mt a-1). Expanding the comparison to several of Vernagtferner’s geometries (Figure 6C) shows more clearly that the glacier’s geometry since 1979 has been favoring stable mass loss from its wide ablation area. At the same time, the limited mass gain at the highest parts of Vernagtferner has been reducing due to the reducing accumulation area. An interesting comparison of these more recent geometries of Vernagtferner with geometries from further back in time shows increased mass loss after surging events such as in 1846 or 1904; the sudden advances to lower and warmer elevations increased each time Vernagtferner’s climate sensitivity. After each surging event, the glacier tongue experienced enhanced surface melt and rapid geometric adjustment (i.e., retreat), while the accumulation area was mechanically reduced; hence, the surging events of Vernagtferner were the cause of early extensive mass losses.
Geometry Signals and Reference Period
Performing the same methodology while using the less negative 50-year (1967–2016) reference mass-budget profiles (Supplementary Figure S1 and Supplementary Table S1) results in less negative reference-climate mass budgets; the three glaciers are closer to steady states with respect to the 1967–2016 rather than the 1981–2010 average climate (Figure 7). In particular, Kesselwandferner in the 50-year analysis has been nearly at steady state in 2009 and 2010 with geometry signal between -0.01 and +0.01 m w.e. a-1. Even though the magnitude of the reference-climate mass budgets is dependent on the reference period, the geometry signal is mostly uninfluenced (Figure 7). This is because neither the glacier geometries and surface properties nor the surrounding terrain changed enough between the two periods as to alter the gradients of the reference mass-budget profiles. The associated uncertainty in the reported 1981–2010 mass-budget trend is of the order of 10-4 m w.e. a-2 (i.e., over the 1981–2010 period, the geometric mass-budget anomalies decreased by 20.9⋅10-3 m w.e. a-2, according to the 50-year analysis).
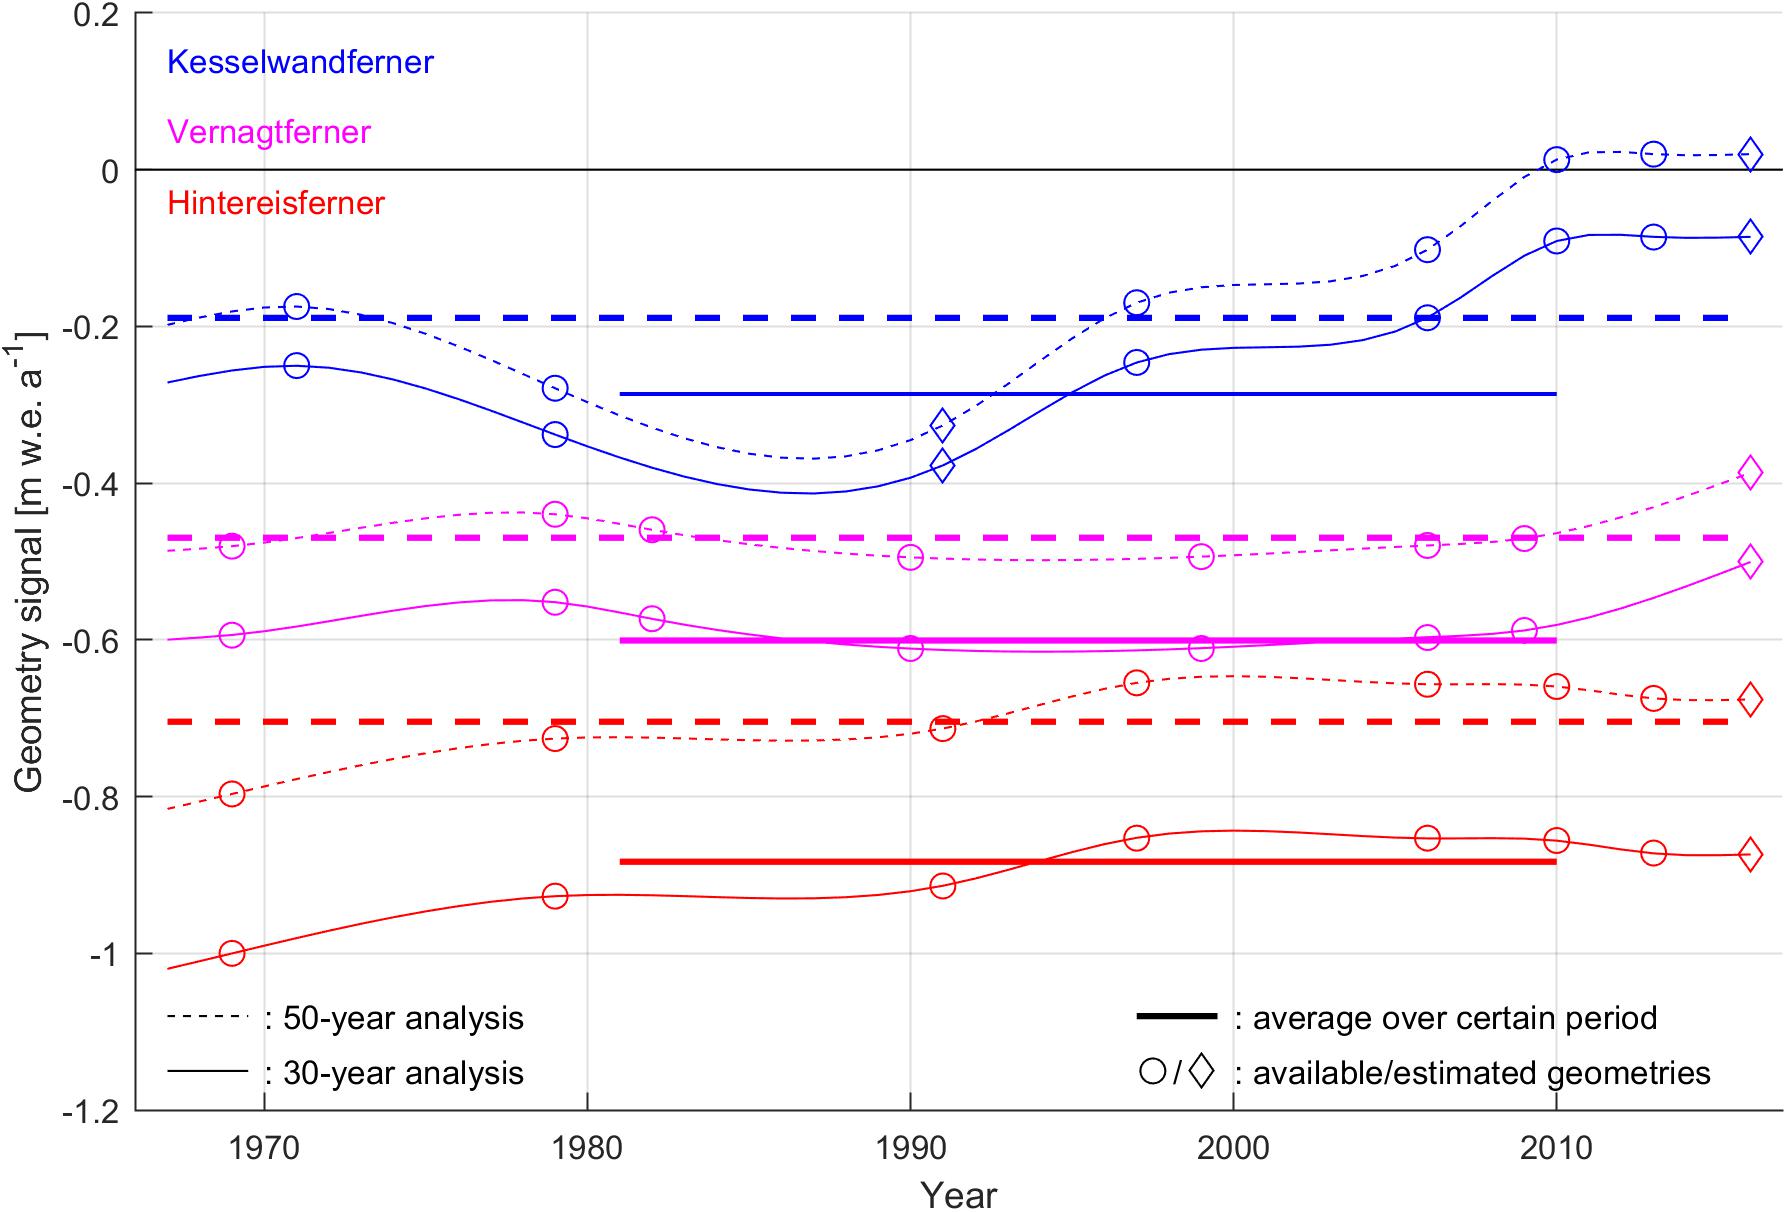
Figure 7. Geometry signals of Hintereisferner, Kesselwandferner and Vernagtferner with respect to 1981–2010 (solid lines) and 1967–2016 (dashed lines). The thick, straight lines indicate the averages of the glaciers’ geometry signals in the two periods. Years with documented geometries are marked with circles. Years with estimated geometries are marked with diamonds. The correlation coefficients R between each glacier’s geometry signals are in all cases equal to 1.00. The average differences between the geometry signals of each glacier in the whole 1967–2016 period are 0.20, 0.07 and 0.12 m w.e. a-1 for Hintereisferner, Kesselwandferner and Vernagtferner, respectively.
With our approach, we isolate a geometry component of glacier mass loss, which, whilst it typically lags behind climate variations, results in pronounced long-term changes in a warming climate. The impact of glacier geometry on mass loss could be considerable during accelerated climate changes. The application of this method could reveal the mass-budget sensitivity of various glacial regions to different climate scenarios (cf. Braithwaite and Zhang, 1999a), while such geometry signals have strong potential to serve as reference for the dynamic calibration of ice-flow simulations.
Long-Term Evolution
Recent methodological advances in laser scanning can resolve glacier topography at centimeter accuracy in the horizontal and vertical (cf. Joerg et al., 2012). Earlier glacier geometries were documented by means of aerial photogrammetry involving increased topographic uncertainty (cf. Baltsavias et al., 2001). The highest topographic uncertainties are of the order of 1–10 m, and are expected in glacier geometries from the beginning of the twentieth century deduced by terrestrial photogrammetry (cf. Haggrén et al., 2007). Geometries from the end of the Little Ice Age (i.e., around 1850) are based on trimlines and old drawings and can be more speculative due to uncertain ice thickness. The uncertainty is in all cases increased at higher elevations where persistent snow cover can hinder the accurate resolution of the glacier extent and determination of elevation. Nevertheless, an interesting exercise is to apply the reference mass-budget profiles on historical geometries as well, in order to reveal the individual adjustments of the glaciers toward steady states, in addition to their response to short-term climatic trends.
The reference-climate mass budgets of historical glacier geometries of the three glaciers with respect to 1981–2010 are presented in Figure 8A. The normalized reference-climate mass-budget deviations with respect to 1981–2010 are presented in Figure 8B, and indicate how different the historical glacier geometries were from the 1981–2010 average state. The normalization occurs according to:
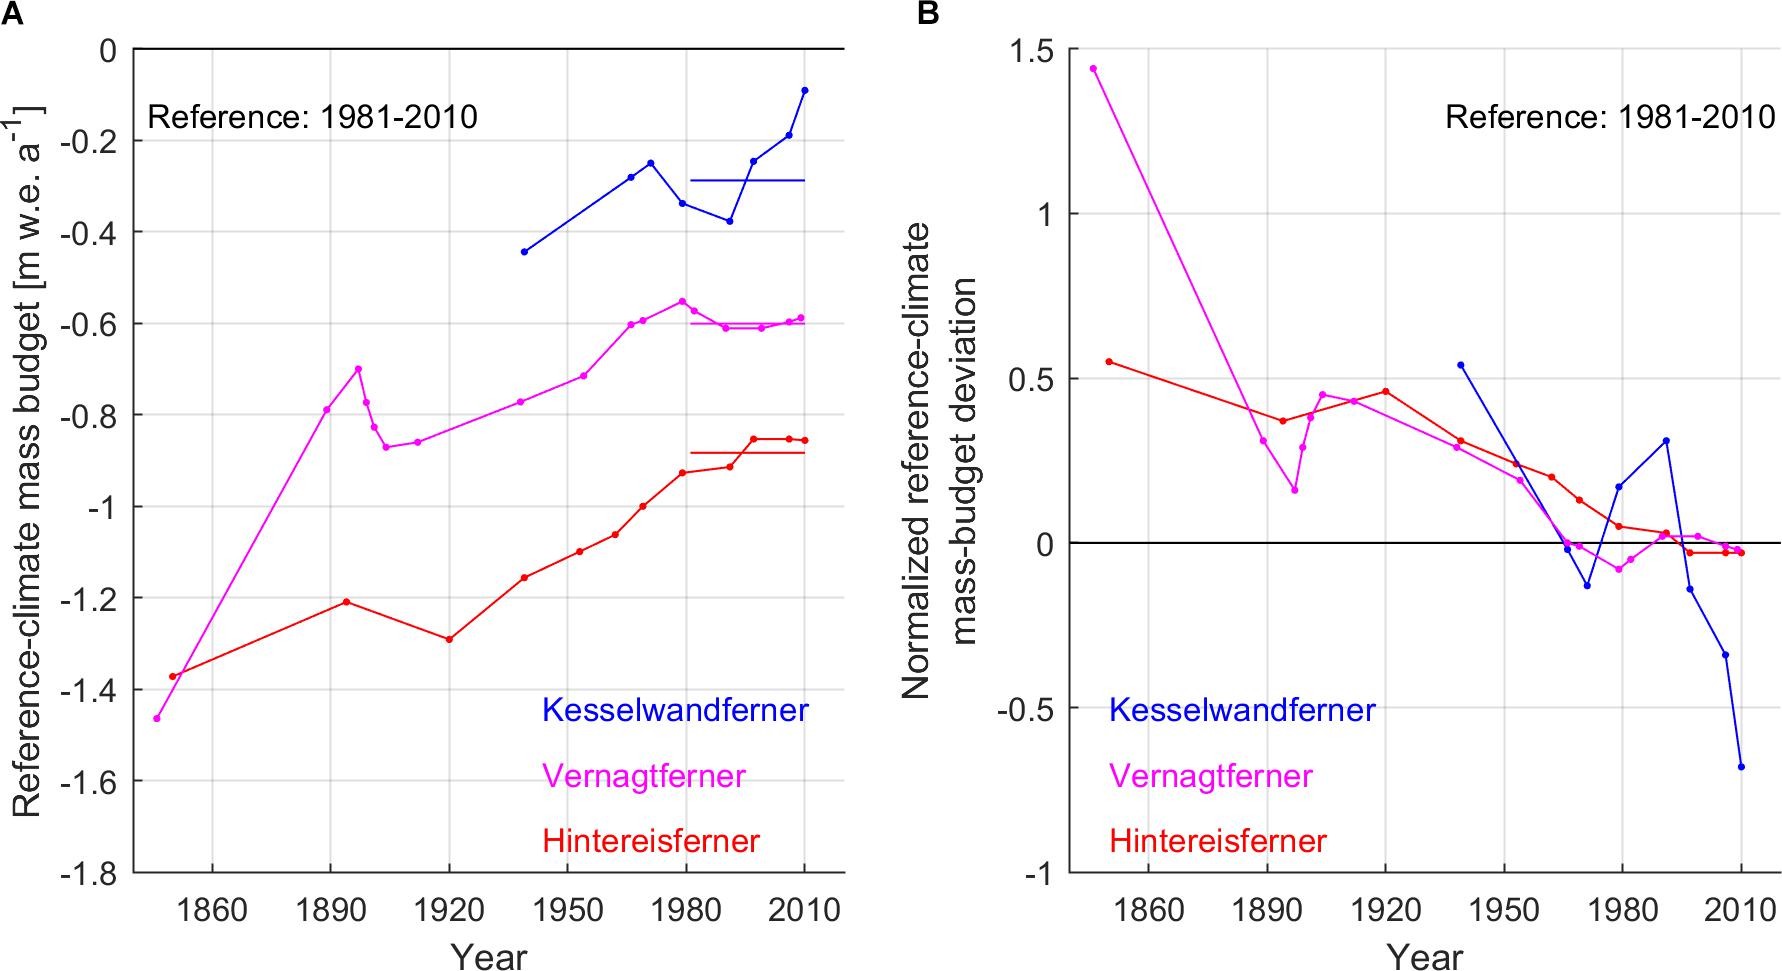
Figure 8. (A) Reference-climate mass budgets of Hintereisferner, Kesselwandferner and Vernagtferner with respect to 1981–2010. The straight lines indicate the averages of the glaciers’ geometry signals in the same period. (B) Normalized reference-climate mass-budget deviations of the three glaciers with respect to the averages of their 1981–2010 geometry signals.
where is in each case equal to the average of the 1981–2010 geometry signal (Figure 7).
Since the beginning of mass-budget monitoring, Hintereisferner is the furthest from a steady state amongst the three glaciers (Figure 8A). A linear regression on Hintereisferner’s 1850–2010 reference-climate mass budgets reveals an adjustment toward a steady state by about +3.5⋅10-3 m w.e. a-2 with respect to 1981–2010. This long-term adjustment toward a steady state is related to the rather persistent retreat of its glacier tongue since the mid-nineteenth century (Figure 2 and Supplementary Video S1). Increased winter precipitation between c. 1909 and 1925, adding to the effect of low summer air temperatures, were enough only for a 70-m advance of Hintereisferner, and hence the temporary increase of its sensitivity to climate fluctuations (Supplementary Text S1 and Supplementary Figure S3). This short advance was compensated by 1929 (Leclercq et al., 2014).
Vernagtferner adjusted similarly to Hintereisferner from the mid-nineteenth century until 1979 (Figure 8B); however, its geometric adjustment was also characterized by its surging activity (Supplementary Video S2). In the early 1980s, having completely lost its glacier tongue, Vernagtferner entered a phase of stable mass loss, which is understood since the reference-climate mass budgets with respect to 1981–2010 did not decrease in magnitude (Figure 8A; cf. Huss et al., 2012). This stable mass loss occurs predominantly by thinning rather than retreat (Figure 2 and Supplementary Video S3), without substantial ablation-area reduction that would otherwise be possible by retreat, and is the reason for Vernagtferner’s altering characteristics (i.e., lowering of its reference-climate AAR).
Kesselwandferner, due to its size and special geometry, is in principle the closest to a steady state (Figure 8A); however, it has exhibited fast geometric responses to short-term climatic trends (Figure 8B and Supplementary Figure S3; Patzelt, 1985). The advance until 1985 led Kesselwandferner to an off-steady state trajectory. Ever since the end of its advance, Kesselwandferner is rapidly adjusting toward a steady state by about +13.5⋅10-3 m w.e. a-2 (1991–2010 trend based on linear regression) with respect to 1981–2010.
The above interpretation suggests that Hintereisferner and Vernagtferner will continue to lose mass in the future predominantly by retreat and thinning, respectively, even in a cooler climate (i.e., 1967–2016 average; Supplementary Text S1 and Supplementary Figure S3) than the 1981–2010 average (Philipona and Dürr, 2004; Auer et al., 2007; Böhm and Hiebl, 2013). This confirms earlier studies of various methodologies, which suggested the vulnerability of sizable Alpine glaciers in the current century (e.g., Paul et al., 2004; Zemp et al., 2006; Haeberli et al., 2007; Paul, 2010). While Hintereisferner has been adjusting its geometry, thereby being in the long run more resilient, Vernagtferner is already disintegrating (Supplementary Video S4). Kesselwandferner would be able to reach a steady state in a climate stable around the 1981–2010 average. However, considering recent temperature trends (Böhm et al., 2001; Büntgen et al., 2005) and the forecasted 21st century warming of the region (Fink et al., 2004; Roe and Baker, 2007), the three glaciers, as well as all glaciers in the European Alps (Beniston et al., 2018), are expected to experience extended mass losses.
Conclusion
We extracted geometry signals and, with respect to these signals, geometric mass-budget anomalies from the mass-budget series of Hintereisferner, Kesselwandferner and Vernagtferner in the Ötztal Valley, Austria. The average geometric mass-budget anomalies in the 1980s and 1990s were +0.225 and +0.011 m w.e. a-1, respectively; these estimates were 34 and 196% greater, respectively, than the average centered mass-budget anomalies. The average geometric mass-budget anomaly in the 2000s was -0.213 m w.e. a-1, 24% more negative compared to the average centered mass-budget anomaly. Overall, during 1981–2010 the geometric mass-budget anomalies
suggested 31% increased mass loss (-20.3⋅10-3 m w.e. a-2) compared to the centered mass-budget anomalies. The uncertainty of these mass-budget trends related to the extraction of the geometry signals was estimated to be of the order of 10-4 m w.e. a-1. Geometry signals extracted in this way could constrain better the dynamic calibration of ice-flow simulations.
The examination of the 1979 and 2006 glacier geometries using as reference the 1981–2010 average climate showed that the ablation-area reduction of Hintereisferner and Kesselwandferner between the 2 years was at least 71% greater than the accumulation-area reduction. On the other hand, Vernagtferner between 1979 and 2006 and with respect to the 1981–2010 average climate lost approximately equal amounts from both the ablation and accumulation area (-0.70 and -0.68 km2, respectively), while the latter was about three times greater than the corresponding reduction of the accumulation area of Kesselwandferner (-0.21 km2). This pattern of the recent area-loss of Vernagtferner is related to reduced accumulation compared to the other two glaciers, and early extended mass loss caused by surging events.
The long-term evolution of the glaciers since the mid-nineteenth century, suggested that Hintereisferner and Kesselwandferner will continue their retreat. Kesselwandferner has the greatest potential to reach a steady state, should the climate stabilize around the 1981–2010 average. Vernagtferner will keep losing mass by thinning, which will further its ongoing disintegration.
A glacier’s state is best defined with respect to a reference climate. Our analysis suggests that in a region such as the European Alps, where surface-melt variability drives glacier changes, glaciers whose area losses at lower elevations are greater than at higher elevations stand a greater chance to reach a steady state in a 1981–2010 average climate. However, climate changes occur generally on shorter timescales than glacier changes. In most cases, glaciers are adapting to previous climatic conditions, hence until a steady state is reached with respect to 1981–2010, extended mass losses are inevitable due to still greatly unfit glacier geometries.
In reality, both climate and glaciers can never be stable. Currently, the European Alps are much warmer than during 1981–2010, and they are expected to get even warmer in the course of the current century. Our study highlights by example of three well-documented Austrian glaciers that central European glaciers are predestined to experience severe mass losses.
Data Availability Statement
All data are freely available by the Institute of Atmospheric and Cryospheric Sciences (ACINN) of the University of Innsbruck and the Bavarian Academy of Sciences and Humanities (BAdW). The mass budget data can also be downloaded by the World Glacier Monitoring Service (http://wgms.ch/), the open-access library PANGAEA® (https://www.pangaea.de) and http://www.glaziologie.de.
Author Contributions
CC and MW contributed to the conception and design of the study. CC developed the mathematical concept. AF, MK, AL and CM had been responsible for, and provided the databases. CC performed the statistical analysis, interpreted the results, and wrote the first draft of the manuscript. Figure 2 is a thematic elaboration of MK and AL, designed by AL for the purposes of the 2007 Hydrological Atlas of Austria (see section “Acknowledgments”), and updated and redesigned for the purposes of this study by KT under CC’s guidance. All authors contributed to manuscript revision, read and approved the submitted version.
Funding
The study was supported by the Bayerisches Staatsministerium für Umwelt und Verbraucherschutz (project number: TKP01KPB-70755). The glacier monitoring was funded by the Tyrolean Regional Government, the University of Innsbruck, the Akademienprogramm der Union der Deutschen Akademien der Wissenschaften and the Bayerischen Landeshaushalt.
Conflict of Interest Statement
The authors declare that the research was conducted in the absence of any commercial or financial relationships that could be construed as a potential conflict of interest.
Acknowledgments
We are grateful to Amelie Lindmayer for her work on historical Vernagtferner geometries, and to Georg Kaser for comments. We also thank the reviewers and scientific editors for valuable suggestions that improved the manuscript. Figure 2 is an updated version of Map 4.3 of the 2007 Hydrological Atlas of Austria (https://iwhw.boku.ac.at/hao/) produced by the Universität für Bodenkultur Wien, published by the Bundesministerium für Land- und Forstwirtschaft, Umwelt und Wasserwirtschaft, Wien and distributed by the Österreichischer Kunst- und Kulturverlag Wien.
Supplementary Material
The Supplementary Material for this article can be found online at: https://www.frontiersin.org/articles/10.3389/feart.2018.00218/full#supplementary-material
References
Abermann, J., Lambrecht, A., Fischer, A., and Kuhn, M. (2009). Quantifying changes and trends in glacier area and volume in the Austrian Ötztal Alps (1969-1997-2006). Cryosphere 3, 205–215. doi: 10.5194/tc-3-205-2009
Åkesson, H., Nisancioglu, K. H., Giesen, R. H., and Morlighem, M. (2017). Simulating the evolution of Hardangerjøkulen ice cap in southern Norway since the mid-Holocene and its sensitivity to climate change. Cryosphere 11, 281–302. doi: 10.5194/tc-11-281-2017
Andreassen, L. M., Elvehøy, H., Kjøllmoen, B., Engeset, R. V., and Haakensen, N. (2005). Glacier mass-balance and length variation in Norway. Ann. Glaciol. 42, 317–325. doi: 10.3189/172756405781812826
Auer, I., Böhm, R., Jurkovic, A., Lipa, W., Orlik, A., Potzmann, R., et al. (2007). HISTALP—historical instrumental climatological surface time series of the Greater Alpine Region. Int. J. Climatol. 27, 17–46. doi: 10.1002/joc.1377
Baltsavias, E. P., Favey, E., Bauder, A., Bosch, H., and Pateraki, M. (2001). Digital surface modelling by airborne laser scanning and digital photogrammetry for glacier monitoring. Photogramm. Rec. 17, 243–273. doi: 10.1111/0031-868X.00182
Beniston, M., Farinotti, D., Stoffel, M., Andreassen, L. M., Coppola, E., Eckert, N., et al. (2018). The European mountain cryosphere: a review of its current state, trends, and future challenges. Cryosphere 12, 759–794. doi: 10.5194/tc-12-759-2018
Böhm, R., Auer, I., Brunetti, M., Maugeri, M., Nanni, T., and Schöner, W. (2001). Regional temperature variability in the European Alps: 1760–1998 from homogenized instrumental time series. Int. J. Climatol. 21, 1779–1801. doi: 10.1002/joc.689
Böhm, R., and Hiebl, J. (2013). Lange instrumentelle Klimazeitreichen für den Vernagtferner. Z. Gletscherk. Glazialgeol. 45–46, 203–218.
Braithwaite, R. J., and Olesen, O. B. (1989). Detection of climate signal by inter-stake correlations of annual ablation data Qamanârssûp Sermia, West Greenland. J. Glaciol. 35, 253–259. doi: 10.3189/S0022143000004585
Braithwaite, R. J., Olesen, O. B., and Højmark Thomsen, H. (1992). Calculated variations of annual ice ablation at the margin of the Greenland ice sheet, West Greenland, 1961–90. J. Glaciol. 38, 266–272. doi: 10.1017/S0022143000003671
Braithwaite, R. J., and Zhang, Y. (1999a). Modelling changes in glacier mass balance that may occur as a result of climate changes. Geogr. Ann. A 81, 489–496. doi: 10.1111/1468-0459.00078
Braithwaite, R. J., and Zhang, Y. (1999b). Relationships between interannual variability of glacier mass balance and climate. J. Glaciol. 45, 456–462. doi: 10.3189/S0022143000001313
Büntgen, U., Esper, J., Frank, D. C., Nicolussi, K., and Schmidhalter, M. (2005). A 1052-year tree-ring proxy of Alpine summer temperatures. Clim. Dyn. 25, 141–153. doi: 10.1007/s00382-005-0028-1
Burke, E. E., and Roe, G. H. (2014). The absence of memory in the climatic forcing of glaciers. Clim. Dyn. 42, 1335–1346. doi: 10.1007/s00382-013-1758-0
Charalampidis, C. (2012). Response of the Ice Cap Langfjordjøkelen in Northern Norway to Climate Change. Master thesis, Utrecht, Utrecht University.
Charalampidis, C., van As, D., Box, J. E., van den Broeke, M. R., Colgan, W. T., Doyle, S. H., et al. (2015). Changing surface–atmosphere energy exchange and refreezing capacity of the lower accumulation area, West Greenland. Cryosphere 9, 2163–2181. doi: 10.5194/tc-9-2163-2015
Cogley, J. G., Hock, R., Rasmussen, L. A., Arendt, A. A., Bauder, A., Braithwaite, R. J., et al. (2011). Glossary of Glacier Mass Balance and Related Terms (IHP-VII Technical Documents in Hydrology, No. 86, IACS Contribution No. 2). Paris: UNESCO-IHP.
Dowdeswell, J. A., Hagen, J. O., Björnsson, H., Glazovsky, A. F., Harrison, W. D., Holmlund, P., et al. (1997). The mass balance of circum-Arctic glaciers and recent climate change. Quat. Res. 48, 1–14. doi: 10.1006/qres.1997.1900
Dyurgerov, M. B., and Meier, M. F. (2000). Twentieth century climate change: evidence from small glaciers. Proc. Natl. Acad. Sci. U.S.A. 97, 1406–1411. doi: 10.1073/pnas.97.4.1406
Elsberg, D. H., Harrison, W. D., Echelmeyer, K. A., and Krimmel, R. M. (2001). Quantifying the effects of climate and surface change on glacier mass balance. J. Glaciol. 47, 649–658. doi: 10.3189/172756501781831783
Escher-Vetter, H., Kuhn, M., and Weber, M. (2009). Four decades of winter mass balance of Vernagtferner and Hintereisferner, Austria: methodology and results. Ann. Glaciol. 50, 87–95. doi: 10.3189/172756409787769672
Favier, L., Durand, G., Cornford, S. L., Gudmundsson, G. H., Gagliardini, O., Gillet-Chaulet, F., et al. (2014). Retreat of Pine Island Glacier controlled by marine ice-sheet instability. Nat. Clim. Change 4, 117–121. doi: 10.1038/nclimate2094
Fink, A. H., Brücher, T., Krüger, A., Leckebusch, G. C., Pinto, J. G., and Ulbrich, U. (2004). The 2003 European summer heatwaves and drought –synoptic diagnosis and impacts. Weather 59, 209–216. doi: 10.1256/wea.73.04
Fischer, A. (2010). Glaciers and climate change: interpretation of 50 years of direct mass balance of Hintereisferner. Glob. Planet. Change 71, 13–26. doi: 10.1016/j.gloplacha.2009.11.014
Fischer, A., and Markl, G. (2009). Mass balance measurements on Hintereisferner, Kesselwandferner and Jamtalferner 2003 to 2006: database and results. Z. Gletscherk. Glazialgeol. 42, 47–83.
Fischer, A., Markl, G., and Kuhn, M. (2013). Data From: Glacier Mass Balances and Elevation Zones of Hintereisferner, Ötztal Alps, Austria, 1952/1953 to 2010/2011. Innsbruck: Institut für Interdisziplinäre Gebirgsforschung der Österreichischen Akademie der Wissenschaften. doi: 10.1594/PANGAEA.818898
Fischer, A., Markl, G., Schneider, H., Abermann, J., and Kuhn, M. (2014). Data From: Glacier Mass Balances and Elevation Zones of Kesselwandferner, Ötztal Alps, Austria, 1952/1953 to 2012/2013. Innsbruck: Institut für Interdisziplinäre Gebirgsforschung der Österreichischen Akademie der Wissenschaften. doi: 10.1594/PANGAEA.818757
Fischer, A., Seiser, B., Stocker Waldhuber, M., Mitterer, C., and Abermann, J. (2015). Tracing glacier changes in Austria from the Little Ice Age to the present using a lidar-based high-resolution glacier inventory in Austria. Cryosphere 9, 753–766. doi: 10.5194/tc-9-753-2015
Giesen, R. H., and Oerlemans, J. (2010). Response of the ice cap Hardangerjøkulen in southern Norway to the 20th and 21st century climates. Cryosphere 4, 191–213. doi: 10.5194/tc-4-191-2010
Haberkorn, A. (2011). Assessing the Contribution of Basal Melt Processes to the Local Mass Balance at the Tongue of Hintereisferner, Ötztal, Austria. Diploma thesis, Innsbruck, University of Innsbruck.
Haeberli, W., Hoelzle, M., Paul, F., and Zemp, M. (2007). Integrated monitoring of mountain glaciers as key indicators of global climate change: the European Alps. Ann. Glaciol. 46, 150–160. doi: 10.3189/172756407782871512
Haggrén, H., Mayer, C., Nuikka, M., Braun, L., Rentsch, H., and Peipe, J. (2007). Processing of old terrestrial photography for verifying the 1907 digital elevation model of Hochjochferner glacier. Z. Gletscherk. Glazialgeol. 41, 29–54.
Harrison, W., Elsberg, D., Echelmeyer, K., and Krimmel, R. (2001). On the characterization of glacier response by a single time-scale. J. Glaciol. 47, 659–664. doi: 10.3189/172756501781831837
Hawkings, E., and Sutton, R. (2016). Connecting climate model projections of global temperature change with the real world. Bull. Am. Meteorol. Soc. 97, 963–980. doi: 10.1175/BAMS-D-14-00154.1
Helsen, M. M., van de Wal, R. S. W., van den Broeke, M. R., van de Berg, W. J., and Oerlemans, J. (2012). Coupling of climate models and ice sheet models by surface mass balance gradients: application to the Greenland Ice Sheet. Cryosphere 6, 255–272. doi: 10.5194/tc-6-255-2012
Hock, R. (2005). Glacier melt: a review of processes and their modelling. Prog. Phys. Geogr. 29, 362–391. doi: 10.1191/0309133305pp453ra
Hoinkes, H. C. (1969). Surges of the Vernagtferner in the Ötztal Alps since 1599. Can. J. Earth Sci. 6, 853–861. doi: 10.1139/e69-086
Hoinkes, H. C. (1970). Methoden und möglichkeiten von massenhaushaltsstudien auf gletschern: ergebnisse der meßreihe Hintereisferner (Ötztaler Alpen) 1953–1968. Z. Gletscherk. Glazialgeol. 6, 37–90.
Hoinkes, H. C., and Steinacker, R. (1975). Zur parametrisierung der beziehung klima–gletscher. Riv. Ital. Geofis. Sci. Aff. 1, 97–103.
Holland, D. M., Thomas, R. H., de Young, B., Ribergaard, M. H., and Lyberth, B. (2008). Acceleration of Jakobshavn Isbræ triggered by warm subsurface ocean waters. Nat. Geosci. 1, 659–664. doi: 10.1038/ngeo316
Huss, M., Hock, R., Bauder, A., and Funk, M. (2012). Conventional versus reference-surface mass balance. J. Glaciol. 58, 278–286. doi: 10.3189/2012JoG11J216
Joerg, P. C., Morsdorf, F., and Zemp, M. (2012). Uncertainty assessment of multi-temporal airborne laser scanning data: a case study on an Alpine glacier. Rem. Sens. Environ. 127, 118–129. doi: 10.1016/j.rse.2012.08.012
Jóhannesson, T., Raymond, C., and Waddington, E. (1989). Time-scale for adjustment of glaciers to changes in mass balance. J. Glaciol. 35, 355–369. doi: 10.3189/S002214300000928X
Jones, P. D., Briffa, K. R., Osborn, T. J., Lough, J. M., van Ommen, T. D., Vinther, B. M., et al. (2009). High-resolution palaeoclimatology of the last millennium: a review of current status and future prospects. Holocene 19, 3–49. doi: 10.1177/0959683608098952
Klug, C., Bollmann, E., Galos, S. P., Nicholson, L., Prinz, R., Rieg, L., et al. (2018). Geodetic reanalysis of annual glaciological mass balances (2001–2011) of Hintereisferner, Austria. Cryosphere 12, 833–849. doi: 10.5194/tc-12-833-2018
Kuhn, M. (1984). Mass budget imbalances as criterion for a climatic classification of glaciers. Geogr. Ann. A 66, 229–238. doi: 10.1080/04353676.1984.11880111
Kuhn, M., Dreiseitl, E., Hofinger, S., Markl, G., Span, N., and Kaser, G. (1999). Measurements and models of the mass balance of Hintereisferner. Geogr. Ann. A 81, 659–670. doi: 10.1111/1468-0459.00094
Kuhn, M., Markl, G., Kaser, G., Nickus, U., Obleitner, F., and Schneider, H. (1985). Fluctuations of climate and mass balance: different responses of two adjacent glaciers. Z. Gletscherk. Glazialgeol. 21, 409–416.
Lambrecht, A., and Kuhn, M. (2007). Glacier changes in the Austrian Alps during the last three decades, derived from the new Austrian glacier inventory. Ann. Glaciol. 46, 177–184. doi: 10.3189/172756407782871341
Leclercq, P. W., and Oerlemans, J. (2012). Global and hemispheric temperature reconstruction from glacier length fluctuations. Clim. Dyn. 38, 1065–1079. doi: 10.1007/s00382-011-1145-7
Leclercq, P. W., Oerlemans, J., Basagic, H. J., Bushueva, I., Cook, A. J., and Le Bris, R. (2014). A data set of worldwide glacier length fluctuations. Cryosphere 8, 659–672. doi: 10.5194/tc-8-659-2014
Lliboutry, L. (1974). Multivariate statistical analysis of glacier annual balances. J. Glaciol. 13, 371–392. doi: 10.1017/S0022143000023169
Lüthi, M. P. (2014). Little Ice Age climate reconstruction from ensemble reanalysis of Alpine glacier fluctuations. Cryosphere 8, 639–650. doi: 10.5194/tc-8-639-2014
Mayer, C., Escher-Vetter, H., and Weber, M. (2013). 46 Jahre glaziologische Massenbilanz des Vernagtferners. Z. Gletscherk. Glazialgeol. 45–46, 219–234.
Medwedeff, W. G., and Roe, G. H. (2017). Trends and variability in the global dataset of glacier mass balance. Clim. Dyn. 48, 3085–3097. doi: 10.1007/s00382-016-3253-x
Mouginot, J., Rignot, E., Scheuchl, B., Fenty, I., Khazendar, A., Morlighem, M., et al. (2015). Fast retreat of Zachariæ Isstrøm, northeast Greenland. Science 350, 1357–1361. doi: 10.1126/science.aac7111
Nicolussi, K. (2013). “Zur Geschichte des Vernagtferners – Gletschervorstöße und Seeausbrüche im vergangenen Jahrtausend,” in Klima, Wetter, Gletscher im Wandel (Alpine Forschungsstelle Obergurgl, Vol. 3), eds E.-M. Koch and B. Erschbamer (Innsbruck: Innsbruck University Press).
Nye, J. F. (1960). The response of glaciers and ice-sheets to seasonal and climatic changes. Proc. R. Soc. Lond. A 256, 559–584. doi: 10.1098/rspa.1960.0127
Oerlemans, J. (1994). Quantifying global warming from the retreat of glaciers. Science 264, 243–245. doi: 10.1126/science.264.5156.243
Oerlemans, J. (1997). A flowline model for Nigardsbreen, Norway: projection of future glacier length based on dynamic calibration with the historic record. Ann. Glaciol. 24, 382–389. doi: 10.1017/S0260305500012489
Oerlemans, J. (2005). Extracting a climate signal from 169 glacier records. Science 308, 675–677. doi: 10.1126/science.1107046
Oerlemans, J. (2008). Minimal Glacier Models. Utrecht: Igitur, Utrecht Publishing & Archiving Services.
Oerlemans, J. (2010). The Microclimate of Valley Glaciers. Utrecht: Igitur, Utrecht Publishing & Archiving Services.
Østrem, G., and Brugman, M. (1991). Glacier Mass-Balance Measurements: A Manual for Field and Office Work (NHRI Science Report No. 4). Saskatoon: National Hydrological Research Institute.
Patzelt, G. (1985). Glacier advances in the Alps 1965 to 1980. Z. Gletscherk. Glazialgeol. 21, 403–407.
Paul, F. (2010). The influence of changes in glacier extent and surface elevation on modeled mass balance. Cryosphere 4, 569–581. doi: 10.5194/tc-4-569-2010
Paul, F., Kääb, A., Maisch, M., Kellenberger, T., and Haeberli, W. (2004). Rapid disintegration of Alpine glaciers observed with satellite data. Geophys. Res. Lett. 31:L21402. doi: 10.1029/2004GL020816
Philipona, R., and Dürr, B. (2004). Greenhouse forcing outweighs decreasing solar radiation driving rapid temperature rise over land. Geophys. Res. Lett. 31:L22208. doi: 10.1029/2004GL020937
Proksch, M., Rutter, N., Fierz, C., and Schneebeli, M. (2016). Intercomparison of snow density measurements: bias, precision, and vertical resolution. Cryosphere 10, 371–384. doi: 10.5194/tc-10-371-2016
Reinwarth, O., and Escher-Vetter, H. (1999). Mass balance of Vernagtferner, Austria, from 1964/65 to 1996/97: results for three sections and the entire glacier. Geogr. Ann. A 81, 743–751. doi: 10.1111/j.0435-3676.1999.00102.x
Reinwarth, O., and Rentsch, H. (1994). Volume and mass balance of Vernagtferner/Oetztal Alps. Z. Gletscherk. Glazialgeol. 30, 99–107.
Roe, G. H. (2011). What do glaciers tell us about climate variability and climate change? J. Glaciol. 57, 567–578. doi: 10.3189/002214311796905640
Roe, G. H., and Baker, M. B. (2007). Why is climate sensitivity so unpredictable? Science 318, 629–632. doi: 10.1126/science.1144735
Roe, G. H., and Baker, M. B. (2014). Glacier response to climate perturbations: an accurate linear geometric model. J. Glaciol. 60, 670–684. doi: 10.3189/2014JoG14J016
Strasser, U., Marke, T., Braun, L., Escher-Vetter, H., Juen, I., Kuhn, M., et al. (2018). The Rofental: a high Alpine research basin (1890–3770 m a.s.l.) in the Ötztal Alps (Austria) with over 150 years of hydrometeorological and glaciological observations. Earth Syst. Sci. Data 10, 151–171. doi: 10.5194/essd-10-151-2018
Thibert, E., Dkengne Sielenou, P., Vionnet, V., Eckert, N., and Vincent, C. (2018). Causes of glacier melt extremes in the Alps since 1949. Geophys. Res. Lett. 45, 817–825. doi: 10.1002/2017GL076333
Van As, D., Fausto, R. S., Cappelen, J., van de Wal, R. S. W., Braithwaite, R. J., Machguth, H., et al. (2016). Placing Greenland ice sheet ablation measurements in a multi-decadal context. Geol. Surv. Denmark Greenland Bull. 35, 71–74.
Van de Wal, R. S. W., Oerlemans, J., and van der Hage, J. C. (1992). A study of ablation variations on the tongue of Hintereisferner, Austria. J. Glaciol. 38, 319–324. doi: 10.3189/S0022143000002203
Vaughan, D. G., Comiso, J. C., Allison, I., Carrasco, J., Kaser, G., Kwok, R., et al. (eds). (2013). “Observations: Cryosphere,” in Climate Change 2013: The Physical Science Basis (Contribution of Working Group I to the Fifth Assessment Report of the Intergovernmental Panel on Climate Change), eds T. F. Stocker, D. Qin, G.-K. Plattner, M. Tignor, S. K. Allen, J. Boschung, et al. (Cambridge and New York, NY: Cambridge University Press).
Vincent, C., Fischer, A., Mayer, C., Bauder, A., Galos, S. P., Funk, M., et al. (2017). Common climatic signal from glaciers in the European Alps over the last 50 years. Geophys. Res. Lett. 44, 1376–1383. doi: 10.1002/2016GL072094
Vincent, C., Kappenberger, G., Valla, F., Bauder, A., Funk, M., and Le Meur, E. (2004). Ice ablation as evidence of climate change in the Alps over the 20th century. J. Geophys. Res. Atmos. 109:D10104. doi: 10.1029/2003JD003857
Weber, M. (2013). Dokumentation der Veränderungen des Vernagtferners und des Guslarferners anhand von Fotografien. Z. Gletscherk. Glazialgeol. 45–46, 49–84.
WGMS (2017). “Global glacier change bulletin No. 2 (2014–2015),” in ICSU(WDS)/IUGG(IACS)/UNEP/UNESCO/WMO). Retrieved from World Glacier Monitoring Service (Publication Based on Database Version October 2017, eds M. Zemp, S. U. Nussbaumer, I. Gärtner-Roer, J. Huber, H. Machguth, F. Paul, et al. (Zurich: Staffel Medien AG). doi: 10.5904/wgms-fog-2017-10
Zemp, M., Haeberli, W., Hoelzle, M., and Paul, F. (2006). Alpine glaciers to disappear within decades? Geophys. Res. Lett. 33:L13504. doi: 10.1029/2006GL026319
Keywords: mass-budget anomalies, geometry change, geometry signal, climate forcing, glacier state, European Alps
Citation: Charalampidis C, Fischer A, Kuhn M, Lambrecht A, Mayer C, Thomaidis K and Weber M (2018) Mass-Budget Anomalies and Geometry Signals of Three Austrian Glaciers. Front. Earth Sci. 6:218. doi: 10.3389/feart.2018.00218
Received: 13 June 2018; Accepted: 14 November 2018;
Published: 17 December 2018.
Edited by:
Alun Hubbard, UiT The Arctic University of Norway, NorwayReviewed by:
Andy Aschwanden, University of Alaska Fairbanks, United StatesRobert McNabb, University of Oslo, Norway
Copyright © 2018 Charalampidis, Fischer, Kuhn, Lambrecht, Mayer, Thomaidis and Weber. This is an open-access article distributed under the terms of the Creative Commons Attribution License (CC BY). The use, distribution or reproduction in other forums is permitted, provided the original author(s) and the copyright owner(s) are credited and that the original publication in this journal is cited, in accordance with accepted academic practice. No use, distribution or reproduction is permitted which does not comply with these terms.
*Correspondence: Charalampos Charalampidis, YmFiaXMuY2hhcmFsYW1wQGJhZHcuZGU=