 Tanja Witt
 Thomas R. Walter
 Daniel Müller
 Magnús T. Guðmundsson
 Anne Schöpa
- 1GFZ German Research Centre for Geosciences, Potsdam, Germany
- 2Nordvulk, Institute of Earth Sciences, University of Iceland, Reykjavik, Iceland
Fissure eruptions are associated with lava fountains which often show complex distinct venting activity in pulsating form, and the development of characteristic morphological features such as scoria or spatter cones. Most morphological studies are based on observations of old structures and are not related to direct observations and systematic records of vent activity. The 2014–2015 Holuhraun eruption site, Iceland, offered an exceptional opportunity to study the location and evolution of these cones and their relationship to venting dynamics in unprecedented detail. Here we analyze records from lava fountain activity at distinguished vents, captured during the 2014–2015 Holuhraun eruption, and compare them with the morphology of spatter cones that developed. We conducted a fieldwork mapping project combining terrestrial laser scanning (TLS) and unmanned aerial vehicle (UAV) aerophoto techniques to characterize the cone morphologies. We recorded videos of the eruption and used edge detection and particle image velocimetry to estimate venting heights and particle velocities. We find that the number of active vents producing lava fountains decreases from 57 along the whole line of fire to 10 lava fountains at distinct vents during the first 5 days of the eruption. We suggest that this happens by channeling the magma supply in the subsurface developing conduits. Thereby we see that at the locations where spatter cone morphology developed, the strongest and the highest lava fountains with high ejection velocities were recorded on the very first days of the eruption. In addition, the sites that eventually developed moderate or weak cone morphologies were identified as less active lava fountain locations during the early stage of the eruption. The comparison of our topographic datasets shows that the spatter cones remained similar in shape but increased in size as the eruption progressed. In addition, we suggest that the observed changes in morphology may have affected lava ponding in the crater, which in turn strongly influenced the lava fountain heights. Our results improve the general understanding of landscape evolution in rift zones and demonstrate the close relationship between cone morphology and lava fountain activity at the onset of an eruption.
1. Introduction
Graben morphology, tensile fractures, normal faults, and magmatic fissures together with aligned cones are common structural and morphological features of rift zones in Iceland and elsewhere. Typically, rifting events are associated with lateral dike intrusions that originate in a central volcano (Rubin, 1990) and associated eruption locations at fissures (Lipman, 1980; Wright et al., 2006; Ferguson et al., 2010; Medynski et al., 2016). At these fissures, a large number of vents may lead to lava fountaining and are thought to be closely related to the geometry and pressure fluctuations at the underlying feeder dike (Witt and Walter, 2017). A lava fountain is a mixture of magmatic gases and fragmented lava, which erupt vertically from a vent as a jet (Calvari et al., 2018). A vent is the surface feature from which the lava fountain occurs (see Figure 1C). The lava fountain is formed when large amounts of volatiles are rapidly released from the magma while the magma is ascending and the pressure is reducing within the conduit (Calvari et al., 2018).
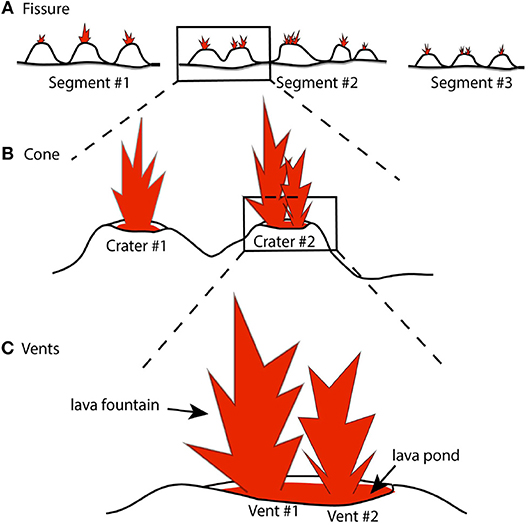
Figure 1. Definition of fissure, cone and vent. (A) Elongated fissure divided into three segments. The fissure is the whole eruption site, and segments are parts of the fissure which are separated by small inactive areas. (B) The erupted material from the volcanic eruptions sculps several cones (triangle-shaped hills) or ramparts. These cones hosted craters, vents, and lava fountains. (C) Crater area with lava pond and vents. Each lava fountain occurs at an own vent (here labeled vent #1 and #2), while the crater can host several vents.
Dike intrusions, eruptions, and associated faulting play an important role in the development of the geomorphology and topography of rift zones (Rubin and Pollard, 1988). Although rift zones are the most common magmatic environment on Earth, the opportunity to characterize rift-related volcanism is limited. Beneath normal faulting, magmatic injection plays a significant role within the rifting process, and the interaction of these two processes creates the rift morphology (Ferguson et al., 2010; Medynski et al., 2013). Therefore, magmatic injections are mainly responsible for rift zone extension, as seen at the Dabbahu rifting episode, Ethiopia (Wright et al., 2006; Medynski et al., 2016). Seismic and geodetic data available in Iceland indicate that the feeder dikes are commonly <10 m thick, a few kilometers high, and may propagate along a rift for several tens of kilometers (Rubin, 1995). As most of these sheet intrusions become stuck beneath the surface, periods of volcanic unrest with sheet injections are more frequent than volcanic eruptions (Gudmundsson and Brenner, 2005). Similar recent examples occurred at Kilauea volcano (Lundgren et al., 2013), Fogo volcano (Bagnardi et al., 2016), Tolbachik (Lundgren et al., 2015) and Iceland (Sigmundsson et al., 2015). Dike intrusions along a rift zone are associated with subsidence of the central volcano, the establishment of harmonic tremor, and downrift migration of a swarm of earthquakes at rates of a few tens of centimeters per second, reflecting the migration of the magma-filled crack-tip (Rubin and Pollard, 1988; Gudmundsson et al., 2016). At the surface, the areas above erupting dikes develop volcanic landscapes with complex interfingering lava flows, scoria and spatter cones and fracture networks (Walker and Sigurdsson, 2000).
However, the link between the feeder dike and the surface activity is often unclear, and the eruption dynamics may be associated with segmented elongated fissures or more isolated conduits. While geodetic data commonly suggest an extensive dike with a rather uniform opening at depth (the upper edge often at 1–3 km depth beneath the surface; Lundgren et al., 2013), eruption at the surface occurs at aligned vents or even isolated vents (Wylie et al., 1999a; Witt and Walter, 2017). Gradual development may occur from the fissure to venting activity, which has been previously explained by the flow of hot magma through a crack-like fissure, leading to focused activity at only a few vents (Wylie et al., 1999a). Therefore, a high magma supply benefits the opening of single large vents within a cinder cone, while gradual changes in the eruption style (e.g., from lava fountains to mild Strombolian explosions) are determined by changes in the shallow dike feeding system (Spampinato et al., 2008). Our observations during the 2014 Holuhraun eruption further highlight the complex relationship between focused flow through dikes, morphology development, and dynamics of the vents of an eruptive fissure. The aim of this study is to understand the relationship between the height of lava fountains and cinder cone growth by comparing lava fountain activity with the morphology evolution of the corresponding cones. As our data from Iceland reveal, focused regions develop within the first days of an eruption, and the growing spatter cone is able to modulate the height and dynamics of the lava fountain.
1.1. Fissure Morphology, Different Vent Types and Their Controls
A rifting event is characterized by eruptive fissures at the surface, often in segmented and discontinuous alignment, with some fissures having an en-echelon array. Such irregularities may arise from reactivation of preexisting structures and stress field complexities (Parcheta et al., 2015). The dikes feeding the fissure can be divided into three types depending on the present volcano topography, tectonic setting and mean composition of the magma. These factors can also lead to the reorientation of the dike in the upper thickness of the dike (Acocella and Neri, 2009). The taller the volcano is, the longer the dikes with radial orientations (Acocella and Neri, 2009). Whether the dikes reach the surface and produce a fissure eruption depends mainly on the stress field in the volcano region (Gudmundsson and Brenner, 2005). Individual fissures may be hundreds of meters long, and host tens to hundreds of vents (see Figure 1). The fissure geometry strongly depends on preexisting structures, as evident for the 1969 Mount Ulu eruption of Kilauea, where fissure irregularities arise from weak zones at preexisting cooling joints (Parcheta et al., 2015). A further localization of the eruption activity and an increase in lava fountain height were interpreted as increase in the exit velocity at the surface due to cooling (Parcheta et al., 2015), solidification of some segments and thermal erosion in other segments of the dike, and/or varying eruption rates and volatile exsolution (Bruce and Huppert, 1990; Ida, 1996; Wylie et al., 1999b; Parcheta et al., 2015). Eruptions change the topography of the area and develop rifts and aligned fractures and cones (Müller et al., 2017). The link between fissure eruption and topography may even occur in two ways, as changing morphology may affect the dike geometry (Maccaferri et al., 2017) and type of eruption and change the direction of lava flows and tephra (Head III and Wilson, 1989; Rowland and Walker, 1990). Cones are normally classified based on stratigraphic and morphological data (e.g., Corazzato and Tibaldi, 2006; Dóniz-Páez, 2015) and described by parameters such as size, shape, slope, orientation and crater number and size (e.g., Grosse et al., 2009). The morphology of cones and craters along a fissure is strongly linked to the nature of the basaltic explosive eruption, forming cinder cones and spatter cones that often host lava ponds in their central crater and feed extensive lava flows (see Figure 1; Fedotov, 1981; Wolfe et al., 1987; Head III and Wilson, 1989; Valentine and Gregg, 2008; Parcheta et al., 2013; Thordarson et al., 2015; Gudmundsson et al., 2016). The cone parameters depend on the output rate, eruption volume, and fountain height, width, and clast size distribution, as well as instabilities within the summit region (Head III and Wilson, 1989; Calvari and Pinkerton, 2004; Behncke et al., 2014).
A decrease in the fountain height can result in a transition from a scoria to spatter cone. The spatter cones are then nested within the scoria cone and they predominantly develop by low lava fountain fallout, coalescence, and spatter flow, while scoria cones are dominated by agglutinated and coalesced deposits (Reynolds et al., 2016). The shape of the cones can be influenced by the wind strength and direction (Reynolds et al., 2016), structural setting, and local topography (Corazzato and Tibaldi, 2006), as well as, lava outflows which can lead to higher erosion at a portion of the cone (Calvari and Pinkerton, 2004).
The type and internal structure of the cones are also determined by the eruption duration, fountain height, magma flux, water content and variations in these factors (Carey and Sparks, 1986; Houghton and Schmincke, 1989; Parfitt and Wilson, 1994; Sumner, 1998; Houghton and Gonnermann, 2008; Riggs and Duffield, 2008; Németh, 2010; Németh et al., 2011). However, the evolution of cone morphology has rarely been addressed and with limited details (Thordarson and Self, 1998; Reynolds et al., 2016) due to difficult access of the data. Systematic measurements of lava fountain activity during eruption and changes in morphology may be linked to provide novel insights into the physical processes during eruption dynamics. To this aim, the parameters characterizing the morphology of the cones can be extracted from digital elevation models (DEMs). Aerial photos taken by camera drones allow the generation of high resolution DEMs (Westoby et al., 2012; Amici et al., 2013a; Mancini et al., 2013; Nakano et al., 2014; Müller et al., 2017) and can be used for poorly accessible volcanic terrain, such as lava flows (e.g., Favalli et al., 2010), volcanic domes (e.g., Darmawan et al., 2018) and large cone areas (Corazzato and Tibaldi, 2006; Dóniz-Páez, 2015).
To study the link between morphology and the eruption dynamics, we analyze the fountain behavior during the initial phase and model the lava fountain heights of the Holuhraun eruption (Iceland). In the following sections, we first describe the overall eruption episode and the methods used. Then, in section 4, the changes in the cinder cone morphology, analysis of the fountaining behavior, combination of the morphology and fountain height, and activity of the fountains are presented. Lastly, we model the fountain height to study the influence of (i) a lava pond within the crater and (ii) the conduit radius on the height.
1.2. Focused Venting
Eyewitness accounts report that shortly after the onset of eruptive activity, fountain activity was focused at a few distinct vents that shaped the eruption site, with the formation of a cone morphology (Delaney and Pollard, 1982; Bruce and Huppert, 1989, 1990; Wylie et al., 1999a). The processes driving magma from a planar dike to feed surface eruptions at a few localized vents have long been a subject of debate. The focused flow was thought to occur as a feedback effect of the rate of solidification (McBirney and Murase, 1984) based on thermomechanical erosion and magma cooling (Bruce and Huppert, 1990), and/or be associated with solidification and changes in magma viscosity (Wylie et al., 1999b). In some areas, the cooling from the surrounding bedrock is higher than the heat flux from the magma. Therefore, the vents may be blocked by solidified magma, and thus, the fountain activity at this vent ends. At vents with high heat flux due to large vent diameters, magma may be able to erode and melt the surrounding bedrock, causing the conduit to widen until an equilibrium is reached (Bruce and Huppert, 1989, 1990). Extending earlier studies by Delaney and Pollard (1982), Bruce and Huppert (1990), Lister and Kerr (1991), and Wylie et al. (1999a) demonstrated that both solidification and viscosity variations play a major role in the localization of flow in the fissure.
Tremor source location at Holuhraun, 2014, shows that long period earthquakes concentrate beneath the localized vents by day 2 from the start of the eruption (Eibl et al., 2017), demonstrating that focused venting occurs early. The time from the opening of a fissure to focused venting varies from a few hours (e.g., 1959 Kilauea eruption with 2 h - Richter et al., 1970) to several days (e.g., a few days at Krafla between 1974 and 1984 - Björnsson et al., 1979). Localized vents may rapidly build up characteristic cones, which are aligned in rows along the dike path and associated with Strombolian and Hawaiian eruptions (Németh et al., 2011).
Previous descriptions of focused venting along fissures and the formation of eruptive cones were mainly based on before-after eruption comparisons or sparse eyewitness observations. To monitor eruption sites and venting activity at high spatial and temporal resolution, video monitoring and computer vision tools (i.e., quantitative video analysis tools) are essential. Volcano monitoring has been achieved with thermal cameras (e.g., James et al., 2006; Patrick et al., 2007; Stevenson and Varley, 2008), high-speed cameras (e.g., Taddeucci et al., 2012b), and time-lapse cameras (Walter, 2011; Salzer et al., 2016). These observations have been made from safe distances at various types of volcanoes, such as at Etna, Italy (e.g., Behncke et al., 2006; Scollo et al., 2014), Stromboli, Italy (e.g., Andronico et al., 2013), Mount Saint Helens, USA (Major et al., 2009), and Kilauea, Hawai'i (e.g., Patrick et al., 2010). From these observations, the parameters of the fissure eruption, such as height, width, area, and perimeter (Behncke et al., 2006; Witt and Walter, 2017) can be determined. The dependency of fountain height on magma level fluctuation, vesicularity of the magma, backfilling and rheological changes can be inferred (Patrick et al., 2007; Parcheta et al., 2013). Here we use video records from the Holuhraun fissure eruption, to investigate focused venting with unprecedented detail.
2. Study Area
Iceland is located on the boundary between the North American and Eurasian plates. These plates diverge from each other by 18.5 mm/year (Árnadóttir et al., 2008) in the N104°E direction (DeMets et al., 2010). Two characteristic transform fault zones are developed, defining the Eastern and the Northern Volcanic Zones, which are associated with several central volcanoes and attached fissure swarms (Thordarson and Larsen, 2007). During rifting events, the fissure swarms are fed by dikes that drive magma laterally away from the central volcanoes (e.g., Acocella and Trippanera, 2016; Medynski et al., 2016). These dikes generate large deformation and normal faulting, such as during the 2014–2015 Holuhraun eruption (Sigmundsson et al., 2015; Ruch et al., 2016).
Bárðarbunga (see the red triangles in Figure 2a) is one of these central volcanoes and hosts the plumbing system associated with the most recent rifting event in Iceland. Bárðarbunga is located beneath the Vatnajökull ice cap (see the light gray area in Figure 2a) and has a 7 × 10 km wide and 700 m deep caldera (Gudmundsson and Högnadóttir, 2007) that subsided in the course of the 2014–2015 Holuhraun eruption (Gudmundsson et al., 2016). The Bárðarbunga fissure swarms are directed to the north and north-east (see Figure 2, new fissures in orange) and form an approximately 150 km long volcanic system, possibly intersecting with the Askja fissure swarms (Björnsson and Einarsson, 1990).
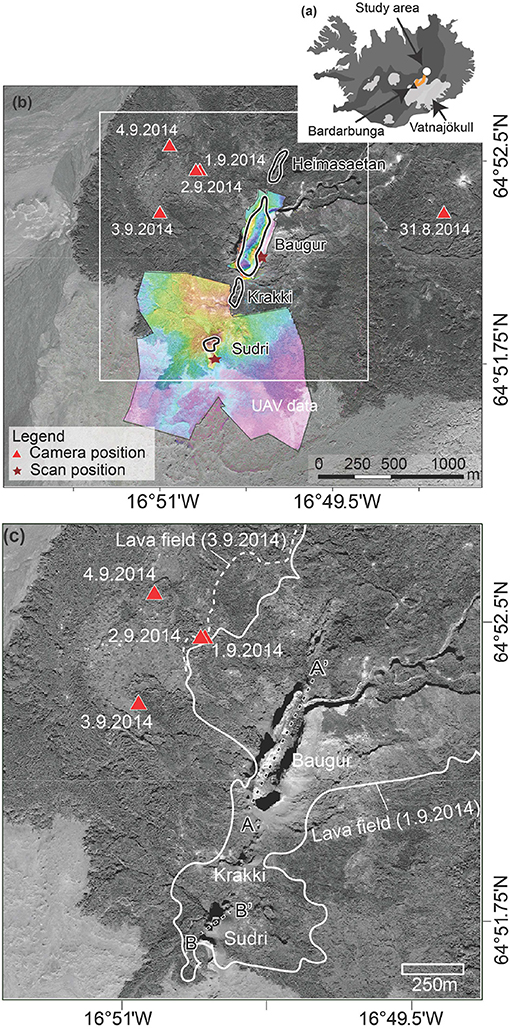
Figure 2. Area of the 2014–2015 Holuhraun fissure eruption. (a) Map of Iceland with the study area highlighted by a white dot. The main rift zones of Iceland are shown in dark gray. The central volcano Barðarbunga, which is the origin of the feeder dike (orange line), is shown as a gray triangle and is located within the glacier Vatnajökull (light gray area). (b) Southern part of the Holuhraun eruption site, with the area covered by UAV data colored. The color indicates the topographic height of each data point. TLS data were obtained from two positions given by a star, and camera data were recorded from different locations (triangles). The data collection date of each site is also displayed next to the red triangle. (c) A closer look at the Baugur and Suðri cones with the outlines of the lava field on Sept 1–3. A-A' and B-B' indicate the profile lines for the morphologies of the cones shown in Figure 7.
The Holuhraun eruption, northeast of Bárðarbunga, is the largest eruption in Iceland by volume since the Laki eruption (1783–1784). On Aug 16, 2014, an intense seismic swarm started at Bárðarbunga caldera at 3:00 UTC, occurring in several clusters (Sigmundsson et al., 2015). Seismicity migrated northward for 41 km, located at a depth of 6 to 10 km, and stopped migrating within 2 weeks on Aug 27 (Sigmundsson et al., 2015; Ágústsdóttir et al., 2016). During this period, a graben structure and multiple fractures formed at the surface above the dike (Hjartardóttir et al., 2016; Ruch et al., 2016; Müller et al., 2017). On Aug 29, 2014, the first eruption, lasting for approximately 4 h, started at a 600 m long fissure, at the same location where the Holuhraun lava field formed in 1797/1798 (see Figure 2; Gudmundsson et al., 2016). The connection between the diffused seismicity at 6–10 km depth, and the eruption locations at the surface was imaged using seismic array methods, which detected and located events clustering under the eruption vents (Eibl et al., 2017; Caudron et al., 2018), possibly representing conduits connecting a deeper dike to the surface vents (Eibl et al., 2017). The tremor and microseismicity at the dike remained high during dike propagation and eruption (Ágústsdóttir et al., 2016). On Aug 31, a second fissure eruption started at an ~ 1.5 km long fissure at the same location as the first eruption (Sigmundsson et al., 2015). This second eruption was associated with spatter-dominated scoria cone formation. The activity was characterized by large fountains that increased in mean lava fountain heights from 47 to 126 m during the first 4 days (Eibl et al., 2017). The fountains became progressively focused at several vents in the following days. Therefore, the fountains at the largest cone (Baugur, see Figure 2b) show heights up to 130 m, while other cones hosted fountains with heights of ~ 100 m (Eibl et al., 2017) and lava ponds in their center (Ruch et al., 2016). While the eruption initially occurred at many vents, only a few vents remained after the first few days. From south to north, the vents were named Suðri, Krakki, Baugur, Heimasætan, and Norðri, where Krakki and Heimasætan were formed later during the eruption and ended earlier (see Figure 3) than the main cones listed above. These main cones have reached heights between 40 m (Suðri) and approximately 100 m (Baugur), with the latter cones being the main source of the lava field (Müller et al., 2017; Pedersen et al., 2017). The different cones may contain multiple vents (see Suðri cone in Figure 2c). While satellite radar data have allowed studying the general morphology of the lava field (Dirscherl, 2016; Pedersen et al., 2017), small-scale features such as cones and craters have not been described in detail.
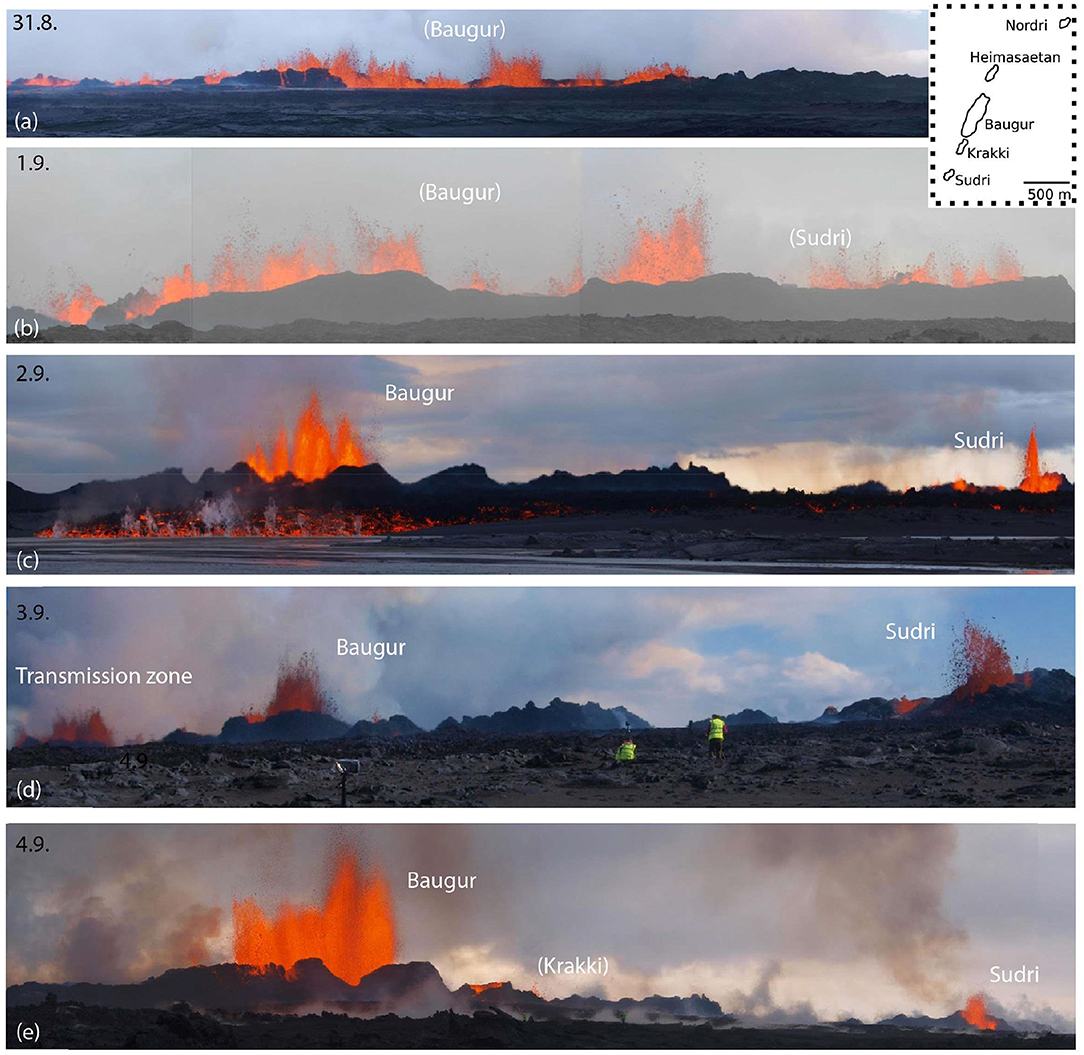
Figure 3. Evolution of the eruption. Examples from optical images for the first 5 days of the eruption. (a) In the beginning, we observed several cones that were hard to separate and, therefore, were interpreted as a line of erupting vents of an eruption segment. (b) On the second day, the number of vents decreased, but the fountain heights increased. (c–e) After Sept 2, the vents in Suðri and Baugur emerged and remained fixed in their location until the end of activity (here, the location seems to change due to the change in camera position, see Figure 2c for comparison; north is on the left and south on the right).
Sigmundsson et al. (2015) analyzed the deformation rate associatedn with the Barðarbunga central volcano and dike opening, and compare this geodetic signal to the eruption volume at the Holuhraun fissures. Therefore they were able to constrain and compare the inflow of magma into the dike and the eruption volume. After Sept 4, 2014, the inflow of magma into the dike was approximately equal to the magma outflow feeding the eruption (Sigmundsson et al., 2015). This time (Sept 4) represents the end of the initial phase of the eruption, while the eruption continued for ~ 6 months and ended on Feb 27, 2015. The eruption after the initial phase is characterized by fountaining activity restricted to the main cones. The total volume of the identified intruded and erupted magma was 1.9 ± 0.3 km3 (Gudmundsson et al., 2016).
The 2014/2015 Holuhraun eruption was located at a similar place as the 1797/1798 eruption, in which the lava erupted from a 2 km long fissure about 15 km south of Askja (Hartley and Thordarson, 2013). The main eruption in 1797/1798 occurs in the winter season forming 19 cones in a line with an azimuth of N14°. Based on the geochemical analyses of the lava flows they could be assigned to the Barðarbunga volcano (Hartley and Thordarson, 2013).
3. Data Collection and Methods
3.1. Collected Data
To investigate the relation between fountaining and vent morphology, we analyze the video data that we acquired during the first days of the 2014–2015 Holuhraun eruption. We compare the video data to a variety of available digital elevation models (DEMs). In the following section, we first describe the data and then the analysis methods. The timing and specifications of the data are provided in Table 1.
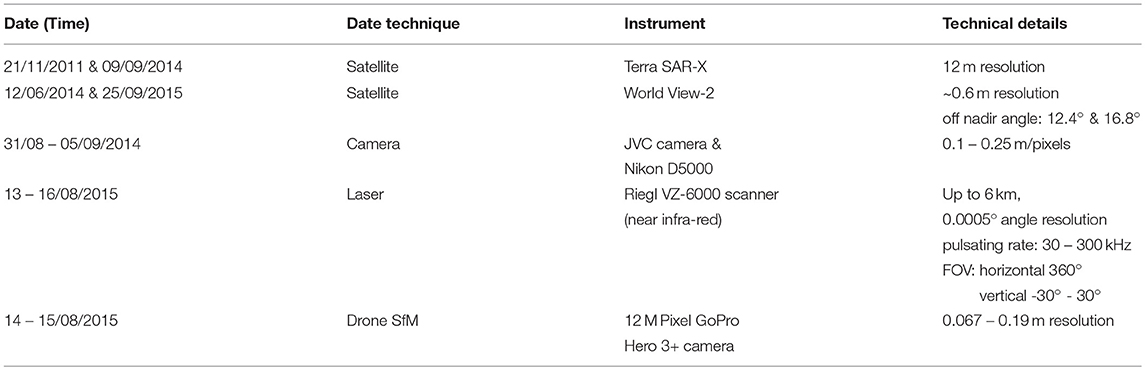
Table 1. Summary of different data sets used to analyse the fountaining behavior and morphology.
The morphological study comparing DEMs acquired before and after the eruption is based on (i) satellite imagery and results from the TanDEM-X and WorldView-2 satellite missions and (ii) field data attained at key locations by camera drones and terrestrial laser scanning (TLS). A detailed description of the TanDEM-X data can be found in Floricioiu et al. (2015) and Rossi et al. (2016), and of our field data in Müller et al. (2017), respectively.
On Aug 14 and 15, 2015, we collected approximately 2000 close-range aerial photographs of the area around the southern vents and Baugur, covering an area of 1.07 km2 (see the colored areas in Figure 2b). Additional information on the unmanned aerial vehicle (UAV) used can be found in Table 2. During the same field campaign, we collected a TLS dataset covering ~ 6 km2, scanned from two elevated locations (see the stars near Baugur and Suðri in Figure 2b). While the drone data are mostly shadow free and allow, based on the high resolution, detailed structural and morphological analyses, the quality of the resulting mosaic and DEMs is strongly dependent on sufficient georeferencing (Müller et al., 2017). We therefore, performed georeferencing and distortion correction by point matching (tie point matching and multistation adjustment) of the Structure from Motion (SfM) data toward the TLS point cloud and yielded a high-quality dataset. Details of these datasets, their acquisition resolution, and the DEM processing can be found in Müller et al. (2017). In contrast to our paper, where the eruption area is studied, Müller et al. (2017) analyze the graben structure above the dike.
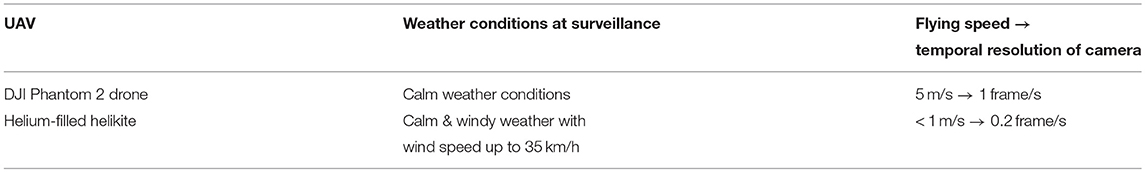
Table 2. Summary of different data sets used to analyse the fountaining behavior and morphology.
The cone morphology is compared to the fountaining dynamics. Fountaining was recorded by video cameras for the initial eruption phase (first 4 days). We used several video cameras and were hence able to record fountaining dynamics from different locations between Aug 30 and Sept 5, 2014. Due to the wind direction, haze and advancing lava flows, the locations of the cameras had to be adjusted regularly. The best locations (except the first day of the eruption) were on the northwest side of the fissure (see Figure 2). The cameras were mounted on stable tripods so that shaking artifacts were minimized. The distances between lava fountains and cameras were between 0.5 and 2 km with a Field of View (FOV) from 140 × 80 m to 320 × 180 m. The length of the videos varied from several minutes to 2 h. The two different camera types used were consumer cameras (JVC GC-PX10 and Nikon D5100), which were set to record with a frequency of 50 frames/second and 25 frames/s, respectively. Both camera types were set to a resolution of 1,920 × 1,080 pixels. The timing of the video images was recorded by an internal intervalometer and synchronized with a computer.
3.2. Analytic Methods
3.2.1. Morphology Generation and Difference
To generate a three-dimensional structure from the UAV photographs, we used the SfM approach (Westoby et al., 2012; Carrivick et al., 2016) using the commercial software package Agisoft PhotoScan Professional (version 1.2.6). After initial quality control, we generated a sparse and dense point cloud from the photographs covering the cones and craters of Holuhraun. The dense point cloud contained approximately 320 million points, only loosely placed in reference. The point cloud was then merged with a referenced TLS point cloud. The details of data processing are described by Müller et al. (2017), who used enlarged aerial and TLS data for analyzing the graben formation in the Holuhraun area, while our focus here is on the area of the eruptive vents and cones.
TLS is achieved by a ground-based Light Detection and Ranging (LIDAR) instrument, where the time delay between emitted laser pulses and its echo reception is measured (Fornaciai et al., 2010; Richter et al., 2016). By selecting different viewpoints and merging the data, we could increase the density of the scans in the far field and reduce shadowing problems (Müller et al., 2017). Therefore, we chose two different scan positions with overlap between the different scans and merged them with point cloud matching techniques as available in the Riscan Pro Software package. This method has the advantage of not needing to place ground control points (GCPs) on the difficult terrain of fresh, sharp lava flow surfaces.
The merged point cloud provides us with a very high-resolution posteruption topography database with a resampled resolution of 0.067 m, slope maps, and aerophoto mosaics that allow morphological analysis of the cones. The high-resolution data are acquired and analyzed for the Suðri and Baugur cones because we also acquired video data at these cones during the eruption.
We display the development of the morphology on one two-dimensional profile with different orientations (see Figure 2, Figure 4). This reprojection on AA' and BB' profiles (see Figure 2c) was chosen to compare the morphology to the video observations that were taken from the given camera position. The initial morphology from the videos was extracted as the outline of the vents from camera records and overview images, which were recorded from similar angles. Due to small changes in the recording position (see Figure 2), we corrected the cone outline to a common viewing point and spatial resolution. Therefore, the studied initial morphology is limited to a N-S profile and can be compared to the final morphology by choosing the same profile orientation. Furthermore, we can observe the changes in morphology during the first several days. The results are displayed in ArcMap and ArcScene using ArcGIS.
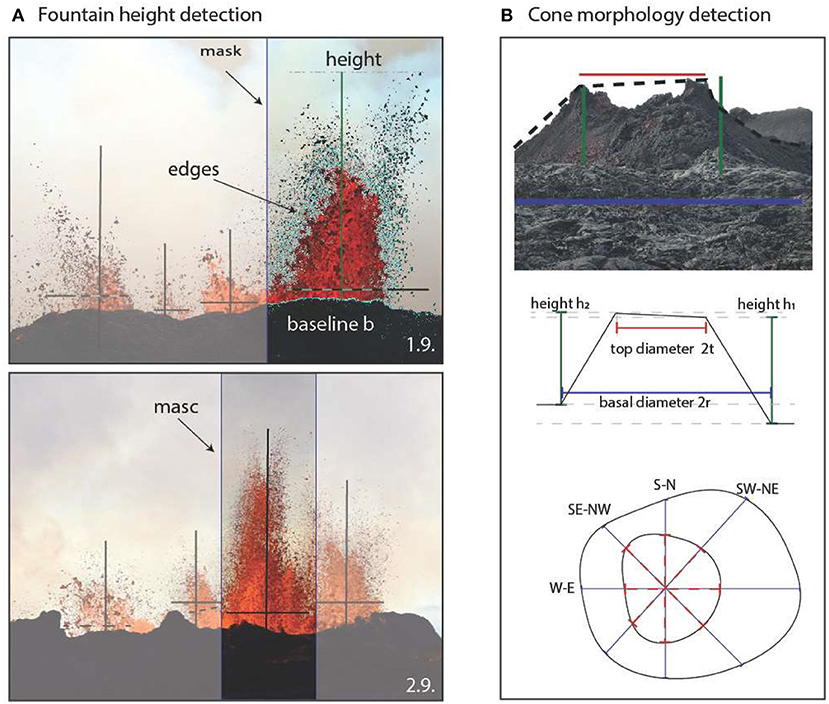
Figure 4. Methods. (A) Method for calculating the fountain height by edge detection (in cyan) on two example frames of the lava fountains at Baugur on Sept 1 and 2. After manual masking (box around fountain) the heights are extracted by the difference between the baseline and the highest fountain particles. (B) Measurement of the morphological scales of cones shown in a photo from the side and from above. For elongated cones (e.g., Baugur), the top and basal diameters depend on the chosen profile. The height is a relative measure between the base and the top of a cone.
The cone morphology is described by the basal cone diameter (2r), the cone height relative to the lowest topography (h), and the top cone diameter (2t; see Figure 4), as described by (Bemis et al., 2011). Furthermore, we calculated (after Favalli et al., 2009) the flatness f = t/r and the height-to-radius-ratio h/r by using:
Therefore, both the height-to-radius-ratio and the angle of the slope are characteristics of the constituent tephra. Due to posteruption colluvial fills and erosion, the height-to-radius-ratio decreases (Porter, 1972), which is why the morphology needs to be measured during and immediately after an eruption. Thus, the height is given with respect to the surrounding lava field, which is at an elevation of approximately 835 m. Morphologic asymmetry can be caused by persistent wind action, which leads to a locally higher deposition (Porter, 1972). Previous studies (Smith and Cann, 1992; Bemis, 1995; Bemis et al., 2011) have shown that three parameters are needed to describe the overall variance in the cone morphology: the height-to-radius ratio h/r, the flatness f, and a parameter to measure the size, such as height, top or basal radius or volume (Bemis, 1995). We therefore measured the diameters (top and base), height and slope angle. Based on the ratio of the minimum and maximum basal diameter, the cones (see Figure 4B) are separated into categories of circular (ratio of 1), subelliptical (ratio between 1 and 1.5), elliptical (ratio between 1.5 and 2), elliptical elongated (ratio between 2 and 2.5) and superelliptical (ratio > 2.5) (Dóniz-Páez, 2015).
3.2.2. Fountain Dynamics by Video Analysis
Investigation of the fountain dynamics is based on videos taken at the beginning of the main eruption from Aug 31 to Sept 5. The FOV of all video data covers the entire region between the two main cones, Suðri and Baugur. Each video shows several fountains occurring at the different vents.
To reduce perspective distortions in the videos, we attempted to record perpendicular to the fissure azimuth. First, we identify the fountains by eye. We assume that the width of the fountains is equal to the vent diameter. If the fountains overlap with each other, we assumed a larger vent diameter (sum of both), i.d. a maximum estimate of the vent diameter. Regions where activity stops are counted as “inactive” vents, and the vent diameter is zero.
To calculate the height of the lava fountains, we first convert each frame of a video into an 8-bit image based on the red channel of the camera. The red channel was found to be advantageous for this particular case of fountaining to distinguish between lava, clouds and steam (cf., Witt and Walter, 2017). Using a Sobel edge detection algorithm (Jin-Yu et al., 2009), we calculate the edges of the erupted lava fountain of each vent. All areas that are surrounded by strong edges are labeled by the regionprops algorithm of MATLAB, which measures the properties of an image region. The difference between the lowest pixel of all areas of one fountain and the highest pixel of the same fountain is the calculated height.
From the pixel domain, we convert the results to meters. The videos are scaled by factor r [cm/pixels] calculated by considering the distance between the cones and camera d [cm], the sensor size of camera B [mm], the pixel resolution of image p [pixel] and the used focal lens f [mm] by
The heterogeneous scaling arising from the different distances of the regions imaged by pixels and their positions relative to the cameras was neglected. Additionally, distortions arising from atmospheric disturbances close to hot lava flows or from the camera lens were not corrected. However, we validated the general scaling results by the analysis of falling particles assuming frictionless conditions, as performed in other previous studies (e.g., Voight et al., 1983; Taddeucci et al., 2012a; Witt and Walter, 2017). Due to different focal lenses and distances to the vents, the scaling factor has to be calculated for each video separately, and the minimum size of detectable particles varied for every video. To compare the different heights, we calculated heights of only particles larger than 20 cm, which is the smallest particle that can be clearly detected in every video. For the width, the outline is calculated in the same way. Subsequently, the width of the fountains has to be picked manually (Figure 4B), and has to be checked carefully due to overlap of the aligned fountains.
4. Results
4.1. General Overview
The main 2014–2015 Holuhraun fissure eruption began on Aug 31, 2014, and started as a long fissure (see Figure 3A) with an azimuth angle of N12°E. The length of the fissure is marked by near continuous fountaining activity, which is more than 1.9 km in length. The video records clearly show pulses at 57 fountains aligned along the fissure. In the north (later location of Norðri), the video records show that the fountains are slightly lower and more separated than in the south (later location of Suðri and Baugur). The highest and most powerful fountains are seen at the locations where the Baugur cone formed in the following days (see Figures 3A,B).
On the second day, the activity started to concentrate at fewer distinct locations (see Figure 3b), while the fountain height increased. The main activity had already concentrated at Suðri and Baugur on day 1 (see Figure 3c). This trend of activity concentration continued in the following days (see Figures 3d,e), gradually changing the morphology of the fissure from spatter ramparts along the active vents to cinder cones with few vents inside them. The fountains increased in height at Baugur between days 3 and 4 (Sept 2 and 3). At Suðri, in turn, fountain heights were stable.
The change from an almost continuous line of fountains to fewer distinct vents consists of 3 phases that blend into each other. (i) The first phase started on Aug 31 at 4:00 UTC and lasted for 22 ±4 h until Sept 1 at 2:00 UTC. This phase consisted of a nearly continuous line of fountains with a length of approximately 2 km. During that time, we identified 57 fountains (see Figure 3a, Figure 5A). The number of fountains decreases quickly, with this trend being fastest in the northernmost part of the fissure (see Figure 5B, blue line and Figure 3c). (ii) The second phase started on Sept 1 at 2:00 ± 4:00 UTC and had a duration of 73 ± 7 h until Sept 4 at 3:00 ± 3:00 UTC. This phase started with nearly continuous activity from 19 fountains for 1 day, and it is characterized by a zone with almost no activity between fewer large spatter cones in the north (later called Norðri) and the cones further to the south (see Figure 5B, red line). During this phase, the activity at the southern part was also focused at some larger vents (later called Baugur and Suðri). (iii) The third phase started on Sept 4, and all the activity was concentrated at three main spatter cones (i.e., at Norðri, Baugur, and Suðri) and some smaller unnamed vents (see Figure 5a, green line and Figure 3) with a total of 10 lava fountains. On the last day of our fieldwork (Sept 5), two fountains were observed at Suðri, one at each vent. One fountain occurred at the later location of Heimasætan, four fountains at Baugur, and three fountains at Norðri. The decrease in the fountain number seems larger at the beginning of each phase (see Figure 5a).
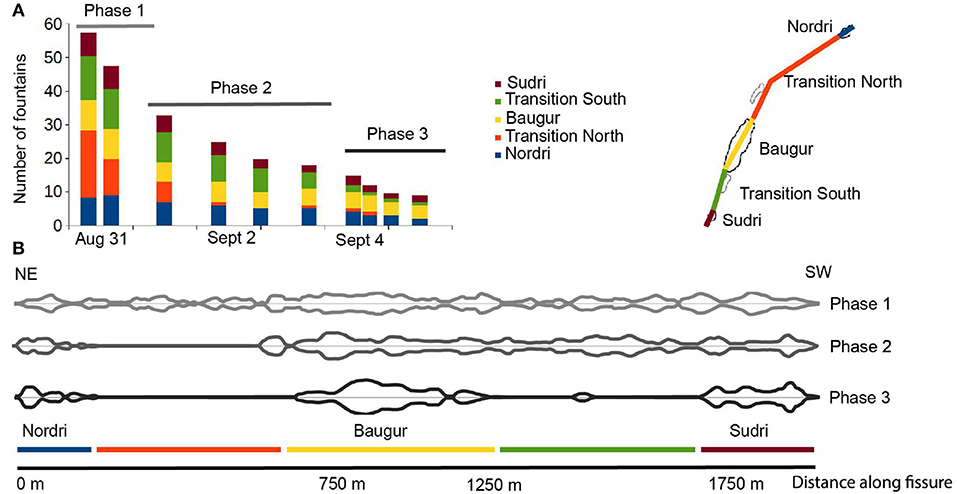
Figure 5. Numbers of fountains. (A) Number of active fountains during the first few days of the 2014–2015 Holuhraun eruption. The different phases of the first 5 days of eruption are color coded in gray from light (Phase 1) to dark (Phase 3). The number of fountains for each segment is obtained from overview images. The segments are color coded with blue for Norðri, red for the transition zone in the northern part, yellow for Baugur, green for the transition zone in the southern part, and brown for Suðri. The position of the different segments is shown to the right. (B) Vent distribution during the 3 different phases observed during the first days of the eruption in the overview images, as shown in Figure 3. The width of the different lines shows the diameter of the vent at that position. We assumed that the width of each fountain is equal to the diameter of the vent. Areas with no vents are defined as inactive. The segments are indicated by colored lines below the profiles. The decrease in the number of active vents is clearly seen. From Phase 1 to Phase 2, a decrease in the northern transition segment (red) can be observed. Between Phase 2 and Phase 3, a decrease in lava fountains occurs in the southern transition segment (green). Furthermore, the local distribution shows that the decrease in activity of lava fountains starts from the north and propagates to the south.
4.2. Morphology of the Cones
The preexisting morphology, as measured from satellite data, allows the manual identification of 19 cones or remnants thereof oriented along a line with an azimuth of N14°. The 19 cones were made up of eleven small cones (see Figure 6a, cones 4, 5, 9, 10, 12, 14, 15, 16, 17, 18, and 19) and eight large cones. Four of these large cones were well expressed and circular in outline (cones 3, 7, 8, and 13), with radii of 30 m (cone 8), 40 m (cone 13) and 50 m (cone 3 and 7). Cone 1 and cone 2 were partially overlapping at an azimuth angle of N116°, and thus, they were almost perpendicular to the overall cone trend of N14°. Cone 1, with dimensions of 115 × 85 m, was larger than cone 2, with dimensions of 70 × 60 m. Cone 6 was elongated N12° and had dimensions of 50 × 85 m. Cone 11 also had a similar long-axis azimuth angle (N10°) and dimensions of 40 × 25 m.
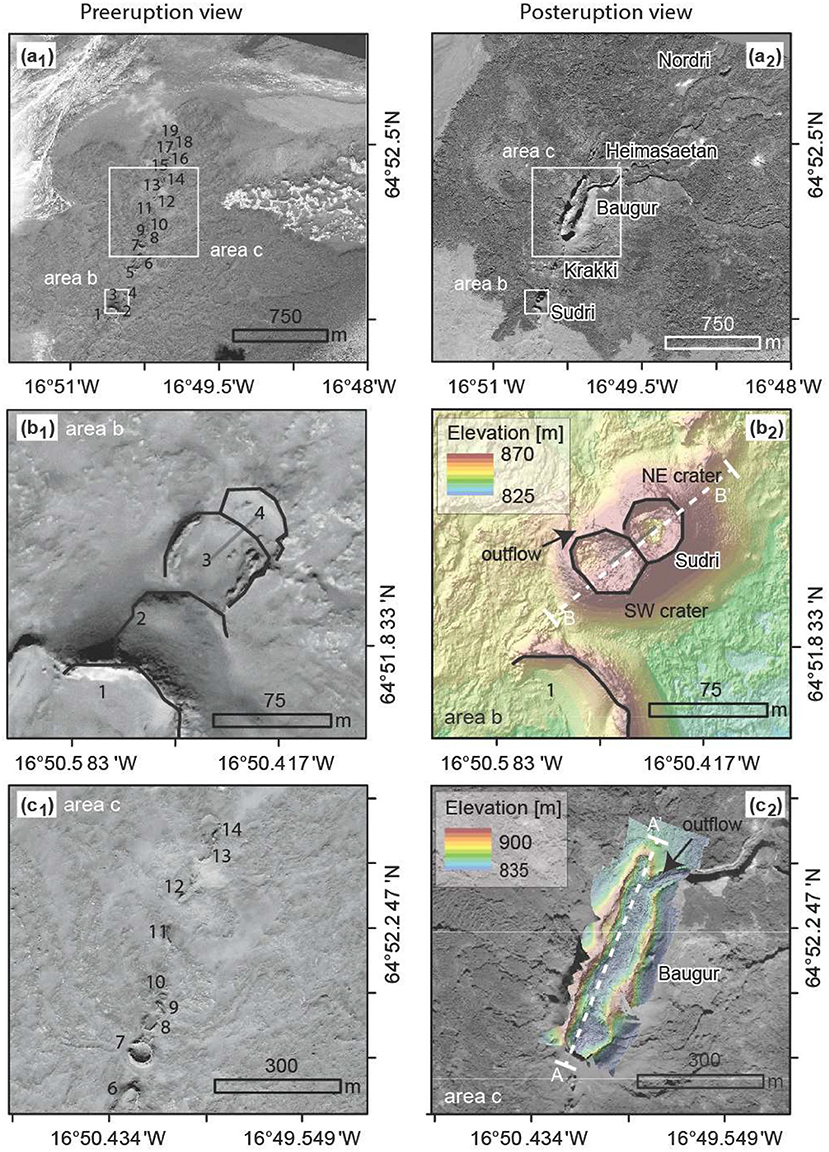
Figure 6. Morphology of the cones. (a) Right image (named with lowercase 2), based on DEM and hillshade, shows the topography after the eruption, and the left image (named with lowercase 1), based on WorldView-2, shows the topography before the eruption. The numbers indicate the different craters from previous eruptions, which were covered completely by the fresh lava. Closeup of the cones Suðri (b) and Baugur (c) using the same data. The final topography of the Baugur and the SuDri cone generated by the Structure from Motion (SfM) algorithm with aerial photos of a field campaign in summer 2015. The profile lines of the cone morphology during the initial phase (Figure 7) are given in white. (b) The outlines of the craters are given in black. The rim of the older cone 1 (b1) can also be seen after the eruption (b2). The orientation of cones 3 and 4 (b1), and the SW and NE craters (b2) are given in light gray. The orientation is the azimuth of the connecting line between the center points of the cone and craters. This orientation is similar for both situations. (c) The Baugur cone (c2) is located at the same place as the former cones 7–13 (c1). The orientation of these row of cones (c1) is the same as the elongation of the Baugur cone (c2).
The 2014–2015 Holuhraun eruption caused significant changes in the preexisting cone morphologies of the 1797/1798 eruption that are observed in video and photogrammetric data, discussed in the following in more detail. The cones of the 2014–2015 Holuhraun eruption form a line with an azimuth angle of N12°. In the following section, we detail the changes in morphology from SW to NE in accordance with the FOV of the video cameras. The height of the cone morphology is calculated as the difference between the lowest topography and the highest rim of the cone (see Figure 4B).
Suðri: Suðri shows two distinct vents aligned N57°, differing from the general trend of the fissure eruption (N12°). Comparing the preeruption morphology (see Figure 6b1, cones 3 & 4) and the posteruption morphology (see Figure 6b2), we can observe that the orientation of cones 3 & 4 is the same as that of the two vents (see the gray lines in Figures 6b1,b2). The orientation is calculated by the azimuth of the connecting line of the center points of each vent. During the first day of the eruption (Aug 31, 2014), the different vents were not yet formed. The fissure morphology was nearly constant, and no large morphological variations were observed at this eruption site. On Sept 1, the cone morphology started to grow, as evidenced by the outline in the video data (see Figure 7). The highest rims of the Suðri cone were in the northeast, 14.3 ± 0.1 m, and in the southwest, 13.2 ± 0.9 m. During the next several days (Sept 2 to 4), the vents grew in height and width (see Table 3). At both vents, the rims were lower in the northwest (toward the camera position: see the dashed line in Figure 7) than in the southeast. The northeast slope was nearly constant at an angle of 57.4 ± 0.9°, whereas the slope in the southwest became steeper (58.2 ± 1.5°) (see Table 4). The southwestern vent grew faster than the northeastern vent. The depression between the vents was filled with erupted material from the fountains, establishing a shared crater rim. Therefore, the distance between the two vents decreased in length from 15.6 m to 7.1 m on Sept 4 (day 5 of the eruption). As the vents grew faster than the refilled depression, the vent height increased to 6.3 ± 1.0 m, even though the lower edge of the depression was higher (see Table 4 and Figure 7).
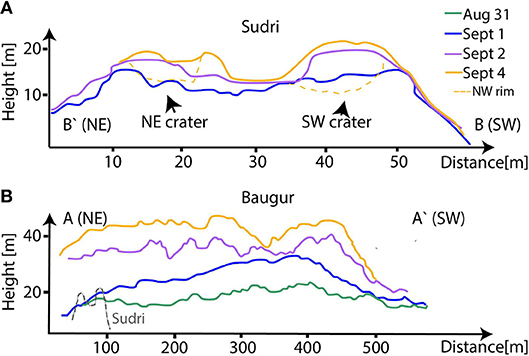
Figure 7. Evolution of the topography at the Suðri (A) and Baugur (B) cone during the initial phase. The height of the cones is calculated based on the baseline (see Figure 4B). The days are color coded (green: Aug 31; blue: Sept 1; violet: Sept 2; orange: Sept 4). The location of the profile lines (A-A' and B-B') are shown in Figures 2, 6. The cone rim of the later Suðri crater on Sept 4 is shown in gray within the Baugur profiles (B) for better comparison. The dashed lines show the crater rim in the front, i.e., the crater rim in the NW.
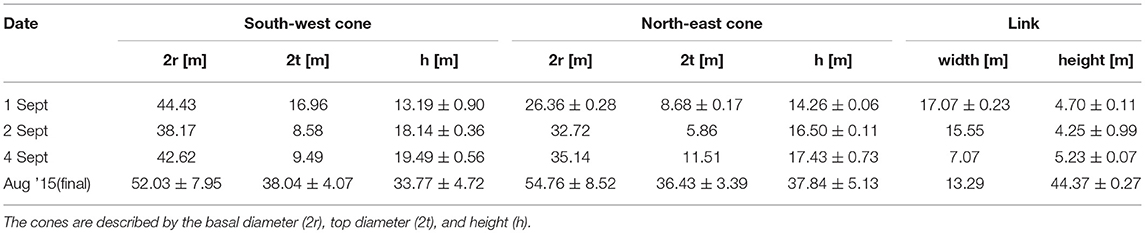
Table 3. Cone morphology of the two cones of Suðri.
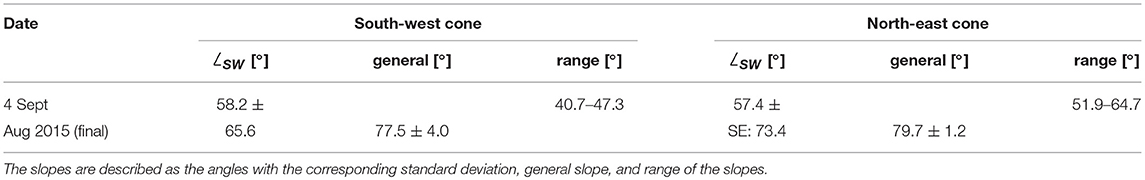
Table 4. Slope information of the flanks at Suðri.
Furthermore, an outflow of the southwest vent to the north-northwest can be observed starting on the evening of Sept 2 (day 3 of the eruption). The rim at the outflow is 16.9 m high, which is approximately 1 m lower than the rest of the cone rim. The next day, the difference between the outflow and the rim increased by up to 3 m.
The final morphologies of both Suðri vents as measured by UAV data are similar (see Figure 6). The cone rim is high in the southeastern part and decreases to the northwest. The depression is located to the southwest, and it is shifted closer to the cone wall between the two vents. The southwestern vent has an outflow in the northwest, resulting in a low cone rim height of 19.1 m. The mean slope of the flanks is high, 77.5 ± 4.0°, whereas we observe a lower slope at the southwestern flank. Both craters are symmetric and subelliptical (i.e., the min-to-max ratio of the basal diameter is 1.5) in map view, while the whole Suðri is an asymmetric, multiple superimposed cone.
In summary, by comparing the final topography with the initial eruption phase of Suðri, we can conclude that the main morphological features are established at the early stage of the eruption. The preferred outflow location at the southernmost cone can be identified in the initial phase. At the northern vent, the northwestern rim remains low during the whole eruption. The southwestern flank is steeper than the northwestern flank, both during the initial phase and after the eruption. During the eruption, the vents grow and become closer.
Baugur: The Baugur cone (see Figure 6) is elongated and has the largest expansion in the north-south direction (N18°E), aligned with the eruption fissure. Comparing the pre- and posteruption satellite data, we observe a consistent orientation between this eruption cone and previous cones (see Figure 6c cone 7–12). The Baugur cone is the largest cone during the initial phase and during the whole eruption period (Pedersen et al., 2017), and the outflow at Baugur is the main feeder of the Holuhraun lava field (Figure 6a). Baugur hosts a lava pond, which can be seen on aerial photos on Sept 1, 3, and 5 (see Figure S1). Our camera data reveal that several fountains were active, which affected the cone morphology and the height might have been affected by the crater filling lava pond, which could be observed during the whole initial phase by flyovers.
On days 1 and 2 of the eruption (Aug 31–Sept 1, 2014), the cone was growing slowly. From days 2 to 3, we observed large morphology changes, as represented in Figure 7 (blue and green lines). During that period, the height grew from 11% (47 ± 8 m) to 28% (56 ± 13 m) of the final height (78.5 ± 1.0 m, see Table 5 for height values). On day 3, the cone rims in the south and north grew significantly and changed the shape from more hill-shaped to an elongated cone shape (Figure 7B). Therefore, the basal diameter appeared quite stable, whereas the top diameter changed significantly. Due to the irregular growth of the cone over the length, the top diameter decreased between days 1 and 2 from 392.9 m to 250.8 m, respectively. After day 3, the main features appeared to be established, and the overall shape did not change much.
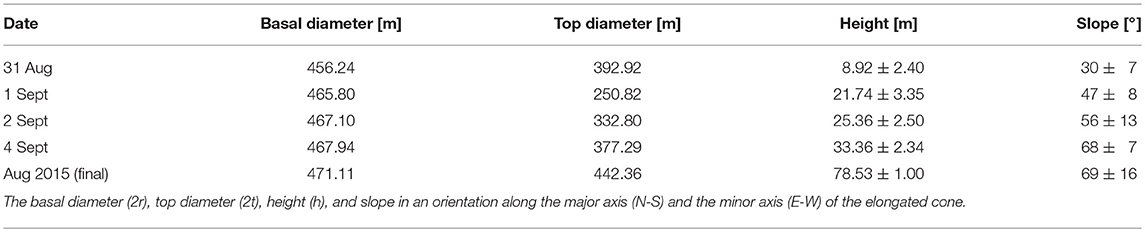
Table 5. Cone morphology evolution of Baugur.
The final basal width and top diameter are irregular, as seen in the large range in the profiles from southwest to northeast (e.g., see Figure 11 and Table 6), with the northern region being slightly smaller than the southern region (see Figure 6c). The height ranges from 51.4 to 105.5 m. Most of the variation in the Baugur height is hence found on the western and eastern flanks. The slopes in the east and west show large variations between 32° and 81°. The slopes in the north and south are very stable over the entire eruption. Baugur hosted a lava pond, which was the main feeder of the advancing lava flow through an outflow in the northeast (see Figure 6c). The cone is a superelliptic, multiple coalescent cone.
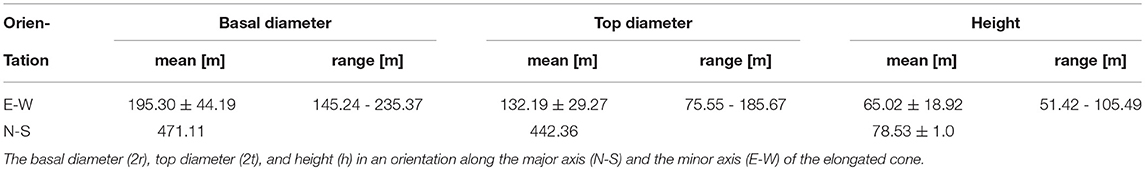
Table 6. Final cone morphology of Baugur based on the drone surveys on Aug 14/15, 2015.
Baugur has an outflow channel located in the north and oriented to the northeast. This outflow has a basal diameter of 57.3 m, measured at the rim of Baugur, and a top diameter of 34.5 m. The height of the rim of the outflow is 63.7 ± 3.6 m above the surrounding lava fields and is 7 m higher in the north than in the south. Additionally, the slope in the north is 82°, which is much steeper than the slope of the outflow in the south, which is 65°.
In summary, the Baugur cone was the largest cone since the start of the eruption. During the eruption, the height of the cone increased significantly. Consequently, the final Baugur cone (Aug 2015) was approximate twice the height of the cone after the initial phase (Sept 4, 2014). The initial and final shapes of the Baugur cone show that it did not become significantly elongated. Overall, the spatial dimensions (width and elongation) and the large outflow could be identified on day 3 of the eruption. The video cameras viewing angles allowed the outflow channel morphology to be detected in the initial phase.
4.3. Comparison of the Cone Morphology at Suðri and Baugur
Suðri and Baugur both show a strong dependency on the preeruption morphology. Each of the cones hosts few vents. The orientation of the cones in the preexisting morphology was the same that in the posteruption cone morphology; the azimuths of the vents were N18°E (Baugur) and N57°E (Suðri).
The cones consisted of two small craters (Suðri) and one large crater (Baugur). Each crater hosted lava ponds (see Figure 1). The number of vents, i.e., lava fountains, for each crater changed with time. At Suðri, the vent number decreased to 2–3 during the first 4 days of the eruption, while Baugur hosted approximately 5–6 lava fountains on Sept 4.
The geomorphological shape of the cones is rather different. While at Suðri the vents are nearly circular, Baugur shows an elongated (superelliptical) vent with a clear orientation toward N18°E. Considering the growing vents, the overall shape of both cones is nearly stable, and many features and geometric characteristics are either found in the preeruption data (e.g., orientation) or formed at the beginning of the eruption (days 2–3; e.g., outflows and elongated cones/cones with two craters). At both cones, the growth of the crater rims was not equal, and the growth was remarkably faster at the some locations. This phenomenon can occur due to the position of the lava fountains (e.g., at Baugur) or due to the wind direction. One feature established during the first days of the eruption was a lava outflow (see Figure 6 b2,c2). At Suðri, only one of the vents showed this outflow. Both flows were directed mainly northward but were released to different sides of the vents with Suðri to the NNW and Baugur to the NNE. Both show a slope steeper than 60° at the end of the initial phase and in the final morphology, but the slope at Baugur steepens later than that at Suðri.
4.4. Fountaining Behavior—Height
The Holuhraun eruption started as a fissure eruption with an almost continuous line of 57 lava fountains. Our video monitoring data reveal that within the first 48 h, the activity was focused at 4 main locations associated with the development of the cones. Commonly, the cones host 2–5 vents, which are partially separated in different craters (e.g., in 2 craters at Suðri). At each of the craters, we identify the highest and most active fountains. Over the whole time series, we observed pulses in fountaining, and consequently, we observed a strong short-term variation in the eruption height and width, which is mirrored in the large standard deviation of the mean height. The time between the pulses is shorter than the time the erupted material needs to fall down. Consequently, the lava fountain heights are always higher than zero.
Suðri: On the first day (Aug 31, 13:00 UTC), the lava fountain heights observed in the south were low. The mean height of these low fountains is 7.3 ± 2.7 m with a maximum height of 17.5 ± 0.3 m at the NE crater (see Figure 8C) and slightly higher at the SW crater with mean fountain heights of 10.7 ± 3.6 m and a maximum height of 23.3 ± 0.3 m (see Figure 8B). On day 2 (Sept 1), we observed a significant increase in the lava fountain heights reaching a mean height of 27.3 ± 13.7 m with a maximum height of 63.8 ± 0.5 m at the NE crater and a mean height of 29.3 ± 13.4 m with a maximum height of 67.5 ± 0.5 m at the SW crater. On day 3 (Sept 2), the lava fountain heights reached similar mean heights as the day before, and the activity was reduced to 4 fountains, with a mean height of 28.7 ± 7.1 m and a max height of 63.8 ± 0.6 m at the NE crater and a maximum height of 69.8 ± 0.6 m and a mean height of 31.5 ± 12.8 m at the SW crater (see Figure 8). The variation in the lava fountain heights at the NE crater is much smaller than that on Sept 1 and that at the SW crater, resulting in a more stable height. Two of four fountains at the Suðri cone are located at the multiple superimposed cone of Suðri, one fountain in each crater, and two fountains are between the Suðri cone and Baugur cone, close to the Suðri cone. The fountains in the SW crater are slightly larger than the fountains in the NE crater.
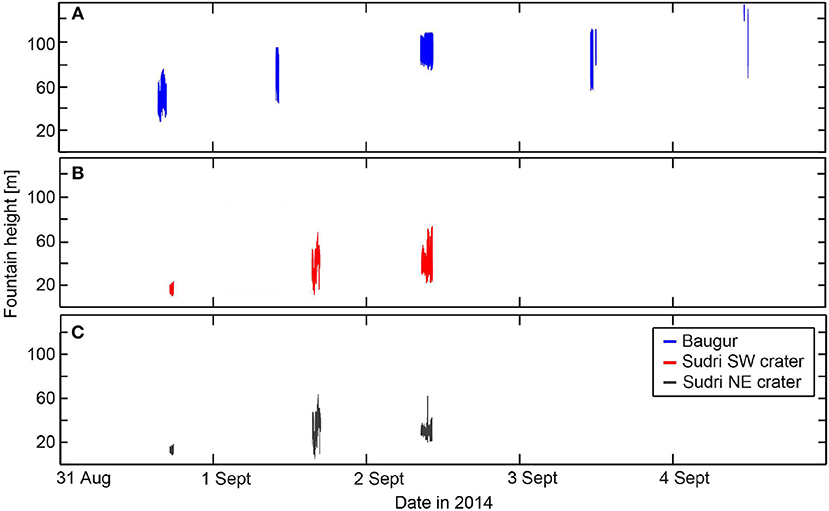
Figure 8. Fountain heights for Baugur (upper row) and Suðri (lower rows). Due to the pulsating behavior of the lava fountains the fountain height fluctuates. The height is calculated as the difference between the highest fountain particles and the baseline b (see Figure 4A). Baugur and Suðri show an increase in the fountain height during the first 3 days of the eruption. On day 4, the mean height decreases. The lava fountain height at Baugur (A) shows the highest fountains with heights up to 130 m, while the fountains at Suðri reach heights up to 70 m (B, red line), with slightly lower heights at the northeast crater (C, black line).
Baugur: The lava fountains at the location the Baugur cone forms during the next several days are the largest fountains in terms of height. On the first day (Aug 31), we observed fountains with heights up to 71.5 ± 0.4 m, with a mean height of 46.5 m and a standard deviation of 6.6 m (see Figure 8A). These fountains were the highest in the line of fire on day 1 of the eruption. After focused venting began with fewer vents (day 2), the mean height of the main fountains further increased to 64.1 ± 12.4 m with occasional fountain pulses reaching a maximum height of 91.5 ± 0.3 m. On day 2, we observed 5 fountains, two in the northern part of Baugur, one in the southernmost part and two in the middle to southern part of the cone. The 2 in the middle appear dominant, much higher than the other three and increasing in intensity with time. The location of the highest fountains is between the middle and the southern parts of the Baugur cone. The fountain in the southernmost part appears separated from the others by up to 30 m and shows the smallest height, between 41 and 58% of the max fountain height. The two in the north are between 54 and 75% of the main fountains and 1.2 to 1.8 times higher than the southern fountains. The fountains in the middle are close together with a distance between them of 1.9 ± 0.9 m. On day 3 (Sept 2), the mean height has further increased to 92.2 ± 6.9 m with a pulsating maximum height of 105.7 ± 0.5 m. During day 4, the heights and fountain locations were nearly stable, with a mean height of 96.9 ± 13.3 m and a maximum height of 109.2 ± 0.2 m. On day 5 (Sept 4), the activity increased again to 126.4 ± 4.2 m and the highest fountain reached 133.0 ± 0.7 m. A slight decrease in heights was observed in the evening.
4.5. Height-to-Width Ratio
The height-to-width ratio is the maximum height of the lava fountain divided by its width at the same time. This height-to-width ratio clusters into two discrete groups—one for the fountains at Suðri (see triangles in Figure 9A) and the other for those at Baugur (see squares in Figure 9A). We find that the ratio is nonlinear; the height-to-width ratio of the fountains on the first day of the eruption is higher than that of the fountains at the end of the initial 4 days. In other words, the fountains first grow in height and then in width. Moreover, the ratio for each group becomes more stable with time, resulting in less scattering on the last day. We observe that the fountains at Baugur with the same width at those at Suðri are much greater than those at Suðri. The width of Suðri is clearly limited to the width of the craters (i.e., the inner radius of the cones), which are 24 m for the northeast vent and 32 m for the southwest vent. The mean height-to-width ratio (see Figure 9B) decreases at Suðri from 4.0 ± 0.8 (Aug 31) to 2.7 ± 0.5 (Sept 4), while at Baugur, we observe a decrease from 8.6 ± 1.8 (Sept 1) to 5.0 ± 0.9 (Sept 4), showing that at Baugur, the height-to-width ratio is 2.0 ± 0.2 times larger than the ratio at Suðri. The decrease in the ratio suggests that the relative increase in height is slower than the relative increase in width.
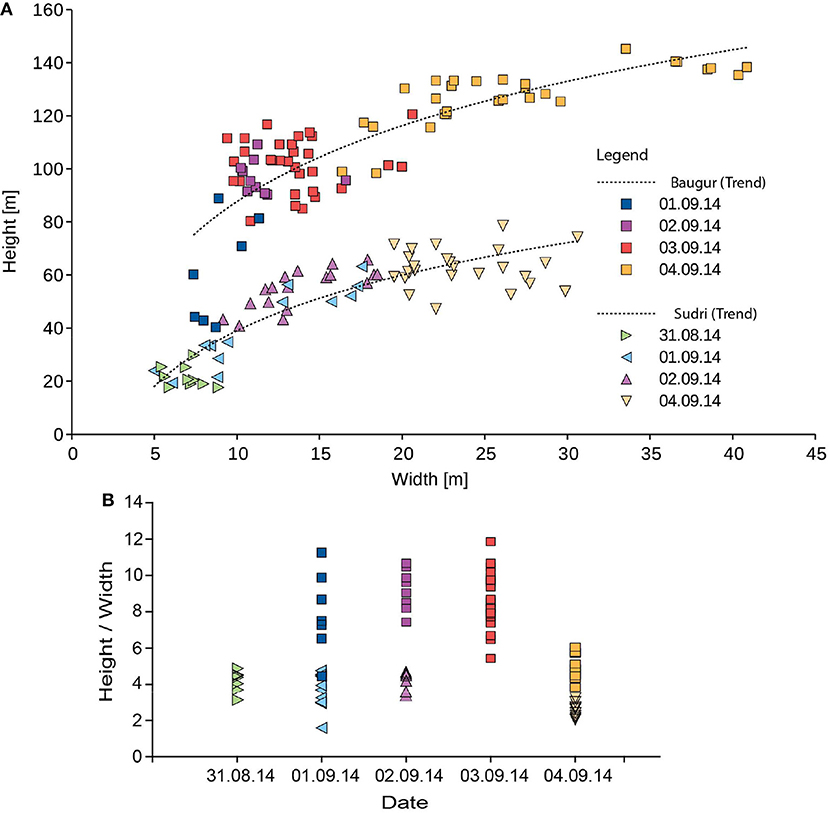
Figure 9. Height-to-width ratio of the lava fountains at Suðri and Baugur. (A) The fountain height is the maximum height of the analyzed lava fountain pulse, and the width is the largest vertical extension at that time (see Figure 4). Each crater shows a specific cluster (Baugur as squares, Suðri as triangles and the time color coded). Both locations display an increase in height and width with time. (B) The height divided by the width of the lava fountain for every day is plotted. Both cones (as in A: Suðri as triangles, Baugur as squares and the time color coded) show a decrease in the ratio over time. Furthermore, the ratio at Baugur is approximately twice the ratio at Suðri.
4.6. Comparison of the Fountain Dynamics Between Both Cones
Both cones show an increase in the height of the fountains during the initial phase (see Figure 8) and a decrease in the number of fountains (see Figure 5A). The variations at Suðri are smaller than those at Baugur, resulting in an unequal short-term fluctuation. The fountain heights for the two craters at Suðri are similar to each other; however, the lava fountains at the SW crater are slightly higher. The lava fountains within the Baugur cone are much higher than those within the Suðri cone. Furthermore, the increase in the lava fountain height is stronger at Baugur. A similar behavior is seen in the comparison of the ratio between the height and width. We observe that the ratio at Baugur is twice the ratio at Suðri. In addition, both cones show a similar behavior as the ratio decreases with time.
4.7. Comparison of the Morphology and the Fountain Dynamics
The lava fountain activity first occurred along a continuous fissure and then concentrated at distinct locations. We observed that the cones developed at locations where preexisting cones were located in the topography. As the fountains developed, their height increased and the number of fountains decreased. These fountains controlled the shape of the developing cones. We observed that lava ponds developed at the dominant fountain locations at both Baugur and Suðri. Moreover, we observed the largest changes in the spatter cone height and cone diameter in those areas for the most active and highest lava fountains. Additionally, near the outflow locations, the cone morphology appeared smoother (seen at Baugur and the NW vent of Suðri). At Suðri, we found that the SW vent grew faster than the other vents, where we observed slightly higher fountains during the whole eruption. At Baugur, several fountains formed in an elongated cone, while at Suðri, two fountains were hosted in two separated circular cones, which were connected. Therefore, at Baugur, we observed an interaction among the fountains, while at Suðri, the fountains were clearly separate. We conjecture that the differences in the fountaining behavior are induced by the different morphologies of the cones. However, the cones and craters allowed the generation of lava ponds, which in turn may have controlled the fountains as discussed in the following section.
5. Discussion
The 2014–2015 Holuhraun eruption in Iceland offered the unique opportunity to closely observe lava fountaining and measure topography at high resolution, allowing the study of the number and height of lava fountains and the changing morphology of associated spatter cones. Lava fountain eruptions show a characteristic evolution in their height and width at different cones during the first days of the eruption. Based on the ratio between width and height, we can distinguish between the different cones. Additionally, the cone morphologies evolved over the first 5 days, reaching a geometry that is similar to the final (posteruption) morphology, implying that the morphologic expression and focusing of fountains was established at the early stage of the eruption. We identified a large lava pond at the Baugur cone and smaller, separated vents at Suðri, including smaller lava ponds. Moreover, we observed the highest fountains at Baugur and smaller fountains at Suðri. Before discussing the possible interrelation between cone morphology, fountain height, and lava ponds, we will discuss the limitations of our data and analysis methods.
5.1. Limitation
The satellite data (WorldView-2) have a rather coarse resolution of ~ 0.5 m at best. The drone-based data, in turn, provide fine resolution at a 0.05 m scale but have the limitation that only dedicated areas could be mapped, such as the area of the spatter cone of Baugur. We selected key areas close to the two eruption sites: over these areas, we performed systematic surveys by drones and acquired video data. Therefore, while our database is robust for these key areas, other segments of the eruption site were not imaged by UAV. We could partially solve this problem by combining the UAV -based results with a TLS campaign. The TLS instrument had a scan range of up to 6 km, allowing even distant objects to be measured with high precision, although the point coverage decreases with distance. Consequently, we obtained a very good resolution for our two main cones.
In general, optical and infrared cameras transported on aircraft or on UAVs allow the detection of small-scale changes in topography and thermal anomalies (Tiede et al., 2005; Nakano et al., 2014). The analysis of volcanic areas based on cost-effective UAV data acquisition techniques is gaining importance (Amici et al., 2013b; Nakano et al., 2014; Müller et al., 2017). Nevertheless, some practical and technical problems may occur mainly due to complex terrain, wind (which may cause drone crashes), and changes in sun position (that may reduce the quality of the images). As the development of drones is quite rapid, newer UAVs that allow longer flight times and distances can possibly lead to improved data coverage for future campaigns. As the achievable quality of the DEMs depends critically on the quality of the photographs, systematic issues, such as oblique angles to the ground or coarse resolution, are directly transformed into geometric errors. As the SfM point could tend to bend at the edges, our data between the Sudri crater and the Baugur crater are quite limited. To minimize the effect of the bending and minimize camera internal errors (e.g., due to the use of uncalibrated cameras, James and Robson, 2014), we checked and corrected our UAV dataset using a TLS dataset. Nevertheless, for the crater, the accuracy is usually on the order of a few centimeters. Flight heights of 100–150 m limit the resolution and therefore, the accuracy of the 3D model reconstruction. This limitation has to be taken into account at very steep flanks.
Video monitoring data are simple to acquire during fissure eruptions and provide a unique data source, as demonstrated in this work. However, only very few videos exist for eruption fountains where the camera position was held constant for minutes or even hours. In most cases, handheld cameras or only a few tens of seconds of recordings are available (Spampinato et al., 2008; Witt and Walter, 2017). However, video monitoring contains various sources of systematic and nonsystematic errors. Potential error sources may arise from geometric effects (survey design and optics), temporal and spatial resolutions, random factors (such as atmospheric conditions, e.g., steam, ash or cloud cover), and operator errors occurring during recording (e.g., shaking or camera position) and/or during image analysis (Major et al., 2009; Diefenbach et al., 2013). One of the main sources of errors during data collection is the camera itself because of distortions in the images, which are also difficult to quantify (Formenti et al., 2003). The distortion is largest at the edges of the FOV; therefore, we concentrate the study on the fountains at the middle of the images. Here, the cameras were situated a few kilometers from the cones, which is why the resulting distortions of the important areas are assumed to be small. Areas that were too far for video recording were not investigated further, such as the northern part of the fissure. Therefore, the 57 identified vents may be an underestimate of the total number of vents.
The videos were not recorded continuously and at all cones simultaneously, and the timing and geometry of acquisition were not optimal. The videos are up to 2 h long; thus, we can resolve only short temporal disparities and not the whole eruption development. Although we observe very stable results during the 5-day eruption episode, we cannot determine whether the variations described by our data remain stable, show daily variations or other interdependencies. The camera positions had to be changed repeatedly due to the lava field advancing toward us and due to the changing wind conditions exposing us to haze. As a result, the distance to the vents increased during the different recording days (see Figure 2). The most problematic aspect of changing recording position is the change in the FOV and viewing angle, which had to be recalculated for the comparison of the morphology analysis.
Due to windy weather conditions, the cameras were subject to small amounts ofshaking, even though we used robust and heavy tripods. Furthermore, high winds transported ash through the air. As a result, videos appear blurred and small fragmented particles are more difficult to detect on these days (Sept 1 and Sept 2 at the end of the recording). Additionally, due to hot air, the same blurring effect can occur (Aug 31 at the northern part). Consequently, the pulses of one vent may interfere with the pulses of adjacent vents, especially at Baugur, and the results of individual vents can be biased by spatters from adjacent vents. These interfering activities complicate the calculation of fountain widths, especially at Baugur. Here, we had to manually distinguish between the different fountains. At Suðri, the effect was negligible due to the separated vents.
Subpixel variability, related to changes in the surface characteristics (e.g., color or shape) and to rotational movements of the irregular spatters, can affect the results of our imaging technique (Walter et al., 2013). With decreasing particle brightness (due to cooling of the lava), the pixels can be categorized as background and not as particles. Consequently, the size and height might be underestimated. To evaluate the impact of this underestimation, we performed a periodical manual check of the height, showing that this effect was less than the 2% of the height.
5.2. Model of Lava Fountains
To discuss the observed variations in the height of lava fountains and the associated morphologic development of spatter cones and lava pools, we formulate a simple conceptual and physical model. The height of the lava fountains is a function of several factors (Parfitt et al., 1995): the content of exsolved gas within magma, the eruptive volume flux, the amount of re-entrainment of degassed lava, the magma rise speed, and the degree to which bubble coalescence effectively depletes gas from the magma. We calculated the lava fountain heights, which combines the results from 3 model parts: the first is based on a Poiseuille flow within the underlying dike, the second is based on magma and bubble ascent in the feeding conduit (Gonnermann and Manga, 2013) and the third part is a lava fountain model influenced by conduit diameter and lava pond depth (e.g., Wilson et al., 1980, 1995). The lava fountains of the 2014–2015 Holuhraun fissure eruption are thought to be fed by vertical conduits with a length of ~ 300 m (Eibl et al., 2017), rooting at the dike beneath (Sigmundsson et al., 2015; Ruch et al., 2016). As we calculate the lava fountains after the channeling of the magma is established and after the seismic tremor is seen at that depth, this is a acceptable assumption. We use the Holuhraun eruption and dike parameters given in previous studies (see Table S1 in the Supplementary Material), and the lateral magma flow velocity in a dike of length L is calculated by , with an excess pressure driving the magma ΔP of approximately 1.6 MPa, a dynamic viscosity η of 100 Pa s and an average dike radius R of 7.5 ± 0.3 m (Ágústsdóttir et al., 2016). Magma propagation velocities of 2.3 m/s within the dike have been estimated based on an initial flow rate of 400 m3/s, which is in agreement with observed propagation rates (Ágústsdóttir et al., 2016). The above formulation suggests a flow velocity vz of 2.58 ± 0.14 m/s within the lateral dike. This formulation is in good agreement with our calculation, although we expect a high Reynolds number (~ 310 ± 100), indicating the absence of pure laminar flow. Assuming laminar flow within the horizontal dike, a velocity vz of 2.58 ± 0.14 m/s, a depth of vertical feeder conduits of 300 m (Eibl et al., 2017) and a water vapor content of 0.5 wt% (Gíslason et al., 2015), we calculate the height of the expected fountains exceeding 300 m even for narrow vertical conduits (see Equation 4). The depth of the vertical feeder conduits is based on the analysis of the graben structure at the surface. The resulting lava fountain heights are much larger than the observed 133.0 ± 0.7 m height at the Baugur crater during the day 5 observations, although we note that the height might have increased later.
A slight decrease in the depth of the feeder conduit h (cf. Figure 10A and Table S1 in Supplementary Material) would decrease the initial lava fountain height Hinitial (see Equation 4). An error of a few meters of h would affect the height change by less than 2%. Therefore such an error could not explain the observed heights. The propagation velocity within the feeder dike with the given errors (vz = 2.58 ± 0.14 m/s), leads to a variation in the lava fountain heights of a few meters only. Compared to the absolute heights of hundreds of meters, this effect is minor. In comparison, a larger influence on the lava fountain height results from the variation in conduit radius r, which we investigated by varying this parameter. However, the range of radii investigated (2–3 m for both, Sudri and Baugur) produce lava fountain heights that are higher than the observed heights, implying that the radii are even smaller, or that another factor might reduce the eruption height. Altogether, for a constant magma pressure, the two factors that have largest influence on the fountain heights are (i) the conduit radius r, and (ii) the depth of the lava pond hpond that is effectively reducing H as demonstrated in the following.
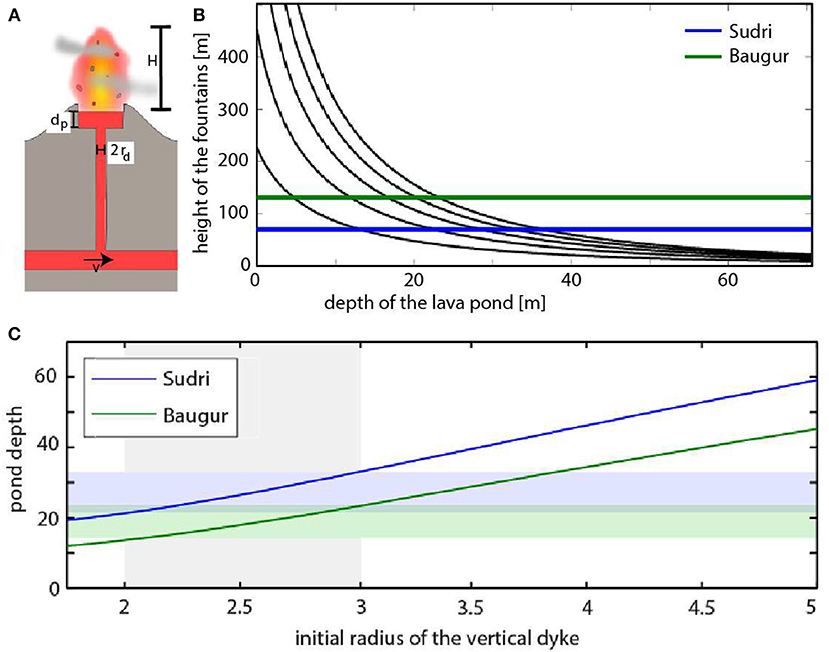
Figure 10. Model of fountain heights. (A) Sketch of the model with fountain height H, pond depth dp, dike radius rd, and the velocity within the underlying feeder dike v. (B) The height changes depending on the pond depth dp are included as a model parameter. The different black lines are related to different initial lava fountain heights. The observed heights of the lava fountains at Baugur are shown in green and at Suðri in blue. The observed heights used are from Sept 2 and 4, when the channeling of the magma is already established. (c) Resulting pond depth based on an initial radius of the vertical dike for Suðri (blue) and Baugur (green). The gray area highlights the range of opening of the underlying feeder dike and, therefore, assumed conduit diameters. The light blue and light green areas are the corresponding pond depth areas for Baugur and Suðri, respectively.
The development of lava ponds might strongly affect the height of fountains. As we showed earlier, the cones were growing as lava ponds were filling within their craters. Based on Wilson et al. (1980) and Wilson et al. (1995), we modified the fountain height formulas to account for a magma pond on top of the dike (see Figure 10A). Consequently, the lava fountain height decreased. The initial height of the lava fountain, Hinitial (i.e., the height in a pond-free condition), is related to the radius of the feeding conduit r, the driving pressure ∂p/∂z and the viscosity of the magma η, where g is the acceleration of gravity and is calculated with the values given in the Supplementary Material by
Comparing the model results with the actual height observation video data, we can infer the depth of the pond and the width of the conduit. As a first step, for a given conduit radius, we calculate the resulting magma ascent velocity in the conduit. Based on that velocity, we calculate the fountain height and the corresponding lava pond depth. The dike opening is well constrained by GPS and InSAR data and is between 4.5 m and 6 m (Sigmundsson et al., 2015; Ruch et al., 2016). However, the vertical connection to the vents is more difficult to constrain. The radius of the conduit in our model is between 2 and 3 m, which results in a mean radius of 2.5 ± 0.4 m for these conduits. The initial lava fountain height Hinitial is calculated based on the velocity within the conduit. For the different pond depths, we iteratively calculate the resulting velocity at the surface due to re-entrainment (see formulas in the Supplementary Material). The deeper the pond is, the larger the entrainment is, and therefore, the lower the lava fountain is. By each iteration, the entrainment based on the pond depth and velocity is calculated. As the entrainment reduces the velocity, these steps have to be calculated several times until the entrainment and resulting velocity are stable. The formulas and parameters for the entrainment and height calculation can be seen in the Supplementary Material (equations and table with the model parameters) and in further detail in Wilson et al. (1980) and Wilson et al. (1995).
With the radii range for the cones, we obtain lava pond depths between 22.9 and 33.5 m at Suðri, and the pond depth at Baugur ranges between 13.6 and 24.2 m (see Figure 10B,C). This result means that the ponds at the Suðri vents are approximately 1.6 times deeper than the pond at Baugur. The conduit radius correlates quadratically with the initial lava fountain height Hinitial (see Equation 4). Therefore, for the same height, the higher the exit velocity is, the larger the pond depth dp. If we set the feeding conduit radius for the different cones separately, we obtain pond depths ranging between 22.1 and 25.2 m at Suðri and between 16.9 and 24.2 m at Baugur, resulting in similar pond depths for both cones of 23.2 ± 1.0 m and 21.1 ± 2.9 m, respectively. Therefore, the feeding conduit radii range between 1.9 and 2.25 m at Suðri and between 2.3 and 3.1 m at Baugur. A larger conduit will furthermore result in a larger discharge rate at Baugur than at Suðri, which we can observe at the eruption site. The discharge rate can be estimated from the lava field fed by these conduits. Previous papers (Dirscherl, 2016; Müller et al., 2017; Pedersen et al., 2017) show that Baugur is the main feeder of the eruption. Therefore our result fits well with their results.
5.3. Implications of the Study
Our observations show an increasing fountain height, growing cinder cones, and lava pond formation, while the number of eruption vents decreases. Similar behavior can also be observed elsewhere. At Kilauea, the eruption in 1969 (Parcheta et al., 2015) and the most recent eruption in 2018 (USGS, 2018) show the focusing of activity at few vents. This focusing occurs at the beginning of the eruption. This implies that the channeling of the magma emerges over time by solidification of less active parts of the fissure (Bruce and Huppert, 1990). It should be noted that the eruption activity ends first in the north, where the tip of the dike is located. From this, it can be deduced that the heat transport at the tip of the dikes decreases. Such a lower heat transport would lead to a higher cooling by the surrounding bedrock and thus support the formation of channels. This explains why the focusing and the stop of activity is seen first in the northern part. At the Kilauea eruption in 2018, the largest lava flow is fed by an outflow at the cone, where the initial fissure occurred, although a further propagation of the feeder dike can be observed. Due to this propagation new cones were formed. The activity at these newer cones stopped before the activity at the initial cone had decreased. This result shows the importance of studying the eruption behavior at the beginning of the eruption. The analysis of eruption behavior based on changes in lava fountain height and cone morphology (e.g., cone orientation and extension or outflow) can also be applied to eruptions at central vents, while the analysis of lava fountain activity focusing and channel formation is limited to fissure eruptions.
Based on our model calculations, a clear dependency exists between the fountain height and the initial exit velocity, the lava pond depth, and magma flux. Consequently, the differences between the observed craters Baugur and Suðri (i.e., higher fountains at Baugur) can either be explained by a higher initial velocity due to a wider conduit or by a lower pond depth. Based on inspection of the final geometry and the observation of a higher discharge rate at Baugur, we conjecture that at Baugur the lava fountains were higher due to a locally larger diameter of the conduit. As reported in Eibl et al. (2017), the magma supply at Baugur occurs through different fingers of the dike. Variations in explosion behavior due to the complexity of the upper conduit system could also be observed at other volcanoes, e.g., Volcán de Colima. Therefore, the modeling of lava fountains at different times could give us information about changes in the complex conduit system or the lava pond depth within cones at fissure eruptions or central vents. We suggest that differences in the maximum height at the different lava fountains within the Baugur pond may occur due to different radii of these fingers.
A comparison with the final morphology of Baugur taken from the aerial photographs reveals morphologic steps resembling terraces (see Figure 11c, steps in dashed white). These terraces are seen at different locations and elevations, suggesting that the lava pond depth varied between 13.67 and 35.53 m (24.29 ± 6.96 m). Therefore, the results from the modeling of 21.1 ± 2.9 m are within a reliable range of values. The final morphology of Suðri does not show similar terraces. Therefore, direct validation of the pond depth computed for Suðri is not possible.
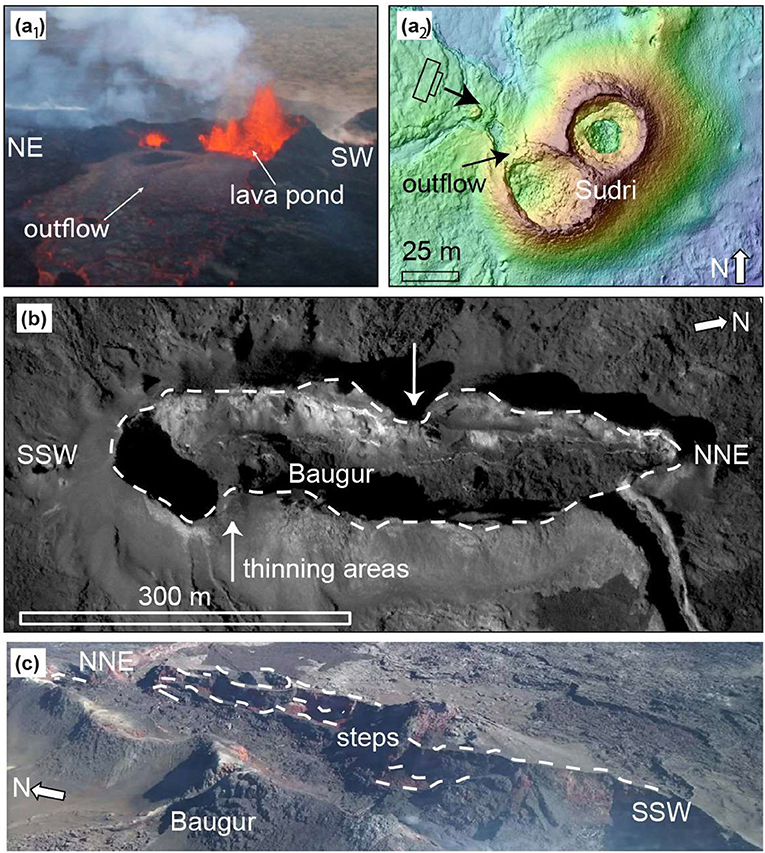
Figure 11. Features inside the different cones. (a) Lava outflow at Suðri and the lava pond inside (a1). The photo is taken by Tobias Dürig. Within the final cone morphology the outflow illustrated and the viewing direction of the camera in a2 is shown. (b) Thinning areas within the Baugur cone in the final cone morphology (Aug 2015). The crater rim is highlighted in white and shows variations in the width (in the WNW-ESE direction). (c) Steps (dashed white lines) that form terraces within the final cone morphology of Baugur. The terraces are best seen on the inner slopes in the ESE direction.
During the first two days of the eruption, we observed lava fountain heights smaller than those after focused venting at several vents. This result can be explained by our model, assuming deeper lava ponds or a thinner feeder conduit. However, a deeper lava pond does not seem reasonable, due to the morphology of the cones. The height of the lava pond is limited by the height of the vents. As we identify the outflow channels at the SW vent, the maximum depth is approximately 30 m and at the NE vent, the maximum height is approximately 32 m. Based on the model, we would expect a conduit radius of greater than 2.9 m. As a consequence, the limitation of the pond depth results in a radius that is smaller than the radius at Baugur. Therefore, the lower heights of Suðri cannot be caused by only a greater pond depth and might be mainly caused by a thinner feeder conduit.
An initial widening of the feeder conduit at the beginning of a fissure eruption at stable vents has been proposed earlier by Bruce and Huppert (1990). Furthermore, Eibl et al. (2017) shows that the long-period (LP) tremor activity is focused during the early eruption days, and the tremor at Baugur increased on Sept 2 when we observed a significant change in the height data. This result can be due to changes beneath the surface, such as dike widening, conduit formation, or pressure changes. All these factors would result in a higher initial lava fountain height.
The main differences between the Baugur and the Suðri group can be explained by the feeder conduit diameter and pond depth. As we assume that both cones are fed by the same lateral dike, the overall characteristics should be determined by the same source. As the overall behavior of the fountains is similar (increase in the fountain heights) at all cones, we suggest here a mechanism that is routed deeper than the feeder conduit or the pond depth. A possible explanation may be a slowly increasing magma flux, due to stabilizing flow within the lateral dike or a small pressure increase within the lateral dike. Furthermore, a widening of the dike would increase the maximum flux velocity within the dike (vz) and therefore the fountain heights.
The possible applications of this study can be divided into technical and scientific findings. The technical developments presented by us to study the lava fountain height and morphology of the cones can be similarly applied to other fissure eruptions and volcanoes with lava fountains, such as at Mount Etna. The scientific findings, i.e., the observation and analysis of a decrease of the number of vents, the focusing of the eruption activity and the formation of cones at these vents might be similarly found at other fissure eruptions, such as Mount Ulu (1969) or Kilauea (2018).
6. Conclusion
At the 2014–2015 Holuhraun fissure eruption site we carried out video monitoring of the lava fountains and recorded the evolving morphology of the scoria cones. We identified a decrease in the number of active vents producing lava fountains from 57 to 10 during the first 5 days of the eruption. The decrease occurs due to the establishment of magma channels from the dike to the surface. The channels are generated by solidification of the parts of the fissure that show lower activity and therefore have a lower heat transport. After 2 days the fountain activity became mainly focused at 10 vents located within 4 distinct craters (Norðri, Baugur and two at Suðri). The morphology of the cones was defined by preexisting topography characterized by cones and lava flows of the 1797/1798 eruption. Posteruption drone data showed that Suðri cone hosted two circular and separated craters, whereas the large and elongated Baugur cone hosted up to 5 fountains within one crater with a major lava pond that was changing in elevation with time. We can conjecture that the initial fountaining and the preexisting morphologic setting had a large influence on the final morphology of the eruption site, as the cones reactivated at the same locations as the previous eruption in 1797/1798.
Similar overall characteristics, such as an increase the height with time and pulsating behavior, were found at both cones, Suðri and Baugur, and the fountain pulses were not synchronized and displayed a small time shift. For each cone, we found a characteristic ratio between height and width. The ratio between height and width was nonlinear and was nearly double at Baugur compared to Suðri. During the first days of the eruption, the ratio decreased from 8.6 to 5.0 at Baugur, and from 4.0 to 2.7 at Suðri, indicating a faster increase in width than in height. We observed the greatest morphological changes within the cones at those sites where we observed the largest fountains. A single fountain occurred at circular vents that were classified as multiple superposed cones, whereas vents with multiple fountains were elongated and were classified as multiple coalescent cones.
From the modeling of the fountain heights, we estimated pond depths of 26.4 ± 1.5 m at Suðri and 23.7 ± 4.8 m at Baugur. These pond depths are consistent with the morphological steps seen within the Baugur cone and fit with the overall cone morphology. The resulting feeder conduit diameter was between 3.8 and 4.5 m and between 4.4 and 6.2 m for Suðri and Baugur, respectively. Long-term eruption behavior was controlled mainly by deeper eruption parameters, such as pressure changes in the dike, whereas smaller, local changes, as well as the maximum height of lava fountains, were mainly controlled by the feeder conduit diameter and the depth of the lava pond.
Author Contributions
TW collected and processed the dGPS data and video data, performed the analysis of data, and did the modeling of the lava fountains. She led the writing of the manuscript. DM collected the helikite data and processed the DEMs. TRW collected multicopter data and analyzed data. AS collected and processed TLS data. MTG was involved in data interpretation and the writing of the manuscript.
Conflict of Interest Statement
The authors declare that the research was conducted in the absence of any commercial or financial relationships that could be construed as a potential conflict of interest.
Acknowledgments
This work contributed and was partially supported by the FUTURE-VOLC project. We especially thank the IMO for releasing detailed monitoring information from the Holuhraun eruption. Financial support came from an expedition fund of the GFZ Potsdam. This is a contribution to VOLCapse, a research project funded by the European Research Council under the European Union's H2020 Programme/ERC consolidator grant ERC-CoG 646858. We thank Ármann Höskuldsson for support during field works, and Francesco Maccaferri for improving our manuscript by commenting. Moreover, we thank the DLR for providing the TanDEM-X data set that was used to derive a topographic base map of the region. The Tandem-X data analysis in this work is considered as a contribution to the Helmholtz Alliance EDA. All data used is available on request.
Supplementary Material
The Supplementary Material for this article can be found online at: https://www.frontiersin.org/articles/10.3389/feart.2018.00235/full#supplementary-material
References
Acocella, V., and Neri, M. (2009). Dike propagation in volcanic edifices: overview and possible developments. Tectonophysics 471, 67–77. doi: 10.1016/j.tecto.2008.10.002
Acocella, V., and Trippanera, D. (2016). How diking affects the tectonomagmatic evolution of slow spreading plate boundaries: overview and model. Geosphere 12:867. doi: 10.1130/GES01271.1
Ágústsdóttir, T., Woods, J., Greenfield, T., Green, R. G., White, R. S., Winder, T., et al. (2016). Strike-slip faulting during the 2014 Bárðarbunga-Holuhraun dike intrusion, central Iceland. Geophys. Res. Lett. 43, 1495–1503. doi: 10.1002/2015GL067423
Amici, S., Piscini, A., Buongiorno, M. F., and Pieri, D. (2013a). Geological classification of volcano Teide by hyperspectral and multispectral satellite data. Int. J. Remote Sens. 34, 3356–3375. doi: 10.1080/01431161.2012.716913
Amici, S., Turci, M., Giammanco, S., Spampinato, L., and Giulietti, F. (2013b). UAV thermal infrared remote sensing of an italian mud volcano. Adv. Remote Sens. 2, 358–364. doi: 10.4236/ars.2013.24038
Andronico, D., Taddeucci, J., Cristaldi, A., Miraglia, L., Scarlato, P., and Gaeta, M. (2013). The 15 March 2007 paroxysm of Stromboli: video-image analysis, and textural and compositional features of the erupted deposit. Bull. Volcanol. 75:733. doi: 10.1007/s00445-013-0733-2
Árnadóttir, T., Geirsson, H., and Jiang, W. (2008). Crustal deformation in Iceland: plate spreading and earthquake deformation. Jökull 58, 59–74.
Bagnardi, M., González, P. J., and Hooper, A. (2016). High-resolution digital elevation model from tri-stereo Pleiades-1 satellite imagery for lava flow volume estimates at Fogo Volcano. Geophys. Res. Lett. 43, 6267–6275. doi: 10.1002/2016GL069457
Behncke, B., Branca, S., Corsaro, R. A., De Beni, E., Miraglia, L., and Proietti, C. (2014). The 2011–2012 summit activity of Mount Etna: Birth, growth and products of the new SE crater. J. Volcanol. Geother. Res. 270, 10–21. doi: 10.1016/j.jvolgeores.2013.11.012
Behncke, B., Neri, M., Pecora, E., and Zanon, V. (2006). The exceptional activity and growth of the Southeast Crater, Mount Etna (Italy), between 1996 and 2001. Bull. Volcanol. 69, 149–173. doi: 10.1007/s00445-006-0061-x
Bemis, K., Walker, J., Borgia, A., Turrin, B., Neri, M., and Swisher, C. III. (2011). The growth and erosion of cinder cones in Guatemala and El Salvador: models and statistics. J. Volcanol. Geother. Res. 201, 39–52. doi: 10.1016/j.jvolgeores.2010.11.007
Bemis, K. G. (1995). A Morphometric Study of Volcanoes in Guatemala, Iceland, the Snake River Plain, and the South Pacific. PhD thesis, Rutgers University.
Björnsson, A., Johnsen, G., Sigurdsson, S., Thorbergsson, G., and Tryggvason, E. (1979). Rifting of the plate boundary in North Iceland 1975–1978. J. Geophys. Res. 84, 3029–3038. doi: 10.1029/JB084iB06p03029
Björnsson, H., and Einarsson, P. (1990). Volcanoes beneath Vatnajökull, Iceland: evidence from radio echo-sounding, earthquakes and jökulhlaups. Jökull 40, 147–168.
Bruce, P. M., and Huppert, H. E. (1989). Thermal control of basaltic fissure eruptions. Nature 342, 665–667. doi: 10.1038/342665a0
Bruce, P. M., and Huppert, H. E. (1990). “Solidification and melting along dykes by the laminar flow of basaltic magma,” in Magma Transport and Storage, eds M. P. Ryan (Chichester: John Wiley), 87–101.
Calvari, S., CannavÚ, F., Bonaccorso, A., Spampinato, L., and Pellegrino, A. G. (2018). Paroxysmal explosions, lava fountains and ash plumes at etna volcano: eruptive processes and hazard implications. Front. Earth Sci. 6:107. doi: 10.3389/feart.2018.00107
Calvari, S., and Pinkerton, H. (2004). Birth, growth and morphologic evolution of the ‘Laghetto’ cinder cone during the 2001 Etna eruption. J. Volcanol. Geother. Res. 132, 225–239. doi: 10.1016/S0377-0273(03)00347-0
Carey, S., and Sparks, R. (1986). Quantitative models of the fallout and dispersal of tephra from volcanic eruption columns. Bull. Volcanol. 48, 109–125. doi: 10.1007/BF01046546
Carrivick, J. L., Smith, M. W., and Quincey, D. J. (2016). “Background to structure from motion,” in Structure From Motion in the Geosciences, eds J. L. Carrivick, M. W. Smith, and D. J. Quincey (Chichester: John Wiley & Sons, Ltd.), 37–59. doi: 10.1002/9781118895818.ch3
Caudron, C., White, R. S., Green, R. G., Woods, J., Ágústsdóttir, T., Donaldson, C., et al. (2018). Seismic amplitude ratio Analysis of the 2014–2015 Bárðarbunga-Holuhraun Dike Propagation and Eruption. J. Geophys. Res. 123, 264–276. doi: 10.1002/2017JB014660
Corazzato, C., and Tibaldi, A. (2006). Fracture control on type, morphology and distribution of parasitic volcanic cones: an example from Mt. Etna, Italy. J. Volcanol. Geother. Res. 158, 177–194. doi: 10.1016/j.jvolgeores.2006.04.018
Darmawan, H., Walter, T. R., Brotopuspito, K. S., and Nandaka, I. G. M. A. (2018). Morphological and structural changes at the Merapi lava dome monitored in 2012–15 using unmanned aerial vehicles (UAVs). J. Volcanol. Geother. Res. 349, 256–267. doi: 10.1016/j.jvolgeores.2017.11.006
Delaney, P. T., and Pollard, D. D. (1982). Solidification of basaltic magma during flow in a dike. Am. J. Sci. 282, 856–885. doi: 10.2475/ajs.282.6.856
DeMets, C., Gordon, R. G., and Argus, D. F. (2010). Geologically current plate motions. Geophys. J. Int. 181, 1–80. doi: 10.1111/j.1365-246X.2009.04491.x
Diefenbach, A. K., Bull, K. F., Wessels, R. L., and McGimsey, R. G. (2013). Photogrammetric monitoring of lava dome growth during the 2009 eruption of Redoubt Volcano. J. Volcanol. Geother. Res. 259, 308–316. doi: 10.1016/j.jvolgeores.2011.12.009
Dirscherl, M. C. (2016). Topographic Change Quantification and DEM Uncertainty Assessment Using TanDEM-X and F-SAR DEM Time Series and Quality Maps: Application to the 2014-2015 Bárðarbunga Volcanic Eruption, Iceland. Master's thesis, University College London. Available online at: https://elib.dlr.de/109037
Dóniz-Páez, J. (2015). Volcanic geomorphological classification of the cinder cones of Tenerife (Canary Islands, Spain). Geomorphology 228, 432–447. doi: 10.1016/j.geomorph.2014.10.004
Eibl, E. P., Bean, C. J., Jónsdóttir, I., Höskuldsson, A., Thordarson, T., Coppola, D., et al. (2017). Multiple coincident eruptive seismic tremor sources during the 2014–2015 eruption at Holuhraun, Iceland. J. Geophys. Res. 122, 2972–2987. doi: 10.1002/2016JB013892
Favalli, M., Fornaciai, A., Mazzarini, F., Harris, A., Neri, M., Behncke, B., et al. (2010). Evolution of an active lava flow field using a multitemporal LIDAR acquisition. J. Geophys. Res. 115:B11203. doi: 10.1029/2010JB007463
Favalli, M., Karátson, D., Mazzarini, F., Pareschi, M. T., and Boschi, E. (2009). Morphometry of scoria cones located on a volcano flank: a case study from Mt. Etna (Italy), based on high-resolution LiDAR data. J. Volcanol. Geother. Res. 186, 320–330. doi: 10.1016/j.jvolgeores.2009.07.011
Fedotov, S. (1981). Magma rates in feeding conduits of different volcanic centres. J. Volcanol. Geother. Res. 9, 379–394. doi: 10.1016/0377-0273(81)90045-7
Ferguson, D. J., Barnie, T. D., Pyle, D. M., Oppenheimer, C., Yirgu, G., Lewi, E., et al. (2010). Recent rift-related volcanism in Afar, Ethiopia. Earth Planet. Sci. Lett. 292, 409–418. doi: 10.1016/j.epsl.2010.02.010
Floricioiu, D., Jaber, W. A., Minet, C., Rossi, C., and Eineder, M. (2015). “Tandem-X for mass balance of glaciers and subglacial volcanic activities,” in Geoscience and Remote Sensing Symposium (IGARSS), 2015 IEEE International (Milan: IEEE), 2903–2906.
Formenti, Y., Druitt, T., and Kelfoun, K. (2003). Characterisation of the 1997 Vulcanian explosions of Soufrière Hills Volcano, Montserrat, by video analysis. Bull. Volcanol. 65, 587–605. doi: 10.1007/s00445-003-0288-8
Fornaciai, A., Bisson, M., Landi, P., Mazzarini, F., and Pareschi, M. T. (2010). A LiDAR survey of Stromboli volcano (Italy): digital elevation model-based geomorphology and intensity analysis. Int. J. Remote Sens. 31, 3177–3194. doi: 10.1080/01431160903154416
Gíslason, S. R., Stefánsdóttir, G., Pfeffer, M., Jóhannsson, T., Galeczka, I. M., Bali, E., et al. (2015). Environmental pressure from the 2014–15 eruption of Bárðarbunga volcano, Iceland. Geochem. Perspect. Lett. 1, 84–93. doi: 10.7185/geochemlet.1509
Gonnermann, H. M., and Manga, M. (2013). “Dynamics of magma ascent in the volcanic conduit,” in Modeling of Volcanic Processes, Chap. 4, eds S. Fagents, T. Gregg, and R. Lopes (Cambridge: Cambridge University Press), 55–84.
Grosse, P., van Wyk de Vries, B., Petrinovic, I. A., Euillades, P. A., and Alvarado, G. E. (2009). Morphometry and evolution of arc volcanoes. Geology 37, 651–654. doi: 10.1130/G25734A.1
Gudmundsson, A., and Brenner, S. L. (2005). On the conditions of sheet injections and eruptions in stratovolcanoes. Bull. Volcanol. 67, 768–782. doi: 10.1007/s00445-005-0433-7
Gudmundsson, M. T., and Högnadóttir, T. (2007). Volcanic systems and calderas in the Vatnajökull region, central Iceland: constraints on crustal structure from gravity data. J. Geodyn. 43, 153–169. doi: 10.1016/j.jog.2006.09.015
Gudmundsson, M. T., Jónsdóttir, K., Hooper, A., Holohan, E. P., Halldórsson, S. A., Ófeigsson, B. G., et al. (2016). Gradual caldera collapse at Bárðarbunga volcano, Iceland, regulated by lateral magma outflow. Science 353:262. doi: 10.1126/science.aaf8988
Hartley, M. E., and Thordarson, T. (2013). The 1874–1876 volcano-tectonic episode at Askja, North Iceland: Lateral flow revisited. Geochem. Geophys. Geosyst. 14, 2286–2309. doi: 10.1002/ggge.20151
Head, J. W. III., and Wilson, L. (1989). Basaltic pyroclastic eruptions: influence of gas-release patterns and volume fluxes on fountain structure, and the formation of cinder cones, spatter cones, rootless flows, lava ponds and lava flows. J. Volcanol. Geother. Res. 37, 261–271. doi: 10.1016/0377-0273(89)90083-8
Hjartardóttir, Á. R., Einarsson, P., Gudmundsson, M. T., and Högnadóttir, T. (2016). Fracture movements and graben subsidence during the 2014 Bárðarbunga dike intrusion in Iceland. J. Volcanol. Geother. Res. 310, 242–252. doi: 10.1016/j.jvolgeores.2015.12.002
Houghton, B., and Gonnermann, H. (2008). Basaltic explosive volcanism: constraints from deposits and models. Chemie der Erde Geochem. 68, 117–140. doi: 10.1016/j.chemer.2008.04.002
Houghton, B., and Schmincke, H. (1989). Rothenberg scoria cone, East Eifel: a complex Strombolian and phreatomagmatic volcano. Bull. Volcanol. 52, 28–48. doi: 10.1007/BF00641385
Ida, Y. (1996). Cyclic fluid effusion accompanied by pressure change: implication for volcanic eruptions and tremor. Geophys. Res. Lett. 23, 1457–1460. doi: 10.1029/96GL01325
James, M. R., and Robson, S. (2014). Mitigating systematic error in topographic models derived from UAV and ground-based image networks. Earth Surf. Process. Landforms 39, 1413–1420. doi: 10.1002/esp.3609
James, M. R., Robson, S., Pinkerton, H., and Ball, M. (2006). Oblique photogrammetry with visible and thermal images of active lava flows. Bull. Volcanol. 69, 105–108. doi: 10.1007/s00445-006-0062-9
Jin-Yu, Z., Yan, C., and Xian-Xiang, H. (2009). “Edge detection of images based on improved Sobel operator and genetic algorithms,” in Image Analysis and Signal Processing, 2009. IASP 2009. International Conference on (Kansas City: IEEE), 31–35.
Lipman, P. (1980). Rates of volcanic activity along the southwest rift zone of Mauna Loa volcano, Hawai'i. Bull. Volcanol. 43, 703–725. doi: 10.1007/BF02600366
Lister, J. R., and Kerr, R. C. (1991). Fluid-mechanical models of crack propagation and their application to magma transport in dykes. J. Geophys. Res. 96, 10049–10077. doi: 10.1029/91JB00600
Lundgren, P., Kiryukhin, A., Milillo, P., and Samsonov, S. (2015). Dike model for the 2012–2013 Tolbachik eruption constrained by satellite radar interferometry observations. J. Volcanol. Geother. Res. 307, 79–88. doi: 10.1016/j.jvolgeores.2015.05.011
Lundgren, P., Poland, M., Miklius, A., Orr, T., Yun, S.-H., Fielding, E., et al. (2013). Evolution of dike opening during the March 2011 Kamoamoa fissure eruption, Kīlauea Volcano, Hawai'i. J. Geophys. Res. 118, 897–914. doi: 10.1002/jgrb.50108
Maccaferri, F., Richter, N., and Walter, T. R. (2017). The effect of giant lateral collapses on magma pathways and the location of volcanism. Nat. Commun. 8:1097. doi: 10.1038/s41467-017-01256-2
Major, J., Dzurisin, D., Schilling, S., and Poland, M. P. (2009). Monitoring lava-dome growth during the 2004–2008 Mount St. Helens, Washington, eruption using oblique terrestrial photography. Earth Planet. Sci. Lett. 286, 243–254. doi: 10.1016/j.epsl.2009.06.034
Mancini, F., Dubbini, M., Gattelli, M., Stecchi, F., Fabbri, S., and Gabbianelli, G. (2013). Using unmanned aerial vehicles (UAV) for high-resolution reconstruction of topography: The structure from motion approach on coastal environments. Remote Sens. 5, 6880–6898. doi: 10.3390/rs5126880
McBirney, A. R., and Murase, T. (1984). Rheological properties of magmas. Annu. Rev. Earth Planet. Sci. 12, 337–357. doi: 10.1146/annurev.ea.12.050184.002005
Medynski, S., Pik, R., Burnard, P., Dumont, S., Grandin, R., Williams, A., et al. (2016). Magmatic cycles pace tectonic and morphological expression of rifting (Afar depression, Ethiopia). Earth Planet. Sci. Lett. 446, 77–88. doi: 10.1016/j.epsl.2016.04.014
Medynski, S., Pik, R., Burnard, P., Williams, A., Vye-Brown, C., Ferguson, D., et al. (2013). Controls on magmatic cycles and development of rift topography of the Manda Hararo segment (Afar, Ethiopia): insights from cosmogenic 3He investigation of landscape evolution. Earth Planet. Sci. Lett. 367, 133–145. doi: 10.1016/j.epsl.2013.02.006
Müller, D., Walter, T. R., Schöpa, A., Witt, T., Steinke, B., Gudmundsson, M. T., et al. (2017). High-resolution digital elevation modeling from TLS and UAV campaign reveals structural complexity at the 2014/2015 holuhraun eruption site, Iceland. Front. Earth Sci. 5:59. doi: 10.3389/feart.2017.00059
Nakano, T., Kamiya, I., Tobita, M., Iwahashi, J., and Nakajima, H. (2014). Landform monitoring in active volcano by UAV and SfM-MVS technique. Int. Arch. Photogrammet. Remote Sens. Spat. Inform. Sci. 40:71. doi: 10.5194/isprsarchives-XL-8-71-2014
Németh, K. (2010). “Monogenetic volcanic fields: origin, sedimentary record, and relationship with polygenetic volcanism,” in What Is a volcano?, Vol. 470, Chap. 4, eds E. Canon-Tapia and A. Szakács (Geological Society of America), 43–66.
Németh, K., Risso, C., Nullo, F., and Kereszturi, G. (2011). The role of collapsing and cone rafting on eruption style changes and final cone morphology: Los Morados scoria cone, Mendoza, Argentina. Cent. Eur. J. Geosci. 3, 102–118. doi: 10.2478/s13533-011-0008-4
Parcheta, C., Fagents, S., Swanson, D. A., Houghton, B. F., and Ericksen, T. (2015). Hawaiian fissure fountains: quantifying vent and shallow conduit geometry, Episode 1 of the 1969–1974 Mauna Ulu eruption. Hawaiian Volcanoes 208, 369–391. doi: 10.1002/9781118872079.ch17
Parcheta, C. E., Houghton, B., and Swanson, D. A. (2013). Contrasting patterns of vesiculation in low, intermediate, and high Hawaiian fountains: a case study of the 1969 Mauna Ulu eruption. J. Volcanol. Geother. Res. 255, 79–89. doi: 10.1016/j.jvolgeores.2013.01.016
Parfitt, E. A., and Wilson, L. (1994). The 1983–86 Pu'u'Ō'ō eruption of Kīlauea Volcano, Hawai'i: a study of dike geometry and eruption mechanisms for a long-lived eruption. J. Volcanol. Geother. Res. 59, 179–205. doi: 10.1016/0377-0273(94)90090-6
Parfitt, E. A., Wilson, L., and Neal, C. A. (1995). Factors influencing the height of Hawaiian lava fountains: implications for the use of fountain height as an indicator of magma gas content. Bull. Volcanol. 57, 440–450. doi: 10.1007/BF00300988
Patrick, M. R., Harris, A. J., Ripepe, M., Dehn, J., Rothery, D. A., and Calvari, S. (2007). Strombolian explosive styles and source conditions: insights from thermal (FLIR) video. Bull. Volcanol. 69, 769–784. doi: 10.1007/s00445-006-0107-0
Patrick, M. R., Kauahikaua, J. P., and Antolik, L. (2010). MATLAB tools for improved characterization and quantification of volcanic incandescence in Webcam imagery: applications at Kīlauea Volcano, Hawai'i. US Geol. Surv. Tech. Methods 13, 1–16. doi: 10.3133/tm13A1
Pedersen, G., Höskuldsson, A., Dürig, T., Thordarson, T., Jonsdottir, I., Riishuus, M. S., et al. (2017). Lava field evolution and emplacement dynamics of the 2014–2015 basaltic fissure eruption at Holuhraun, Iceland. J. Volcanol. Geother. Res. 340, 155–169. doi: 10.1016/j.jvolgeores.2017.02.027
Porter, S. C. (1972). Distribution, morphology, and size frequency of cinder cones on Mauna Kea volcano, Hawai'i. Geol. Soc. Am. Bull. 83, 3607–3612. doi: 10.1130/0016-7606(1972)83[3607:DMASFO]2.0.CO;2
Reynolds, P., Brown, R., Thordarson, T., and Llewellin, E. (2016). The architecture and shallow conduits of Laki-type pyroclastic cones: insights into a basaltic fissure eruption. Bull. Volcanol. 78:36. doi: 10.1007/s00445-016-1029-0
Richter, D. H., Eaton, J., Murata, K., Ault, W., and Krivoy, H. (1970). Chronological Narrative of the 1959-60 Eruption of Kīlauea Volcano, Hawai'i. Technical report.
Richter, N., Favalli, M. E., de Zeeuw-van Dalfsen, E., Fornaciai, A., da Silva Fernandes, R. M., Pérez, N. M., et al. (2016). Lava flow hazard at Fogo Volcano, Cabo Verde, before and after the 2014-2015 eruption. Nat. Hazards Earth Syst. Sci. 16:1925. doi: 10.5194/nhess-16-1925-2016
Riggs, N., and Duffield, W. (2008). Record of complex scoria cone eruptive activity at Red Mountain, Arizona, USA, and implications for monogenetic mafic volcanoes. J. Volcanol. Geother. Res. 178, 763–776. doi: 10.1016/j.jvolgeores.2008.09.004
Rossi, C., Minet, C., Fritz, T., Eineder, M., and Bamler, R. (2016). Temporal monitoring of subglacial volcanoes with TanDEM-X - Application to the 2014–2015 eruption within the Bárðarbunga volcanic system, Iceland. Remote Sens. Environ. 181, 186–197. doi: 10.1016/j.rse.2016.04.003
Rowland, S. K., and Walker, G. P. (1990). Pahoehoe and aa in Hawaii: volumetric flow rate controls the lava structure. Bull. Volcanol. 52, 615–628. doi: 10.1007/BF00301212
Rubin, A. M. (1990). A comparison of rift-zone tectonics in Iceland and Hawai'i. Bull. Volcanol. 52, 302–319. doi: 10.1007/BF00304101
Rubin, A. M. (1995). Propagation of magma-filled cracks. Annu. Rev. Earth Planet. Sci. 23, 287–336. doi: 10.1146/annurev.ea.23.050195.001443
Rubin, A. M., and Pollard, D. D. (1988). Dike-induced faulting in rift zones of Iceland and Afar. Geology 16, 413–417. doi: 10.1130/0091-7613(1988)016<0413:DIFIRZ>2.3.CO;2
Ruch, J., Wang, T., Xu, W., Hensch, M., and Jónsson, S. (2016). Oblique rift opening revealed by reoccurring magma injection in central Iceland. Nat. Commun. 7:12352. doi: 10.1038/ncomms12352
Salzer, J. T., Thelen, W. A., James, M. R., Walter, T. R., Moran, S., and Denlinger, R. (2016). Volcano dome dynamics at Mount St. Helens: deformation and intermittent subsidence monitored by seismicity and camera imagery pixel offsets. J. Geophys. Res. Solid Earth 121, 7882–7902. doi: 10.1002/2016JB013045
Scollo, S., Prestifilippo, M., Pecora, E., Corradini, S., Merucci, L., Spata, G., et al. (2014). Eruption column height estimation of the 2011-2013 Etna lava fountains. Ann. Geophys. 57:0214. doi: 10.4401/ag-6396
Sigmundsson, F., Hooper, A., Hreinsdóttir, S., Vogfjörd, K. S., Ófeigsson, B. G., Heimisson, E. R., et al. (2015). Segmented lateral dyke growth in a rifting event at Bárðarbunga volcanic system, Iceland. Nature 517:191. doi: 10.1038/nature14111
Smith, D. K., and Cann, J. R. (1992). The role of seamount volcanism in crustal construction at the Mid-Atlantic Ridge (24–30 N). J. Geophys. Res. 97, 1645–1658. doi: 10.1029/91JB02507
Spampinato, L., Calvari, S., Oppenheimer, C., and Lodato, L. (2008). Shallow magma transport for the 2002–3 Mt. Etna eruption inferred from thermal infrared surveys. J. Volcanol. Geother. Res. 177, 301–312. doi: 10.1016/j.jvolgeores.2008.05.013
Stevenson, J. A., and Varley, N. (2008). Fumarole monitoring with a handheld infrared camera: Volcán de Colima, Mexico, 2006–2007. J. Volcanol. Geother. Res. 177, 911–924. doi: 10.1016/j.jvolgeores.2008.07.003
Sumner, J. M. (1998). Formation of clastogenic lava flows during fissure eruption and scoria cone collapse: the 1986 eruption of Izu-Oshima Volcano, eastern Japan. Bull. Volcanol. 60, 195–212. doi: 10.1007/s004450050227
Taddeucci, J., Alatorre-Ibargüengoitia, M., Moroni, M., Tornetta, L., Capponi, A., Scarlato, P., et al. (2012a). Physical parameterization of Strombolian eruptions via experimentally-validated modeling of high-speed observations. Geophys. Res. Lett. 39:L16306. doi: 10.1029/2012GL052772
Taddeucci, J., Scarlato, P., Capponi, A., Del Bello, E., Cimarelli, C., Palladino, D., et al. (2012b). High-speed imaging of strombolian explosions: the ejection velocity of pyroclasts. Geophys. Res. Lett. 39:L02301. doi: 10.1029/2011GL050404
Thordarson, T., Hoskuldsson, A., Jónsdottir, I., Pedersen, G., Gudmundsson, M., Dürig, T., et al. (2015). “Emplacement and growth of the August 2014 to February 2015 Nornahraun Lava flow field North Iceland,” in AGU Fall Meeting Abstracts (San Francisco, CA), abs–id V13D–01.
Thordarson, T., and Larsen, G. (2007). Volcanism in Iceland in historical time: volcano types, eruption styles and eruptive history. J. Geodyn. 43, 118–152. doi: 10.1016/j.jog.2006.09.005
Thordarson, T., and Self, S. (1998). The Roza Member, Columbia River Basalt Group: a gigantic pāhoehoe lava flow field formed by endogenous processes? J. Geophys. Res. 103, 27411–27445. doi: 10.1029/98JB01355
Tiede, C., Camacho, A., Gerstenecker, C., Fernández, J., and Suyanto, I. (2005). Modeling the density at Merapi volcano area, Indonesia, via the inverse gravimetric problem. Geochem. Geophys. Geosyst. 6, Q09011. doi: 10.1029/2005GC000986
USGS (2018). Kīlauea's lower East Rift Zone lava flows and fissures (between June and August 2018). Available online at: https://volcanoes.usgs.gov/volcanoes/kilauea/multimedia_maps.html
Valentine, G., and Gregg, T. (2008). Continental basaltic volcanoes-processes and problems. J. Volcanol. Geother. Res. 177, 857–873. doi: 10.1016/j.jvolgeores.2008.01.050
Voight, B., Janda, R., Glicken, H., Douglass, P., et al. (1983). Nature and mechanics of the Mount St. Helens rockslide-avalanche of 18 May 1980. Geotechnique 33, 243–273. doi: 10.1680/geot.1983.33.3.243
Walker, G. P., and Sigurdsson, H. (2000). “Basaltic volcanoes and volcanic systems,” in Encyclopedia of Volcanoes, eds H. Sigurdsson, B. F. Houghton, S. McNutt, H. Rymer, and J. Stix (San Diego, CA: Academic Press), 283–289.
Walter, T. R. (2011). Low cost volcano deformation monitoring: optical strain measurement and application to Mount St. Helens data. Geophys. J. Int. 186, 699–705. doi: 10.1111/j.1365-246X.2011.05051.x
Walter, T. R., Ratdomopurbo, A., Aisyah, N., Brotopuspito, K. S., Salzer, J., Lühr, B., et al. (2013). Dome growth and coulée spreading controlled by surface morphology, as determined by pixel offsets in photographs of the 2006 Merapi eruption. J. Volcanol. Geother. Res. 261, 121–129. doi: 10.1016/j.jvolgeores.2013.02.004
Westoby, M., Brasington, J., Glasser, N., Hambrey, M., and Reynolds, J. (2012). “Structure-from-Motion” photogrammetry: a low-cost, effective tool for geoscience applications. Geomorphology 179, 300–314. doi: 10.1016/j.geomorph.2012.08.021
Wilson, L., Parfitt, E. A., and Head III, J. (1995). Explosive volcanic eruptions - VIII. The role of magma recycling in controlling the behaviour of Hawaiian-style lava fountains. Geophys. J. Int. 121, 226–232. doi: 10.1111/j.1365-246X.1995.tb03522.x
Wilson, L., Sparks, R. S. J., and Walker, G. P. (1980). Explosive volcanic eruptions - IV. The control of magma properties and conduit geometry on eruption column behaviour. Geophys. J. Int. 63, 117–148. doi: 10.1111/j.1365-246X.1980.tb02613.x
Witt, T., and Walter, T. R. (2017). Video monitoring reveals pulsating vents and propagation path of fissure eruption during the March 2011 Pu'u'Ō'ō eruption, Kīlauea volcano. J. Volcanol. Geother. Res. 330, 43–55. doi: 10.1016/j.jvolgeores.2016.11.012
Wolfe, E. W., Garcia, M. O., Jackson, D. B., Koyanagi, R. Y., and Neal, C. A. (1987). Volcanism in Hawai'i. US Geol. Surv. Prof. Pap. 1350, 471–508.
Wright, T. J., Ebinger, C., Biggs, J., Ayele, A., Yirgu, G., Keir, D., et al. (2006). Magma-maintained rift segmentation at continental rupture in the 2005 Afar dyking episode. Nature 442, 291–294. doi: 10.1038/nature04978
Wylie, J. J., Helfrich, K. R., Dade, B., Lister, J. R., and Salzig, J. F. (1999a). Flow localization in fissure eruptions. Bull. Volcanol. 60, 432–440. doi: 10.1007/s004450050243
Keywords: fissure eruption, Holuhraun eruption, lava fountain, spatter cone, photogrammetry, modeling
Citation: Witt T, Walter TR, Müller D, Guðmundsson MT and Schöpa A (2018) The Relationship Between Lava Fountaining and Vent Morphology for the 2014–2015 Holuhraun Eruption, Iceland, Analyzed by Video Monitoring and Topographic Mapping. Front. Earth Sci. 6:235. doi: 10.3389/feart.2018.00235
Received: 03 July 2018; Accepted: 03 December 2018;
Published: 18 December 2018.
Edited by:
Valerio Acocella, Università degli Studi Roma Tre, ItalyReviewed by:
Finnigan Illsley-Kemp, Victoria University of Wellington, New ZealandSonia Calvari, Istituto Nazionale di Geofisica e Vulcanologia (INGV), Italy
Copyright © 2018 Witt, Walter, Müller, Guðmundsson and Schöpa. This is an open-access article distributed under the terms of the Creative Commons Attribution License (CC BY). The use, distribution or reproduction in other forums is permitted, provided the original author(s) and the copyright owner(s) are credited and that the original publication in this journal is cited, in accordance with accepted academic practice. No use, distribution or reproduction is permitted which does not comply with these terms.
*Correspondence: Tanja Witt, dHdpdHRAZ2Z6LXBvdHNkYW0uZGU=