 Oliver D. Lamb1,2*
 Anthony Lamur1Alejandro Díaz-Moreno1Silvio De Angelis1
 Adrian J. Hornby1,3
 Felix W. von Aulock1
 Jackie E. Kendrick1
 Paul A. Wallace1Ellen Gottschämmer4
 Andreas Rietbrock1,4Isaac Alvarez5Gustavo Chigna6
 Yan Lavallée1
- 1Department of Earth, Ocean and Ecological Sciences, University of Liverpool, Liverpool, United Kingdom
- 2Department of Geological Sciences, University of North Carolina at Chapel Hill, Chapel Hill, NC, United States
- 3Department of Earth and Environmental Sciences, Ludwig-Maximilians-Universität München, Munich, Germany
- 4Geophysical Institute, Karlsruhe Institute of Technology, Karlsruhe, Germany
- 5Department of Signal Theory, Telematics and Communications, University of Granada, Granada, Spain
- 6Instituto Nacional de Sismologia, Vulcanologia, Meteorologia, e Hydrologia (INSIVUMEH), Guatemala City, Guatemala
Rapid transitions in eruptive activity during lava dome eruptions pose significant challenges for monitoring and hazard assessment. A comprehensive understanding of the dynamic evolution of active lava dome systems requires extensive sets of multi-parametric datasets to fully constrain and understand shifts in eruptive behavior, but few such datasets have been compiled. The Santiaguito lava dome complex, Guatemala, is a remarkable example of an open-vent volcanic system where continuous eruptive activity has typically been characterized by cycles of effusion and frequent, small to moderate, gas-and-ash explosions. During 2015–2016 the volcano experienced a rapid intensification of activity including large vulcanian explosions, frequently accompanied by pyroclastic density currents. Here we present a chronology of the eruptive activity at Santiaguito from November 2014–May 2017, compiled from field observations (visual and thermal) and activity reports. We also present seismic and acoustic infrasound data collected during the same period, the longest and largest dataset collected at Santiaguito to date. Three major phases of eruptive activity took place during the study period. The first phase was consistent with the long-term eruptive behavior reported at Santiaguito by previous studies: lava effusion simultaneous with small (<1 km plume height), regular (25–200 min intervals), gas-and-ash explosions. The second phase from July 2015 to September 2016 was defined by large (<5–7 km plume height) vulcanian explosions at irregular intervals and often accompanied by pyroclastic density currents. The third phase was marked by a return to effusive activity in October 2016 interspersed by small, gas-rich explosions. Over 6,000 explosive events were recorded by seismic and infrasound during the study period and clearly delineate the three phases of activity at the volcano. Furthermore, we present the first documented geophysical evidence of explosion blast waves and volcano-tectonic earthquake swarms at Santiaguito. An important implication of our observations is that negative trends in explosion rates at silicic lava dome eruptions cannot be used alone as an indicator of future weaker activity and reduced hazard. This case study of Santiaguito will serve as a useful foundation for future studies of long-lived lava dome eruptions featuring rapid transitions between effusive and explosive activity.
1. Introduction
Shifts in eruptive behavior at active lava domes present a significant challenge for monitoring and hazard assessment, particularly as transitions from effusive to explosive activity, and vice versa, can be rapid (e.g., Jousset et al., 2012) and often lack obvious geophysical precursors (e.g., Reyes-Dávila et al., 2016). Lava dome eruptions occur over a wide range of timescales, from months to decades, and are characterized by the slow extrusion of highly viscous, degassed magma that can eventually form voluminous edifices (>1 km3; Fink, 1990). However, these generally effusive eruptions often involve multiple episodes of explosive activity and/or collapses which commonly produce hazardous pyroclastic density currents (PDCs; Calder et al., 2015).
Generally, the switch from effusive to explosive activity during lava dome eruptions have been characterized by variations in magma discharge rate (Sparks, 1997) and volcano-seismic activity associated with magmatic or fluid movement (e.g., Neuberg, 2000; Arámbula-Mendoza et al., 2011). Pressurization, due to gas fluxing (e.g., Johnson et al., 1998; Michaut et al., 2013) or fresh magma recharge (e.g., Reyes-Dávila et al., 2016), may trigger explosive activity and evolution in associated monitored signals (Sparks, 1997). It is commonly believed that the competition between gas pressure and the rheology of dome lavas controls the development of fractures (Lavallée et al., 2008; Scheu et al., 2008; Heap et al., 2015a), porosity (Heap et al., 2015b; Rhodes et al., 2018) and coherence (e.g., Tuffisites; Kendrick et al., 2016), and thus permeability (Scheu et al., 2008; Lavallée et al., 2013; Gaunt et al., 2014; Farquharson et al., 2015), leading to either fragmentation and explosive activity (e.g., Dingwell, 1996; Papale, 1999) or outgassing and effusive activity (e.g., Edmonds et al., 2003; Gonnermann and Manga, 2007). To understand the relationships between these key characteristic signals, long-term investigations using multi-parameter datasets are of particular value. Such investigations have become a strategic requirement for the development of more sophisticated models that integrate the spectrum of magmatic processes governing lava dome activity (e.g., Soufrière Hills volcano; Wadge et al., 2014).
The Santiaguito dome complex in Guatemala is a rare example of a long-term lava dome eruption that has experienced multiple transitions between effusive and explosive activity (Harris et al., 2003; Rhodes et al., 2018). From November 2014 to May 2017, the University of Liverpool and the Instituto Nacional de Sismologia, Vulcanologia, Meteorologia, e Hydrologia (INSIVUMEH), deployed a network of seismometers and infrasound microphones around Santiaguito. The deployment was complemented by thermal and optical records of activity recorded during multiple field campaigns. The investigation was motivated by the need to characterize the activity and understand long-term, low-energy explosive behavior at the volcano. Serendipitously, our study covered a period of heightened explosive activity between late 2015 and mid 2016. Here, we present a review of geophysical data and field observations recorded during a long-term, multi-parameter investigation of lava dome activity at Santiaguito, including the aforementioned period of intense explosive activity during 2015-2016. Some discussion is included about potential triggers for the change in activity but no modeling is carried out or hypotheses tested. Instead, we present the observations and geophysical dataset with the intention of providing a useful foundation for future studies of Santiaguito and other silicic lava dome eruptions.
2. Santiaguito Dome Complex
Santiaguito is a ~1.1 km3 active complex of lava domes located 110 km west and 11 km south of the cities of Guatemala City and Quetzaltenango, respectively (Harris et al., 2003). The dome complex first began extruding in 1922 into an eruption crater on the southwestern flank of Santa Maria volcano (Rose, 1973). The crater formed during the October 1902 eruption of Santa Maria which deposited ~8.3 km3 of dacite over an area of 1.2 × 10⁶ km2 across Central America; one of the largest eruptions of the twentieth century (Williams and Self, 1983). The dome complex has been continuously active from 1922 to the present day, producing four lava domes: El Caliente, La Mitad, El Monje, and El Brujo (Rose, 1973). Extrusion rates have shown a distinctly cyclic nature with at least nine cycles identified with periods of 7–15 years length (Harris et al., 2003; Rhodes et al., 2018). These cycles are also defined by rheological shifts that have promoted different eruptive lava structures (Rhodes et al., 2018). Since 1977, activity has been focused at the El Caliente vent and consists of semi-continuous extrusion of blocky lava flows interspersed by frequent gas-and-ash explosions. Occasional escalations in explosive activity have included dome collapse and PDCs (Rose, 1987; Harris et al., 2003). For the past two decades, explosions have generally been of small to moderate size with volatile-rich, ash-poor plumes typically reaching 1–2 km above the vent (Sahetapy-Engel et al., 2008; Johnson et al., 2014; De Angelis et al., 2016). Through the course of the eruption since 1922, the erupted lava has become progressively less evolved with a ~4 wt.% decrease in bulk SiO2 between 1922 and 2002 (Scott et al., 2013). Given the steadily decreasing extrusion rates and bulk SiO2 composition observed up to the time of writing, Harris et al. (2003) estimated that activity at Santiaguito would terminate in 2014–2024. However, renewed and ongoing eruptive activity since 2010 has raised questions about magmatic processes in the source region (Rhodes et al., 2018).
Santiaguito has been the subject of several multi-parametric monitoring campaigns taking advantage of the continuous nature of the eruption, the regular occurrence of explosive activity, and a direct view into the eruptive vent from a vantage point on Santa Maria (Bluth and Rose, 2004; Johnson et al., 2004, 2008, 2009, 2011, 2014; Sahetapy-Engel et al., 2008; Yamamoto et al., 2008; Johnson and Lees, 2010; Sanderson et al., 2010; Holland et al., 2011; Jones and Johnson, 2011; Scharff et al., 2014; Kim and Lees, 2015; Lavallée et al., 2015; De Angelis et al., 2016). Previous studies have focused on volcano-seismic and infrasound signals generated during small volcanic explosions (Johnson et al., 2008, 2009; Johnson and Lees, 2010). Abrupt vertical displacements of lava at or near the surface of the vent immediately prior to or during explosions are thought to play a significant role in generating long-period volcano-seismic signals (Johnson et al., 2008, 2009) and infrasound signals with peak amplitudes of up to 5 Pa (Johnson and Lees, 2010; De Angelis et al., 2016). The regular explosions at Santiaguito have presented an ideal ground for testing methods designed to accurately locate and characterize explosive activity, including semblance mapping (Johnson et al., 2011; Jones and Johnson, 2011) and Time Reversed Migration (Kim and Lees, 2015). None of the above studies have described and analyzed a dataset that spanned more than a few weeks of eruptive activity.
Most geophysical studies at Santiaguito have aimed to understand the trigger mechanisms for outgassing vs. explosive activity during periods of dome extrusion (Sahetapy-Engel et al., 2008; Sanderson et al., 2010; Holland et al., 2011; Johnson et al., 2014; Scharff et al., 2014; Lavallée et al., 2015). So far, two mechanisms have been proposed to underlie the explosive activity: (1) rupture of magma in marginal shear zones of the lava column, or (2) disruption of a gas-rich magma pocket at a shallow depth. The former mechanism is based on a notion that the upper degassed part of the magma column ascends in a staccato manner causing shear-induced fragmentation at the conduit margins (Goto, 1999; Papale, 1999). The mechanism has been inferred during dome extrusion at Montserrat (Neuberg et al., 2006), the 2004-2008 eruption at Mount St. Helens (Iverson et al., 2006), and during spine extrusion at Unzen volcano (Goto, 1999; Lamb et al., 2015). In turn, this rupture mechanism produces temporary networks of shear fractures near the conduit margins that drive rapid outgassing of shallow (<600 m) magma along arcuate fractures (e.g., Harris et al., 2003; Johnson et al., 2008; Holland et al., 2011; Lavallée et al., 2013; Scharff et al., 2014, Hornby et al. in review, Tensile rupture at lava domes: integrated field and experimental constraints from Santiaguito, Guatemala). At Santiaguito, friction during shear failure has been shown to generate enough heat to partially melt the crystal phases and induce rapid volatile exsolution from the magma, driving explosions from the arcuate fractures (Lavallée et al., 2015). Tests on dome material demonstrate how these arcuate fractures form through coalescence of tensile fractures generated during repeated deformation of the shallow magma conduit (Hornby et al., in review). The second mechanism, where a gas-rich region in the magmatic column drives explosive activity, is based on modeling of a pressure source to explain the cyclic deformation at Santiaguito (Sanderson et al., 2010; Johnson et al., 2014). Brief episodes of strong gas emissions and explosions are commonly observed at the apex of inflation cycles, monitored by tiltmeters or long period seismometers (Johnson et al., 2014). It has been noted that explosions are accompanied by more pronounced inflation/deflation cycles and very long period seismicity, whereas outgassing events are aseismic and accompanied by steady inflation/deflation cycles (Lavallée et al., 2015). It is likely that a combination or sequence of the above mechanisms underlies regular explosive activity at Santiaguito.
2.1. Multi-Parametric Observations
An intensive multi-parametric monitoring investigation was conducted at Santiaguito from November 2014 to May 2017, the first such long-term study of the volcano. We conducted 7 multi-parametric field campaigns in November 2014, April 2015, December 2015, January 2016 (as part of the Workshop on Volcanoes), June 2016, February 2017, and May 2017. In November 2014, we deployed a temporary network of geophysical instruments consisting of 11 seismometers and five acoustic infrasound microphones (Figure 1). The seismometer network included five Nanometrics Trillium Compact (T = 120 s) three-component broadband instruments, and six Lennhartz LE-3Dlite (T = 1 s) three-component short-period instruments. The microphones were iTem prs100 instruments (Delle Donne and Ripepe, 2012) and were co-located with the broadband seismometers. Table 1 lists all the stations deployed in the network, along with their dates of deployment and recovery. The stations were strategically deployed around the Santiaguito dome complex to achieve optimal azimuthal coverage (Figure 1). Data were recorded on-site at a rate of 100 Hz, with 24-bit resolution.
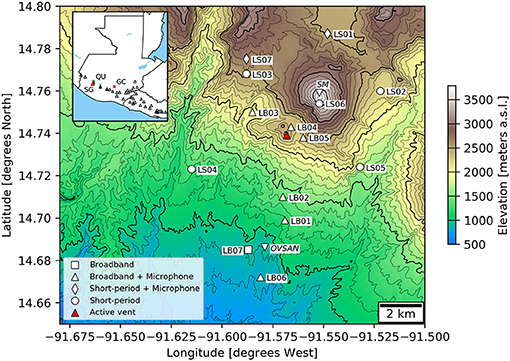
Figure 1. Map of the Santiaguito dome complex with the locations of deployed seismic and acoustic stations in the area. Red triangle marks the location of the active El Caliente vent. The summit of Santa Maria volcano summit (SM) and the old Observatorio Volcan Santiaguito (OVSAN) building are marked with inverted triangles (The observatory building has since been moved to a more secure location close to station LB06 due to the threat of pyroclastic density currents). Thick and thin contours mark 500 and 100 m intervals in altitude, respectively. Inset: Map of Guatemala with the location of Santiaguito (SG, red triangle), Guatemala City (GC, red star) and Quetzaltenango (QU, green star) marked. Also plotted are the locations of other Holocene volcanoes along the Central American volcanic arc (black triangles).
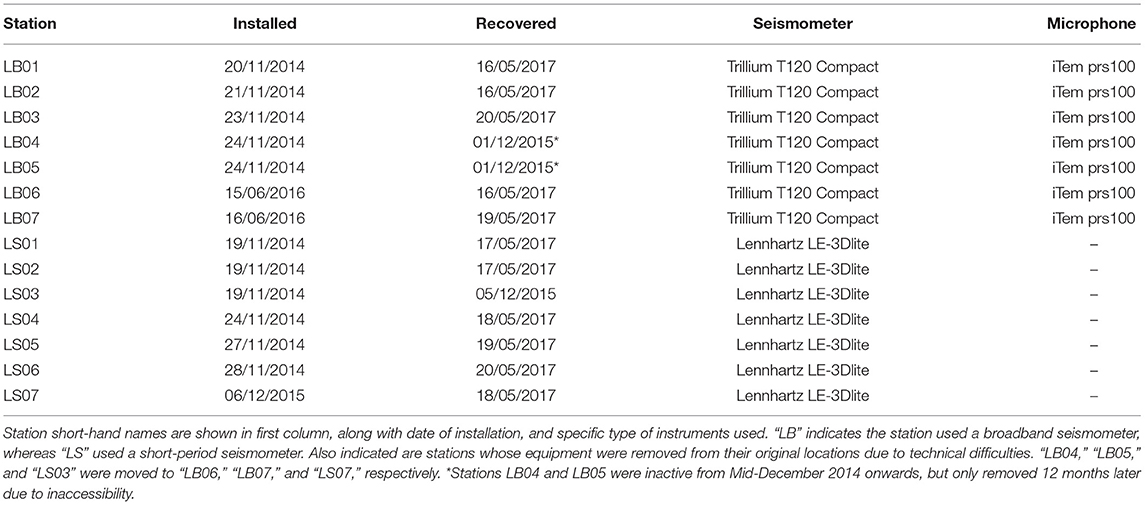
Table 1. Details of the stations deployed in the temporary network at Santiaguito dome complex.
During the visits to Santiaguito, we complemented the geophysical dataset with optical and thermal observations. Thermal infrared (TIR) videos were recorded with a FLIR T450sc infrared camera equipped with a 30 mm lens (FOV: 15 × 11.25, IFOV: 0.82 mrad). During thermal image capture, we recorded the atmospheric temperature, humidity, and the distance from the lava dome for appropriate corrections of signal transmissivity through the atmosphere.
3. Eruptive Activity During 2014–2017
The following chronology is based on a combination of observations compiled by the authors during multiple field campaigns from 2014 to 2017 and are summarized in Figure 2. We have identified three phases of activity at Santiaguito, each defined by changes in eruptive activity: November 2014–June 2015, July 2015–September 2016, and October 2016 to May 2017. We also begin this section by describing the significant eruptive activity which took place at Santiaguito in 2014, before commencement of the field campaigns in November 2014. Further details are derived from monitoring observations at INSIVUMEH, also reported in the Bulletin of the Global Volcanism Network, available on the Global Volcanism Program website (volcano.si.edu).
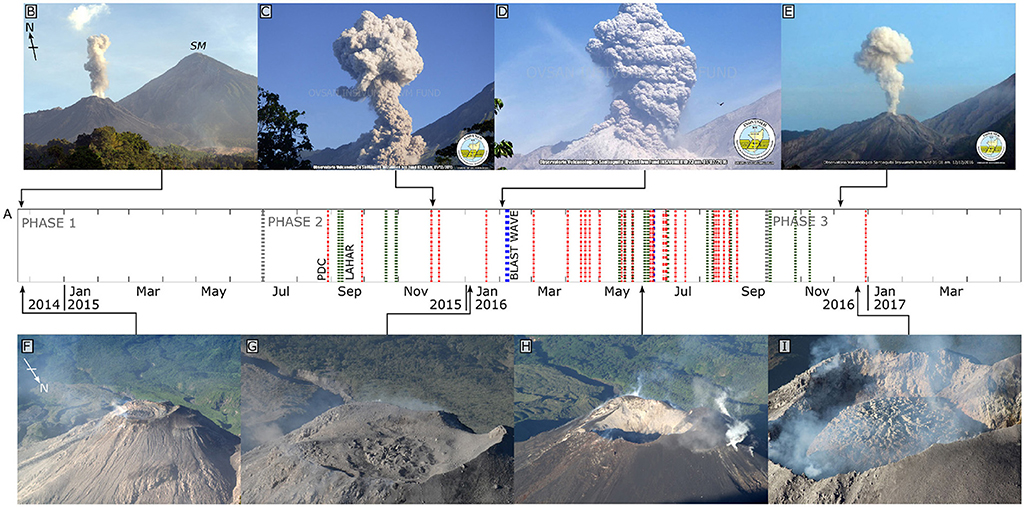
Figure 2. (A) Timeline of activity at Santiaguito dome complex between November 2014 and May 2017. Gray dashed lines separate different phases of activity. Red dashed lines indicate explosions accompanied by pyroclastic density currents (PDCs). Green dashed lines indicate reported major lahars. Blue dashed lines indicate explosions accompanied by reported blast waves. (B–E) Images of explosions during this period. Images (C–E) were kindly provided by INSIVUMEH, and all images were captured at or near the old OVSAN building, looking NNE (OVSAN in Figure 1). For scale, the height difference between the vent and the summit of Santa Maria volcano (SM, A) is approximately 1.3 km. (F–I) Images of the evolution of El Caliente vent during our period of study, as seen from the summit of Santa Maria volcano, looking SW (SM, A). For scale, the diameter of the vent in panel (H) is 300 m. Image (I) was provided courtesy of A. Pineda.
3.1. Significant 2014 Activity
Regular activity at Santiaguito during 2014 was punctuated by a major dome collapse followed by the emplacement of a lava flow. The collapse, which occurred on 9th May, removed a significant section of the eastern flank of El Caliente vent and produced a PDC that traveled ~7 km to the south; 1 × 10⁶ m3 of tephra was deposited. This was followed in the next 2 weeks by a series of lahars, including two major events on 6th June and 15th July that damaged local infrastructure and forced temporary evacuations. Shortly after the 9th May collapse, a lava flow was observed descending the newly formed collapse scar and generating incandescent rockfalls. The flow continued for the rest of 2014, splitting into two lobes and eventually halting in December at a final length of 3.5 km from the El Caliente vent (Global Volcanism Program, 2015). Throughout this period of activity, small gas-and-ash explosions continued to occur at regular intervals, forming plumes up to 1 km above the vent. No large explosions were reported during this period.
3.2. Phase 1: November 2014–June 2015
During the deployment of the instrument network in November/December 2014, regular gas-and-ash explosions were observed from El Caliente (Figure 2B). Incandescence was observed at the vent, although lava effusion was negligible or had ceased (Figures 3A,B). Previous investigations have found correlations between local incandescence intensity and gas fluxing from the vent surface of El Caliente (Johnson et al., 2014). We observe a variation in the location of temperature intensities across the surface of the vent during this time period (white arrows in Figures 3A,B), indicating the dynamic nature of the vent during this phase. Frequent rockfalls occurred at the top of the lava flow on the El Caliente vent rim, and at or near the front of the lava flow lobes. Rockfalls were also frequently observed descending the unstable 1902 crater wall on the southwestern flank of Santa Maria (not linked to the ongoing effusive activity). No large explosions or PDCs were reported during this period.
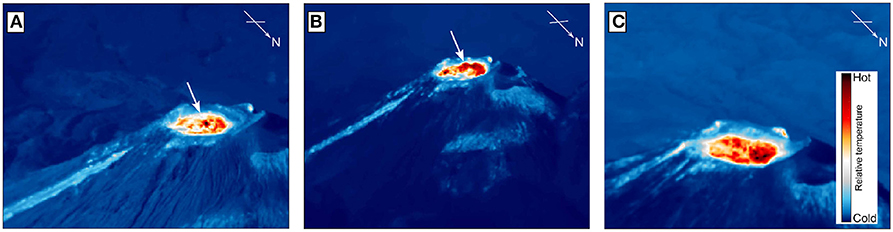
Figure 3. Composite thermal images of the El Caliente dome and vent recorded from the vantage point on Santa Maria during (A) 29/11/2014, (B) 27/03–03/04/2015, and (C) 07–09/01/2016. The images were generated by stacking the frames of thermal videos taken during these time periods (63,424, 115,650, and 81,964 frames for each panel, respectively). Thus each panel represents an average of the relative dome temperature distributions during each period. For scale, the hot region within the vent is 200 m in diameter. The white arrows in (A,B) highlight the change from a concentrated hotspot to concentric fractures between the two dates.
3.3. Phase 2: July 2015–September 2016
Regular explosive activity continued until July/August 2015. At this point explosions were less regular (<10 per day) and more energetic than before, sometimes accompanied by PDCs (Figure 2C). The largest group of explosions in 2015 were observed in December, producing ash plumes up to 7 km above sea level (a.s.l.). The explosions during this phase of activity were visually darker and thus more ash-rich than in 2014. Fine ash fell at least 10 km from the vent in all directions, and eruptive plumes were tracked by the Washington VAAC for 280 km before dissipating. During this phase, heavy rainfall triggered hot lahars that descended along river drainages to the south on 8th September, 11th September, 21st October, and 30th October (Global Volcanism Program, 2016a).
From January to June 2016, major ash-rich explosions and PDCs occurred at irregular intervals with smaller explosions in between. Plumes rose to 5 km a.s.l. with ash regularly falling on villages up to 20 km from the vent. Thermal images captured in January 2016 indicate higher temperatures over a broader area of the vent surface (Figure 3C). In February 2016, a series of strong explosions were reported to be producing dense ash clouds up to 6 km a.s.l. and accompanied by PDCs. Explosions on 7th February were heard up to 25 km away (Global Volcanism Program, 2016b). The largest explosions of the entire 2-year period, observed in April and May 2016, ejected 2–3 m diameter blocks up to 3 km away from the vent, and excavated the summit crater to ~300 m width and ~175 m depth (Figure 2H). In early July, large meter-size, breadcrust bombs were discovered ~1.8 km away from the vent (Figure S1). Heavy rainfall triggered two lahars in May, five in June, four in August, and a further ten in September (Global Volcanism Program, 2016b, 2017). Irregular, large, explosions occasionally accompanied by PDCs continued through July, August, and into September.
3.4. Phase 3: October 2016–May 2017
In October 2016, a new phase of activity was observed, characterized by the extrusion of lava into the summit crater of El Caliente (Figure 2I). By February 2017, this new lava extrusion had filled over 60% of the summit crater. By March 2017, the extrusion had grown large enough that lava could overflow the vent rim and occasional block-and-ash flows descended tens of meters down the flanks of El Caliente. Concurrently, the number of low- to moderate-energy explosions from the El Caliente was reported to increase gradually, reaching up to 35 events per day in May 2017 (Global Volcanism Program, 2017). No large vulcanian explosions were reported during this phase.
4. Seismic and Acoustic Infrasound
The characteristics of seismic and acoustic signals recorded by our network of instruments during 2014-2017 exhibit substantial variability. Here we provide a synopsis of key geophysical observations within the context of the activity described in section 3, and observations of past eruptive activity as reported by previous studies.
4.1. Activity Overview
An overview of seismic activity between November 2014 and May 2017 is provided by the network-averaged Real-Time Seismic Amplitude Measurement (henceforth referred to as the Network RSAM) shown in Figure 4. RSAM is a continuous measurement of the seismic intensity recorded at a station and was developed to quickly assess volcanic activity (Endo and Murray, 1991). As no station operated continuously throughout the whole study period, it was necessary to construct a Network RSAM, which uses data from multiple stations across the network. (A detailed description of how Network RSAM was generated is provided in section 1.1 of the Supplementary Material). Network RSAM is generally low throughout our entire period of study, although frequently punctuated by large spikes in amplitude (Figure 4A). The size and frequency of these spikes increase after July 2015, the largest occurring in March 2016. Most of these spikes are associated with explosive activity at Santiaguito, with some produced by tectonic earthquakes within 800 km of the volcano (M6+, marked by red triangles in Figure 4A), or lahars in the region.
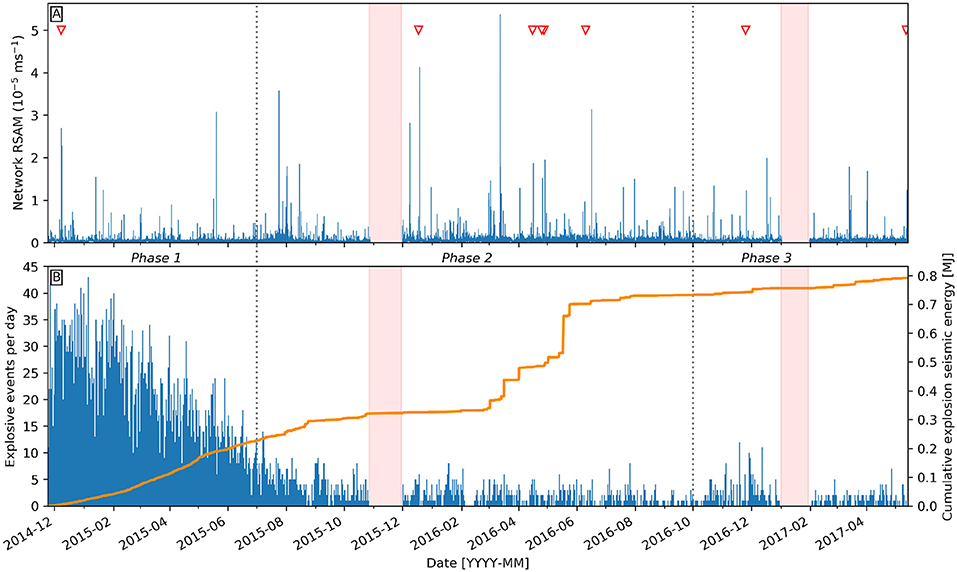
Figure 4. (A) Network real-time seismic amplitude measurement (Network RSAM) between November 2014 and May 2017. Red triangles indicate M6+ tectonic earthquakes located within 800 km of Santiaguito. (B) Daily counts of explosive events detected at Santiaguito dome complex over the same time period (blue bars) and the cumulative explosion seismic energy (orange line). Periods shaded in light red indicate when no stations in the network were recording data. Dotted lines separate the three phases of eruptive activity as described in the text.
To follow trends in eruptive activity during our study period, we have automatically tracked the rate of explosive activity at Santiaguito using the seismic and infrasound datasets. Explosive activity at Santiaguito has previously been observed to frequently occur with a pulsatory nature, with multiple distinct explosions occurring within a relatively short interval of time (<30 s spacing; Johnson et al., 2014; Scharff et al., 2014). The distinct explosion pulses may erupt from one or more different fractures across the surface of the active El Caliente vent (Jones and Johnson, 2011; Scharff et al., 2014). Here we define a single “explosive event” as that which includes at least one explosive pulse within a short time interval (<120 s). Seismic waveforms from each event were detected using an envelope matching algorithm and cross-referenced with acoustic triggers selected via a waveform characterization algorithm (Bueno et al., preparation, VINEDA—Volcanic Infrasound Explosions Detector Algorithm). The algorithm uses infrasound waveform shape, amplitude and frequency content to search for explosion waveforms and includes noise reduction techniques to amplify signals of low signal-to-noise ratio.
To quantify the changes in relative explosivity during our period of study, we have estimated the seismic energy produced during each detected event. We adopt an approach that assumes seismic velocity waveforms are representative of the kinetic energy density at individual station locations around the volcano (Johnson and Aster, 2005) (A detailed description of the approach and equation used is provided in section 1.2 of the Supplementary Material). This approach includes a number of generalizations, such as assuming a homogenous half-space, and a fixed P-wave velocity throughout the period of study. However, this approach allows us to quickly assess the relative explosivity of individual events over a large time series. Acoustic energy for the explosions may be calculated from the infrasound dataset, but the acoustic dataset is relatively incomplete and more work is needed to constrain the effects of topography and variable atmospheric conditions.
In total, 6,101 explosive events were detected between November 2014 and May 2017, with large variations in the number of events per day (Figure 4B). In December 2014 and during the first half of 2015 (Phase 1), explosions occurred at high rates (>20 events per day) and relatively low energies, similar to activity reported in previous studies and reports (e.g., Johnson et al., 2014). However, it is clear that the daily rate of explosive events fluctuates about a generally decreasing trend through the latter half of Phase 1 and into Phase 2. This indicates that the transition between Phase 1 and 2 was gradual instead of sudden, as might be inferred from activity reports (section 3). Event rates between mid-2015 and the end of September 2016 (Phase 2) consistently remained at low levels, with <10 events per day. The most energetic explosions during this phase occurred during March to May of 2016 (Figure 4B), which agrees with the activity reported at that time (section 3.3). In late 2016, phase 3 begins with a 2-month long period of increased explosion rate, which coincided with the beginning of effusive activity (section 3.4). Explosion energies during this phase stay relatively low with a few events of relatively large seismic energy (Figure 4B). We note here that the explosion rates characterized using waveform picking in late 2016 and into 2017 falls below the explosion rates presented in activity reports (section 3.4). This may be due to our definition of an “explosive event”, low signal-to-noise ratios or data dropouts due to technical issues. Therefore, we acknowledge that this dataset likely underrepresents the true number of low-energy explosions that occurred during our period of study. Nevertheless, the results plotted in Figure 4B are a good indicator of the changes in activity taking place at the volcano.
4.2. Regular Low-Energy Explosions
Phase 1 was characterized by regular gas-and-ash plumes at intervals of 0.5–1 h (Figure 4B). This behavior had been observed at Santiaguito since 1975 (Rose, 1987) and has been well-documented and analyzed through multiple field studies and methods (Bluth and Rose, 2004; Johnson et al., 2004, 2008, 2009, 2011, 2014; Sahetapy-Engel et al., 2008; Yamamoto et al., 2008; Johnson and Lees, 2010; Sanderson et al., 2010; Holland et al., 2011; Scharff et al., 2014; Lavallée et al., 2015; De Angelis et al., 2016). A typical example of the seismic waveform generated by explosions of this magnitude is presented in Figure 5, along with a thermal image of the same event. The seismic waveform shares characteristics with those previously described at Santiaguito (e.g., Johnson et al., 2008), with peak frequencies concentrated below 5 Hz (Figure 5B). Analysis of acoustic and thermal data recorded during a similar explosion on 30th November 2014 finds that these events contain only minor fractions of ash, therefore little magma fragmentation is taking place in the conduit (De Angelis et al., 2016).
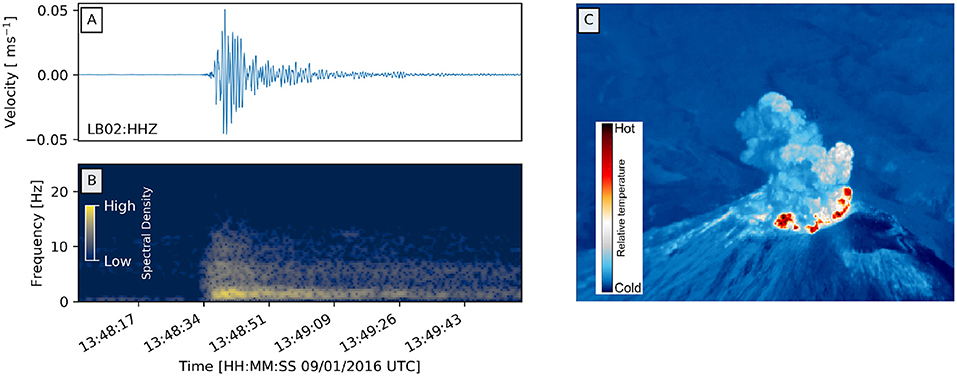
Figure 5. Seismic record (A) and frequency spectrogram (B) of a small explosion recorded on 09/01/2016 at station LB02. A 0.1 Hz high-pass filter has been applied to the seismic record. (C) Thermal image of the explosion event captured at 09/01/2016 13:48:49.456 (UTC), 16 s after the explosion plume first appeared at the surface. For scale, the plume is over 300 m in height above the surface of the vent.
4.3. Deformation Cycles
In 2012, the regular low-energy explosions were observed to coincide with ~26-min inflation-deflation deformation cycles of the volcanic edifice, with peak inflation commonly culminating in an outgassing event or an explosion (Johnson et al., 2014; Lavallée et al., 2015). We tested whether the eruptive activity during the first few months of our study was similar to that reported by Johnson et al. (2014). Radial tilt can be derived from broadband seismic data by a magnification of the low-pass filtered integral of the displacement time-series (De Angelis and Bodin, 2012). Here, we used data recorded on 1st December 2014 by one of the closest stations, LB04 (Figures 1, 6B), located 500 m from the eruptive vent. The calculated radial tilt (Figure 6A) displays similar cyclic deformation characteristics to those observed in 2012 at the same location (Figures 6C,D; Johnson et al., 2014), but with a periodicity of 30–90 min. The most pronounced inflation phase commonly culminated with explosions (marked by more pronounced peaks in Figure 6B), whereas smaller inflation phases resulted in outgassing events (Figures 6A,B). Our observations suggest that activity observed until June 2015 was a continuation of the eruptive activity that had been characteristic of El Caliente since 1975.
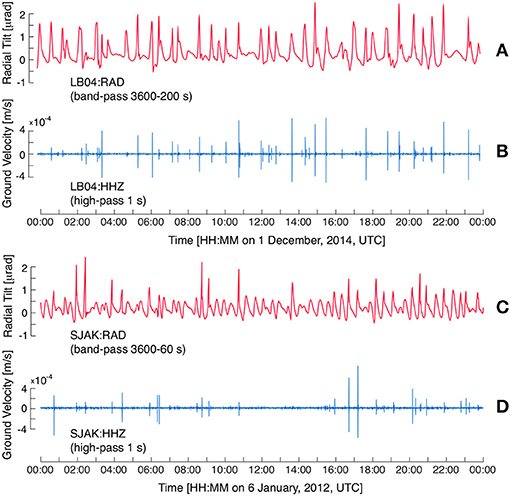
Figure 6. Radial tilt (red) derived from ground velocity (blue) recorded from seismometers or tiltmeters located close to El Caliente vent during two studies: LB04 (A,B) from our study, and SJAK (C,D) from Johnson et al. (2014). Station SJAK was deployed in the approximately the same location as station LB04.
4.4. Large Explosions and Blast Waves
Eruptive activity during Phase 2 (July 2015 to September 2016) at Santiaguito was defined by the irregular occurrence of large explosions, producing ash plumes up to 7 km a.s.l. The most intense eruptions were reported in the first half of 2016, between February and May (Figure 2D, section 3.3). This series of large explosions caused the excavation of the eruptive vent at the Caliente dome (Figure 2H). The explosions in early February 2016 generated powerful blast waves that were heard up to 25 km away from the vent, resulted in minor damage to nearby buildings, including shattered windows (section 3.3), and were recorded by the acoustic microphones deployed around the volcano (Figure 7).
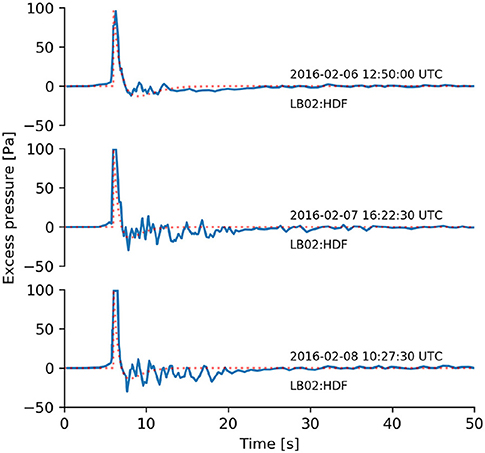
Figure 7. Infrasonic acoustic waveforms (blue line) from three large explosions in early February 2016 as recorded at station LB02. Each event is overlain with the modeled Friedlander wave (red dashed line) that indicates the blast wave nature of the events.
Blast waves (a.k.a. shock waves) are generated by the supersonic release of pressure from a confined small volume (Needham, 2010). Blast waves generated during volcanic explosions are often observed visually but are rarely seen in the acoustic record (Marchetti et al., 2013). The acoustic waveforms generated during such events are characterized by the sharp compressive onset immediately followed by a longer-lasting rarefaction wave of smaller amplitude (Needham, 2010), a sequence well-defined by the Friedlander equation (section 1.3 in Supplementary Material; Marchetti et al., 2013). Indeed, the acoustic waveforms recorded during the large explosions in early February 2016 are well-approximated by the Friedlander equation (Figure 7). This represents the first such direct geophysical measurement of blast waves at Santiaguito dome complex (to our knowledge).
4.5. Pyroclastic Density Currents
PDCs were often reported on the flanks of Santiaguito during the period of heightened explosive activity of Phase 2. Large explosions were frequently accompanied by one or multiple PDCs descending the SW, S or SE flanks of the El Caliente dome with run-out distances of up to 3 km. No significant PDC was reported without an accompanying explosion. Most PDCs resulted from partial collapse of the eruptive column during explosive events. One PDC on 8th March 2016 was reported as caused by an additional collapse of part of the El Caliente dome, triggered by a moderate explosion (Global Volcanism Program, 2016b). It remains unconfirmed that several PDCs could have been caused by the excavation of the El Caliente vent during large explosive activity (section 3.3, Figure 2H).
Multiple PDC events were recorded in our dataset during our period of study. A seismic waveform for a PDC observed on 19th June 2016 is plotted in Figure 8C. This event was reported by the Santiaguito Volcano Observatory (OVSAN) and the accompanying explosion produced a plume up to a height of 5 km a.s.l. (Global Volcanism Program, 2016a). The PDC waveform has a duration of only a few minutes, consistent with a relatively short run-out distance down the south or south-western flanks of El Caliente.
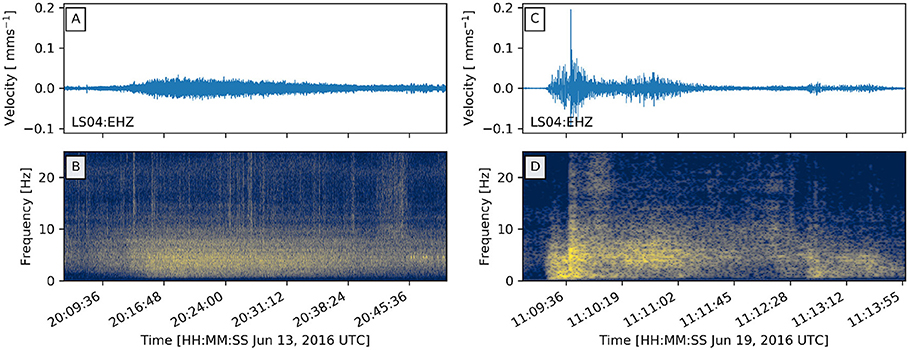
Figure 8. Example seismic records (A,C) and frequency spectrograms (B,D) of a lahar on 13th June 2016 (A,B) and an explosion followed by a pyroclastic density current on 19th June 2016 (C,D). The unfiltered seismic waveforms were recorded at station LS04. The waveform and frequency characteristics shown here are typical for these types of events as recorded at this station. Spectral scale is identical to that in Figure 5.
4.6. Lahars
Deposits from PDCs and explosions since May 2014 have provided a large supply of sediment to the fluvial systems around Santiaguito. Mobilization of the volcanic material in the annual rainy season triggers lahars and aggradation. Lahar activity typically impacts a fluvial system extending as much as 60 km SW from Santiaguito to the Pacific coast of Guatemala, a heavily populated and farmed zone (Harris et al., 2006). Here we focus on the largest lahars that occurred during our period of analysis, particularly those reported by INSIVUMEH and the Bulletin of the Global Volcanism Network, published on the Global Volcanism Program website (volcano.si.edu). Smaller, unreported lahars will be difficult to distinguish from PDCs without additional information, since both types of events share similar frequency content and amplitudes (e.g., Figure 8; Huang et al., 2007).
Between November 2014 and May 2017, at least 16 major lahars were observed and reported descending the barrancas (steep-sided valleys) on the south-western flank of Santiaguito. In the seismic record, these events were characterized by emergent waveforms with durations of up to 1 h (Figure 8A). The energy in the lahar signals was broadly distributed below 25 Hz, but the majority was concentrated below 10 Hz (Figure 8B). Six major barrancas lie between stations LB01 and LS04 (Figure 1), and it is important to know which of these barrancas the lahars are descending so that timely and correct warnings can be released to the public. However, it is difficult to assess within which of these the lahars traveled based on the seismic and acoustic data presented here.
4.7. Rockfalls
Rockfall were frequently recorded throughout our period of study. Three sources of rockfall were identified around Santiaguito during field campaigns. The first, and the source of a clear majority of rockfalls in our dataset, was the unstable scarp formed on the southwestern flank of Santa Maria volcano during the 1902 eruption (Williams and Self, 1983). Rockfalls were also observed along the flanks of the El Caliente (Figure 9, Movie S1) and La Mitad lava domes, an indication of their instability. Rockfalls originated on the southwestern flank of Santa Maria could be easily identified by their seismic amplitude distribution across the network (larger amplitude waveforms were recorded at station LS06 for rockfalls from the unstable scarp) and by visual observations in the field. On inspection of the seismic data, the number of rockfalls inferred to have originated from the lava domes showed no obvious correlation with the number and energy of explosive events during the study period. Small and infrequent rockfalls from the front and flank of the 2014 lava flow were also witnessed but rarely recorded.
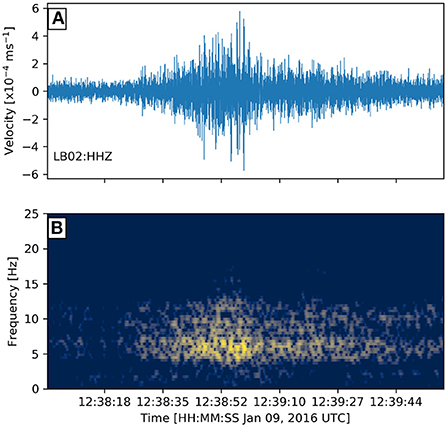
Figure 9. Seismic record (A) and frequency spectrogram (B) of rockfall recorded at station LB02 on 9th January 2016. A high-pass filter at 0.5 Hz has been applied to the seismic record. The source location for this event was down the western flank of Caliente dome. A thermal recording of the event can be seen in Movie S1. Spectral scale is identical to that in Figure 5.
4.8. Volcano-Tectonic Swarms
Volcano-tectonic (VT) earthquakes are characterized by sharp, mostly impulsive onsets of P- and S-waves with broad spectra up to 15 Hz (Lahr et al., 1994). They share similarities with tectonic earthquakes, but are instead interpreted as the result of stress perturbation due to magmatic intrusion (e.g., Sigmundsson et al., 2015) or by hydrothermal fluids expelled from a magmatic body (e.g., Hill, 1996). Rather than mainshock-aftershock sequences that define major tectonic earthquakes, VTs often occur as intense swarms of earthquakes located beneath or near a volcano. Here, we report the first evidence of VT swarm activity recorded at Santiaguito volcano (to our knowledge).
At least one VT swarm was detected during mid-2016. Figure 10 shows seismic data for the swarm recorded on the 24th July 2016 which started after 00:00 (UTC) and continued for a total of 11 h. During that time, 275 VT earthquakes were recorded at station LB03. The average repose interval between individual earthquakes throughout the swarm decreased from 600 to 120 s. Concurrently, their amplitudes slowly increased through the swarm. Waveform correlation analysis of the events suggests there is very little degree of repetitiveness throughout the swarm, suggesting no VTs repeatedly occurred in the same location. The swarm ended concurrently with a relatively minor explosion, although it is unclear if the two events are related. VT events continued to be recorded until the end of July, with a few events seen in August. However, VT events were only discernible in data recorded at LB03 which had many data gaps during this period so it is difficult to assess the total number of events occurred.
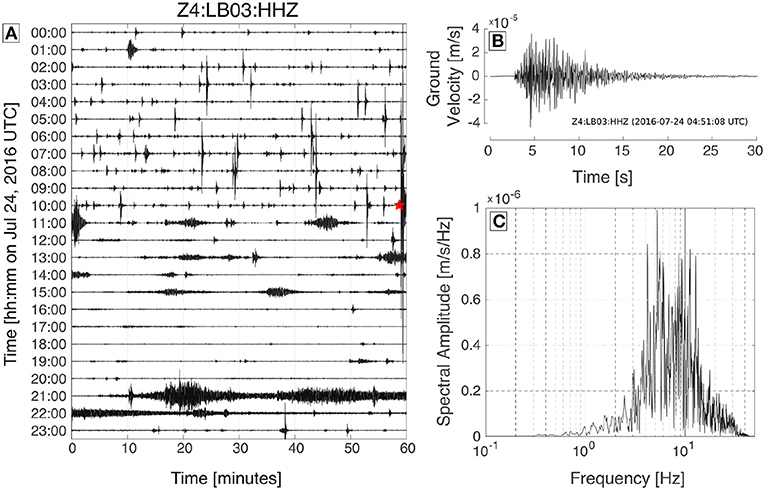
Figure 10. (A) 24-h helicorder from station LB03 on 24th July 2016 showing a short swarm of volcano-tectonic earthquakes from 00:00 to 11:00 UTC, followed closely by an explosive event (red star). The explosion is followed by a sequence of rockfall events, as well as two seismo-tectonic events. The long-lived high amplitude event from 21:00 to 22:30 is likely an unreported lahar. (B) The waveform and (C) frequency spectrum of one volcano-tectonic earthquake during the swarm in (A), demonstrating the high-frequency nature of the volcano-tectonic events.
4.9. Absence of Precursory Long-Period Seismicity
Long-period (LP) seismicity are transient signals characterized by emergent P-waves and Rayleigh waves with a lack of distinct S-waves, dominated by frequencies in the 0.5–5 Hz range (Chouet, 1996). LP seismicity are commonly observed at volcanic systems all around the globe and are attributed to various mechanisms such as the resonance of fluid-filled cavities (e.g., Chouet, 1996), slow-rupture failure in volcanic material (e.g., Lamb et al., 2015), or magma failure (e.g., Neuberg et al., 2006). At Santiaguito, seismic waveforms of LP frequencies have been observed during explosions and were attributed to an abrupt mass shift of solidified or degassed magma (Johnson et al., 2008). Indeed, we have observed similar LP frequencies during explosions in the dataset described here (section 4.2, Figure 5).
More notable for Santiaguito is the apparent absence of LP seismic events prior to explosive events. Swarms of LP events have been frequently observed before major explosive events at volcanoes and have been attributed to pressurization beneath an impermeable cap (e.g., Chouet, 1996) or brittle fracturing of ascending magma (e.g., Varley et al., 2010). It appears the conditions to generate LP seismicity prior to explosions were not present at Santiaguito, or the earthquakes could not be distinguishable above the background noise levels.
5. Discussion and Concluding Remarks
The progression in explosive activity at Santiaguito from 2014 to 2017 has been recorded in detail by the seismic and infrasound dataset, complemented by detailed optical and thermal observations made during field campaigns (Figures 2–4). The regular explosive activity seen in the first phase of our dataset appears to be a clear continuation of that reported at Santiaguito by previous studies (Sahetapy-Engel et al., 2008; Johnson et al., 2014). The first indication for a change in explosive behavior occurred when the first large vulcanian explosions appeared in late 2015. However, it is clear from the explosion time series compiled here that the transition from regular, low-energy explosions to irregular, occasionally high-energy explosions took place gradually over the latter half of 2015, with the highest energy explosions taking place in March to May 2016 (Figure 4B). Decreases in daily explosion rate at Santiaguito (and other silicic lava dome eruptions) cannot be assessed alone and interpreted as an indicator of weaker future eruptive activity and, therefore, decreased hazard. Interpretations must instead be corroborated by other supporting evidence and hazard assessments must now include the possibility that such trends may instead lead to increased volcanic intensity and in turn, increased hazard to surrounding population areas.
The escalation to more explosive activity at Santiaguito raises the question of what process had occurred within the volcanic system that promoted this transition in activity. Similar escalations in activity have been observed at other long-term silicic effusive eruptions, including Volcán de Colima (Mexico) and Soufrière Hills volcano (Montserrat). Cyclic effusive activity at Volcán de Colima from 1998 to 2017 was interrupted by heightened explosive activity in 2005 and 2015. The high pressures needed to produce the vulcanian explosions in 2005 were explained by strong vertical gradients in viscosity within the magma column as well as the growth of microlites in the upper conduit (Arámbula-Mendoza et al., 2011). The rapid transition to dome collapse and explosive activity in 2015 was linked to the arrival of relatively volatile-rich magma into the shallow magma column (Reyes-Dávila et al., 2016). Soufrière Hills volcano underwent multiple phases of effusive and explosive activity between 1995 and 2010 (Wadge et al., 2014). Christopher et al. (2015) proposed the presence of a multi-level, mature magmatic system beneath the volcano and theorized that destabilization of the system can lead to elevated levels of volcanic activity at the surface. Destabilization may be caused by mixing of magmas of different compositions which triggers degassing and pressurization of the system. The magmas of varying compositions may come from different sections of the system, or from an intrusion of new magma from greater depths. The latter example has been suggested based on evidence of mafic inclusions and disequilibrium textures in crystals within erupted lavas (e.g., Saunders et al., 2012). The timing of new magma intrusions into the volcanic system, constrained by diffuse chronometry, has appeared to correlate with deep-seated seismicity at, for example, Mount St. Helens (Saunders et al., 2012) and Mt. Ruapehu (Kilgour et al., 2014). However, no such deep-seated seismicity indicating magma movement was observed at Santiaguito prior to the escalated activity in 2015–2016. It is possible any intrusion may have occurred prior to the instrument deployment in November 2014 as the effects on surface activity may not occur until years afterwards (Saunders et al., 2012). At Santiaguito, the 2015–2016 escalation in activity was preceded by a long-term decay in extrusion rates since 1922 (Harris et al., 2003) and a decrease in the bulk SiO2 content of the eruptive products (Scott et al., 2013), suggesting a magmatic system becoming increasingly depleted of eruptible magma. It is also worth noting that this period of escalated activity followed a short period of relatively heightened effusion rates, manifested by three lava flows since 2010 (Rhodes et al., 2018; Hornby et al., in review). Further work is needed, particularly with geochemical analyses of the eruptive products, before conclusions can be drawn regarding the trigger mechanism for escalated eruptive activity at Santiaguito.
The preliminary overview of the activity and our observations presented here represent the foundations for future studies which we speculate will demonstrate the value of investment in long-term multi-parametric monitoring of active volcanoes. A detailed study into the trigger mechanisms of the large vulcanian explosions in 2015 can lead to improved near-real time emergency responses (e.g., Arámbula-Mendoza et al., 2011) as well as more accurate ash-tracking systems, an important tool for the aviation industry (e.g., Mastin et al., 2009). Detailed analysis of the seismic and infrasonic signals generated during lahars or PDCs, combined with studies of their physical characteristics, could produce improved hazard assessments (e.g., Johnson and Palma, 2015). Locating and tracking the evolution of the volcano-tectonic seismic swarms in mid-2016 may give useful insights into the short- and long-term behavior of Santiaguito, particularly with regards to the transition from explosive to effusive activity in late 2016 (e.g., White and McCausland, 2016). Complementary insights may also be gained from studies carried out on the geochemical and rheological properties of the recent eruptive products (e.g., Rhodes et al., 2018), changes in the morphology of the dome in relation to eruptive activity (e.g., James and Varley, 2012) as well from the thermal and optical images of the explosions collected during field campaigns (e.g., Sahetapy-Engel et al., 2008). Altogether, these studies have the potential for improving our understanding of long-lived silicic dome eruptions. In turn, their findings will help refine and enhance the hazard assessments needed to protect nearby populations during such activity.
Author Contributions
OL, AL, AD-M, SDA, AH, FvA, JK, AR, GC, and YL conducted fieldwork around Santiaguito across multiple field campaigns from 2014 to 2017. OL, AD-M, SDA, IA, AR, and EG processed and interpreted all the seismic and infrasound data. AL and JK processed and analyzed the thermal images. PW, AH, JE, and YL integrated knowledge of the eruptive products and eruption dynamics to constrain shifts in activity. OL compiled all the data and wrote the manuscript, to which all authors have contributed.
Funding
YL, OL, AL, AH, FvA, PW, and JK acknowledge support from the European Research Council Starting Grant on Strain Localisation in Magma (SLiM, 306488). SD, AR, and YL thank the Natural Environment Research Council (NERC) for an urgency grant on Rapid deployment of a multi-parameter geophysical experiment at Santiaguito volcano, Guatemala, following a marked increase in explosive activity (NE/P007708/1) and the Liverpool Earth Observatory for financially supporting the undertaking of this long-term, large-scale, multi-parametric investigation. AD-M was partially funded by NERC grant NE/P00105X/1 and the Spanish Mineco Project KNOWAVES (TEC2015-68752). IA was supported by Spanish research grant MECD Jose Castillejo CAS17/00154.
Conflict of Interest Statement
The authors declare that the research was conducted in the absence of any commercial or financial relationships that could be construed as a potential conflict of interest.
Acknowledgments
We acknowledge the support provided by the Instituto Nacional de Sismología, Vulcanología, Meteorología, e Hidrología (INSIVUMEH), Guatemala, and the staff of the Observatorio Vulcanológico Santiaguito (OVSAN). We are also grateful to our local guide and network manager in Guatemala, A. Pineda, as well as to J. Johnson for permission to use the data presented in Figures 6C,D. The raw data supporting the conclusions of this manuscript will be made available by the authors, without undue reservation, to any qualified researcher. Finally, we would like to thank the editors, Luis Lara and Valerio Acocella, and the two reviewers for their suggestions that helped improve the manuscript.
Supplementary Material
The Supplementary Material for this article can be found online at: https://www.frontiersin.org/articles/10.3389/feart.2018.00253/full#supplementary-material
References
Arámbula-Mendoza, R., Lesage, P., Valdés-González, C., Varley, N. R., Reyes-Dávila, G. A., and Navarro, C. (2011). Seismic activity that accompanied the effusive and explosive eruptions during the 2004-2005 period at Volcán de Colima, Mexico. J. Volcanol. Geotherm. Res. 205, 30–46. doi: 10.1016/j.jvolgeores.2011.02.009
Bluth, G. J., and Rose, W. I. (2004). Observations of eruptive activity at Santiaguito volcano, Guatemala. J. Volcanol. Geotherm. Res. 136, 297–302. doi: 10.1016/j.jvolgeores.2004.06.001
Calder, E. S., Lavallée, Y., Kendrick, J. E., and Bernstein, M. (2015). “Lava dome eruptions,” in The Encyclopedia of Volcanoes, 2nd Edn., eds H. Sigurdsson, B. Houghton, H. Rymer, J. Stix, and S. R. McNutt (Amsterdam: Academic Press), 343–362.
Chouet, B. A. (1996). Long-period volcano seismicity: its source and use in eruption forecasting. Nature 380, 309–316. doi: 10.1038/380309a0
Christopher, T. E., Blundy, J., Cashman, K., Cole, P. D., Edmonds, M., Smith, P. J., et al. (2015). Crustal-scale degassing due to magma system destablization and magma-gas decoupling at Soufrière Hills Volcano, Montserrat. Geochem. Geophys. Geosyst. 16, 2797–2811. doi: 10.1002/2015GC005791
De Angelis, S., and Bodin, P. (2012). Watching the Wind: Seismic data contamination at long periods due to atmospheric pressure-field-induced tilting. Bull. Seismol. Soc. Am. 102, 1255–1265. doi: 10.1785/0120110186
De Angelis, S., Lamb, O. D., Lamur, A., Hornby, A. J., von Aulock, F. W., Chigna, G., et al. (2016). Characterization of moderate ash-and-gas explosions at Santiaguito volcano, Guatemala, from infrasound waveform inversion and thermal infrared. Geophys. Res. Lett. 43, 6220–6227. doi: 10.1002/2016GL069098
Delle Donne, D., and Ripepe, M. (2012). High-frame rate thermal imagery of Strombolian explosions: implications for explosive and infrasonic source dynamics. J. Geophys. Res. 117. doi: 10.1029/2011JB008987
Dingwell, D. B. (1996). Volcanic dilemma: flow or blow? Science 273, 1054–1055. doi: 10.1126/science.273.5278.1054
Edmonds, M., Oppenheimer, C., Pyle, D. M., Herd, R. A., and Thompson, G. (2003). SO2 emissions from Soufriere Hills Volcano and their relationship to conduit permeability, hydrothermal interaction and degassing regime. J. Volcanol. Geotherm. Res. 124, 23–43. doi: 10.1016/S0377-0273(03)00041-6
Endo, E. T., and Murray, T. (1991). Real-time Seismic Amplitude Measurement (RSAM): a volcano monitoring and prediction tool. Bull. Volcanol. 53, 533–545. doi: 10.1007/BF00298154
Farquharson, J. I., Heap, M. J., Varley, N. R., Baud, P., and Reuschlé, T. (2015). Permeability and porosity relationships of edifice-forming andesites: a combined field and laboratory study. J. Volcanol. Geotherm. Res. 297, 52–68. doi: 10.1016/j.jvolgeores.2015.03.016
Fink, J. H. (1990). “Lava flows and domes,” in IAVCEI Proceedings in Volcanology (Berlin; Heidelberg: Springer).
Gaunt, H., Sammonds, P. R., Meredith, P. G., Smith, R., and Pallister, J. S. (2014). Pathways for degassing during the lava dome eruption of Mount St. Helens 2004-2008. Geology 42, 947–950. doi: 10.1130/G35940.1
Global Volcanism Program (2015). “Report on Santa Maria (Guatemala) – July 2015,” in Bulletin of the Global Volcanism Network, Vol. 40, ed E. Venzke (Washington, DC: Smithsonian Institution).
Global Volcanism Program (2016a). “Report on Santa Maria (Guatemala) – February 2016,” in Bulletin of the Global Volcanism Network, Vol. 41, ed E. Venzke (Washington, DC: Smithsonian Institution).
Global Volcanism Program (2016b). “Report on Santa Maria (Guatemala) – September 2016,” in Bulletin of the Global Volcanism Network, Vol. 41, ed E. Venzke (Washington, DC: Smithsonian Institution).
Global Volcanism Program (2017). “Report on Santa Maria ( Guatemala ) – December 2017,” in Bulletin of the Global Volcanism Network, Vol. 42, ed E. Venzke (Washington, DC: Smithsonian Institution).
Gonnermann, H. M., and Manga, M. (2007). The fluid mechanics inside a volcano. Annu. Rev. Fluid Mech. 39, 321–356. doi: 10.1146/annurev.fluid.39.050905.110207
Goto, A. (1999). A new model for volcanic earthquake at Unzen Volcano: Melt Rupture Model. Geophys. Res. Lett. 26, 2541–2544. doi: 10.1029/1999GL900569
Harris, A. J. L., Rose, W. I., and Flynn, L. P. (2003). Temporal trends in lava dome extrusion at Santiaguito 1922 – 2000. Bull. Volcanol. 65, 77–89. doi: 10.1007/s00445-002-0243-0
Harris, A. J. L., Vallance, J. W., Kimberly, P., Rose, W. I., Matias, O., Bunzendahl, E., et al. (2006). “Downstream aggradation owing to lava dome extrusion and rainfall runoff at Volcano Santiaguito, Guatemala,” in Volcanic Hazards in Central America, eds W. I. Rose, G. J. Bluth, M. J. Carr, J. W. Ewert, L. C. Patino, and J. W. Vallance (Geological Society of America), 85–104. doi: 10.1130/2006.2412(05)
Heap, M. J., Farquharson, J. I., Baud, P., Lavallée, Y., and Reuschlé, T. (2015a). Fracture and compaction of andesite in a volcanic edifice. Bull. Volcanol. 77:55. doi: 10.1007/s00445-015-0938-7
Heap, M. J., Xu, T., Kushnir, A. R., Kennedy, B. M., and Chen, C.-f. (2015b). Fracture of magma containing overpressurised pores. J. Volcanol. Geotherm. Res. 301, 180–190. doi: 10.1016/j.jvolgeores.2015.05.016
Hill, D. P. (1996). Earthquakes and carbon dioxide beneath Mammoth Mountain, California. Seismol. Res. Lett. 67, 8–15. doi: 10.1785/gssrl.67.1.8
Holland, A. P., Watson, I., Phillips, J. C., Caricchi, L., and Dalton, M. P. (2011). Degassing processes during lava dome growth: insights from Santiaguito lava dome, Guatemala. J. Volcanol. Geotherm. Res. 202, 153–166. doi: 10.1016/j.jvolgeores.2011.02.004
Huang, C.-J., Yin, H.-Y., Chen, C.-Y., Yeh, C.-H., and Wang, C.-L. (2007). Ground vibrations produced by rock motions and debris flows. J. Geophys. Res. Earth Surf.112. doi: 10.1029/2005JF000437
Iverson, R. M., Dzurisin, D., Gardner, C. A., Gerlach, T. M., LaHusen, R. G., Lisowski, M., et al. (2006). Dynamics of seismogenic volcanic extrusion at Mount St Helens in 2004-05. Nature 444, 439–443. doi: 10.1038/nature05322
James, M. R., and Varley, N. (2012). Identification of structural controls in an active lava dome with high resolution DEMs: Volcán de Colima, Mexico. Geophys. Res. Lett. 39. doi: 10.1029/2012GL054245
Johnson, J. B., and Aster, R. C. (2005). Relative partitioning of acoustic and seismic energy during Strombolian eruptions. J. Volcanol. Geotherm. Res. 148, 334–354. doi: 10.1016/j.jvolgeores.2005.05.002
Johnson, J. B., Harris, A. J. L., Sahetapy-Engel, S. T. M., Wolf, R., and Rose, W. I. (2004). Explosion dynamics of pyroclastic eruptions at Santiaguito Volcano. Geophys. Res. Lett. 31:L06610. doi: 10.1029/2003GL019079
Johnson, J. B., and Lees, J. M. (2010). Sound produced by the rapidly inflating Santiaguito lava dome, Guatemala. Geophys. Res. Lett. 37, 1–6. doi: 10.1029/2010GL045217
Johnson, J. B., Lees, J. M., Gerst, A., Sahagian, D., and Varley, N. (2008). Long-period earthquakes and co-eruptive dome inflation seen with particle image velocimetry. Nature 456, 377–381. doi: 10.1038/nature07429
Johnson, J. B., Lees, J. M., and Gordeev, E. I. (1998). Degassing explosions at Karymsky Volcano, Kamchatka. Geophys. Res. Lett. 25, 3999–4002. doi: 10.1029/1998GL900102
Johnson, J. B., Lees, J. M., and Varley, N. R. (2011). Characterizing complex eruptive activity at Santiaguito, Guatemala using infrasound semblance in networked arrays. J. Volcanol. Geotherm. Res. 199, 1–14. doi: 10.1016/j.jvolgeores.2010.08.005
Johnson, J. B., Lyons, J. J., Andrews, B. J., and Lees, J. M. (2014). Explosive dome eruptions modulated by periodic gas-driven inflation. Geophys. Res. Lett. 41, 6689–6697. doi: 10.1002/2014GL061310
Johnson, J. B., and Palma, J. L. (2015). Lahar infrasound associated with Villarrica's March 3, 2015 eruption. Geophys. Res. Lett. 42, 6324–6331. doi: 10.1002/2015GL065024
Johnson, J. B., Sanderson, R., Lyons, J. J., Escobar-Wolf, R., Waite, G. P., and Lees, J. M. (2009). Dissection of a composite volcanic earthquake at Santiaguito, Guatemala. Geophys. Res. Lett. 36:L16308. doi: 10.1029/2009GL039370
Jones, K., and Johnson, J. B. (2011). Mapping complex vent eruptive activity at Santiaguito, Guatemala using network infrasound semblance. J. Volcanol. Geotherm. Res. 199, 15–24. doi: 10.1016/j.jvolgeores.2010.08.006
Jousset, P. S., Pallister, J., Boichu, M., Buongiorno, M. F., Budisantoso, A., Costa, F., et al. (2012). The 2010 explosive eruption of Java's Merapi volcano–a ‘100-year’ event. J. Volcanol. Geotherm. Res. 241-242, 121–135. doi: 10.1016/j.jvolgeores.2012.06.018
Kendrick, J. E., Lavallée, Y., Varley, N. R., Wadsworth, F. B., Lamb, O. D., and Vasseur, J. (2016). Blowing off steam: tuffisite formation as a regulator for lava dome eruptions. Front. Earth Sci. 4:41. doi: 10.3389/feart.2016.00041
Kilgour, G., Saunders, K., Blundy, J., Cashman, K., Scott, B., and Miller, C. (2014). Timescales of magmatic processes at ruapehu volcano from diffusion chronometry and their comparison to monitoring data. J. Volcanol. Geotherm. Res. 288, 62–75. doi: 10.1016/j.jvolgeores.2014.09.010
Kim, K., and Lees, J. M. (2015). Imaging volcanic infrasound sources using time reversal mirror algorithm. Geophys. J. Int. 202, 1663–1676. doi: 10.1093/gji/ggv237
Lahr, J. C., Chouet, B. A., Stephens, C. D., Power, J. A., and Page, R. A. (1994). Earthquake classification, location, and error analysis in a volcanic environment: implications for the magmatic system of the 1989-1990 eruptions at Redoubt Volcano, Alaska. J. Volcanol. Geotherm. Res. 62, 137–151. doi: 10.1016/0377-0273(94)90031-0
Lamb, O. D., De Angelis, S., Umakoshi, K., Hornby, A. J., Kendrick, J. E., and Lavallée, Y. (2015). Repetitive fracturing during spine extrusion at Unzen volcano, Japan. Solid Earth 6, 1277–1293. doi: 10.5194/se-6-1277-2015
Lavallée, Y., Benson, P. M., Heap, M. J., Hess, K.-U., Flaws, A., Schillinger, B., et al. (2013). Reconstructing magma failure and the degassing network of dome-building eruptions. Geology 41, 515–518. doi: 10.1130/G33948.1
Lavallée, Y., Dingwell, D. B., Johnson, J. B., Cimarelli, C., Hornby, A. J., Kendrick, J. E., et al. (2015). Thermal vesiculation during volcanic eruptions. Nature 528, 544–547. doi: 10.1038/nature16153
Lavallée, Y., Meredith, P. G., Dingwell, D. B., Hess, K. U., Wassermann, J., Cordonnier, B., et al. (2008). Seismogenic lavas and explosive eruption forecasting. Nature 453, 507–510. doi: 10.1038/nature06980
Marchetti, E., Ripepe, M., Delle Donne, D., Genco, R., Finizola, A., and Garaebiti, E. (2013). Blast waves from violent explosive activity at Yasur Volcano, Vanuatu. Geophys. Res. Lett. 40, 5838–5843. doi: 10.1002/2013GL057900
Mastin, L. G., Guffanti, M., Servranckx, R., Webley, P. W., Barsotti, S., Dean, K. G., et al. (2009). A multidisciplinary effort to assign realistic source parameters to models of volcanic ash-cloud transport and dispersion during eruptions. J. Volcanol. Geotherm. Res. 186, 10–21. doi: 10.1016/j.jvolgeores.2009.01.008
Michaut, C., Ricard, Y., Bercovici, D., and Sparks, R. S. J. (2013). Eruption cyclicity at silicic volcanoes potentially caused by magmatic gas waves. Nat. Geosci. 6, 856–861. doi: 10.1038/ngeo1928
Neuberg, J. W. (2000). Characteristics and causes of shallow seismicity in andesite volcanoes. Philos. Trans. R. Soc. A 358, 1533–1546. doi: 10.1098/rsta.2000.0602
Neuberg, J. W., Tuffen, H., Collier, L., Green, D. N., Powell, T., and Dingwell, D. B. (2006). The trigger mechanism of low-frequency earthquakes on Montserrat. J. Volcanol. Geotherm. Res. 153, 37–50. doi: 10.1016/j.jvolgeores.2005.08.008
Papale, P. (1999). Strain-induced magma fragmentation in explosive eruptions. Nature 397, 425–428. doi: 10.1038/17109
Reyes-Dávila, G. A., Arámbula-Mendoza, R., Espinasa-Pereña, R., Pankhurst, M. J., Navarro-Ochoa, C., Savov, I. P., et al. (2016). Volcán de Colima dome collapse of July, 2015 and associated pyroclastic density currents. J. Volcanol. Geotherm. Res. 320, 100–106. doi: 10.1016/j.jvolgeores.2016.04.015
Rhodes, E., Kennedy, B. M., Lavallée, Y., Hornby, A., Edwards, M., and Chigna, G. (2018). Textural insights into the evolving lava dome cycles at Santiaguito Lava Dome, Guatemala. Front. Earth Sci. 6:30. doi: 10.3389/feart.2018.00030
Rose, W. I. (1973). Pattern and mechanism of volcanic activity at the Santiaguito Volcanic Dome, Guatemala. Bull. Volcanol. 37, 73–94. doi: 10.1007/BF02596881
Rose, W. I. (1987). Volcanic activity at Santiaguito Volcano 1976-1984. Geol. Soc. Am. Spcl. Pap. 212, 17–27. doi: 10.1130/SPE212-p17
Sahetapy-Engel, S. T. M., Harris, A. J. L., and Marchetti, E. (2008). Thermal, seismic and infrasound observations of persistent explosive activity and conduit dynamics at Santiaguito lava dome, Guatemala. J. Volcanol. Geotherm. Res. 173, 1–14. doi: 10.1016/j.jvolgeores.2007.11.026
Sanderson, R., Johnson, J. B., and Lees, J. M. (2010). Ultra-long period seismic signals and cyclic deflation coincident with eruptions at Santiaguito volcano, Guatemala. J. Volcanol. Geotherm. Res. 198, 35–44. doi: 10.1016/j.jvolgeores.2010.08.007
Saunders, K., Blundy, J., Dohmen, R., and Cashman, K. (2012). Linking petrology and seismology at an active volcano. Science 336, 1023–1027. doi: 10.1126/science.1220066
Scharff, L., Hort, M., and Gerst, A. (2014). The dynamics of the dome at Santiaguito volcano, Guatemala. Geophys. J. Int. 197, 926–942. doi: 10.1093/gji/ggu069
Scheu, B., Kueppers, U., Mueller, S., Spieler, O., and Dingwell, D. B. (2008). Experimental volcanology on eruptive products of Unzen volcano. J. Volcanol. Geotherm. Res. 175, 110–119. doi: 10.1016/j.jvolgeores.2008.03.023
Scott, J. A., Pyle, D. M., Mather, T. A., and Rose, W. I. (2013). Geochemistry and evolution of the Santiaguito volcanic dome complex, Guatemala. J. Volcanol. Geotherm. Res. 252, 92–107. doi: 10.1016/j.jvolgeores.2012.11.011
Sigmundsson, F., Hooper, A., Hreinsdóttir, S., Vogfjörd, K. S., Ófeigsson, B. G., Heimisson, E. R., et al. (2015). Segmented lateral dyke growth in a rifting event at Bárdarbunga volcanic system, Iceland. Nature 517, 191–195. doi: 10.1038/nature14111
Sparks, R. S. J. (1997). Causes and consequences of pressurisation in lava dome eruptions. Earth Planet. Sci. Lett. 150, 177–189. doi: 10.1016/S0012-821X(97)00109-X
Varley, N. R., Arámbula-Mendoza, R., Reyes-Dávila, G. a., Stevenson, J. A., and Harwood, R. (2010). Long-period seismicity during magma movement at Volcán de Colima. Bull. Volcanol. 72, 1093–1107. doi: 10.1007/s00445-010-0390-7
Wadge, G., Robertson, R. E. A., and Voight, B. (2014). The Eruption of Soufrière Hills Volcano, Montserrat from 2000 to 2010. Geol. Soc. Lond. Memoirs 39, 1–40. doi: 10.1144/M39
White, R., and McCausland, W. (2016). Volcano-tectonic earthquakes: a new tool for estimating intrusive volumes and forecasting eruptions. J. Volcanol. Geotherm. Res. 309, 139–155. doi: 10.1016/j.jvolgeores.2015.10.020
Williams, S. N., and Self, S. (1983). The October 1902 plinian eruption of Santa Maria volcano, Guatemala. J. Volcanol. Geotherm. Res. 16, 33–56. doi: 10.1016/0377-0273(83)90083-5
Keywords: Santiaguito, volcano-seismology, infrasound, eruption chronology, volcanic explosions, multi-parametric monitoring, thermal infra-red imaging
Citation: Lamb OD, Lamur A, Díaz-Moreno A, De Angelis S, Hornby AJ, von Aulock FW, Kendrick JE, Wallace PA, Gottschämmer E, Rietbrock A, Alvarez I, Chigna G and Lavallée Y (2019) Disruption of Long-Term Effusive-Explosive Activity at Santiaguito, Guatemala. Front. Earth Sci. 6:253. doi: 10.3389/feart.2018.00253
Received: 19 October 2018; Accepted: 28 December 2018;
Published: 05 February 2019.
Edited by:
Luis E. Lara, Sernageomin, ChileReviewed by:
Colin J. N. Wilson, Victoria University of Wellington, New ZealandAndrew Bell, University of Edinburgh, United Kingdom
Copyright © 2019 Lamb, Lamur, Díaz-Moreno, De Angelis, Hornby, von Aulock, Kendrick, Wallace, Gottschämmer, Rietbrock, Alvarez, Chigna and Lavallée. This is an open-access article distributed under the terms of the Creative Commons Attribution License (CC BY). The use, distribution or reproduction in other forums is permitted, provided the original author(s) and the copyright owner(s) are credited and that the original publication in this journal is cited, in accordance with accepted academic practice. No use, distribution or reproduction is permitted which does not comply with these terms.
*Correspondence: Oliver D. Lamb, b2xhbWJAZW1haWwudW5jLmVkdQ==