 Miriam C. Jones1*
 Lesleigh Anderson2
 Katherine Keller3
 Bailey Nash4
 Virginia Littell5
 Matthew Wooller6
 Chelsea A. Jolley7
- 1Florence Bascom Geoscience Center, U.S. Geological Survey, Reston, VA, United States
- 2Geosciences and Environmental Change ‘Science Center’, U.S. Geological Survey, Denver, CO, United States
- 3Department of Earth and Planetary Sciences, Harvard University, Cambridge, MA, United States
- 4Department of Geological and Atmospheric Sciences, Iowa State University, Ames, IA, United States
- 5Department of Earth and Space Sciences, University of Washington, Seattle, WA, United States
- 6Alaska Stable Isotope Facility, University of Alaska Fairbanks, Fairbanks, AK, United States
- 7Department of Geological Sciences, Brigham Young University, Provo, UT, United States
Peat cores are valuable archives of past environmental change because they accumulate plant organic matter over millennia. While studies have primarily focused on physical, ecological, and some biogeochemical proxies, cores from peatlands have increasingly been used to interpret hydroclimatic change using stable isotope analyses of cellulose preserved in plant remains. Previous studies indicate that the stable oxygen isotope compositions (δ18O) preserved in alpha cellulose extracted from specific plant macrofossils reflect the δ18O values of past peatland water and thereby provide information on long-term changes in hydrology in response to climate. Oxygen isotope analyses of peat cellulose (δ18Ocellulose) have been successfully developed from peat cores that accumulate the same species for millennia. However, to fully exploit the potential of this proxy in species-diverse fens, studies are needed that account for the isotopic variations caused by changes in dominant species composition. This study assesses variation in δ18O values among peatland plant species and how they relate to environmental waters in two fens informally named Horse Trail and Goldfin, located on the leeward (dry) and windward (wet) side, respectively, of the climatic gradient across the Kenai Peninsula, Alaska. Environmental water δ18O values at both fens reflect unmodified δ18O values of mean annual precipitation, although at Goldfin standing pools were slightly influenced by evaporation. Modern plant [mosses and Carex spp. (sedges)] δ18Ocellulose values indicate that all Carex spp. are higher (~2.5‰) than those of mosses, likely driven by their vascular structure and ecophysiological difference from non-vascular mosses. Moss δ18Ocellulose values within each peatland are similar among the species, and differences appear related to evaporation effects on environmental waters within hummocks and hollows. The plant taxa-environmental water δ18O differences are applied to the previously determined Horse Trail Fen untreated bulk δ18O record. Results include significant changes to inferred millennial-to-centennial scale hydroclimatic trends where dominant taxa shift from moss to Carex spp., indicating that modern calibration datasets are necessary for interpreting stable isotopes from fens, containing a mix of vascular and nonvascular plants. Accounting for isotopic offsets through macrofossil analysis and modern plant-water isotope measurements opens new opportunities for hydroclimatic reconstructions from fen peatlands.
Introduction
Peat core records have long served as geologic archives of paleoenvironmental change, using a range of biological, physical, and biogeochemical proxies. Because peat accumulates under waterlogged conditions, previous studies have related the oxygen isotopic signature preserved in alpha cellulose (δ18Ocellulose) extracted from peatland plant macrofossils to the isotopic composition of environmental water, i.e., the source from which the plants are absorbing their water (Vardy, 1997; Wissel et al., 2008; Moschen et al., 2009; Loader et al., 2016). The use of δ18Ocellulose values from peatlands was first explored in Sphagnum-dominated bogs using analyses of single species (Brenninkmeijer et al., 1982; Ménot-Combes et al., 2002; Zanazzi and Mora, 2005; Daley et al., 2010, 2016; Kühl and Moschen, 2012; Loader et al., 2016). Single-species cellulose in a core limits variability that could arise from isotopic species effects (Ménot-Combes et al., 2002; Daley et al., 2010; Nichols et al., 2010). Bogs, hydraulically sourced only by precipitation, are generally thought to provide the best record of past precipitation change from peatlands, however, relying only on bogs that accumulate monospecific peat for millennia can considerably limit the utility of this proxy to a small number of sites. For example, many Alaska peatlands are primarily groundwater-sourced fens with high species diversity through space and time. The utility of this proxy was tested in one Alaska fen core by analyzing δ18O changes relative to the plant macrofossils comprising the peat (Jones et al., 2014), and while isotopic shifts occurred that were consistent with other regional records (Fisher et al., 2004; Anderson et al., 2005), questions remain about how closely tied the shifts were to hydroclimate changes vs. other factors, and most specifically, plant species shifts in response to changes in peatland hydrology.
The primary isotopic fractionation involved in biochemically synthesizing cellulose in environmental water has been relatively well constrained to −27‰ (DeNiro and Epstein, 1979, 1981), and while this process was thought to be insensitive to changes in temperature, Sternberg and Ellsworth (2011) quantified a latitudinal influence associated with differences in mean annual air temperatures (MAT) that is −33‰ for high latitudes such as Alaska. In vascular plants, δ18Ocellulose is determined by kinetic and equilibrium fractionation from its environmental water (Amesbury et al., 2015), because values are influenced by both the δ18O values of environmental water and water within the leaf, which are generally enriched in heavy isotopes due to transpiration and plant vascular mediation (Nichols et al., 2010; Loader et al., 2016). Therefore, in Alaskan peats, which are largely composed of a variety of bryophytes and sedges, contrasting physiological processes for water uptake between bryophytes (mosses; non-vascular) and graminoids (sedges; vascular) likely result in significant differences in their cellulose isotope signatures. Bryophytes, including all mosses and liverworts, lack vascular structure and absorb water through cell walls (Proctor, 2000). In contrast, sedges have roots that can obtain water from deeper horizons and regulate moisture loss via stomata, leading to evaporative enrichment from transpiration through their stomata (Yakir et al., 1990; Amesbury et al., 2015). This may potentially lead to differences not only in environmental-water isotope compositions compared to mosses, but also in additional fractionations of water within the plant related to stomatal conductance (Ménot and Burns, 2001).
To further examine oxygen isotope variations of plant cellulose within Alaskan fens, the goals of this study are to (a) determine the δ18O values of modern peatland environmental waters and evaluate their relationship to precipitation and groundwater by comparison with local surface water δ18O values, including Kenai Peninsula lakes, rivers and streams, and the global meteoric water line (GMWL) (Rozanski et al., 1993; Anderson et al., 2016); (b) compare δ18Ocellulose values of plant species with the δ18O values of their environmental waters to determine whether species δ18O values significantly differ; and (c) evaluate the range of δ18Ocellulose values exhibited by different peatland-plant species spatially. Lastly, the results are used to evaluate the influence of varying species dominance on bulk peat δ18O values determined from a ~14,000-year old core obtained in Horse Trail Fen (HTF) by Jones et al. (2014) that, in turn, influences the hydroclimatic interpretation.
Study Area
The Kenai Peninsula is located in south-central Alaska on the northern coast of the Gulf of Alaska (Figure 1). It is bisected along its eastern edge by the Kenai Mountains, composed of Mesozoic bedrock (Rymer and Sims, 1982), which rise to ~1,025 meters above sea level (m.a.s.l.). The Harding Icefield spans upper elevations of the range, with glaciers terminating at or near sea level to the east and west. The western side of the peninsula is a low-lying landscape shaped by glacial events (Rymer and Sims, 1982; Reger et al., 2008), and is characterized by peatlands, kettle-hole lakes, and boreal forest overlying moraines and glacial outwash. The eastern side of the Kenai Mountains is the wetter, windward side, and precipitation totals are four times higher than on the leeward, western lowlands, spanning a relatively small (<70 km) area. Consequentially, the vegetation on the eastern side comprises the western-most edge of the temperate rainforest, whereas the western lowlands form an ecotone between the boreal and coastal forests.
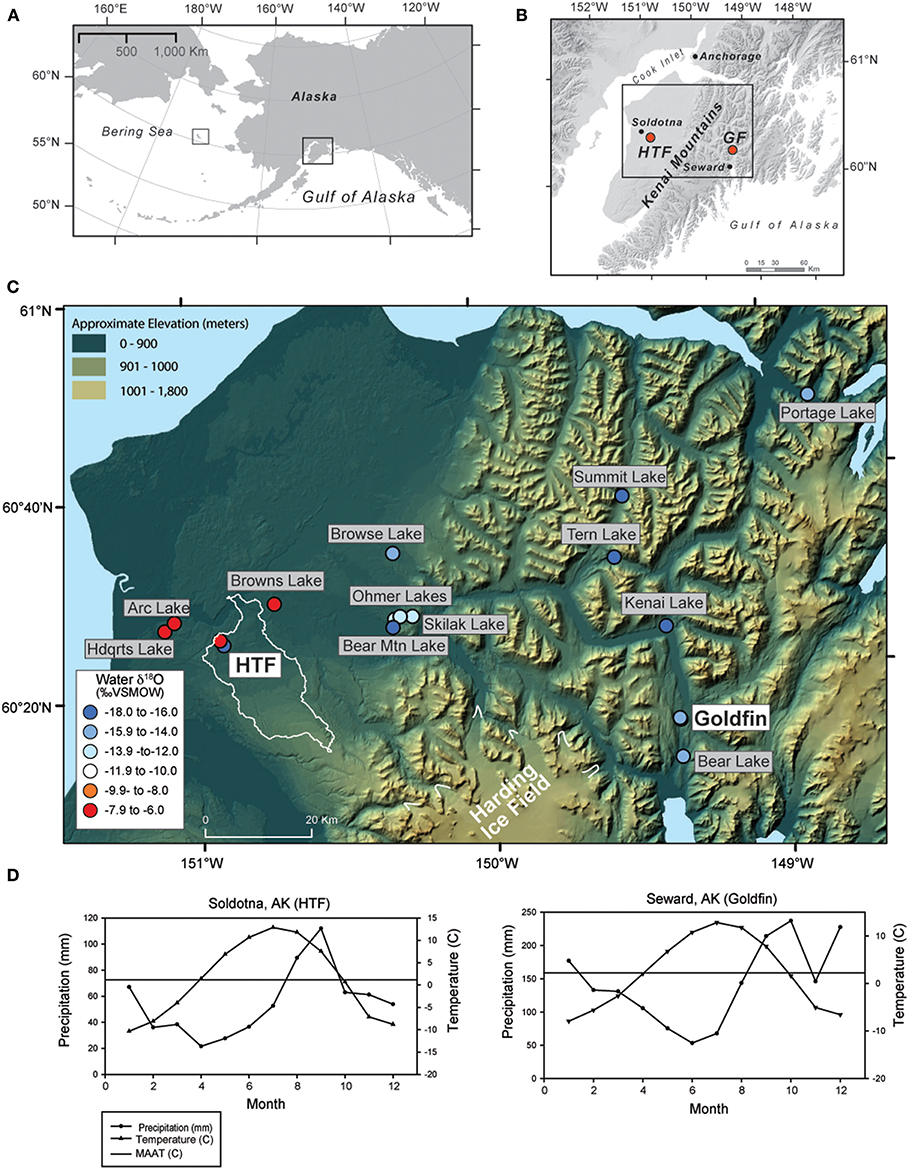
Figure 1. Maps of the Kenai Peninsula (A) relative to the North Pacific and Alaska (right black square), also showing the location of St. Matthew Island in the Bering Sea (left black square) (B) with Horse Trail fen (HTF) and Golfin (GF) study sites on a gray shaded DEM, (C) and lake and peat water sample locations on a color DEM; circle colors indicate water δ18O values and the light outline around HTF indicates the surface watershed outside the glacial limits of the Kenai icefield, (D) precipitation and temperature averages for the closest weather stations to Horse Trail fen and Goldfin (1981–2010 average).
The climate of the eastern Kenai Mountains is considered maritime, with MAT of 6.5°C with a mean annual precipitation (MAP) of 186.3 cm (Seward, AK), while on the western lowlands, the MAT at Soldotna airport is 6°C and MAP is 46.3 cm (Figure 1D; 1981–2010 climate average; Alaska Climate Research Center, http://climate.gi.alaska.edu). On the western lowlands, the majority of present-day annual precipitation falls during autumn (August, September) and remains relatively high in winter (October-January) and in the eastern Kenai Peninsula, precipitation is highest from September to January (Alaska Climate Research Center, http://climate.gi.alaska.edu), in response to intensification of the Aleutian Low, a semi-permanent low-pressure system that strengthens over the North Pacific and Gulf of Alaska region in late autumn and subsequently wanes in intensity during spring and summer (Overland et al., 1999).
Horse Trail fen (HTF; informal name, 60.264, −149.356, 110 m.a.s.l.), is a large fen complex in the western lowlands near Soldotna, AK. Although located downgradient from the Harding Icefield, watershed analysis using high resolution Digital Elevation Models indicates that the headwater area is isolated from glacial run off (white outline in Figure 1C). Goldfin (GF, informal; 60.264, −149.356, 2018 m.a.s.l.), is a small kettle hole peatland located in a narrow north-to-south trending valley ~30 m above sea level north of Seward, AK. Plant and water isotope samples presented here also include samples obtained from St. Matthew Island (Figure 1A), located in the east-central Bering Sea (60.4 °N, −172.7 °W, at sea level elevation).
Methods
Field collections for this study included modern plants [mosses and sedges (Carex spp.)] and associated environmental water. The Horse Trail fen (HTF) site was sampled for water and plants along a 40-m transect from the stream flowing through the peatland to the forest edge at every 10 m in July of 2014. At each point along the transect, surface water associated with plant collections was obtained by submerging 10-mL high-density polyethylene (HDPE) bottles and under the surface of the water table until it filled without bubbles or headspace before sealing under the water. No water was squeezed out of peatland plants. Surface water samples were similarly obtained from near-surface waters of nearby lakes, rivers, and streams (Figure 1C).
At each HTF transect position, the dominant plant species were collected, noting whether the plant was submerged, at the water table, or on a hummock. A similar transect was repeated at GF bog in September 2017, starting at the stream flowing at the edge of the bog to 40 m away from the stream. In this bog, an elevation gradient perpendicular to the stream was less apparent and small pools intersected the transect. At the 20-m sampling location, samples were collected from a small pool at the water table and 10 cm above the water table. At the 40-m location, samples were collected from a small pool and an adjacent hummock 10–20-cm high.
Plant species were bagged and labeled with their transect position and subsequently cleaned with deionized water, identified, and separated by species in the laboratory. If enough material was available, species were separated by their stems and leaves. In some cases, whole plants were analyzed, either in addition to separated stems and leaves or in some instances by themselves. Plants and environmental-water samples from St. Matthew Island, Alaska, were collected June 2018, repeating laboratory methods outlined above.
Plant cellulose was extracted by the Cuprammonium (CUAM) method of Wissel et al. (2008) and Moschen et al. (2009). Samples were first bleached using solution of sodium hypchlorite and acetic acid at 70°C to separate the lignin fraction before they were neutralized and freeze dried. The bleached sample was then place in 50-ml centrifuge tubes using a cuprammonium solution (Cu(NH3)4(OH)2; “Schweizer solution”) for cellulose dissolution, stirred for 6 h, and left to sit at room temperature for an additional 10 h. Once fully dissolved, the copper complex cellulose solution was centrifuged for 25 min at 2,500 rpm and the supernatant was decanted into a clean 50-ml centrifuge tube, leaving the non-cellulosic material behind. This step was repeated to avoid contamination from other plant material. The supernatant was then loaded with ~3 ml H2SO4 (20%) and cold deionized water to induce cellulose precipitation. The tube was shaken and left to sit for 20 min, before it was centrifuged at 2,500 rpm for 25 min. Additional drops of H2SO4 (20%) were added until the solution turned from blue to clear, to ensure that cellulose precipitation was complete. The cellulose precipitate was subsequently rinsed with deionized water until it reached a neutral pH by centrifuging at 2,500 rpm for 25 min, before it was freeze dried. A mass of 0.2–0.3 mg of dried cellulose sample was packed in silver capsules and stored in a vacuum drier prior to stable oxygen isotopic analysis.
All oxygen and water hydrogen isotope results for cellulose and water are reported in per mil (‰) as the relative difference of isotope ratios (δ) from the international measurement standard Vienna Standard Mean Ocean Water (VSMOW) defined by
Water samples for isotopic measurements at the University of Illinois at Chicago (UIC) were analyzed on a Picarro l2130-i analyzer by injecting 5 μl of water into a vaporizer at 110°C where they were evaporated and diluted with nitrogen. The vapor stream was then carried into the cavity of the laser absorption spectrometer. All samples were measured six times and the first three injections were rejected due to the influence of between-sample memory. Additional memory corrections were applied to the last three injections, which were then averaged to generate the reported value. Uncertainty is reported as the absolute range of the last three injections and is <0.2‰ and <1.0‰ for oxygen and hydrogen, respectively. Secondary water isotope standards were run intermittently to assess drift and three in-house span standards were analyzed at the end of each run to correct samples to the Vienna Standard Mean Ocean Water (VSMOW) scale (δ18O: −29.9, −15.9, and −0.9‰, and δ2H: −240, −122, and −0.2‰). The methods closely follow those previously described by Gupta et al. (2009), Brand et al. (2009), and Noone et al. (2013). At Idaho State University, water samples for isotope analysis were filtered through 0.45 μm filter and analyzed using a Thermo Scientific, High Temperature Conversion Elemental Analyzer (TC-EA) interfaced to a Delta V Advantage mass spectrometer through the ConFlo IV system. Isotope values of δ2H and δ18O are reported as ‰ values relative to the VSMOW scale. Four in-house standards, which are directly calibrated against VSMOW2, SLAP2, and GISP, were used to create a two-point calibration curve to correct the raw data and to monitor the accuracy of the data. Precisions for both δ2H and δ18O values are better than ±2.0‰ and ±0.2‰, respectively.
Plant cellulose samples were measured at the University of Wyoming Stable Isotope Facility and values of δ18Ocellulose were determined by pyrolysis at 1420°C and temperature conversion elemental analysis (TC-EA). Following CO and H2 gas separation using a gas chromatographic column (GS) at 85°C, isotope ratios were measured by a coupled Thermo Scientific DeltaV Plus isotope ratio mass spectrometer (IRMS). If regularly spaced standard uncertainty was larger than 0.3‰, the samples were all re-analyzed until the 2-sigma expanded standard uncertainty of the result was <1‰. The isotopic composition is reported on the ‰VSMOW scale such that standard reference material IAEA 601 (benzoic acid) and IAEA 602 (benzoic acid), respectively, are +23.3‰ and +71.4‰. At Iowa State University, plant cellulose samples were analyzed on a Finnigan MAT Delta Plus XL mass spectrometer in continuous flow mode connected to a Thermo-Chemical Elemental Analyzer. Reference standards [Sigma-Aldrich alpha cellulose [SAC], benzoic acid [IAEA-601], and sucrose [IAEA-CH-6]] were used for isotopic corrections, and to assign the data to the appropriate isotopic scale. For each isotope value given, two replicates were run for each sample. Analytical precision for the δ18Ocellulose samples are ± <0.3‰. The analytical precision associated with the stable oxygen isotope analyses for the HT Fen core by Jones et al. (2014) was <0.6‰ and is expressed as one standard deviation from the mean based on the results from multiple (n = 10) analyses of a laboratory standard (benzoic acid, Fisher Scientific, Lot No 947459) conducted during the run of samples. Statistical relationships were determined using a t-test in Sigmaplot 13.0.
Horse Trail Fen Core Reanalysis
The Horse Trail fen core (HTF) was previously analyzed on bulk peat (δ18Obulk; Jones et al., 2014), and a select subset of samples, spanning a range of periods of differing species abundances, were analyzed for δ18Ocellulose, based on the cellulose extraction method of Wolfe et al. (2001) to determine the relationship between the δ18Obulk and δ18Ocellulose. A statistical regression of the data [y = 1.0148x−0.0927 (R2 = 0.68856)] was then used to convert δ18Obulk to δ18Ocellulose (Supplemental Tables 1, 2). This study utilized the plant macrofossil abundances of mosses and sedges identified by Jones et al. (2014; Figure 6) to scale respective offsets from their environmental water in the modern environment. Analytical errors were propagated by taking the square root of the squared standard deviation of the bulk peat-cellulose regression plus the squared standard deviation of the modern cellulose isotope to water isotope relationship. In each case, one water value at each location was related to the average of multiple moss or sedge values (Tables 2–4).
Results
Water
The average modern GF water δ18O value is −14.1 ± 0.1‰ (n = 5) and ~2‰ statistically higher than the HTF value of −16.2 ± 0.1‰ (n = 4; P = <0.001) (Tables 2, 3). HTF values from all sampling locations were nearly identical and plot near the intersection between the Local Evaporation Line (LEL), defined by the Kenai lakes measured for this study (Figure 1, Table 1), which are mostly located in the western lowlands (Figure 1), and the GMWL (Tables 1–3; Figure 2). The LEL-GMWL intersection approximates regional mean annual precipitation values (Anderson et al., 2016). The HTF environmental water δ18O values, which lie on the GMWL, closely approximate the δ18O values for mean annual precipitation in the western lowlands (Figure 2).
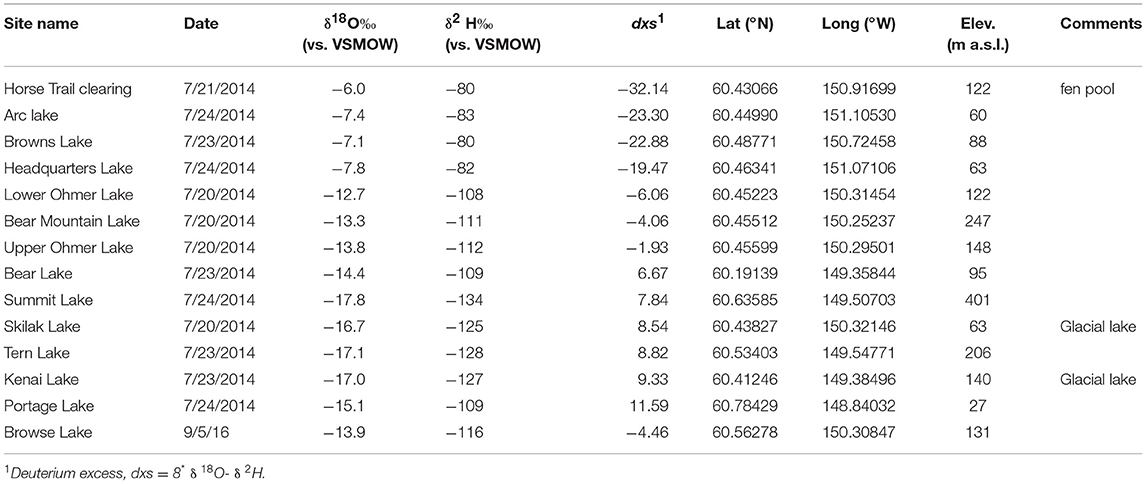
Table 1. Kenai lake water isotope data.
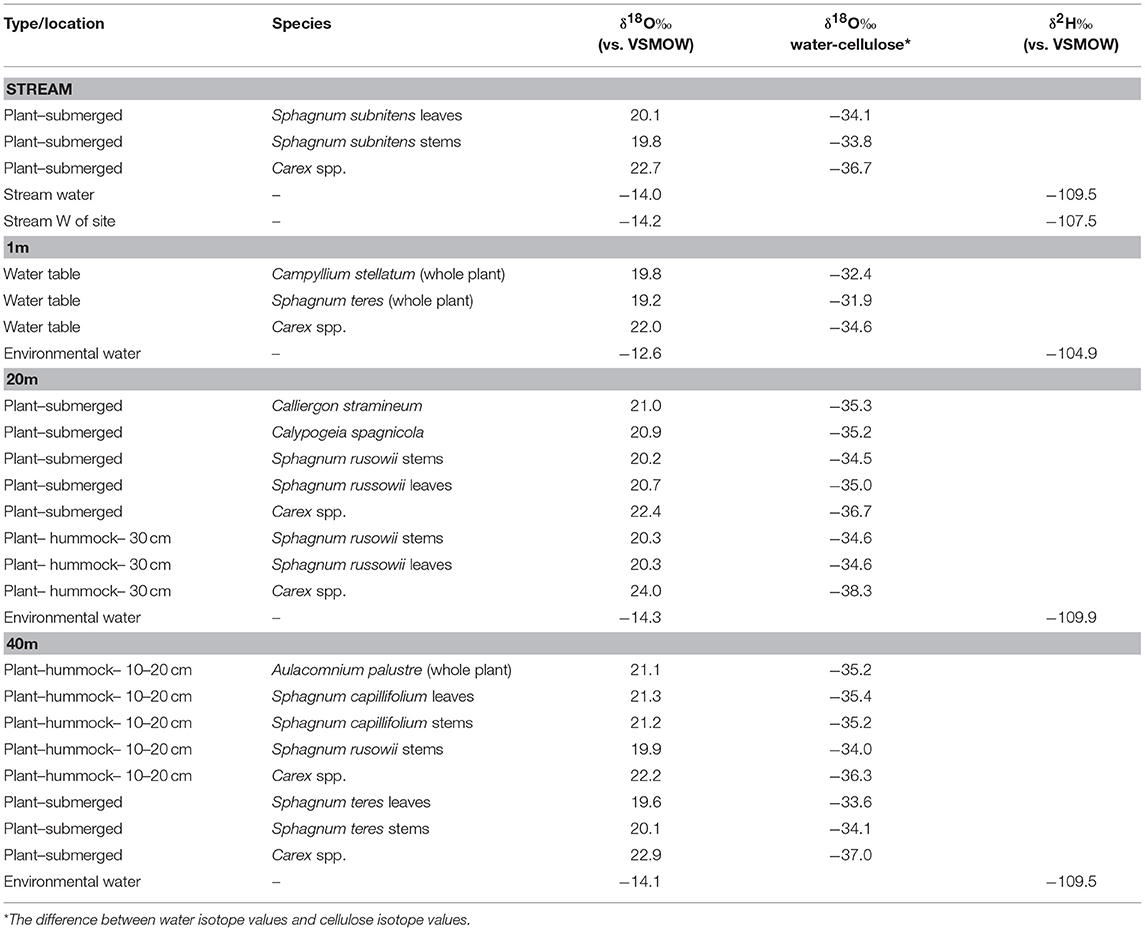
Table 2. Goldfin (GF) plant cellulose and environmental water isotopes (sampled 9/1/2017).
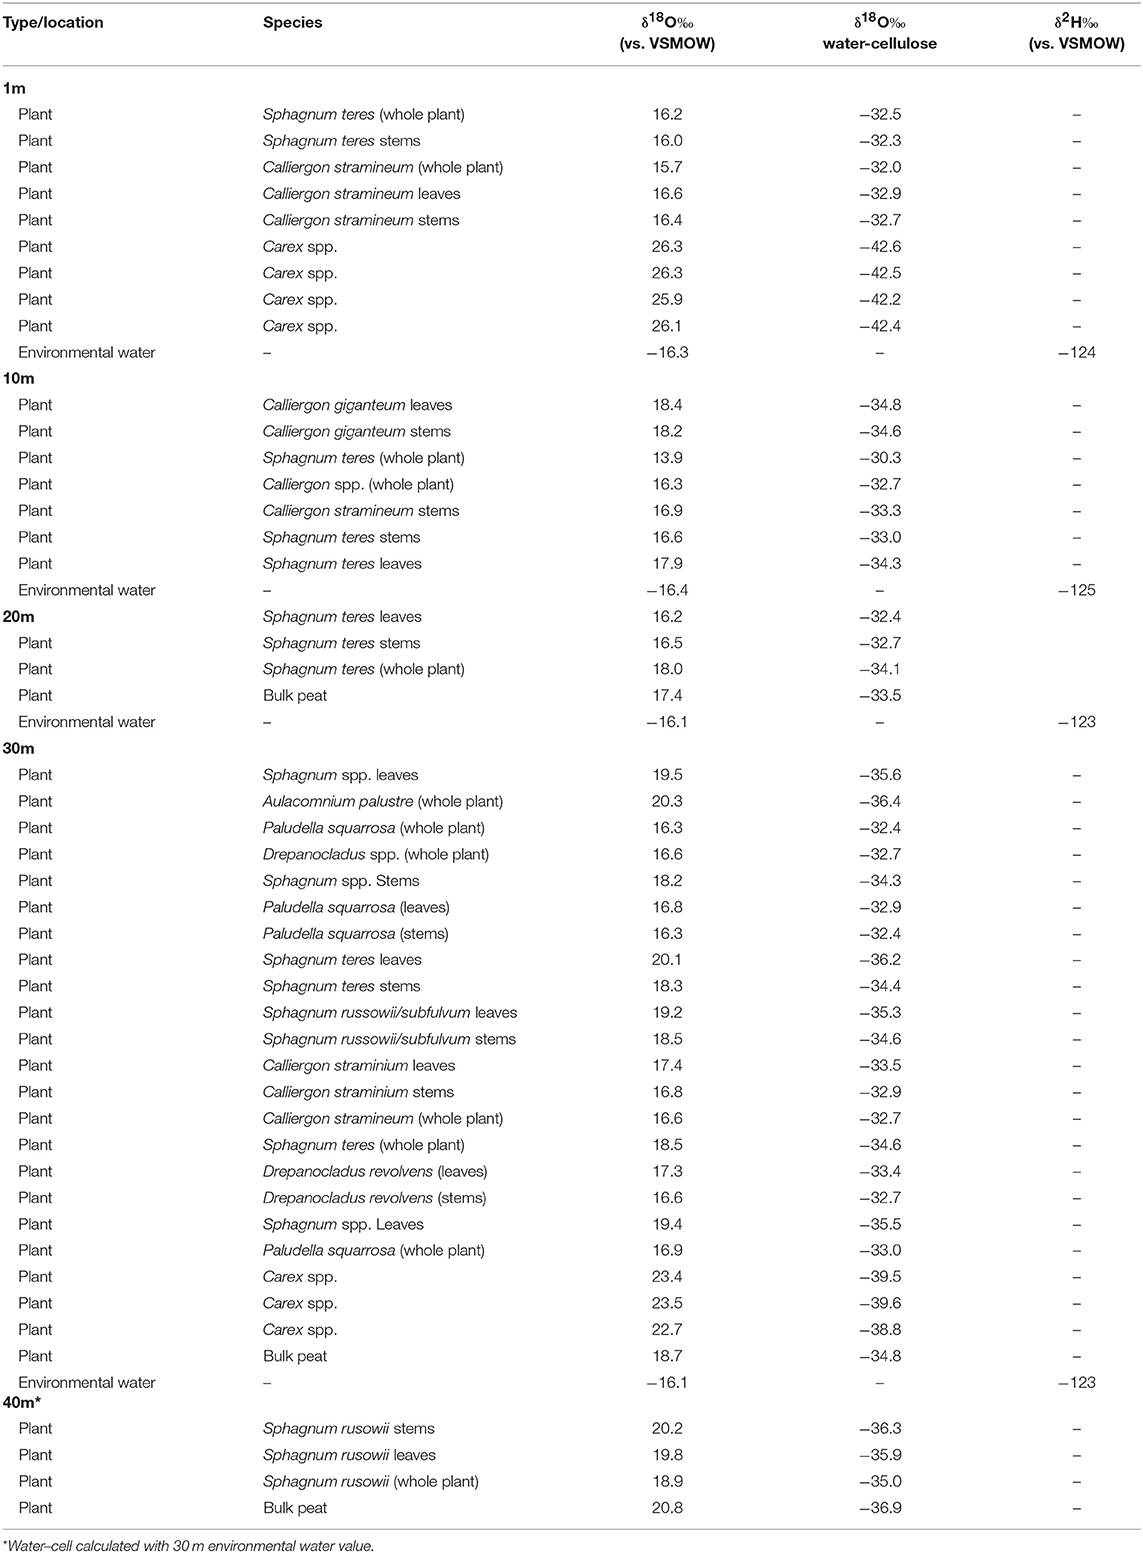
Table 3. Horse Trail fen (HTF) plant cellulose and environmental water isotopes (sampled 7/21/2014).
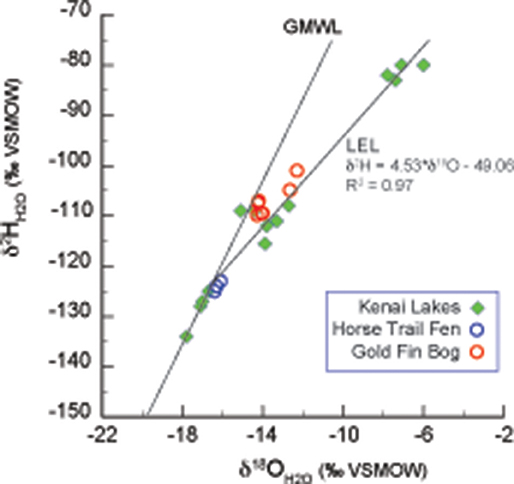
Figure 2. Lake water oxygen and hydrogen isotopes from the Kenai Peninsula, AK (green diamonds; Figure 1 and Table 1) were used to form the Local evaporation line (LEL) which is shown with the global meteoric water line (GMWL; Rozanski et al., 1993), and with surface waters from Horse Trail fen (HTF, Table 2, open blue circles), and Goldfin (GF, Table 3, open red circles).
Plant δ18Ocellulose Comparisons by Species and Plant Parts
Within-plant δ18Ocellulose differences were determined from measurements of separated stems and leaves of the same species. On average, HTF Sphagnum leaf δ18Ocellulose values were higher than stems by 1.3 ± 0.6‰ (n = 6 pairs). GF leaf δ18Ocellulose average was 1.5 ± 0.2‰ higher than stems (n = 5 pairs; analytical error 0.1 ± 0.06‰; Figure 3). However, in neither location was the difference between leaf and stem δ18Ocellulose values statistically significant (P = 0.197, P = 0.450, respectively). The only species for which Sphagnum stem values were higher than leaves was Sphagnum rusowii at 40 m (−0.4‰) and Sphagnum teres at 20 m (−0.3‰). For samples where stems, leaves, and the corresponding whole plant δ18Ocellulose values were measured (n = 7), whole plant values were both higher or lower by <2‰ than corresponding stems or leaves (Table 2), likely driven by the relative proportion of leaves to stems measured and the potential for debris to have been caught in Sphagnum leaves. At GF, brown moss δ18Ocellulose values, which includes all non-Sphagnum peat mosses (Tables 2, 3), were consistently higher than Sphagnum by 0.5 ±0.1‰ (n = 3 transect positions, incorporating 4 brown mosses and 10 Sphagnum mosses), but the relationship was not statistically significant (P = 0.454). At HTF, the relationship was opposite to that of GF (−0.8 ± 0.1‰, n = 3 transect positions, incorporating 18 brown moss and 19 Sphagnum samples) and also not statistically significant (P = 0.908). In samples where stem and leaf δ18Ocellulose were measured from the same sample (HTF only), brown moss leaves were slightly higher by a mean of 0.4 ± 0.2‰ than stems (n = 5 pairs), but the relationship was not statistically significant (P = 0.373). Carex spp. leaf δ18Ocellulose values at all HTF and GF sampling locations were higher than their bryophytic (Sphagnum and brown moss) counterparts, but differences varied. However, the average difference between moss and sedge (Carex spp.) values at GF (n = 16 mosses, n = 4 sedges) and at HTF (n = 38 mosses, n = 7 sedges) was statistically significant at both locations (P < 0.001 with 7 and 10 degrees of freedom from HTF and GF, respectively).
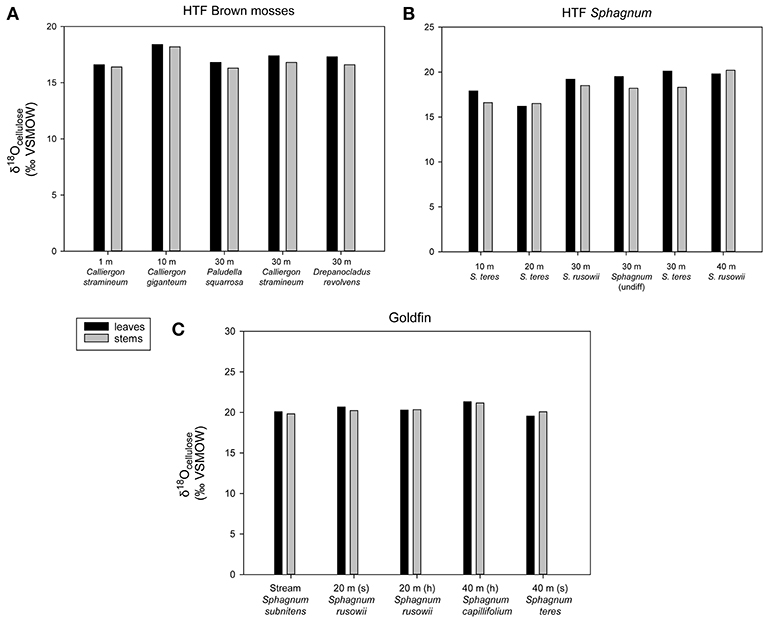
Figure 3. Intra-plant δ18Ocellulose values along the two transects (A) HTF brown mosses, (B) HTF Sphagnum mosses, (C) GF Sphagnum mosses. Each sample had one replicate with an analytical error of <0.3‰. All brown mosses and Sphagnum mosses found in Tables 2, 3 are included. “(s)” refers to submerged, “(h)” refers to hummock.
Plant δ18OCellulose Values by Water Table Position
The HTF transect was hypothesized to reflect a hydrologic gradient in terms of water table position that was assumed to be at stream level and progressively deeper below the fen surface with distance from the stream to 40 m, which lies at the upland forest edge. Although water isotope values were nearly identical at all transect locations, the bryophyte samples taken at greater distances from the stream showed progressively higher δ18Ocellulose values, ranging from ~16 to 19‰ with progressively higher values at each location farther from the stream (Table 2). The difference in mean values between the lowest transect position (1 m; 16.165 ± 0.360‰) and 30 and 40 m (19.63 ± 0.630‰) transect are statistically significant (P = 0.005 and P < 0.001, respectively). Of the more limited Carex spp. samples taken at HTF, the sample at 1-m (n = 4) distance was 3‰ ±0.6 higher than the sample taken at 30-m distance (n = 3), both of which were higher by variable amounts (Figure 4, Table 3) than the moss samples from the respective transect positions, but additional samples are needed to verify this trend.
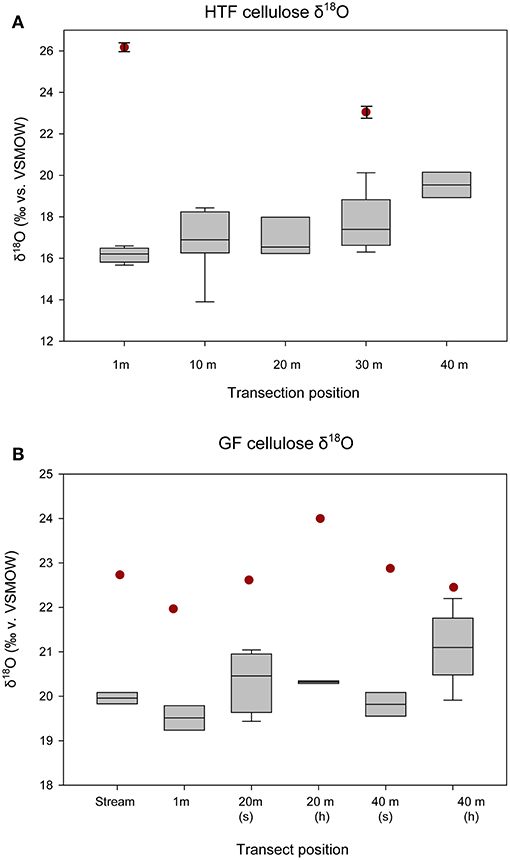
Figure 4. δ18Ocellulose values of bryophytes and Carex spp. by location on transect, starting from the stream and increasing out toward the forest edge. “S” refers to submerged, “h” refers to hummock for (A) HTF and (B) GF. The boxes and whiskers apply to the all measured bryophytes at each transect location. The red circles indicate Carex spp. leaf values at each transect location. At HTF, Carex spp. was only measured at two positions on the transect (1 m, n = 4; 30 m, n = 3), and only one Carex spp. replicate was analyzed at each position on the transect at GF and analytical errors are not shown.
The relatively level surface of GF transect was not thought to provide a hydrologic gradient in terms of water table position, but the two sampling locations (referred to here as 20, 40 m) provided a comparison between submerged and sub-aerially exposed hummock plants (Table 2). The mean bryophyte δ18Ocellulose value differences between the 20-m site that was submerged (n = 4; 19.8 ± 0.378‰) and exposed (n = 2; 20.3 ± 0.044‰) were small (<0.5‰), and the relationship was not statistically significant (P = 0.204) (Figure 4; Table 2). The mean bryophyte δ18Ocellulose value differences between the 40-m site submerged (n = 2; 19.8 ± 0.38‰) and hummock (n = 4; 20.87 ± 0.655‰) was ~1.5‰, and the difference was not statistically significant (P = 0.111). The differences among sedge δ18Ocellulose value values across all transect positions at GF was low (average = 22.7 ± 0.7‰), although they were on average higher than the difference amongst the bryophytes by 2.5‰ (P < 0.001).
Mean δ18Ocellulose values were calculated for dominant plant types to evaluate the range of variability within a peatland and to better understand how to interpret changes in a peat core. The mean bryophyte δ18Ocellulose value at all HTF transect sites was 17.6 ± 1.2‰ (n = 35; median 16.9‰), with a range of 15.7–20.3‰ (Table 3). The mean bryophyte δ18Ocellulose values at the GF sites was 20.2 ± 0.6‰ (median 20.3‰), with a range of 19.2–21.2‰. The difference in means between HTF and GF δ18Ocellulose values is statistically significant (P < 0.001). In contrast, the mean sedge δ18Ocellulose value at HTF is 24.7 ±2.1‰ (n = 7; median: 25.9‰) is higher than the GF values of 22.7 ± 0.7‰ (median: 22.6‰), a difference that is not great enough to reject the null hypothesis (P = 0.0661).
Plant-Environmental Water δ18O Comparisons (Δδ18Ocellulose-water)
At HTF, the difference between δ18Ocellulose values of individual moss species and the δ18O values of environmental waters (Δδ18Ocellulose−water) ranged from −30 to −37‰ with an average value of −33 ± 3.2‰ (Tables 2, 4). Δδ18Ocellulose−water values increased from −31.2 to −35.8‰ with increasing distance from the stream because although environmental water δ18O values were invariant, plant δ18Ocellulose values increased. The two sedge samples had a larger Δδ18Ocellulose−water value, with an average of −41.1‰. The 1-m site had a larger Δδ18Ocellulose−water value (−42.4‰) than the 40-m site (−39.4‰) (Table 5).
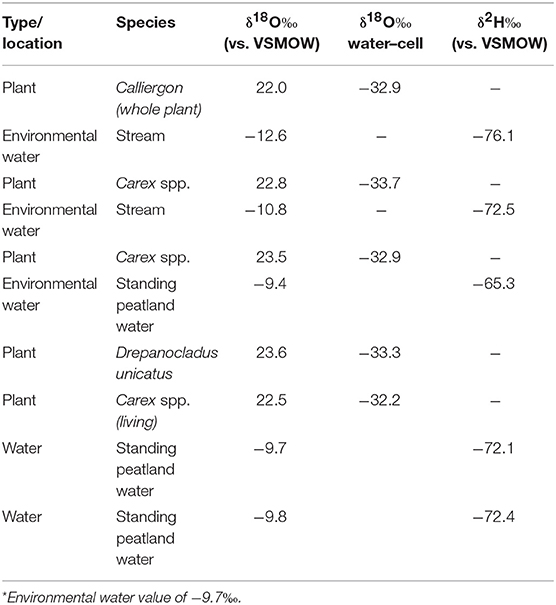
Table 4. St Matthew Island plant cellulose and environmental water isotopes (sampled 6/2016).
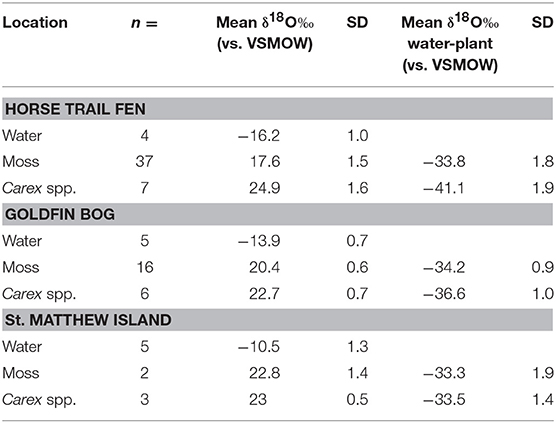
Table 5. Plant and water isotope summary and statistics.
At GF, Δδ18Ocellulose−water ranged from −33 to −35‰ with an average value of −33.9‰ ± 1.2 with larger values for sedge of −36.4‰ ± 1.2. Δδ18Ocellulose−water for submerged and hummock samples were similar at the 20-m site (0.1‰), but at the 40-m site, the hummock samples were 1.3‰ larger. In general, the range of Δδ18Ocellulose−water values at GF was lower than at HTF.
To evaluate Δδ18Ocellulose−water across as wide a range of water values as possible, data from St. Matthew Island is included (Table 4; Figure 5). Considering data from HTF, Goldfin, and St. Matthew Island provided a larger range of water δ18O values from −16.2 to −9.4‰ and δ18Ocellulose values of 17.5 to 23.9‰, indicating a mean Δδ18Ocellulose−water value for all site of −33.4‰. The linear regression using data from the three locations provides a slope of 0.79 with an R2 of 0.811 (Tables 2–5; Figure 5).
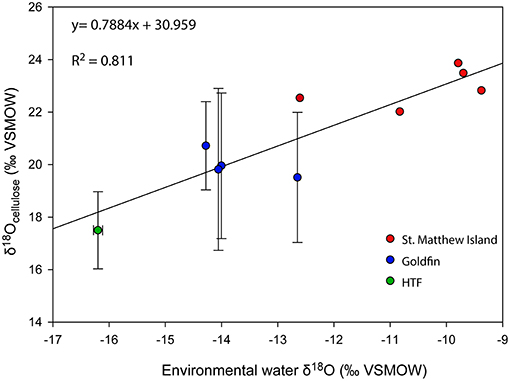
Figure 5. δ18O relationship between environmental water and cellulose from the Kenai Peninsula samples and St. Matthew Island, Alaska. One average water δ18O value was used to correspond with multiple cellulose δ18O values (Y-axis errors). X-axis error bars for HTF do not occur because water values across the site were nearly identical. Red points without errors from St. Matthew Island have only one δ18Ocellulose value associated with one water isotopic value.
Species Effects in the HTF Bulk Peat δ18O Core Record
While Jones et al. (2014) found no apparent relationship between plant macrofossil assemblage and δ18Obulk (Supplemental Figure 1), the results of the modern plant analysis showed a significant difference between δ18Ocellulose moss and Carex spp. (Figure 4), which at HTF was 7.06 ± 2.38‰ (P < 0.001). To illustrate how these adjustments translate to inferred environmental waters, samples that were primarily bryophytic were adjusted by −33.9 ± 1.88‰ according to the modern calibration, an adjustment supported by the cellulose fractionation factor determined by Sternberg and Ellsworth, (2011). In contrast, samples dominated by Carex spp. were adjusted by −41.1 ± 2.4‰, based on the HTF sedge-environmental water differences measured on the modern (Table 5; Figure 6). Samples whose bryophyte and Carex spp. macrofossil sum did not equal 100% were omitted so as to not introduce additional sources of error (Supplemental Table 2). Species-weighted δ18O calculations were made as follows:
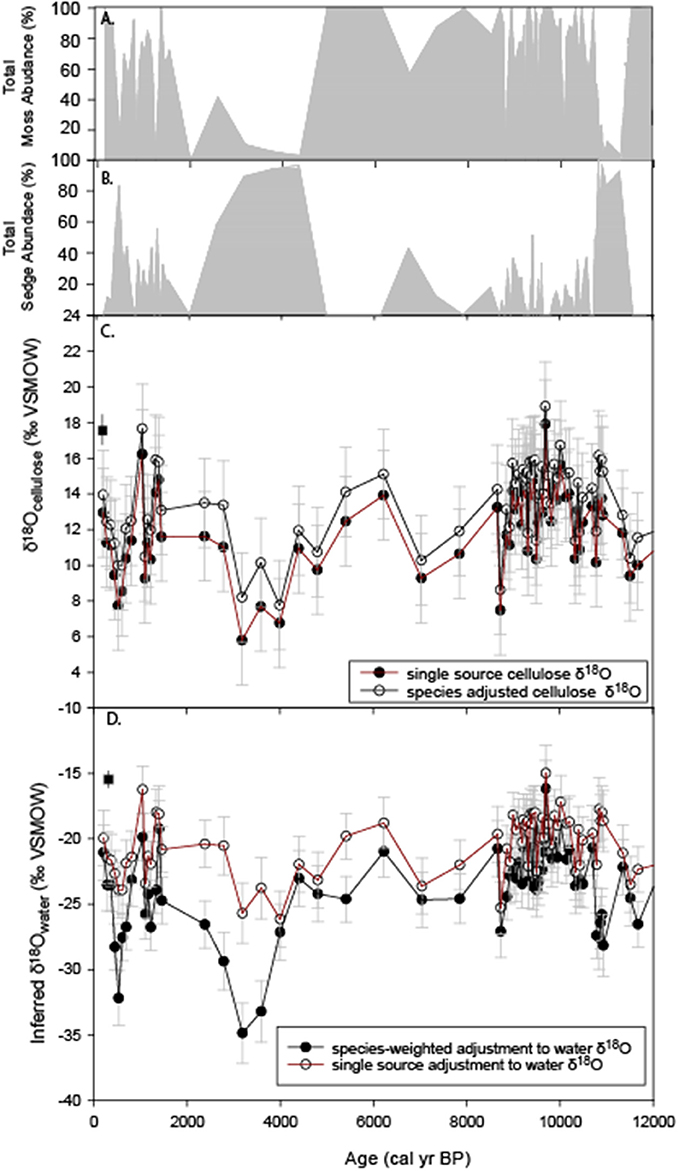
Figure 6. Re-analysis of HTF peat δ18O record of Jones et al. (2014). (A) percent abundance of moss macrofossils (Sphagnum + brown mosses), (B) percent abundance of Carex spp. macrofossils, (C) The original bulk δ18Ocellulose values (red) and species adjusted values determined by this study (black square), (D) Peat-inferred water δ18O values using a constant cellulose fractionation offset of −33‰ for bulk peat (red) and variable offsets depending on relative abundance of moss and Carex spp. macrofossils (black). The average modern water δ18O value determined by this study for year 2014 is the black square at 0 cal yr BP.
Where δ18Omoss−water = −33.9 ± 1.88‰ and δ18Ocarex−water = −41.1 ± 2.5‰ (Figure 6D). Errors were propagated by taking the square root of the sum of the squared sources of error (cellulose errors for mosses and sedges, error of water δ18O values).
Although the plant species-adjusted δ18Ocellulose values resulted in a shift toward higher values in the sedge-dominated intervals (Figure 6C), the inferred environmental water δ18O value adjustment resulted in a downward shift to lower values (Figure 6D), amplifying periods of the record that were already indicated decreased δ18Obulk values in the unadjusted plots. This was particularly the case at ~4–3 ka and 11.7–10.8 ka (Figures 6C,D), resulting in inferred environmental water values of −30 to −35‰ during the most extreme lows.
Discussion
Peatland Isotope Hydrology
The water isotope results indicate that the peatland surface water in both HTF and GF plot on the GMWL, suggesting that the water in these systems reflects the local precipitation signature with evaporative effects limited to pools of standing water (Figure 2). Higher δ18O and δ2H values at GF (~14.1, −109.5‰, respectively), on the windward side of the Kenai Mountains compared to HTF (−16.2, −124‰, respectively), on the leeward side, is consistent with Rayleigh distillation effects (Dansgaard, 1964) across the Kenai Mountain barrier. As moisture is lifted over the Kenai Mountains, heavier isotopes of precipitation are preferentially rained out on the windward side, whereas on the leeward side precipitation values are relatively-isotopically enriched in light isotopes. Consequently, GF waters are 2‰ higher than HTF, and this relationship held for the average range of δ18Ocellulose values for the two peatland sites despite variability in species values (Tables 2, 3; Figures 3, 4). GF water δ18O values have a wider range; one samples was collected from a standing pool of water at the GF 1m location had isotopic values that plot on the LEL. This indicates the isotopic effects of evaporation that are also reflected by relatively low dxs value of −3.67. In contrast, higher GF isotopic values for the stream and peatland surface waters at GF that plot near the GMWL (compared to HTF) are not affected by evaporation and more probably reflect the combined effects of the site's location on the windward side of the Kenai Mountains, in the rain-out zone, at an elevation near sea level.
Although previous studies of δ18Ocellulose peat records have focused on bogs, which are peatlands fed by precipitation and therefore presumptively more reflective of isotopically unmodified precipitation (Daley et al., 2010), the HTF water isotope values indicate that in Alaska fens can also host unmodified precipitation as a source, a conclusion that previous hydrologic studies support (Ford and Bedford, 1987; Reeve and Gracz, 2008). Water uptake in plants may also be more susceptible to evaporation in bogs during dry spells, which can lead to the preferential evaporation of light isotopes in water, complicating their interpretations. Similar to studies in lakes (Anderson et al., 2016), understanding of the hydrology of a system and its relation to isotopes of precipitation serves to constrain the interpretation of the sedimentary record. Both of the HTF and GF peatlands are fens that receive some fraction of their water from groundwater. The proximity of the fen water relative to the GMWL suggests the groundwater residence times (seasonal to annual) do not lead to significant evaporative evolution and thereby supports an interpretation of δ18Ocellulose as a proxy for hydroclimate on decadal, centennial, and millennial timescales.
Intra-Plant Part and Species Effects
Differences in δ18Ocellulose values between Sphagnum stems and branches have been reported (Moschen et al., 2009; Kaislahti Tillman et al., 2010). However, because of the difficulty in separating individual stems and branches while omitting leaves, we only evaluated collections of stems and leaves and found that the differences in δ18Ocellulose values were negligible (<1‰) relative to the 5–10‰ range of observed δ18Ocellulose values in peat core records, similar to results reported by Moschen et al. (2009). Also similar to previous findings (Moschen et al., 2009), the δ18Ocellulose values of Sphagnum leaves and all brown moss samples were higher than those in stems in most instances, suggesting a difference in the biochemical synthesis of cellulose in stems vs. leaves and branches. In the few cases where the relationship was reversed, the reversal could be explained by detrital organic matter caught in Sphagnum leaves, but this is untested. In general, the intra-plant δ18Ocellulose value differences have little effect on interpretation of larger isotopic shifts in a peat core record.
Different moss-species δ18Ocellulose values across the HTF transect varied by ~5‰ (Figure 4) and distinct patterns emerged among species that reflect local hydrologic conditions (drier vs. wetter). Generally, submerged moss species had lower δ18Ocellulose values relative to those species on hummocks, and values increased from wet to the dry locations with increased distance from streams. Other modern calibration studies have found a strong relationship between relative humidity near the moss growth position and the respective isotopic composition of the cellulose (Loader et al., 2016). The Loader et al. (2016) study recorded relative humidity values between 50 and 70% some evaporative enrichment was observed in subaerially exposed peatland mosses. However, a strong relationship between the environmental water and moss-δ18Ocellulose values indicated that the factors influencing isotopic alteration during the growing season remain stable influences on the δ18Ocellulose values of Sphagnum, consistent with findings from this study.
Sedge (Carex spp.) δ18Ocellulose values measured here were always higher (~2.5‰) than mosses suggesting that while mosses passively uptake water and are governed by the same biochemical synthesis of oxygen from water into cellulose, the δ18Ocellulose values of vascular plants are enriched in heavy isotopes by stomatal regulation of water loss (Figure 4; Ménot-Combes et al., 2002; Zanazzi and Mora, 2005; Amesbury et al., 2015). Further, Amesbury et al. (2015) found a consistent offset of 3‰ between root-associated water and environmental water in a species of rush, indicating that fractionation during uptake of water in vascular plants also can occur, further contributing to a larger offset between sedges and mosses. We observed no clear trend with respect to sedge and water table position (Figure 4), although the sample size was small (n = 6 transect positions). The lack of a trend could be the result of both stomatal regulation of water loss and to the depth at which sedges obtain their water, which could have a different isotopic signature from surface water.
A linear regression between the δ18Ocellulose values of aquatic moss and its environmental water with a slope of 1:1 suggests δ18Ocellulose values of aquatic moss are governed by the δ18O values of environmental water (Zhu et al., 2014). In laboratory experiments where aquatic mosses were not subject to evapotranspiration, the environmental water and cellulose δ18O slopes range between 0.78 and 0.97 with R2 values between 0.88 and 0.998 (Sauer et al., 2001; Mayr et al., 2013; Zhu et al., 2014). By comparison, the δ18O regression between our Alaska terrestrial moss and peatland environmental waters in this study has a slope of 0.79 and R2 of 0.81 (Figure 5). Although the terrestrial moss regression does not overlap with the aquatic moss regression, likely because of different relationships between peat water and plants compared with lake water and aquatic moss (Loader et al., 2016). The relationship between Alaska peatland moss and environmental water documented here supports inferred environmental-water interpretations of peat core records. The offset of moss δ18Ocellulose to the δ18Owater is on average −33‰, which is higher than the previously assumed constant offset of −27‰ identified by DeNiro and Epstein (1981) but is in agreement with a latitudinal-temperature effect identified by Sternberg and Ellsworth (2011), where lower MAAT corresponds to lower δ18Ocellulose.
The results of this study suggest that at a given site, mosses do not differ significantly from one another but that significant difference exists between bryophytic (moss) samples and graminoid (sedge: Carex spp.) samples, likely owing to the ecophysiological differences between vascular and nonvascular plants. This suggests that δ18O interpretations of peat cores should have modern site-level information on species differences and that these differences need to be accounted for when peat composition transitions from vascular to nonvascular.
Reanalysis of the HTF δ18O Record
The results of this study show significant species difference between mosses and Carex spp. (Figure 4). Although comparisons between specific peat macrofossil abundances and unaltered δ18Obulk revealed no substantial relationship (Supplemental Figure 1), the +2.5‰ difference between sedge and moss δ18Ocellulose values and−8‰ between sedge and moss inferred-water δ18O values suggests variations in their respective abundance could lead to substantial deviations from the δ18Obulk record (Figure 6). This could have implications for the interpretation of the δ18Obulk record that assumed no differences in the way in which vascular and non-vascular plants fractionate water (Jones et al., 2014). Adjusting the δ18Ocellulose values for abundance of Carex spp. and moss, as outlined above, slightly reduced the overall δ18Ocellulose range of variability of the record compared to the single-source adjusted values (Figure 6C), and the change in the absolute value of the isotopic signature falls within the errors of each respective curve. However, a larger opposite effect occurs when the species-adjusted values are further adjusted to infer environmental water δ18O values. Inferred-water δ18O values are substantially lower during periods of sedge dominance (Figure 6D).
There are additional alternative explanations for the shifts in the HTF δ18Obulk values. The unaltered δ18Obulk analysis on the entire peat core and subsequent cellulose extraction applied to selected peat samples (Jones et al., 2014) did not remove clay minerals and chitin impurities (Wolfe et al., 2007), which have been shown to be a source of significant contamination in sediment-cellulose δ18O measurements (Wissel et al., 2008) and cannot be ruled out as contributing to the unusually low bulk peat and inferred water values. The CUAM method has been shown to produce the purest cellulose and higher δ18Ocellulose values would be expected because they are higher than that of other organic compounds (Zhu et al., 2014). Although Jones et al. (2014) found a compelling relationship between the δ18Obulk and δ18Ocellulose, standard deviations are as large as 2.5‰ and values declines correspond with changes in %LOI and mineral content (Supplemental Figure 2), which could suggest influence of the mineral component on the δ18O, but the change in %LOI also implies a changing depositional environment and/or climate change. Additional analyses are required to more precisely determine the effect of cellulose extraction methods on the HTF δ18Obulk values (Figures 6C,D).
A prominent period when shifts to greater Carex spp. abundances substantially alter the interpretation of the unaltered δ18Obulk record occurs between ~11.7 and 10.8 ka (Figures 6B,D). The unadjusted record shows values similar to the rest of the early Holocene (Figure 6C), but the species-adjusted inferred δ18O water values are substantially lower at the beginning of the Holocene (~-27‰; 11.7–10.8 ka). The resulting lower values, combined with the species assemblage change, suggest that a previously unrecognized hydroclimatic shift occurred between the early Preboreal (11.7–10.8 ka) and the subsequent early Holocene period (10.8–9 ka). Lower environmental water δ18O values during this period could reflect the influence of rising sea levels and more extensive sea ice conditions (e.g., Gaglioti et al., 2017). Other mechanisms could include altered atmospheric circulation dynamics, including changing seasonality and longer transport over the continent: lower values are consistent with greater winter precipitation influence on the groundwater signature, as winter precipitation δ18O values are lower than summer values (IAEA/WMO, 2001; Bailey et al., 2015).
Another period of Carex spp. dominance occurs between ~4 and 3 ka, when rising species-adjusted δ18Ocellulose are higher than unadjusted bulk δ18Ocellulose values (Figure 6C), leading to inferred water values (Figure 6D) that are the lowest of the entire record (−35 to −32‰). In this case, the recorded declines are enhanced by correcting for species, but the overall trend is unchanged. This interval at HTF coincides with a notable decline in organic matter (Supplemental Figure 2), due to an increase in silt percentages that was previously interpreted to reflect a combination of climate-induced peat decomposition and silt deposition, but may reflect the influence of more negative clay mineral water isotope values; bulk peat values may to some degree represent changes in clay mineral abundance. Another potential could be that there is a difference in the δ18O values derived from sedge roots and shoots, which was found to be as large as 10‰ in a specific peat-forming rush in New Zealand (Amesbury et al., 2015), and bulk samples could represent variable amounts of root and shoot material. Although this study focused on shoot material from Carex spp., the bulk peat core material was likely a mixture of root and shoot material. Amesbury et al. (2015) suggests the smaller offset in the root δ18Ocellulose could make root δ18Ocellulose the more viable component for proxy development, but further study is required to determine if a similar relationship exists in peat-forming sedges. In general, results indicate that core analyses using consistent cellulose extraction methodologies are ideal.
It is difficult to identify mechanisms that can explain the anomalously low inferred-water δ18O values of −35 to −30‰. They are unrealistic when compared to the closest (~700 km) modern global network of isotopes in precipitation (GNIP) data from Bethel, Alaska, and Whitehorse, Yukon Territory (IAEA/WMO, 2001), and reported values of last glacial maximum (LGM) water in interior Alaska (−28‰; Lachniet et al., 2012). Notwithstanding the unrealistic absolute values of the species-adjusted inferred water values, the declining trends could suggest declining temperatures, a shift toward winter-dominant precipitation, or more northerly derived moisture during this time interval. It is also possible that the large decrease between ~4 and 3 ka could reflect water from a non-precipitation source, such as an outburst flooding event driven by glacial meltwater, intruded into the peatland, although this hypothesis remains untested. Interestingly, after accounting for age model uncertainty, the timing roughly corresponds (~3.3–2.5 ka) to a similar isotope excursion (Wooller et al., 2012) and flood deposits along the Tanana River in Interior Alaska (Sattler and Jordan, 1987; Mason and Begét, 1991) and from the central Brooks Range (Hamilton, 1981), suggesting widespread flooding. Assuming that at least some of the decrease is related to the plant's environmental water and a non-cellulose source, another hypothesis for the earlier anomalously low δ18O values is that lower Pleistocene-aged meltwater could explain the low δ18O values. Given the proximity of the HTF site to the margin of the ice sheet during the early Holocene, it is conceivable that the low inferred water δ18O values from 11.7 to 10.8 ka were derived from glacial meltwater, as the ice sheet was rapidly melting under a warming climate (Kaufman et al., 2004).
HTF Paleo-Hydroclimate Relative to Modern Results
The HTF δ18Ocellulose values have a mean of 11.9‰, which falls well below the mean δ18Ocellulose estimates (17.5‰ ± 1.4) at HTF today. Furthermore, the mean δ18O water value at HTF today (−16‰) falls well above the Holocene and late-glacial average values (−23.6‰, adjusted; −20.4‰, unadjusted; Figure 6D). Unless the 6–7‰ discrepancies are caused by differences in extraction methods and sample purity, the disparity between the modern and paleo δ18Ocellulose values suggests that (1) the sampling has not fully encapsulate the range of variables affecting the δ18Ocellulose values through time, such as large changes in temperature (Sternberg and Ellsworth, 2011), and (2) that modern hydrologic conditions on the Kenai are largely unlike the conditions of the past 14 ky, with notable exceptions for two periods at ~9.6 ka and ~ 1–1.5 k (Figure 6D). Higher water isotope values generally suggest some combination of warmer temperatures, more proximal moisture sources or those originating from primary moisture sources to the south (i.e., the Gulf of Alaska and North Pacific), or a shift in predominance to summer precipitation. Evidence from other studies has shown intensification of the Aleutian Low over the last 150 years (Anderson et al., 2016; Osterberg et al., 2017), which is supported by the increasing values toward present in the HTF record and the higher modern values reported here.
Conclusions
In this study, we have determined (a) that Kenai fen water reflects modern precipitation, (b) the relationship between δ18O values of moss and Carex spp. cellulose with environmental water, (c) the range of δ18O values among species of moss and sedge commonly found within Alaskan peatlands, and (d) moss and sedge species separation is necessary for more accurate inferences of variability in environmental water δ18O values from Alaska peat records.
The use of δ18Ocellulose from peat cores has the potential to dramatically improve the spatio-temporal resolution in paleoclimate studies in regions where peatlands are abundant, such as vast areas of the boreal and Arctic. However, the results of this study show that, similar to lake studies, efforts to better characterized peatland hydrology with modern water isotope sampling serves to improve interpretations of paleoclimate studies. Furthermore, prominent shifts in vegetation assemblages, particularly shifts between moss (nonvascular)- and Carex spp. (vascular)-plant dominated intervals common in fens, necessitate modern studies of the relationships between the δ18O values of plants and environmental waters. Fens are the dominant wetland type in Alaska and circumpolar boreal peatlands, and this study has served to highlight their potential as hydroclimatic archives, particularly spanning periods of substantial deglacial sea level and climate change.
Author Contributions
MJ conceived of the study, designed the research, analyzed data, and wrote the manuscript. LA helped design the research, analyze data, and helped write the manuscript. KK, BN, and VL processed samples and created protocol to extract cellulose. MW helped write the manuscript and analyze data. CJ separated moss species and plant parts.
Conflict of Interest Statement
The authors declare that the research was conducted in the absence of any commercial or financial relationships that could be construed as a potential conflict of interest.
Acknowledgments
The authors would like to thank the Kenai National Wildlife Refuge and the Alaska Maritime National Wildlife Refuge for access to field sites and Tony Degange and Marc Romano for help with sample collection on St. Matthew Island, Alaska. The authors thank Jessica Rodysill, Laura Gemery, and two reviewers for helpful comments that improved the quality of this manuscript. This study was funded by the USGS Land Change Science Program R&D. Any use of trade, product, or firm names is for descriptive purposes only and does not imply endorsement by the U.S. government.
Supplementary Material
The Supplementary Material for this article can be found online at: https://www.frontiersin.org/articles/10.3389/feart.2019.00025/full#supplementary-material
References
Amesbury, M. J., Charman, D. J., Newnham, R. M., Loader, N. J., Goodrich, J., Royles, J., et al. (2015). Can oxygen stable isotopes be used to track precipitation moisture source in vascular plant-dominated peatlands? Earth Planet. Sci. Lett. 430, 149–159. doi: 10.1016/j.epsl.2015.08.015
Anderson, L., Abbott, M., Finney, B., and Burns, S. (2005). Regional atmospheric circulation change in the North Pacific during the Holocene inferred from lacustrine carbonate oxygen isotopes, Yukon Territory, Canada. Quat. Res. 64, 21–35. doi: 10.1016/j.yqres.2005.03.005
Anderson, L., Berkelhammer, M., Barron, J. A., Steinman, B. A., Finney, B. P., and Abbott, M. B. (2016). Lake oxygen isotopes as recorders of North American Rocky Mountain hydroclimate: holocene patterns and variability at multi-decadal to millennial time scales. Glob. Planet. Change 137, 131–148. doi: 10.1016/j.gloplacha.2015.12.021
Bailey, H. L., Kaufman, D. S., Henderson, A. C. G., and Leng, M. J. (2015). Synoptic scale controls on the δ 18 O in precipitation across Beringia. Geophys. Res. Lett. 42, 4608–4616. doi: 10.1002/2015GL063983
Brand, W. A., Geilmann, H., Crosson, E. R., and Rella, C. W. (2009). Cavity ring-down spec- troscopy versus high-temperature conversion isotope ratio mass spectrometry; a case study on d2H and d18O of pure water samples and alcohol/water mixtures. Rapid Commun. Mass Spectrom. 23:1879e1884. doi: 10.1002/rcm.4083
Brenninkmeijer, C. A. M., van Geel, B., and Mook, W. G. (1982). Variations in the D/H and 18O/16O ratios in cellulose extracted from a peat bog core. Earth Planet. Sci. Lett. 61, 283–290. doi: 10.1016/0012-821X(82)90059-0
Daley, T. J., Barber, K. E., Hughes, P. D. M., Loader, N. J., Leuenberger, M., and Street-Perrott, F. A. (2016). The 8.2-ka BP event in north-eastern North America: first combined oxygen and hydrogen isotopic data from peat in NewfoundlandJournal of Quaternary. Science 31, 416–425. doi: 10.1002/jqs.2870
Daley, T. J., Barber, K. E., Street-Perrott, F. A., Loader, N. J., Marshall, J. D., Crowley, S. F., et al. (2010). Holocene climate variability revealed by oxygen isotope analysis of Sphagnum cellulose from Walton Moss, northern England. Quat. Sci. Rev. 29, 1590–1601. doi: 10.1016/j.quascirev.2009.09.017
Dansgaard, W. (1964). Stable isotopes in precipitation. Tellus 16, 436–468. doi: 10.3402/tellusa.v16i4.8993
DeNiro, M. J., and Epstein, S. (1979). Relationship between the oxygen isotope ratios of terrestrial plant cellulose, carbon dioxide, and water. Sci. N. Ser. 204, 51–53. doi: 10.1126/science.204.4388.51
DeNiro, M. J., and Epstein, S. (1981). Isotopic composition of cellulose from aquatic organisms. Geochim. Cosmochim. Acta 45, 1885–1894. doi: 10.1016/0016-7037(81)90018-1
Fisher, D. A., Wake, C., Kreutz, K., Yalcin, K., Steig, E., Mayewski, P., et al. (2004). Stable isotope records from mount logan, eclipse ice cores and nearby jellybean lake. water cycle of the north pacific over 2000 years and over five vertical kilometres: sudden shifts and tropical connections. Géograp. Physique et Quat. 58, 337. doi: 10.7202/013147ar
Ford, J., and Bedford, B. L. (1987). The hydrology of Alaskan wetlands, USA: a review. Arct. Alp. Res. 19, 209–229. doi: 10.1080/00040851.1987.12002596
Gaglioti, B. V., Mann, D. H., Wooller, M. J., Jones, B. M., Wiles, G. C., Groves, P., et al. (2017). Younger-Dryas cooling and sea-ice feedbacks were prominent features of the Pleistocene-Holocene transition in Arctic Alaska. Quat. Sci. Rev. 169, 330–343. doi: 10.1016/j.quascirev.2017.05.012
Gupta, P., Noone, D., Galewsky, J., Sweeney, C., and Vaughn, B. H. (2009). Demonstration of high-precision continuous measurements of water vapor isotopologues in laboratory and remote field deployments using wavelength-scanned cavity ring-down spectroscopy (WS-CRDS) technology. Rapid Commun. Mass Spectrom. 23:2534e2542. doi: 10.1002/rcm.4100
Hamilton, T. D. (1981). “Episodic Holocene alluviation in the Brooks Range: chronology, correlations and climatic implications,” in US Geological Survey in Alaska: Accomplishments During 1979, ed R. Albert (US Geological Survey Circular), 21–24.
IAEA/WMO (2001). “Global network for isotopes in precipitation,” in The GNIP Database. Available online at: http://isohis.iaea.org
Jones, M. C., Wooller, M., and Peteet, D. M. (2014). A deglacial and Holocene record of climate variability in south-central Alaska from stable oxygen isotopes and plant macrofossils in peat. Quat. Sci. Rev. 87, 1–11. doi: 10.1016/j.quascirev.2013.12.025
Kaislahti Tillman, P., Holzkämper, S., Kuhry, P., Sannel, A. B. K., Loader, N. J., and Robertson, I. (2010). Stable carbon and oxygen isotopes in Sphagnum fuscum peat from subarctic Canada: Implications for palaeoclimate studies. Chem. Geol. 270, 216–226. doi: 10.1016/j.chemgeo.2009.12.001
Kaufman, D. S., Ager, T. A., Anderson, N. J., Anderson, P. M., Andrews, J. T., Bartlein, P. J., et al. (2004). Holocene thermal maximum in the Western Arctic (0–180 W). Quat. Sci. Rev. 23, 529–560. doi: 10.1016/j.quascirev.2003.09.007
Kühl, N., and Moschen, R. (2012). A combined pollen and δ 18 O Sphagnum record of mid-Holocene climate variability from Dürres Maar (Eifel, Germany). Holocene 22, 1075–1085. doi: 10.1177/0959683612441838
Lachniet, M. S., Lawson, D. E., and Sloat, A. R. (2012). Revised 14 C dating of ice wedge growth in interior Alaska (USA) to MIS 2 reveals cold paleoclimate and carbon recycling in ancient permafrost terrain. Quat. Res. 78, 217–225. doi: 10.1016/j.yqres.2012.05.007
Loader, N. J., Street-Perrott, F. A., Mauquoy, D., Roland, T. P., van Bellen, S., Daley, T. J., et al. (2016). Measurements of hydrogen, oxygen and carbon isotope variability in Sphagnum moss along a micro-topographical gradient in a southern Patagonian peatland: Stable Isotopic Variability in Patagonian Peat. J. Quat. Sci. 31, 426–435. doi: 10.1002/jqs.2871
Mason, O. K., and Begét, J. E. (1991). Late Holocene flood history of the Tanana River, Alaska, USA. Arct. Alp. Res. 23, 392–403.
Mayr, C., Lücke, A., Wagner, S., Wissel, H., Ohlendorf, C., Haberzettl, T., et al. (2013). Intensified Southern Hemisphere Westerlies regulated atmospheric CO2 during the last deglaciation. Geology 41, 831–834. doi: 10.1130/G34335.1
Ménot, G., and Burns, S. J. (2001). Carbon isotopes in ombrogenic peat bog plants as climatic indicators: calibration from an altitudinal transect in Switzerland. Org. Geochem. 32, 233–245. doi: 10.1016/S0146-6380(00)00170-4
Ménot-Combes, G., Burns, S. J., and Leuenberger, M. (2002). Variations of 18O/16O in plants from temperate peat bogs (Switzerland): implications for paleoclimatic studies. Earth Planet. Sci. Lett. 202, 419–434. doi: 10.1016/S0012-821X(02)00794-X
Moschen, R., Kühl, N., Rehberger, I., and Lücke, A. (2009). Stable carbon and oxygen isotopes in sub-fossil Sphagnum: assessment of their applicability for palaeoclimatology. Chem. Geol. 259, 262–272. doi: 10.1016/j.chemgeo.2008.11.009
Nichols, J., Booth, R. K., Jackson, S. T., Pendall, E. G., and Huang, Y. (2010). Differential hydrogen isotopic ratios of Sphagnum and vascular plant biomarkers in ombrotrophic peatlands as a quantitative proxy for precipitation—evaporation balance. Geochim. Cosmochim. Acta 74, 1407–1416. doi: 10.1016/j.gca.2009.11.012
Noone, D., Risi, C., Bailey, C. M., Berkelhammer, M. B., Brown, D. P., Buenning, N. H., et al. (2013). Water sources and turbulent transport from tall tower profiles of water vapor isotope ratios after a snow storm in Colorado. Atmos. Chem. Phys. 13:1607e1623. doi: 10.5194/acp-13-1607-2013
Osterberg, E. C., Winski, D. A., Kreutz, K. J., Wake, C. P., Ferris, D. G., Campbell, S., et al. (2017). The 1200 year composite ice core record of Aleutian Low intensification: Aleutian Low Ice Core Record. Geophys. Res. Lett. 44, 7447–7454. doi: 10.1002/2017GL073697
Overland, J. E., Adams, J. M., and Bond, N. A. (1999). Decadal Variability of the aleutian low and its relation to high-latitude circulation*. J. Clim. 12, 1542–1548. doi: 10.1175/1520-0442(1999)012and<1542:DVOTALand>2.0.CO;2
Proctor, M. (2000). Mosses and alternative adaptation to life on land. New Phytol. 148, 1–6. doi: 10.1111/j.1469-8137.2000.00751.x
Reeve, A. S., and Gracz, M. (2008). Simulating the hydrogeologic setting of peatlands in the Kenai Peninsula Lowlands, Alaska. Wetlands 28:92. doi: 10.1672/07-71.1
Reger, R. D., Sturmann, A. G., Berg, E. E., and Burns, P. A. C. (2008). A Guide to the Late Quaternary History of Northern and Western Kenai Peninsula. Guidebook GB 8. Fairbanks, AK: Department of Natural Resources; Division of Geological & Geophysical Surveys.
Rozanski, K., Araguas-Araguas, L., and Gonfiantini, R. (1993). “Isotopic patterns in modern global precipitation” in Climate Change in Continental Isotopic Records, Geophysical Monograph, eds Swart, P. K., Lohman, K. C., McKenzie, J., Savin, S (Washington, DC: American Geophysical Union), 1e36. doi: 10.1029/GM078p0001
Rymer, M. J., and Sims, J. D. (1982). Lake-sediment evidence for the date of deglaciation of the Hidden Lake area, Kenai Peninsula, Alaska. Geology 10:314. doi: 10.1130/0091-7613(1982)10and<314:LEFTDOand>2.0.CO;2
Sattler, R. A., and Jordan, J. W. (1987). Late Holocene alluvium of the lower Tanana River, central Alaska. J. Northern Sci. 1:8091.
Sauer, P. E., Miller, G. H., and Overpeck, J. T. (2001). Oxygen isotope ratios of organic matter in arctic lakes as a paleoclimate proxy: field and laboratory investigations. J. Paleolimnol. 25, 43–64. doi: 10.1023/A:1008133523139
Sternberg, L., and Ellsworth, P. F. V. (2011). Divergent biochemical fractionation, not convergent temperature, explains cellulose oxygen isotope enrichment across latitudes. PLoS ONE 6:e28040. doi: 10.1371/journal.pone.0028040
Vardy, S. R. (1997). Climate Change and Postglacial Environmental History of Permafrost Peatlands in the Mackenzie Delta Area. NWT Dissertation, University of Waterloo.
Wissel, H., Mayr, C., and Lücke, A. (2008). A new approach for the isolation of cellulose from aquatic plant tissue and freshwater sediments for stable isotope analysis. Org. Geochem. 39, 1545–1561. doi: 10.1016/j.orggeochem.2008.07.014
Wolfe, B. B., Edwards, T. W., Elgood, R. J., and Beuning, K. R. (2001). “Carbon and oxygen isotope analysis of lake sediment cellulose: methods and applications,” in Tracking Environmental Change Using Lake Sediments, eds W. M. Last and J. P. Smol (Dordrecht: Springer), 373–400. doi: 10.1007/0-306-47670-3_14
Wolfe, B. B., Falcone, M. D., Clogg-Wright, K. P., Mongeon, C. L., Yi, Y., Brock, B. E., et al. (2007). Progress in isotope paleohydrology using lake sediment cellulose. J. Paleolimnol. 37, 221–231. doi: 10.1007/s10933-006-9015-8
Wooller, M. J., Kurek, J., Gaglioti, B. V., Cwynar, L. C., Bigelow, N., Reuther, J. D., et al. (2012). An ~11,200 year paleolimnological perspective for emerging archaeological findings at Quartz Lake, Alaska. J. Paleolimnol. 48, 83–99. doi: 10.1007/s10933-012-9610-9
Yakir, D., and DeNiro, M. J. Gat, J. R. (1990). Natural deuterium and oxygen-18 enrichment in leaf water of cotton plants grown under wet and dry conditions: evidence for water compartmentation and its dynamics. Plant. Cell Environ. 13, 49–56. doi: 10.1111/j.1365-3040.1990.tb01298.x
Zanazzi, A., and Mora, G. (2005). Paleoclimatic implications of the relationship between oxygen isotope ratios of moss cellulose and source water in wetlands of Lake Superior. Chem. Geol. 222, 281–291. doi: 10.1016/j.chemgeo.2005.08.006
Keywords: hydroclimate, peatland archives, oxygen isotopes (δ18O), cellulose, calibration dataset
Citation: Jones MC, Anderson L, Keller K, Nash B, Littell V, Wooller M and Jolley CA (2019) An Assessment of Plant Species Differences on Cellulose Oxygen Isotopes From Two Kenai Peninsula, Alaska Peatlands: Implications for Hydroclimatic Reconstructions. Front. Earth Sci. 7:25. doi: 10.3389/feart.2019.00025
Received: 17 October 2018; Accepted: 05 February 2019;
Published: 05 March 2019.
Edited by:
Michaël Hermoso, UMR7193 Institut des Sciences de la Terre Paris (ISTEP), FranceReviewed by:
Guillemette Ménot, École Normale Supérieure de Lyon, FranceMatthew John Amesbury, University of Helsinki, Finland
Copyright © 2019 Jones, Anderson, Keller, Nash, Littell, Wooller and Jolley. This is an open-access article distributed under the terms of the Creative Commons Attribution License (CC BY). The use, distribution or reproduction in other forums is permitted, provided the original author(s) and the copyright owner(s) are credited and that the original publication in this journal is cited, in accordance with accepted academic practice. No use, distribution or reproduction is permitted which does not comply with these terms.
*Correspondence: Miriam C. Jones, bWlyaWFtam9uZXNAdXNncy5nb3Y=