 Thomas Charles Wilkes1*
 Tom David Pering1
 Andrew John Samuel McGonigle1,2
 Jon Raffe Willmott3
 Robert Bryant1
 Alan Lomas Smalley1
 Forrest Marion Mims III4
 Alfio V. Parisi5Rebecca Anne England1
- 1Department of Geography, The University of Sheffield, Sheffield, United Kingdom
- 2School of Geosciences, The University of Sydney, Sydney, NSW, Australia
- 3Department of Electronic and Electrical Engineering, The University of Sheffield, Sheffield, United Kingdom
- 4Geronimo Creek Observatory, Seguin, TX, United States
- 5Faculty of Health, Engineering and Sciences, University of Southern Queensland, Toowoomba, QLD, Australia
Spectroscopy has been used to quantify volcanic gas emission rates, most commonly SO2, for a number of decades. Typically, commercial spectrometers costing 1000s USD are employed for this purpose. The PiSpec is a new, custom-designed, 3D-printed spectrometer based on smartphone sensor technology. This unit has ≈1 nm spectral resolution and a spectral range in the ultraviolet of ≈280–340 nm, and is specifically configured for the remote sensing of SO2 using Differential Optical Absorption Spectroscopy (DOAS). Here we report on the first field deployment of the PiSpec on a volcano, to demonstrate the proof of concept of the device’s functionality in this application area. The study was performed on Masaya Volcano, Nicaragua, which is one of the largest emitters of SO2 on the planet, during a period of elevated activity where a lava lake was present in the crater. Both scans and traverses were performed, with resulting emission rates ranging from 3.2 to 45.6 kg s−1 across two measurement days; these values are commensurate with those reported elsewhere in the literature during this activity phase (Aiuppa et al., 2018; Stix et al., 2018). Furthermore, we tested the PiSpec’s thermal stability, finding a wavelength shift of 0.046 nm/∘C between 2.5 and 45∘C, which is very similar to that of some commercial spectrometers. Given the low build cost of these units (≈500 USD for a one-off build, with prospects for further price reduction with volume manufacture), we suggest these units hold considerable potential for volcano monitoring operations in resource limited environments.
Introduction
Ground-based remote sensing of sulfur dioxide (SO2) emissions from volcanoes has been performed for a number of decades, aiding in both monitoring efforts and volcanic research (e.g., Young et al., 1998; Shinohara et al., 2008; Arellano et al., 2017). Differential Optical Absorption Spectroscopy (DOAS) is the most commonly applied retrieval approach, utilizing the distinct absorption features of SO2, most commonly in the ≈300–325 nm wavelength range (Platt and Stutz, 2008). A variety of instrument designs and deployment modes have been proposed and employed within this scientific community: Multi AXis DOAS (MAX-DOAS; e.g., Hönninger et al., 2004; Bobrowski et al., 2007; Galle et al., 2010), walking traverses (e.g., McGonigle et al., 2002), road traverses (McGonigle et al., 2002; Galle et al., 2003; Salerno et al., 2009), airborne traverses (Galle et al., 2003; McGonigle et al., 2004; Grutter et al., 2008), high time-resolution fixed field of view deployments (e.g., McGonigle et al., 2009; Tamburello et al., 2011) and satellite remote sensing (e.g., Khokhar et al., 2005; Rix et al., 2009; Theys et al., 2015). Airborne DOAS instruments have also been proposed as a means of improving aviation safety related to volcanic hazard, by providing early detection of volcanic plumes (Vogel et al., 2011). Most prominently in volcanology, the Network for Observation of Volcanic and Atmospheric Change (NOVAC) project has led to the deployment of a large number of scanning spectrometers at volcanoes across the globe, monitoring SO2 emissions along with other gas species (Galle et al., 2010).
Recently, we have developed the PiSpec, a 3D-printed UV spectrometer based on a detector primarily designed for the smartphone market (Wilkes et al., 2017). The sensor, here packaged as part of a Raspberry Pi camera module, is modified by removal of its Bayer filter, as described in Wilkes et al. (2016), to deliver significant enhancement in UV sensitivity. This instrument provides a relatively low-cost alternative to off-the-shelf commercially available UV spectrometers (≈500 USD vs. >1000 USD), with the potential to drive costs down further with mass production. Furthermore, the presented methodology allows researchers to quite easily design and build new spectrometers with spectral ranges and resolutions specifically tailored for their desired applications. The initial article (Wilkes et al., 2017) highlighted that this specific PiSpec design has the performance to facilitate DOAS retrievals of SO2, with comparable functionality to a commercial USB2000 (Ocean Optics, Inc.) instrument. However, those relatively rudimentary tests, using SO2 filled quartz cells, did not rigorously assess the spectrometer’s performance under representative field deployment conditions, which can often be more challenging than isolated laboratory experiments, for example, involving road traverses on bumpy roads or large changes in ambient temperatures. Here, we therefore present the first deployment of the PiSpec on a volcano, in this case at Masaya volcano (11°59′3.65″ N, 86°10′5.28″ W), Nicaragua, to demonstrate its performance under “real world” field conditions. Both scanning and road traverse retrievals are presented from this campaign, which took place during a period of heightened activity, whilst a lava lake was present in the crater. Furthermore, since spectrometers can be subjected to a wide range of ambient conditions during field deployments, we also characterize the thermal stability of the spectrometer via laboratory tests.
Materials and Methods
Measurement and Retrieval Technique
The PiSpec instrument design is described in detail in Wilkes et al. (2017). It is based on a Czerny-Turner optical bench layout, with off-the-shelf optical components mounted in a 3D-printed housing. Light enters through a slit aperture and is collimated using a mirror, before falling incident onto a diffraction grating; the dispersed light is then focused onto a detector, to provide a system spectral resolution and range of ≈1 nm and ≈280–340 nm, respectively. The detector is an Omnivision OV5647 sensor, primarily designed for the smartphone market, but here packaged as part of the Raspberry Pi v1.3 camera module (Raspberry Pi Foundation). This camera board has the advantage of greater user control, such as raw 10-bit data access and better gain control, relative to sensors incorporated into smartphone units themselves. Furthermore, this board-based configuration makes the sensor more readily accessible, such that we are able to chemically remove the Bayer filter, as described by Wilkes et al. (2016); this produces a uniformly responding sensor with enhanced UV sensitivity, both of which are crucial features for this application area. The detector acquisition is controlled by a Raspberry Pi computer, which in turn is controlled by a custom Python 3 graphical user interface run on a Windows laptop. As in Wilkes et al. (2017), all spectra captured herein have been generated by co-adding 11 rows across the PiSpec sensor, to increase the signal-to-noise ratio (SNR).
We have previously demonstrated that the instrument has ≈1 nm spectral resolution and a spectral range of ≈280–340 nm, with a 30 μm slit in place. This implementation makes it well tailored for DOAS retrievals of SO2, following approaches which are extensively documented elsewhere (Galle et al., 2003; Platt and Stutz, 2008). In brief, the method involves collection of a clear-sky Fraunhofer spectrum, I0(λ), with which subsequent in-plume spectra, I(λ), can be used to calculate the plume optical density, D(λ):
The differential optical density, D′(λ), can then be isolated through applying a high-pass filter to D(λ); here, we use a Butterworth high-pass filter implemented in MATLAB®. A reference spectrum of the SO2 absorption cross-section, such as that provided by Vandaele et al. (2009), is then convolved with the instrument’s line shape and high-pass filtered also. This spectrum is then fitted to D′(λ), using a least-squares method, such that the scaling factor of the fit provides the column density of SO2 for that spectral acquisition. An O3 absorption spectrum (taken from the HITRAN database; Gordon et al., 2017) is similarly fitted, to remove effects from this species, which also has distinct absorption features within the spectral fitting window; SO2 column densities retrieved with and without this O3 correction differed by <2%. In this work, the fitting window was manually determined for each spectrum, by assessing the degree of saturation present at shorter wavelengths when large column densities of SO2 were present; we then ensured that a sufficiently long start wavelength for the fitting window was chosen in order to avoid this saturation. Typically, for larger column densities a fit window of ≈314–324 nm was used, which we later show is linear up to ≈4000 ppm ⋅ m. Whilst fitting window determination could be automated for the PiSpec, as with any other DOAS instrument (Vogel et al., 2013), this was not the purpose of this study.
In practice, spectra I0(λ) and I(λ) first must be corrected for dark current and stray light. Firstly, for the former a dark spectrum was acquired with the entrance optics blocked, in this case with a lens cap covering the lens. On Masaya, the dark acquisitions were made immediately prior to or after a full scan/traverse sequence. The dark spectrum is then subtracted from all spectra. Stray light was subsequently corrected for by subtracting the average digital number (DN) between ≈285–295 nm from the entire spectrum. At these wavelengths, the irradiance at the Earth’s surface is negligible, due to strong absorption by Ozone, therefore, the signal at the detector should be ≈0. In reality this is not the case, due to stray light within the spectrometer, which is assumed to be uniform across the detector.
For the PiSpec’s entrance slit we predominantly used the 30 μm slit aperture; however, for some field traverses we tested a 50 μm slit to explore the outcomes of increased light throughput, with associated reduction in required exposure times. This modification does, however, result in decreased spectral resolution, which can be detrimental to the DOAS retrievals.
Thermal Stability
Volcanoes can be located in a range of extreme environments, often found at low temperatures due to their altitude, or in hot conditions from direct sun exposure at lower latitudes. Since spectrometers can be sensitive to changes in thermal conditions, shifting and warping the line function (e.g., Platt and Stutz, 2008), it is important to address this issue as part of evaluating the PiSpec’s utility in volcanic surveillance operations.
These tests were performed by acquiring spectra from a Hg-Ar lamp (Ocean Optics, Inc.) coupled to the PiSpec by an optical fiber. This setup was placed in an incubator (Panasonic MIR-254-PE), set on Low Humidity Mode, to expose it to temperatures between ≈0 and 50°C. The PiSpec was further placed inside a plastic pouch containing silica gel, to reduce humidity and prevent condensation; within this pouch the lowest temperature actually achieved was 2.5°C. Temperature was logged every minute using a LogTag® HAXO-8 recorder. At each temperature setting a repose period of ≈1 h was applied before acquisition, to allow the pouch to equilibrate with the incubator temperature. The tests spanned 2 days, 19–20 June 2018.
Field Deployment
The PiSpec was tested on Masaya volcano, Nicaragua, on the 14th (19:20 to 21:30 UTC) and 16th of June 2017 (16:40 to 18:20 UTC). At this time, a vigorously overturning lava lake was emplaced in Masaya’s Santiago crater. The lake, which has been visible since late 2015 (Venzke, 2017), has been the subject of only a few published articles to date (Aiuppa et al., 2018; Stephens and Wauthier, 2018; Wilkes et al., 2018; Pering et al., 2019). SO2 emission rates from the crater, measured with a NOVAC scanning-DOAS system, have been highly variable since the lake appeared, with measured fluxes ranging between 0 and 50 kg s−1 (Aiuppa et al., 2018). Between 2005 and 2015, Carn et al. (2017) listed Masaya as the 18th largest passive volcanic emitter of SO2 on earth. Furthermore, due to the low elevation of Masaya’s crater, and hence its plume, emissions can have a considerable impact on surrounding vegetation and communities (Delmelle et al., 2002).
We deployed the PiSpec to acquire under two distinct observation modes: scanning-DOAS (14th June) and road traverses (16th June). For the former set up, tests were performed close to the vent, manually scanning horizontally through the plume whilst it was still rising buoyantly from the crater. Contemporaneous visible video was acquired with a DSLR camera, allowing plume transport speed determinations by tracking the condensed plume. This was based on integrating the pixel brightness over two cross sections through the rising plume, then generating time series for each of these feeds, which were cross correlated in order to determine the temporal lag between them. This follows the commonly applied approach in both spectral and image based determinations of plume speed in volcanic SO2 emission rate estimations (McGonigle et al., 2005; Mori and Burton, 2006). Indeed, in settings where a volcanic plume is persistently condensed, this also demonstrates that visible imagery can provide an effective low-cost method of retrieving plume speeds for a DOAS instrument.
Uncertainties associated with the cross-correlation technique are dominated by knowledge of the distance from observer to camera, and the angle of plume motion relative to the normal of the camera viewing direction, i.e., plume speed has a 1/cosα dependency on relative angle of plume motion, where α is the angular offset from a plume motion that is perpendicular to the camera viewing direction (Klein et al., 2017). For the scans in particular, since they were located close to the source, the relative uncertainty associated with distance to the plume dominates the total uncertainty; it was estimated to be ≈± 0.2 (20%). Conversely, even with a relatively large absolute uncertainty for the angle of plume motion (estimated to be ≈± 10°), the associated relative uncertainty is small (≈± 0.02).
Road traverses were performed by supporting the PiSpec out of a car window and continuously acquiring GPS receiver (Adafruit Ultimate GPS breakout) geo-referenced spectra whilst driving under the plume on La Carretera a Masaya, located to the north east of the Santiago crater (see Figure 1). These measurements were made under rather rare conditions, with the plume blowing approximately north-north-east, making La Carretera a Masaya the optimal route for traverses; the prevailing wind direction is approximately from the east, as evidenced by the SO2 impacts on plant growth on the western side of the volcano. At times, overhanging trees may have interfered with the traverse spectra; however, we were careful to pause acquisitions when large regions of obstruction were encountered. In general, the quality of fitted SO2 spectra suggests that significant issues from trees were avoided. Plume speed, again, was estimated using visible video acquired shortly before we began the traverses, and using cross correlation. Traverse emission rates were then computed from the wind, GPS and spectral concentration data following the methodology outlined by McGonigle (2007).
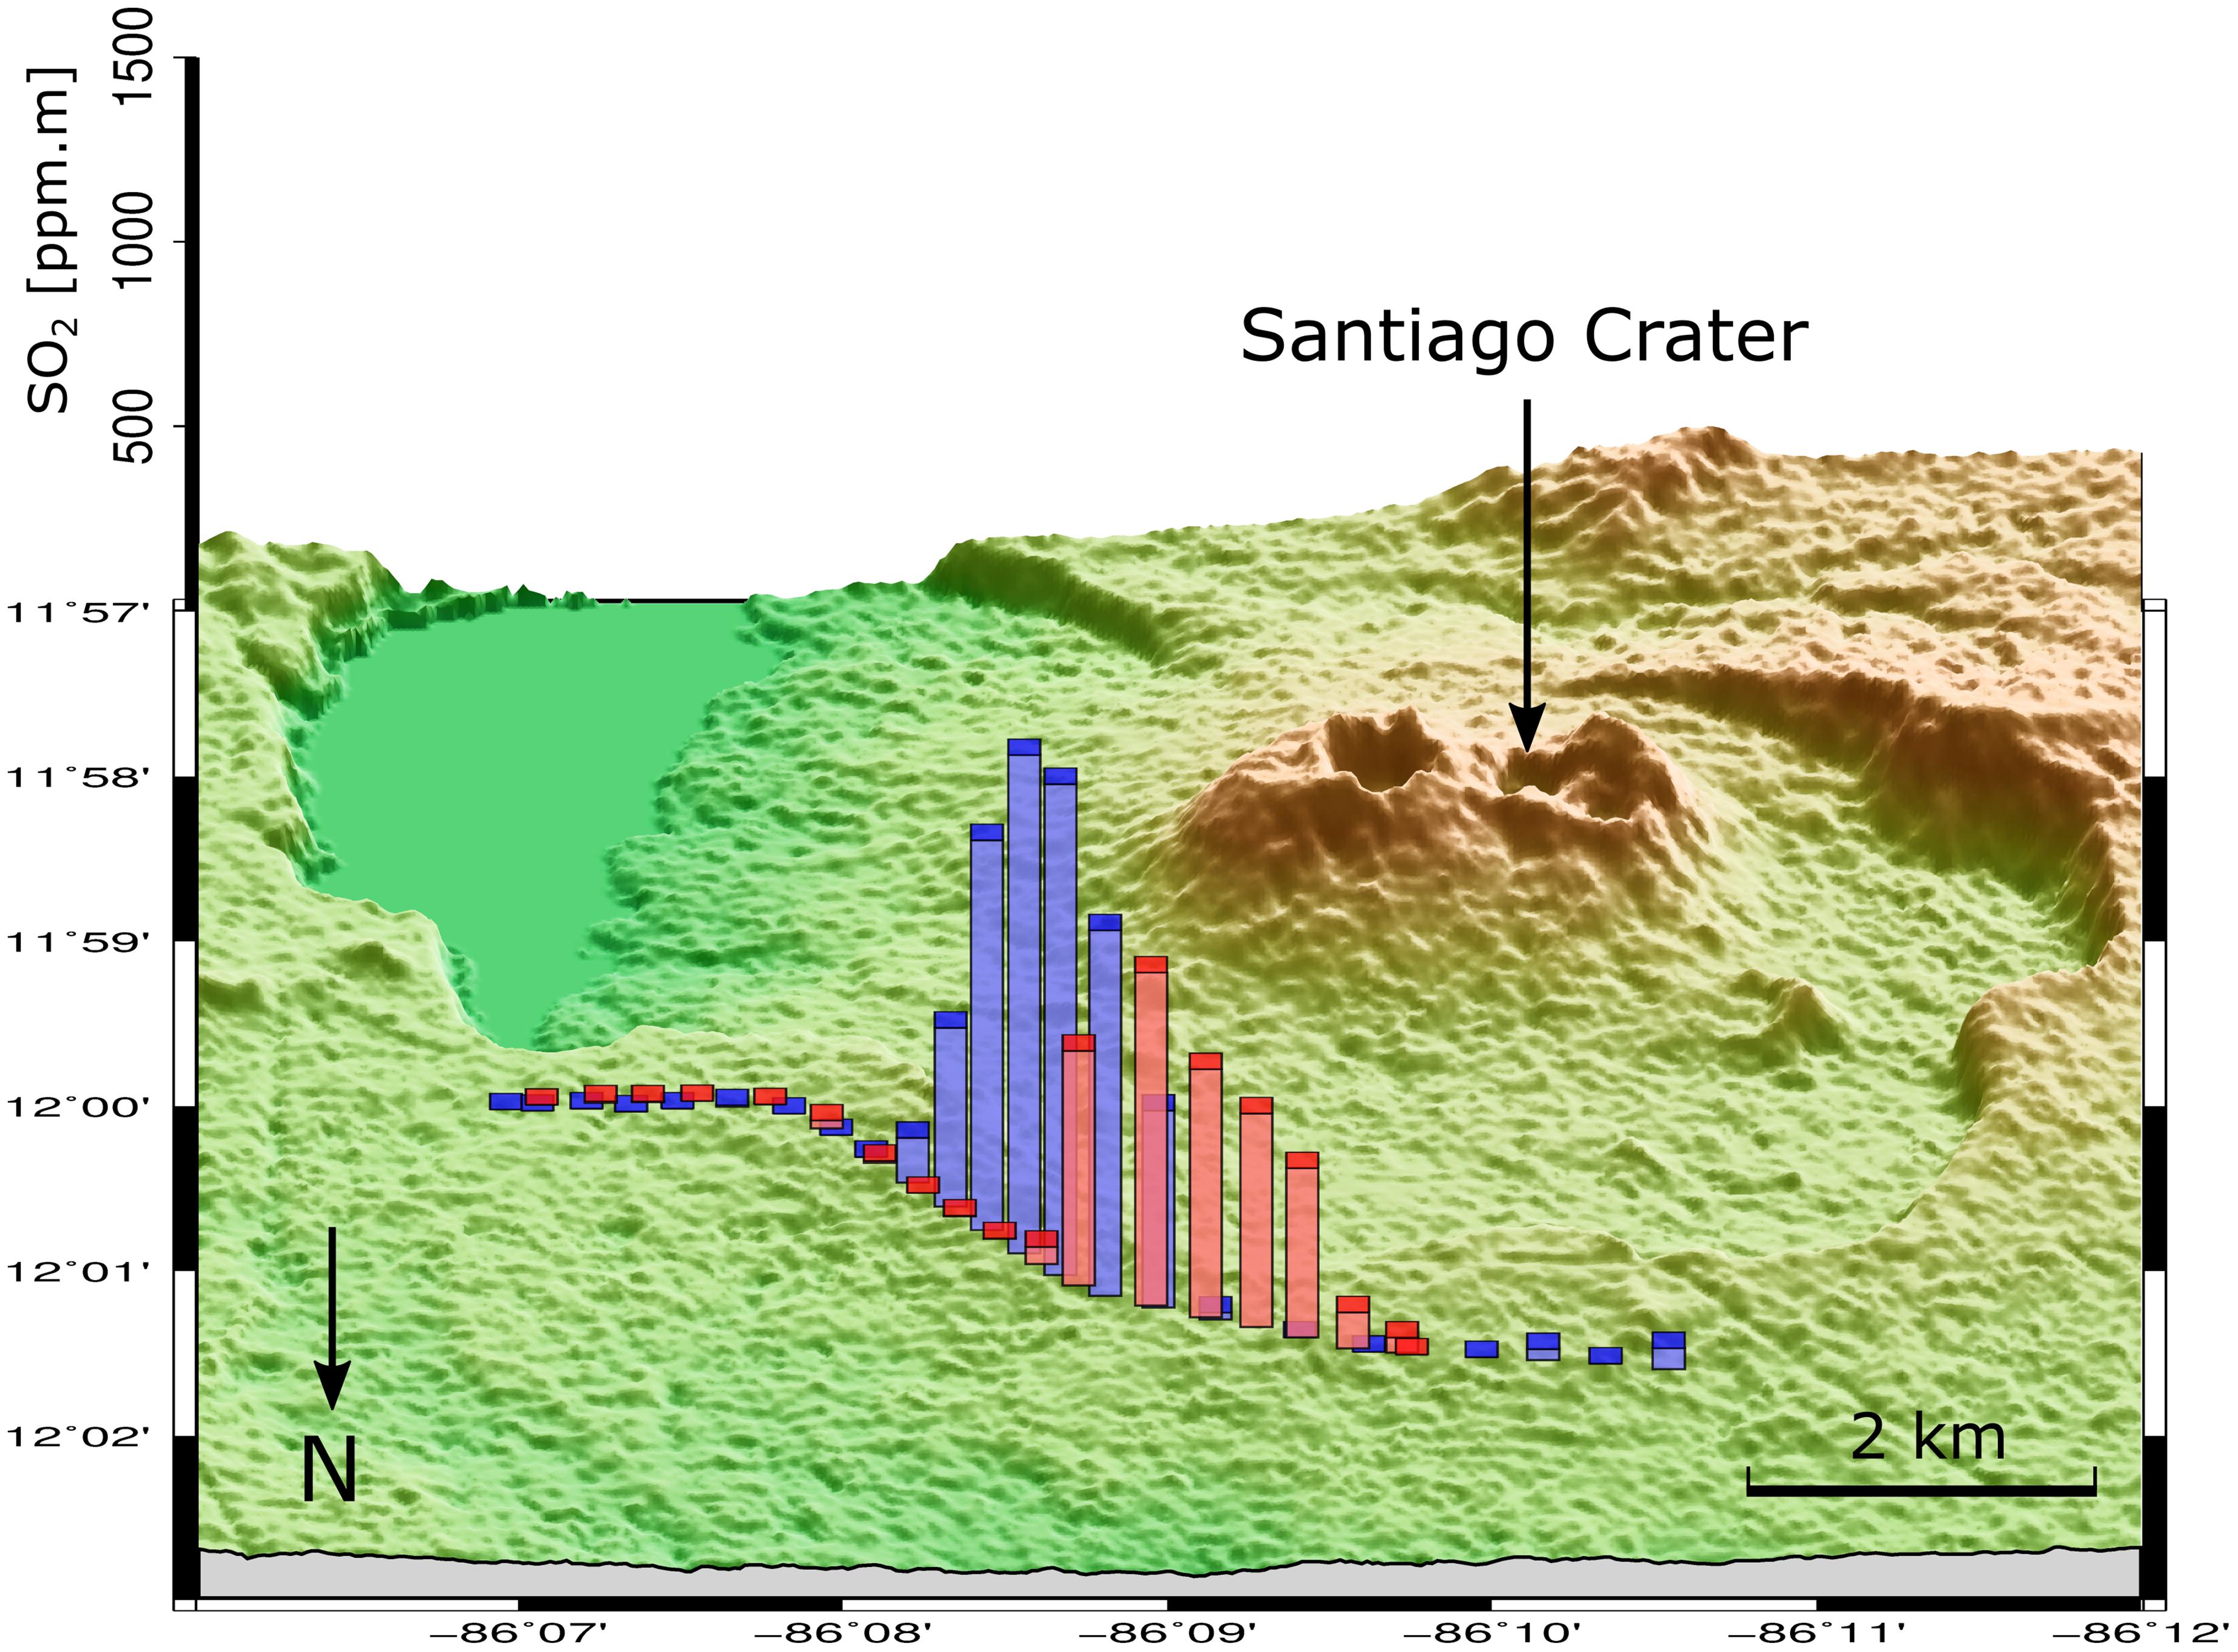
Figure 1. Traverse SO2 column densities (ppm ⋅ m) plotted in bars for two traverses started at 17:46:01 UTC (red) and 17:55:10 UTC (blue); emission rates were 16.3 and 27.2 kg s−1, respectively. Traverses were performed along La Carretera a Masaya. Base map topographic data retrieved from USGS (2018). Data for this figure, and all other figures in this manuscript, are available in Supplementary Data Sheet S1.
Results and Discussion
Comparison of the PiSpec With the USB2000
A number of commercial spectrometers are currently used for DOAS applications in volcanology. Although it has now been discontinued, the USB2000 (Ocean Optics) was once perhaps the most commonly used spectrometer (e.g., Galle et al., 2003; Mori et al., 2006; Kantzas et al., 2009; Bobrowski et al., 2010), and therefore provides a good benchmark to compare the PiSpec against. This instrument is also very similar to the USB2000+ and Flame-S spectrometers, the next generation versions of the USB2000, which are currently market available and frequently used today. Table 1 provides some useful features of these PiSpec, USB2000 and USB2000+ spectrometers, for comparison; the Flame-S specifications are very similar to that of the USB2000+, but the former instrument is manufactured with new techniques to improve thermal stability and reduce unit-to-unit variability. As may be expected, the Ocean Optics instruments have some advantages, such as a higher bit-depth (12-/16-bit for the USB2000/2000+ vs. 10-bit for the PiSpec) and, in this configuration, a greater spectral resolution (0.65 nm for the USB2000/2000+ vs. 1 nm for the PiSpec).
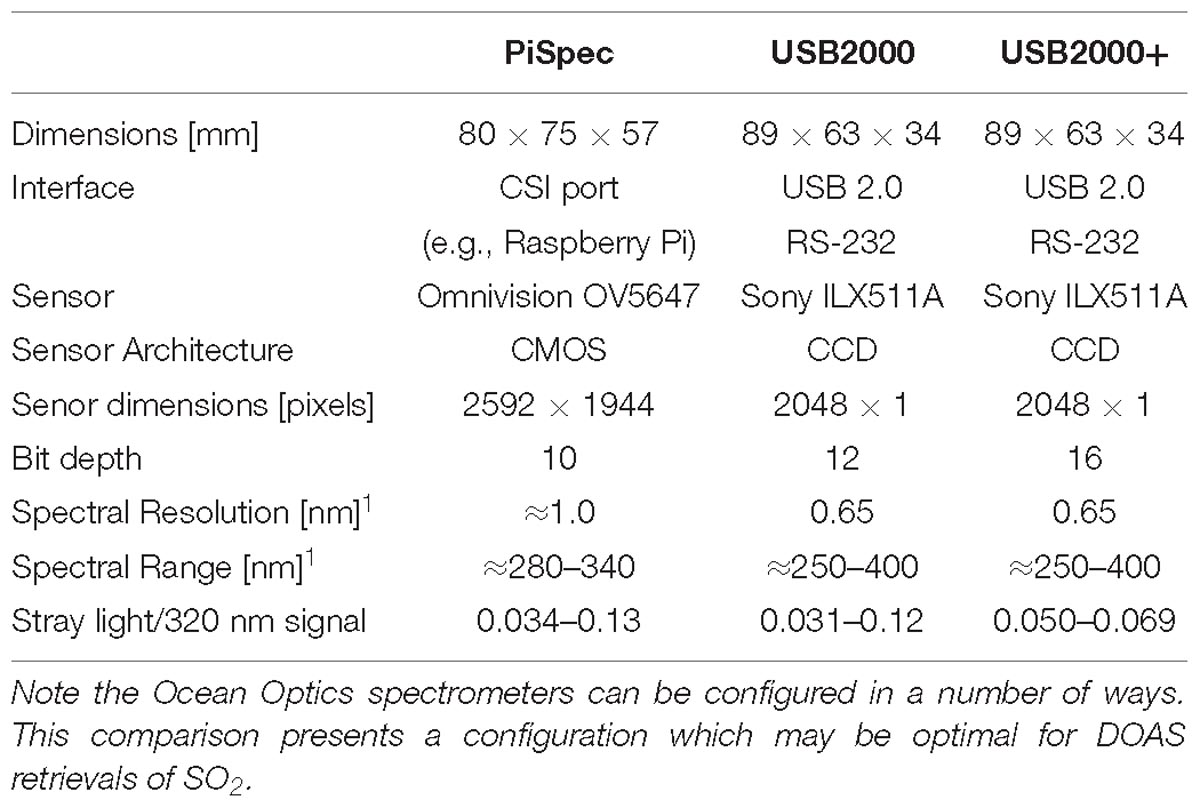
Table 1. A comparison of the PiSpec with the USB2000 and USB2000+ (Ocean Optics).
Contemporaneously acquired clear-sky spectra from both the PiSpec and USB2000 are displayed in Figure 2. Both spectra have been corrected for dark current by subtracting a dark spectrum, and the signals have been normalized to the peak at ≈330 nm to facilitate comparison. Prior to normalization, the 330 nm signals were 2147 and 487 for the USB2000 and PiSpec, respectively; for the 12- and 10-bit A/D converters, this corresponds to saturation of 52 and 48%, respectively. Shutter speeds of approximately 1.5 and 6 s were used in this case, for the USB2000 and PiSpec respectively, highlighting the greater sensitivity of the USB2000 device, as would be expected.
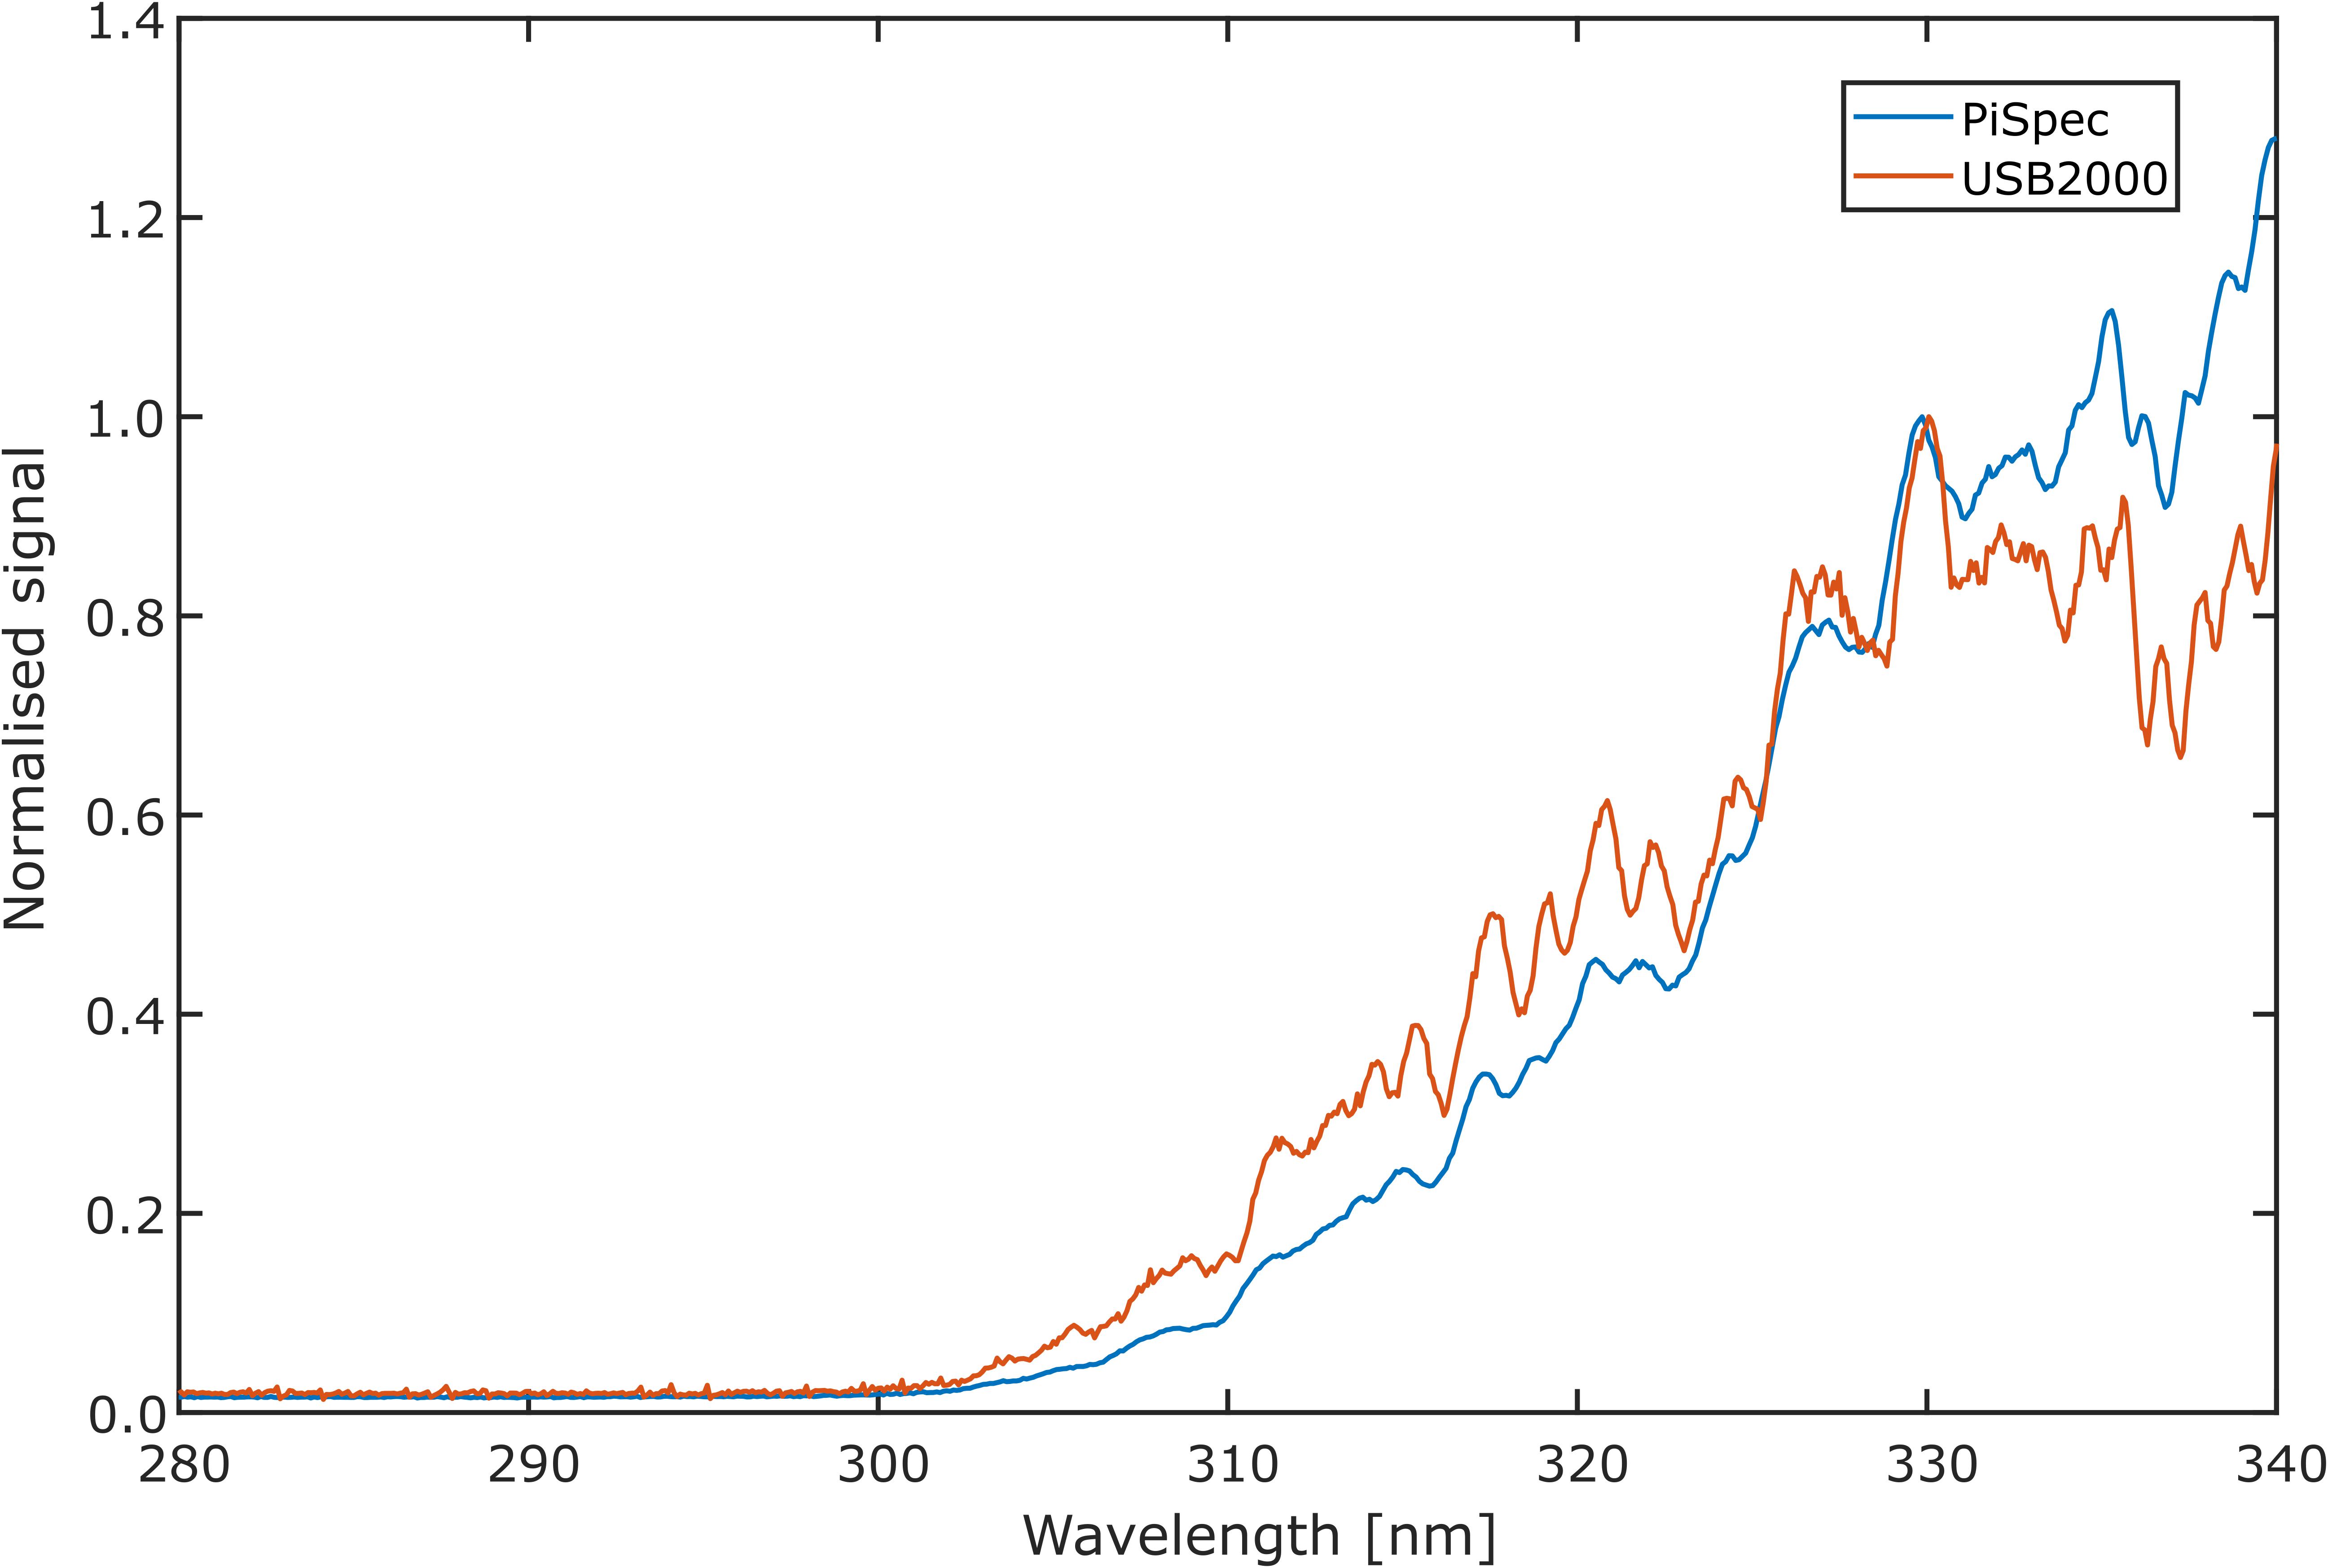
Figure 2. Clear sky spectra gathered by the PiSpec and USB2000. Both spectra have been dar-subtracted and then normalized to the peak at ≈330 nm. This peak was at 48 and 52% saturation for the PiSpec and USB2000, respectively.
In general, the spectra show similar features, although the peaks and troughs of the USB2000 spectrum are more pronounced than the PiSpec’s. This is in accordance with the smaller instrument line shape (ILS) of the USB2000, which will more precisely preserve the high frequency oscillations in sky intensity. Below 330 nm, the signal in the PiSpec drops off somewhat faster than the USB2000. It is likely that this is due to the detector in the USB2000 being coated with a UV fluorescent coating, to enhance its UV sensitivity by absorbing UV radiation and emitting visible light which is sensed at the detector.
From these spectra, the stray light was quantified following the method of Kantzas et al. (2009), by taking the ratio of stray light signal at approximately 290 nm to signal at 320 nm. Here, the stray light was quantified as 0.033 and 0.034 for the USB2000 and the PiSpec, respectively. These remarkably similar values are also toward the lower end of the range of values found by Kantzas et al. (2009), who investigated three USB2000s, two USB2000+s, one USB4000 and one Avantes B.V. Avaspec-2048-USB2. Values ranged between 0.012 (Avaspec) and 0.12 (one USB2000). On a separate occasion, the PiSpec stray light was quantified as 0.13 (Wilkes et al., 2017), which remains comparable to the upper end of the aforementioned commercial spectrometers.
Of particular pertinence to this work, some comparison of the PiSpec and USB2000 was made by Wilkes et al. (2017), where DOAS retrievals of quartz-filled SO2 cells were performed with both instruments. The analysis of sets of 10 spectra acquired by each instrument showed that both resulted in similar column density retrievals when measuring ≈300 and ≈1200 ppm ⋅ m gas cells: 304 ± 31 (±1 SD) and 1257 ± 58 ppm ⋅ m for the PiSpec; 296 ± 12 and 1184 ± 30 ppm ⋅ m for the USB2000. Shutter speeds of 6 and 1.5 s were used for the PiSpec and USB2000, respectively. Whilst the performance of the USB2000 was somewhat more consistent for each cell (smaller standard deviation), the PiSpec’s performance was still quite reasonable considering its lower price. From these tests, the maximum cell uncertainty for the PiSpec was ≈10%, for the cell with the lower of the two SO2 column densities. This value will be combined with the plume speed uncertainty to give a rough estimate of overall uncertainty in emission rate measurements presented in Section “Traverse and Scanning DOAS.”
Thermal Stability
Here, we discuss thermally induced changes in ILS and spectral calibration using the 313.150 nm emission line from the Hg-Ar lamp, in order to investigate the system robustness to variations in ambient conditions during field operations. This peak is located within typical fit windows for SO2 DOAS retrievals, which are generally somewhere in the 300–325 nm range. Our results suggest that the spectrometer calibration has a generally linear dependence on temperature across the considered range (Figure 3); however, a few notable deviations from this trend are also apparent. Firstly, there appears to be no change in peak location between 20 and 25°C. This may partly be a result of the pixel discretization of a continuous spectrum. There is, however, some change in line shape, in keeping with the general trend (see Figure 4). The second effect is apparent at the highest temperature measurements, ≈50°C. Here, there is a large shift in the peak, which jumps ≈1 nm from the 45°C spectrum. This notable displacement may be caused by a significant mechanical movement in one of the PiSpec’s components, for example, the detector, via some release mechanism activated above a particular threshold. The similarity in line shape between the 45 and 50°C would corroborate this argument (Figure 4). The detector and associated Pi Camera board is currently mounted to the spectrometer with nuts and bolts which may allow movement, especially under changing thermal conditions. Securing this part more stringently, with glue for instance, may prevent such issues, and it ought to be emphasized that the current hardware is very much a first version of this instrument. As we believe this issue to be independent of the general thermal stability characteristics of the spectrometer, we omit these data points from the regression analysis; we then also propose that above 45°C the PiSpec alignment may become unstable.
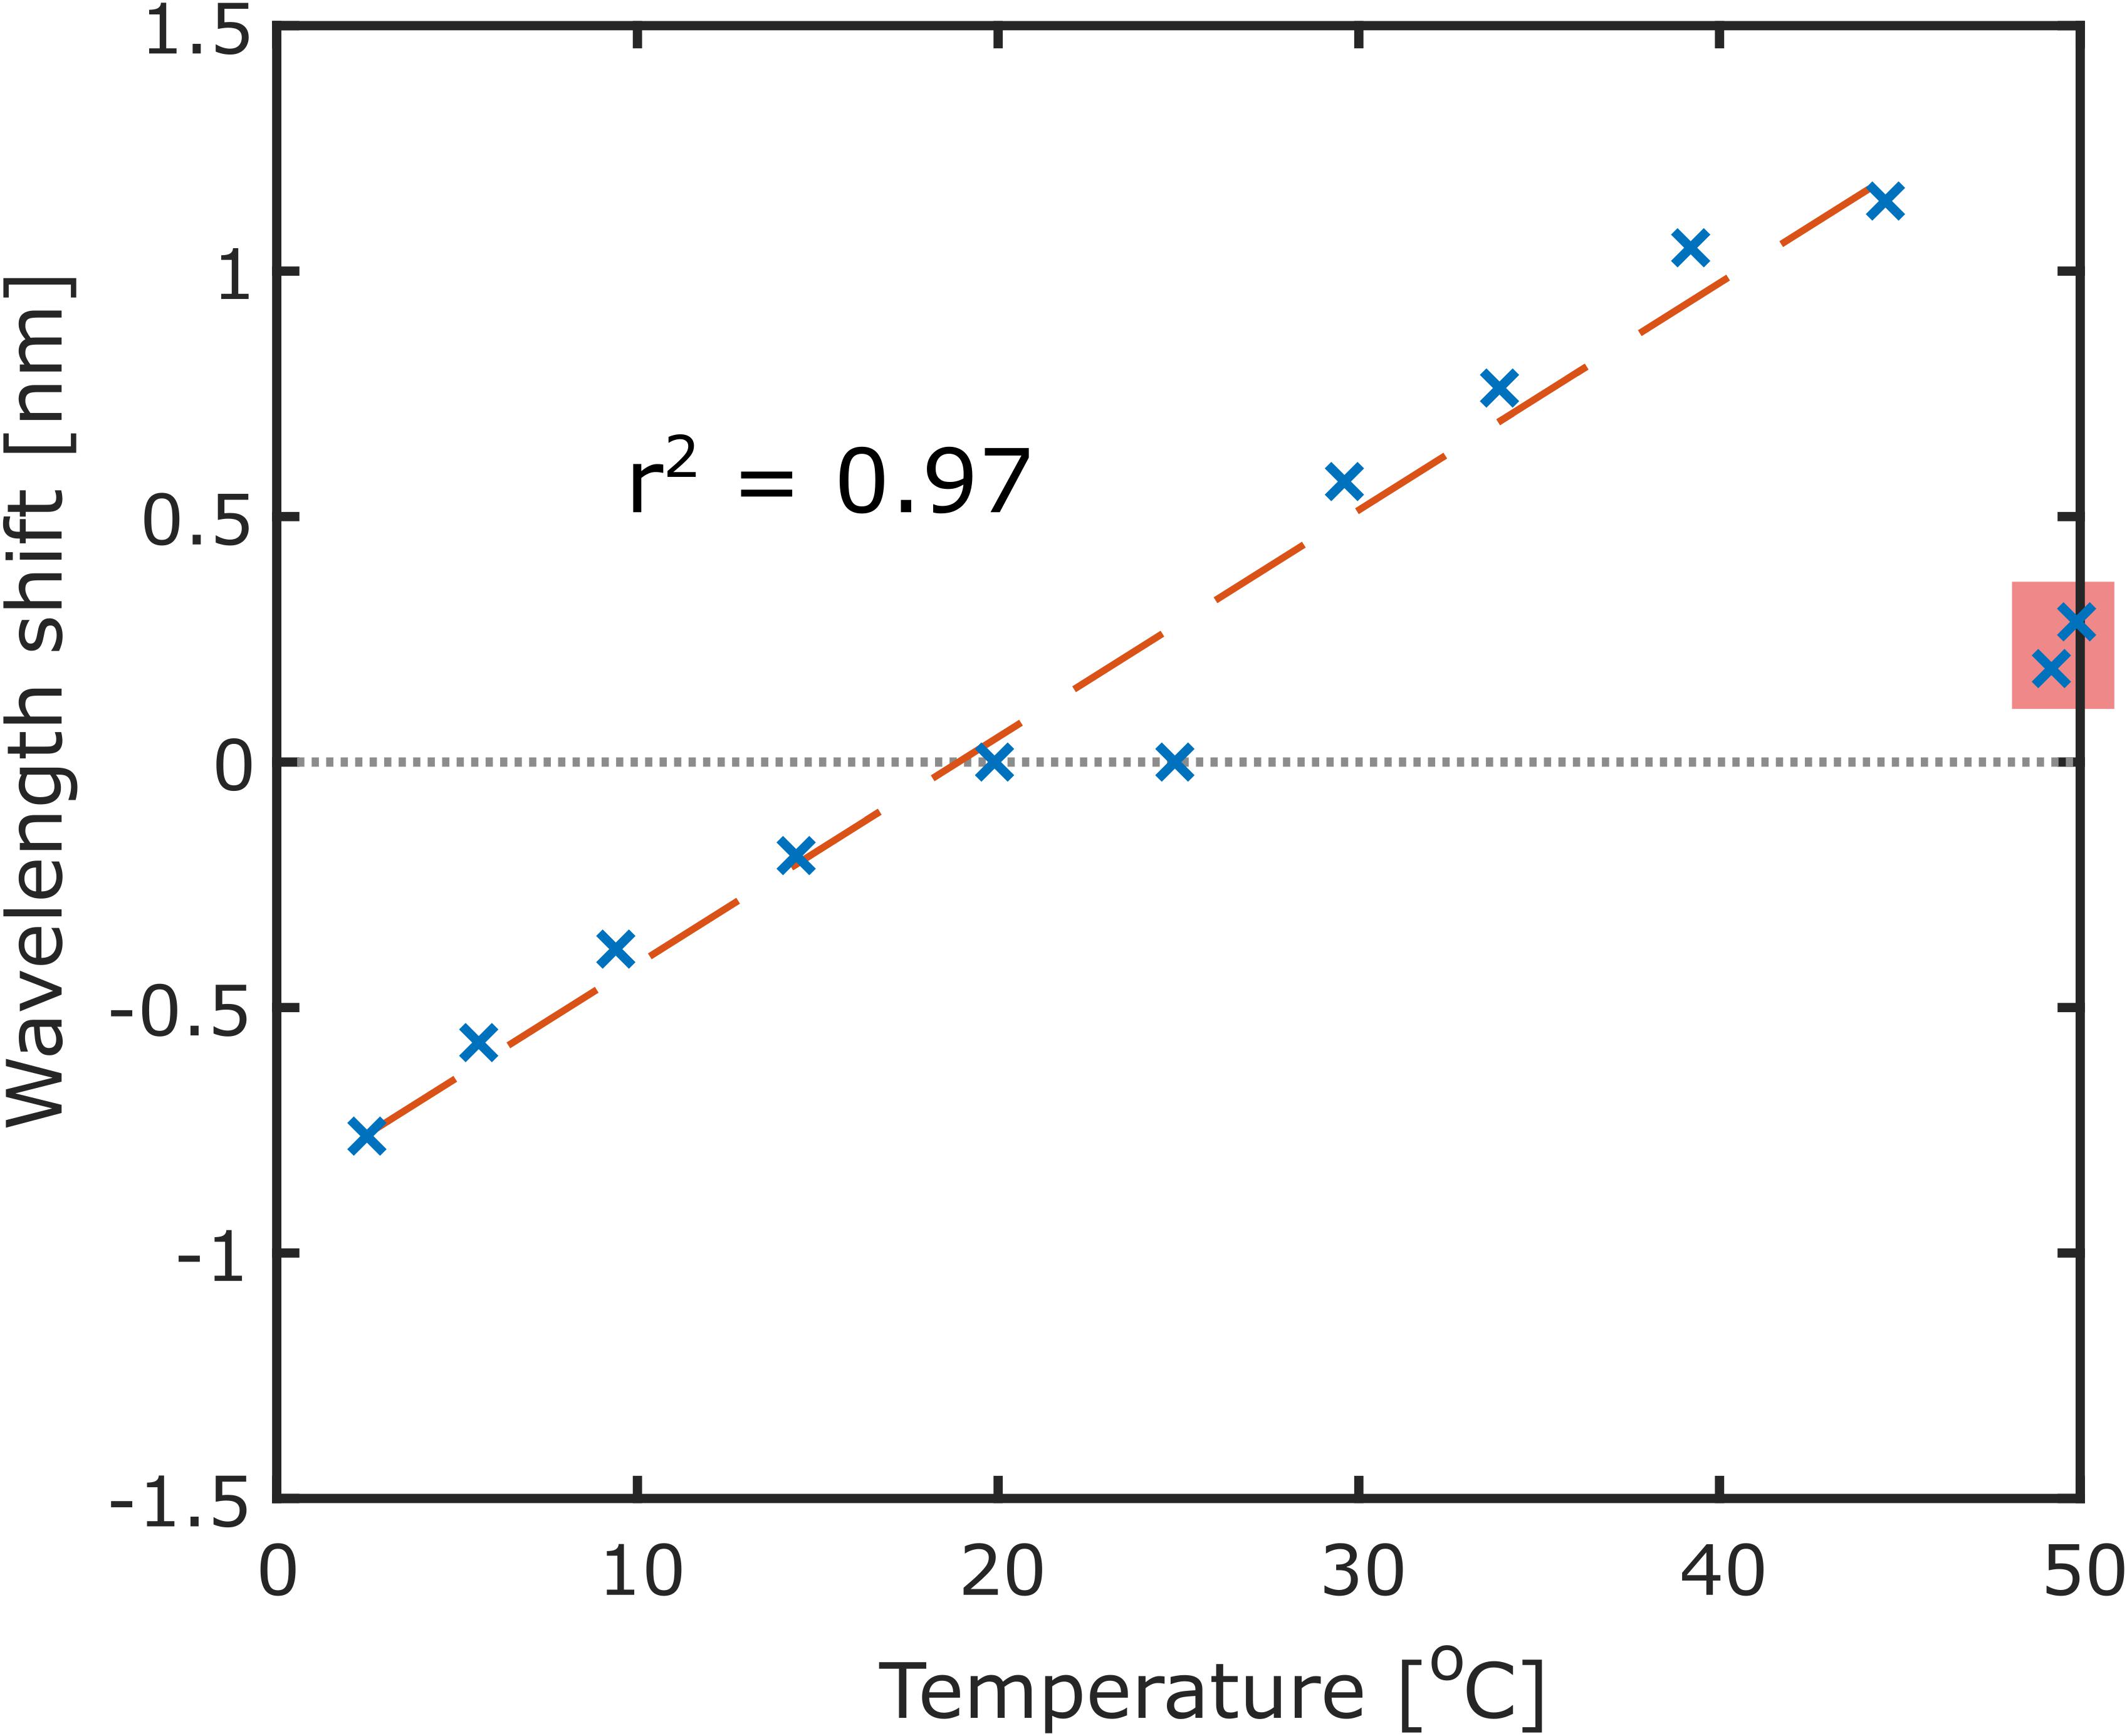
Figure 3. Thermal stability of the spectrometer displayed as wavelength change of the 313.155 nm mercury emission line with temperature. Shifts are shown relative to the peak location at 25°C. A linear regression model indicates a wavelength shift dependence of 0.046 nm/°C, with a good model fit of r2 = 0.97. The two high-temperature points, boxed in red, do not follow the linear trend, and may be caused by a larger scale shift in one of the optical components in the PiSpec. These data are not included in the regression analysis, since they are clearly associated with a different mechanism. Nevertheless, they should not be ignored, and suggest that at high temperatures > 45°C the PiSpec may begin to become unstable. In general, such high temperatures should be easily avoidable by keeping the instrument out of direct sunlight.
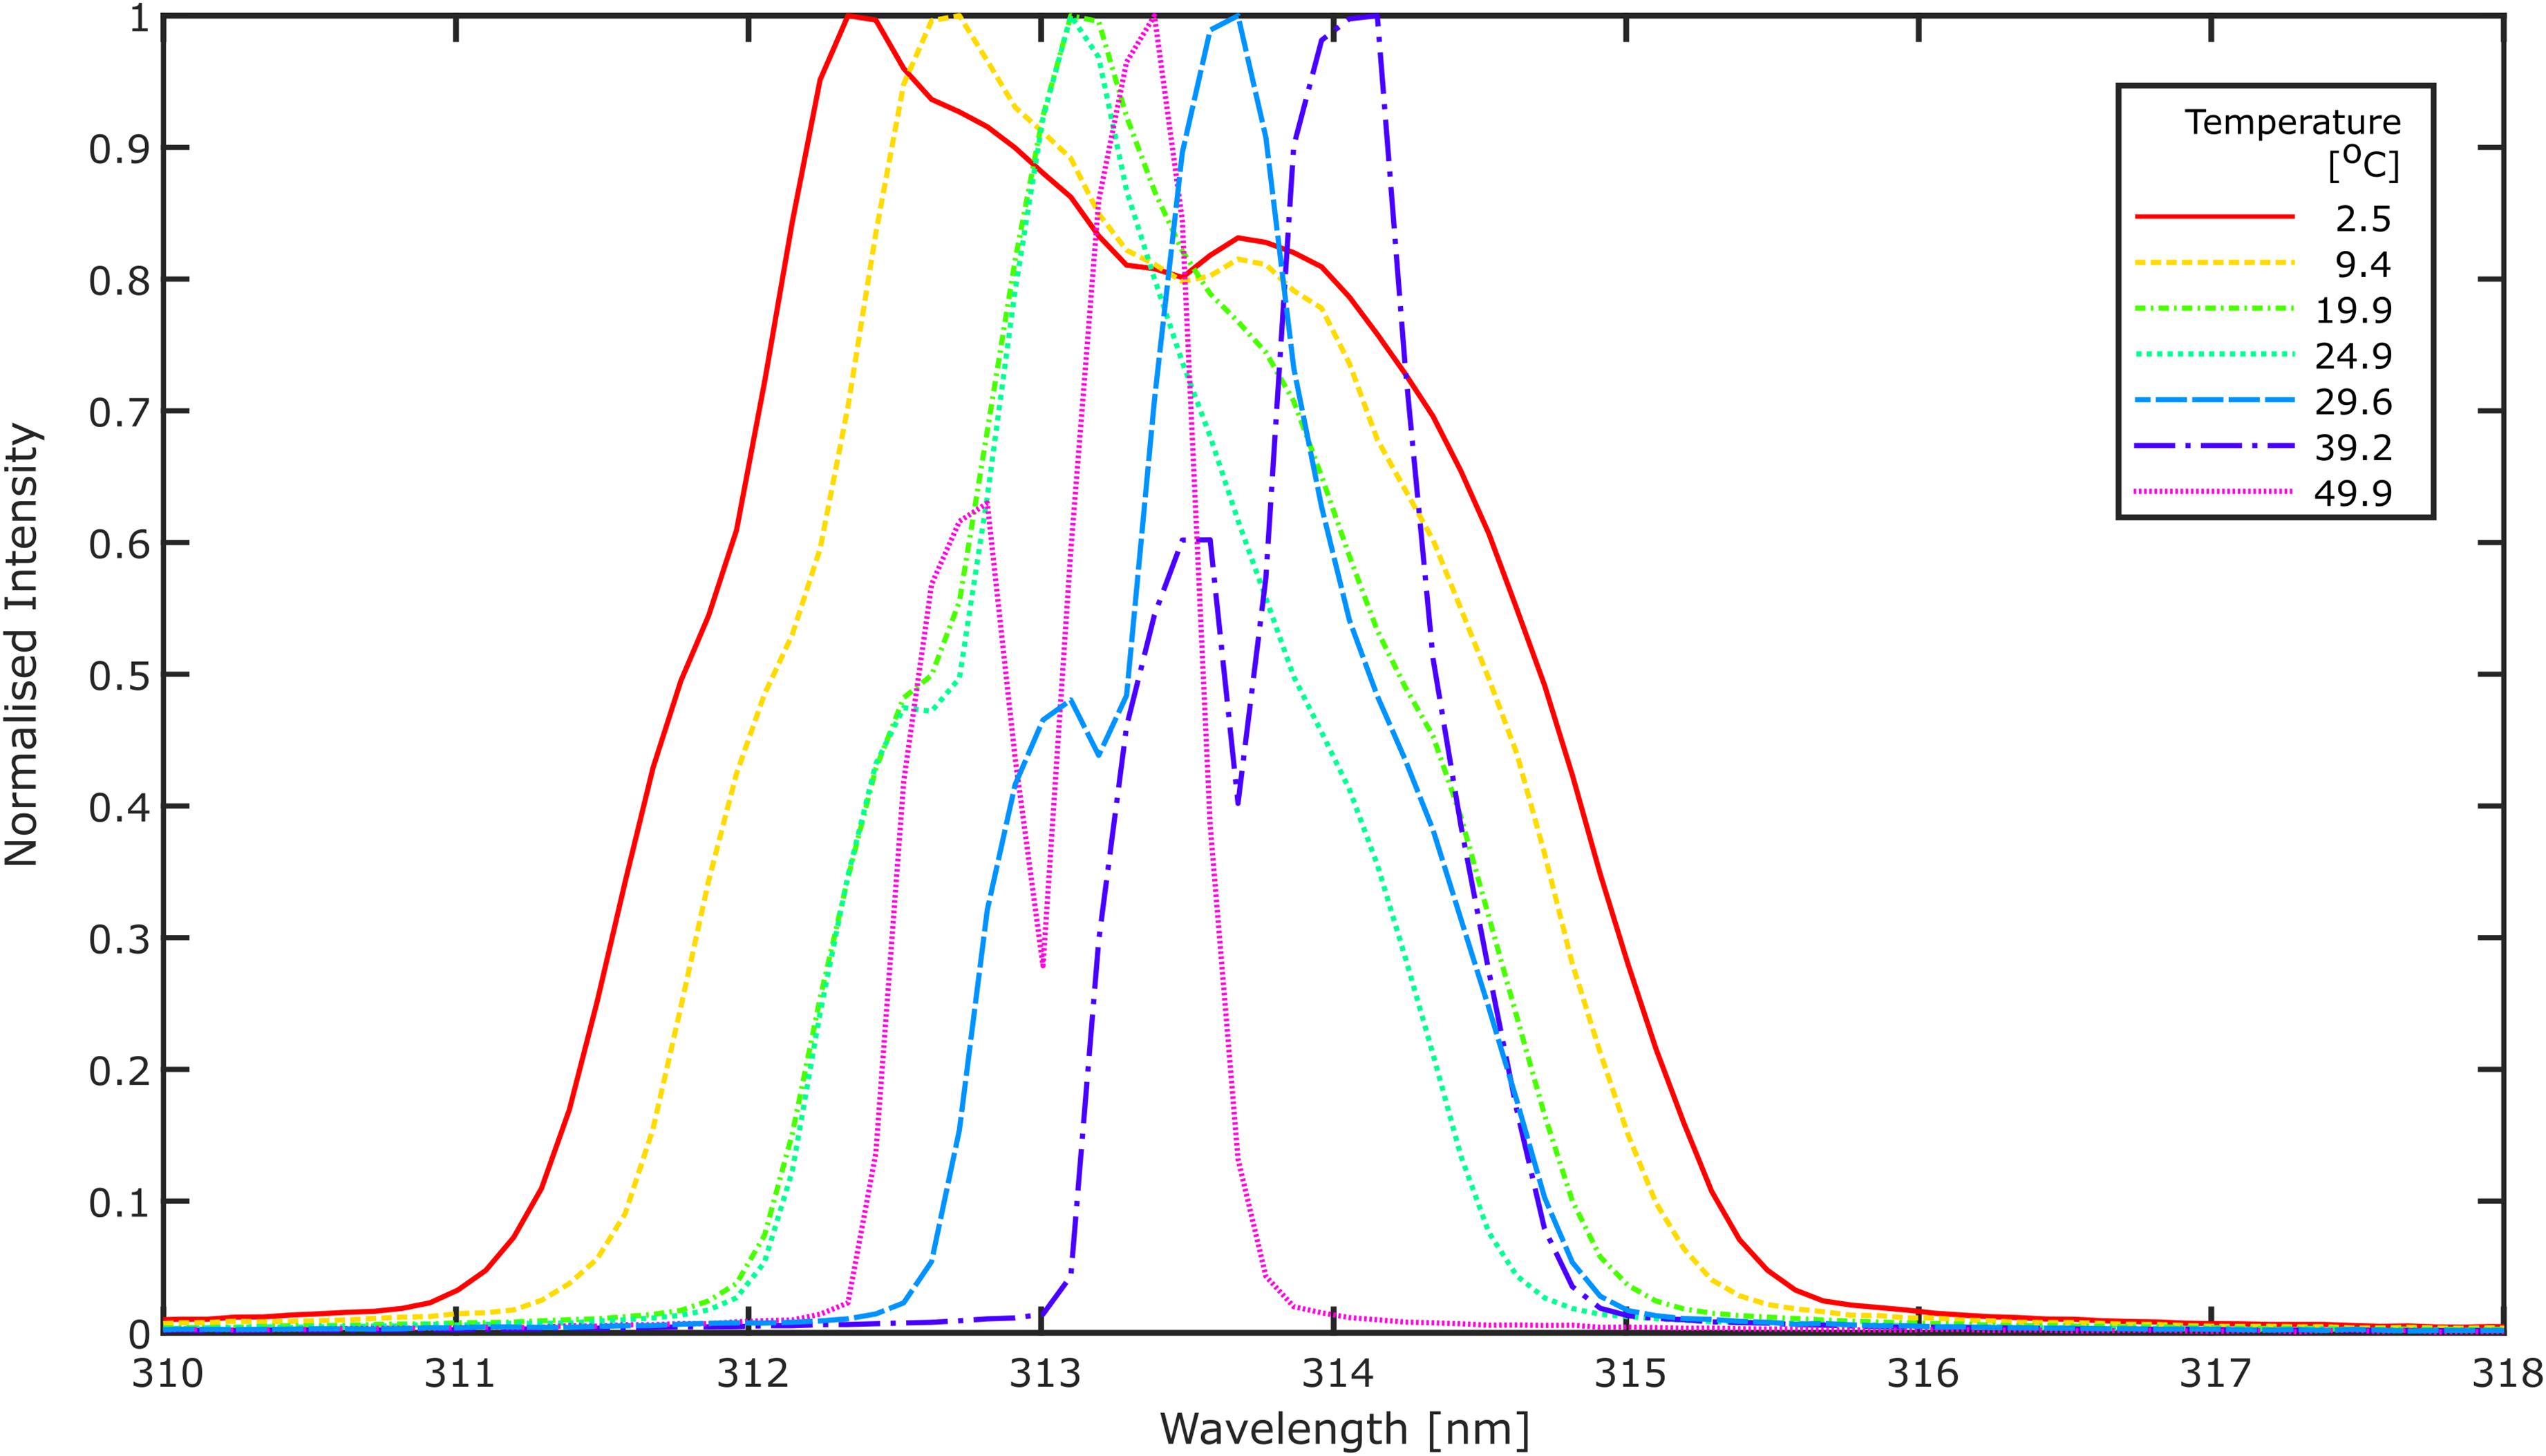
Figure 4. Normalized instrument line shapes for a number of temperatures displayed in Figure 3. At low temperatures the line shape becomes quite broad, possibly preventing DOAS retrievals from being performed. Toward higher temperatures a double peak begins to form.
The linear dependence, omitting the high temperature data as discussed above, indicates that the PiSpec displays wavelength shifts of ≈0.046 nm/°C (≈0.5 pixel/°C) between ≈2.5–45°C; the coefficient of determination, r2 = 0.97, indicates that this linear model fits the wavelength shifts well across this temperature range. This thermal stability is in extremely good agreement with shifts quoted by Platt and Stutz (2008) of 0.05 nm/°C for commercial spectrometers, indicating that in this sense there is no trade off in using this lower cost unit for these spectral measurements. In terms of pixel shifts, Platt and Stutz (2008) quote a typical value of 0.1 pixel/°C, which is lower than the 0.5 pixel/°C for the PiSpec. This should not impact the PiSpec’s performance, since the shift can be corrected for using software.
Thermal instabilities of spectrometers can also lead to a stretch or squeeze of spectra which goes beyond a simple linear shift of all wavelengths across the sensor (McGonigle, 2007; Platt and Stutz, 2008). To investigate this effect, widely separated emission lines (296.728 and 334.148 nm) were tracked through the spectra captured across the studied temperature range, and their separation in numbers of pixels were recorded. For all temperatures below 40°C these two peaks were separated by exactly 393 pixels, indicating that the peaks shifted simultaneously in the same direction. For the three spectra above 40°C the pixel separation moved to 392 pixels. Since each pixel in the PiSpec represents a 0.095 nm band, this squeeze in spectra remains relatively insignificant even at the quite extreme temperatures.
There is, however, a change in the ILS of the unit across this temperature range (see Figure 4). In particular, at cooler temperatures the PiSpec’s ILS is notably wider, with the spectral resolution, defined as the full-width-at-half-maximum of an emission line, increasing markedly. At 2.5°C this increases to 2.9 nm, which would likely be too broad to enable conventional SO2 DOAS measurements. At 25°C the spectral resolution measured here is ≈1.1 nm. An instrument with a broader ILS (lower spectral resolution) can have a lower sensitivity to SO2, especially when the ILS approaches the line width of the SO2 absorption structures, where response can also become non-linear (Frankenberg et al., 2005; Platt and Stutz, 2008). This is likely to be the case beyond a spectral resolution of ≈1 nm, therefore, a changing line shape induced by thermal instability could affect the PiSpec’s retrievals of SO2. Linearity/non-linearity is discussed in more detail in Section “Detection Limit and Linearity.”
Kantzas et al. (2009) show that the spectral resolution of commercial units (USB2000, Ocean Optics) is also impacted by changing ambient temperatures; however, the temperature range considered therein was not as extreme as that presented here. Another point made by Kantzas et al. (2009), is that the line widths and thermal responses vary between spectrometers, even for the same model, and we note that the same should be expected of the PiSpec; to date, only one PiSpec instrument has been built and tested.
As discussed by Platt and Stutz (2008), thermostating a spectrometer is the best means of preventing thermal instabilities from affecting DOAS retrievals. As with commercial spectrometers, here we highlight that the PiSpec would similarly benefit from such measures. Nevertheless, DOAS measurements with commercial instruments are frequently made without such controls in place, and our tests described later (see Traverse and Scanning DOAS) show that the PiSpec does appear to work adequately, at least within the range of conditions encountered in this study, without thermal stabilization. To some extent post processing of spectra, by wavelength shifting and squeezing/stretching the differential optical density array such that it better fits the SO2 reference spectrum, can account for calibration error caused by thermal instability, as can measurements of gas cells containing known column amounts of SO2, and/or regular calibration with mercury lamps under the conditions encountered in the field. However, the change in ILS is more difficult to correct for, unless the change is well characterized. Inspecting the changes in ILS in Figure 4, we may, therefore, suggest that the PiSpec could function acceptably within ≈± 5°C of its calibration temperature; although this will still result in some error in retrieved column densities, as discussed earlier. Meroni et al. (2010) present a method for calibrating spectrometers using Fraunhofer lines and atmospheric absorption features, therefore providing a possible means of recalibration without the need for a calibration lamp in the field. In general, whilst short term deployments, such as the scans and traverses presented herein, are unlikely to be significantly affected by changing temperatures, permanent DOAS installations for automated monitoring can be subject to considerable changes in temperatures both on daily and seasonal timescales. As such, permanent installations with the PiSpec, as with commercial spectrometers, should consider measures to prevent or compensate for thermal instabilities in the instrumentation.
Traverse and Scanning DOAS
Seven spectrometer scans (Table 2) were performed on the Santiago crater rim. A typical scan and example DOAS retrieval are displayed in Figure 5. The estimated plume rise speed of 3.9 ± 0.8 m s−1, obtained through cross-correlation, resulted in emission rates of between 3.2 ± 0.7 and 7.3 ± 1.7 kg s−1, with a mean of 5.1 kg s−1. Within these scans, column densities of up to ≈2000 ppm ⋅ m SO2 were measured. SO2 emission rates from six road traverses ranged between 11.3 ± 1.9 and 45.6 ± 7.6 kg s−1 (Figure 1 shows two typical traverses); the mean traverse rate was 23.1 kg s−1. In this case, a plume speed of 5.3 ± 0.7 m s−1 was estimated, again from video imagery. Considering both the scan and traverse data, our mean recorded emission rate was 13.4 ± 12.3 kg s−1 (±1 standard deviation).
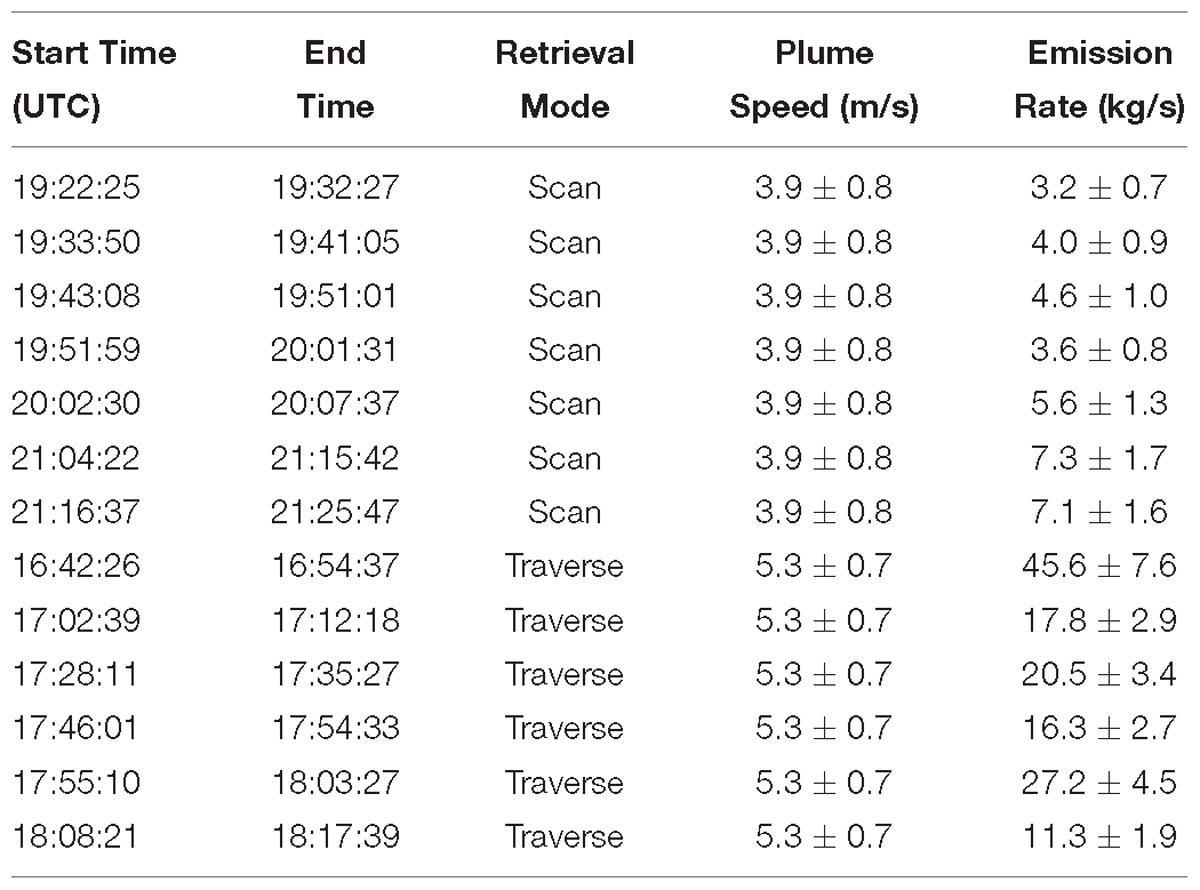
Table 2. A summary of scan and traverse emission rates measured with the PiSpec.
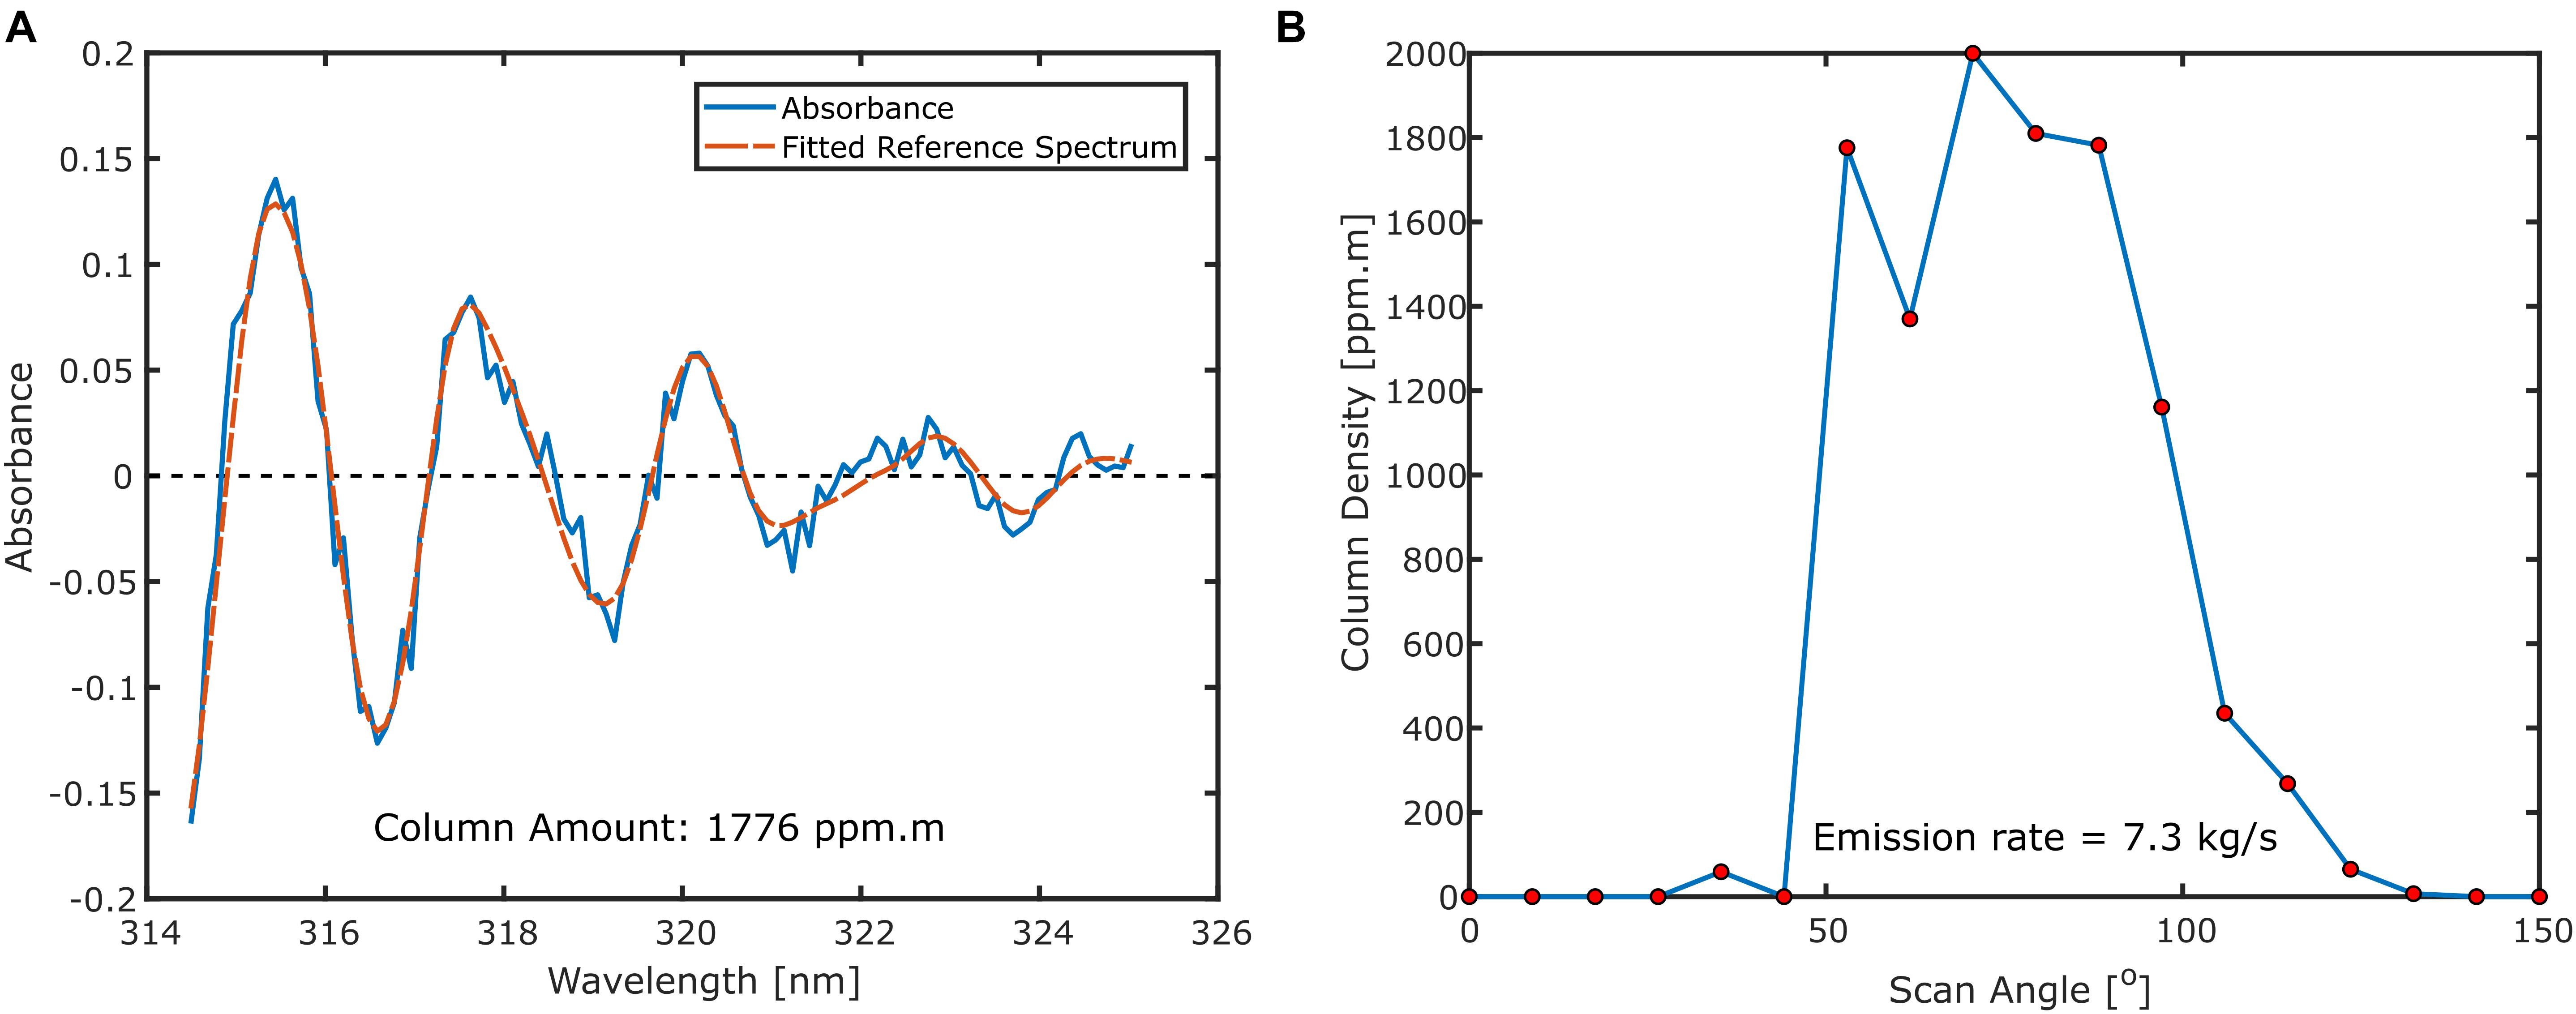
Figure 5. (A) Example DOAS retrieval (fit window of 314.5–325 nm) from the scan presented in (B). (B) A full PiSpec scan taken from the Santiago crater rim between 21:04 UTC and 21:15 UTC, on 14th June 2017. The resulting emission rate computed from the scan was 7.3 kg s−1.
Other available data to compare our emission rates against come from Aiuppa et al. (2018) and Stix et al. (2018). The former data are derived from the NOVAC network scanning spectrometers in the period 19/07/2016–01/03/2017, and range widely from ≈0–50 kg s−1; however, most emission rates are below 25 kg s−1. The mean emission rate is 7.9 ± 3.5 kg s−1 (±1 standard deviation), with significant day to day variability in this period and no clear overall trend over this timescale. The work of Stix et al. (2018) implemented a drone-mounted DOAS system (DROAS) for traversing the Masaya plume between 04/05/2017 and 06/04/2017. Their measured fluxes ranged between 15 and 22 kg s−1, with a mean of 18 kg s−1. These measurements, which were made closer to the time of the work presented herein, are significantly higher than those of Aiuppa et al. (2018) on average, although they are comfortably within the extremes presented by the latter.
In general, our data are commensurate with the above fluxes from other authors, which were captured in the same activity period, in which Masaya’s crater contained the lava lake. Notwithstanding the potential for changes in degassing between the three observation periods, the datasets do compare rather favorably, with all bar two of our fluxes falling within the range 0–25 kg s−1, which encompassed the majority of the Aiuppa et al. (2018) fluxes; all emission rates herein fall below their quoted maximum flux of 50 kg s−1 in this interval. Our traverse values are also in quite good agreement with the traverses of Stix et al. (2018), with mean values of 23 and 18 kg s−1, respectively.
Our scan data correspond to the quoted Aiuppa et al. (2018) fluxes rather better than the traverse data, with 4 of 7 scans falling within one standard deviation of their quoted mean; the further 3 are comfortably within 2 standard deviations. This might be expected given the comparison of scan to scan data, however, pushing this comparison further is perhaps tenuous in the sense that the scan orientations are rather different, e.g., the NOVAC scans are from a rather different vantage point; there is also the difference in the acquisition period. Our scan emission rates are rather lower than those from the traverse observations, which might be simply a manifestation of considerable and rapid (timescales of hours to days) variation in emission rate from the volcano, which is also apparent in the NOVAC fluxes reported in Aiuppa et al. (2018). The traverse data are more commensurate with the traverses of Stix et al. (2018), with both datasets containing notably larger average fluxes than the average of scans presented in Aiuppa et al. (2018). Recently, de Moor et al. (2017) also found that a scanning-DOAS system systematically retrieved lower SO2 fluxes than traverses when studying emissions from Turrialba in Costa Rica. It is not clear whether this is simply coincidental or whether it is caused by fundamental differences in how the scan/traverse retrieval modes are performed and processed. In their Supplementary Information, de Moor et al. (2017) provide a good discussion of possible causes for discrepancies, such as ash on the optics or sub-optimal scanning position; for a permanent station the latter is of course impossible to always prevent since wind direction is changeable. Some systematic over-/under-estimation in our data may also come from the plume speed scalar, since all scan emission rates are derived from a single plume speed and, likewise, all traverse emission rates are derived from a separate single plume speed. Any error in this calculated speed will therefore be propagated through all emission rates of that retrieval mode.
In concordance with our earlier vindication of the capacity of the PiSpec to accurately constrain cell SO2 column amounts, via comparison with a USB2000 spectrometer (Wilkes et al., 2017), we suggest that the comparisons with NOVAC and DROAS data demonstrate the capability of the PiSpec to accurately retrieve volcanic SO2 emission rates. Following the substantial contribution to volcano monitoring and research made by the NOVAC project in recent years (e.g., Galle et al., 2010; Lübcke et al., 2014; Granieri et al., 2015; Hidalgo et al., 2015; Dingwell et al., 2016; Aiuppa et al., 2018), we suggest that the low-cost self-built PiSpec could augment efforts to assess and mitigate volcanic hazards globally, by enabling further dissemination of DOAS measurement systems on active volcanoes.
Due to the relatively modest UV sensitivity of the low-cost PiSpec sensor, as we highlighted in Wilkes et al. (2017), relatively long shutter speeds are required to provide the high SNR required for sensitive DOAS measurements. In the case of these scans and traverses, shutter speeds of up to 6 s were used when the unit was fitted with the 30 μm slit. This, coupled with apparently large overheads in the camera module’s image capture, means that acquisition and transfer of each spectrum took ≈30–40 s. Whilst there is likely to be a software fix for this issue, at present this means that a scan takes some ≈10 min to complete. This current performance would preclude the PiSpec from being used for high time resolution (≈1 Hz) applications, such as that presented by McGonigle et al. (2009) for integration of SO2 fluxes with other high time resolution geophysical data. Traverse temporal durations are unaffected by this issue, but it will act to reduce the spatial resolution in comparison with what could be achieved with a commercial spectrometer, for a given traverse speed.
One hardware solution to capturing spectra faster is to implement a larger 50 μm slit aperture, which allowed shutter speeds to be reduced from 4.5–6.0 s to 2.5–4.0 s, with a considerable reduction in acquisition rate (capturing every 15–20 s). This configuration was implemented in the final three traverses of the day. Both instrument setups measured similar emission rates, with no trend of over- or under-estimation for the larger aperture; this suggests that, at least in this context, the larger aperture configuration is a suitable solution to this issue. A further approach could be to co-add more rows of the sensor, e.g., essentially co-adding spectra, which could also result in significant increases in SNR, and hence the prospect to obtain higher acquisition rates by reducing shutter speeds (Wilkes et al., 2017). Such improvements to this system should be investigated further in the future.
Detection Limit and Linearity
Many volcanoes emit much smaller quantities of SO2 than those measured here on Masaya volcano, whilst others can emit far more. It is therefore important that DOAS instruments are able to detect low column densities of SO2 accurately, with a high SNR, and that the DOAS retrieval remains linear for higher column densities. Here we provide a quantitative assessment of the PiSpec’s performance for detection of both low and high column densities of SO2.
As with other spectrometers, the PiSpec’s ability to resolve SO2 will depend on the measurement conditions and acquisition settings. This is highlighted by Figure 6, which displays retrievals of relatively low column densities (86 and 112 ppm ⋅ m) from a PiSpec traverse (Figure 6A) and scan (Figure 6B) captured during the Masaya campaign. The scan retrieval shows much noisier absorbances, which is a result of lower signal during these measurements. The clear sky spectrum associated with this scan had a DN of just 50 at 311 nm, whilst the DN of the traverse clear spectrum was 326 at 311 nm. The latter will have a considerably larger SNR, which is preserved in the absorbance spectrum. Both spectra were acquired at the upper limit of the PiSpec’s shutter speed range, i.e., with 6 s exposures; therefore, the lower signal in the scan could be caused by the time of day (≈3 pm local for the scan vs. ≈11 am for the traverse), different sky conditions between these acquisition periods, and/or different viewing orientations.
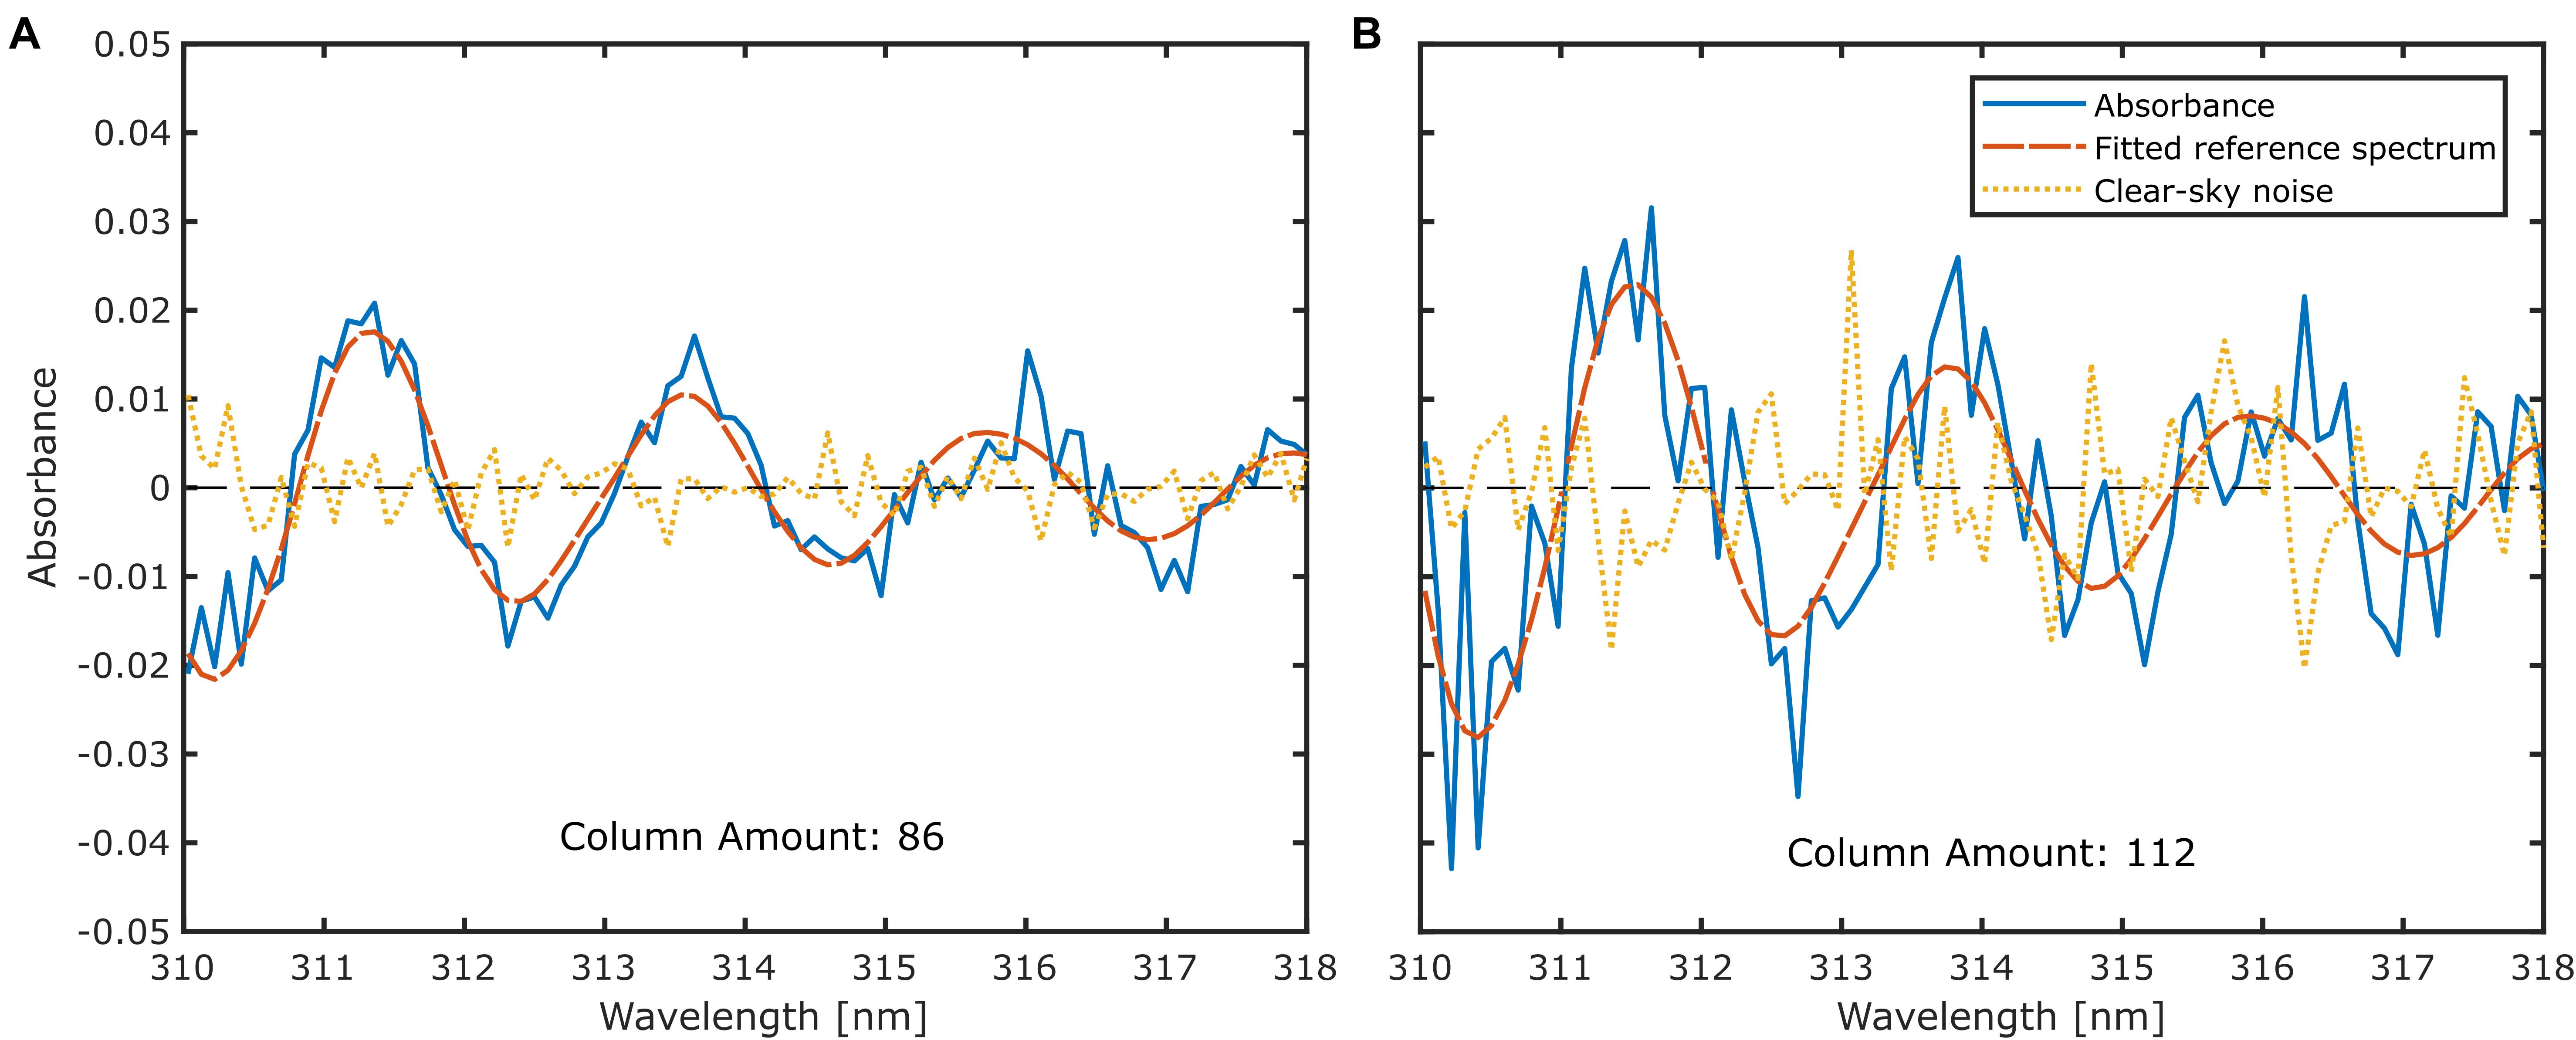
Figure 6. Relatively low column density DOAS fits for (A) traverse and (B) scan modes on Masaya volcano. Also shown are noise spectra generated using a second clear-sky spectrum as I(λ), as opposed to an in-plume spectrum (see Equation 1). Differences in noise levels results from different viewing geometries and conditions for the traverse and scan measurements.
More exact determination of the instrument’s detection limit was performed by analyzing the noise in an absorbance spectrum generated from two clear-sky images. Following Stutz and Platt (1996), an estimation of the detection limit can be made with:
where σ is the standard deviation of an absorbance spectrum generated from two spectra containing no absorbing species and n is the number of pixels in the spectrum. is the detection limit of the average optical density, which itself is defined by Stutz and Platt as three times the standard deviation of the reference spectrum; it provides a measure of the absorption strength of a given spectrum. It should be noted that the detection limit presented here is somewhat simplified; a much more complex procedure is discussed by Stutz and Platt (1996) and Platt and Stutz (2008), however, this simplified algorithm has been shown to provide a relatively accurate estimation (within 10–20% of the more complex method).
From clear sky spectra acquired in Masaya on the end of a traverse sequence, the absorbance noise σ was 3.10 × 10⁻³. In a fitting window of 85 pixels, such as that used in the DOAS fits in Figure 6, this noise corresponds to a detection limit of 2.03 × 10⁻³. In the presence of residual structures, from unknown gas species or the instrument itself, the detection limit must be scaled by a correction factor of 3–4 (Platt and Stutz, 2008). Here, we conservatively use 4, therefore, the average optical density detection limit is 8.11 × 10⁻³. The resulting column density detection limit is 26 ppm ⋅ m SO2. Following the same methodology for the scan associated with Figure 6B, a detection limit of 50 ppm ⋅ m was estimated. As can be seen, these values are case-specific and it is not possible to generate a single detection limit for the PiSpec instrument for all scenarios. Indeed, will depend on field conditions, PiSpec acquisition settings and the DOAS fitting procedure. Nevertheless, the conservative detection limits presented here are quite reasonable.
The detection limits are an order of magnitude larger than the 2.5 ppm ⋅ m quoted by Galle et al. (2003) for a mini-DOAS instrument; however, it is not clear how they have defined the limit in their work. The limits discussed for the PiSpec are quite conservative, since they include a factor of four increase in associated with the potential presence of residual structures in the spectra, following Platt and Stutz (2008). Omitting this factor, the detection limit for the traverse discussed above would be 6.5 ppm ⋅ m, which is quite similar to the mini-DOAS. We suggest, however, that the more conservative estimate, 26 ppm ⋅ m in this case, is likely to be more realistic. This general picture of the PiSpec providing a somewhat reduced performance in terms of resolving gas column densities is also borne out in the prior work of Wilkes et al. (2017), which is discussed in Section 3.1. Therein a series of 10 measurements of gas cells were made, with both a USB2000 and PiSpec unit, and the standard deviations of the retrieved column densities were assessed. In this case, the variability in gas column densities from the USB2000 was typically a factor of two below that of the PiSpec. This was for instrument integration times of 1.5 and 6 s for the USB2000 and PiSpec, respectively, which provided very similar levels of detector saturation at 330 nm (52 and 48%, respectively).
Conversely, at large column densities DOAS retrievals can become non-linear due to the spectral resolution of the spectrometer not perfectly resolving high frequency variations in the SO2 absorption cross-section, and due to the fact that the natural logarithm and convolution with the ILS are not commutative operations (Frankenberg et al., 2005; Wenig et al., 2005; Bobrowski et al., 2010). Linearity of PiSpec DOAS retrievals was assessed by modeling the instrument response following Wagner et al. (2003) and Kern et al. (2017). First a column density of SO2 was assumed. This was used to generate an absorption spectrum through the Beer-Lambert law and use of a high resolution absorption cross-section from Vandaele et al. (2009). This absorption spectrum was convolved with the PiSpec ILS and the natural logarithm taken; the resultant spectrum was then down-sampled to the pixel resolution of the PiSpec. Finally, a typical DOAS fit procedure was applied to this spectrum, using the ILS-convolved high resolution absorption cross-section spectrum.
The results of this model are displayed in Figure 7, run for column densities of 0–10000 ppm ⋅ m, in 1000 ppm ⋅ m increments, and for a fit window of 314–324 nm. Up to 4000 ppm ⋅ m the fit is extremely linear, producing a retrieval of 3957 ppm ⋅ m for a true SO2 column density of 4000 ppm ⋅ m. This indicates that for the majority of volcanic applications the PiSpec will perform linearly. In particular, all PiSpec measurements made on Masaya were comfortably within this extremely linear response interval. Since non-linearity becomes more pronounced at higher optical densities, shifting to longer wavelengths, where SO2 is less strongly absorbing, is one method which could account for this saturation effect where necessary (Bobrowski et al., 2010); alternatively, the modeled response can be used to correct retrievals (Wagner et al., 2003; Kern et al., 2017).
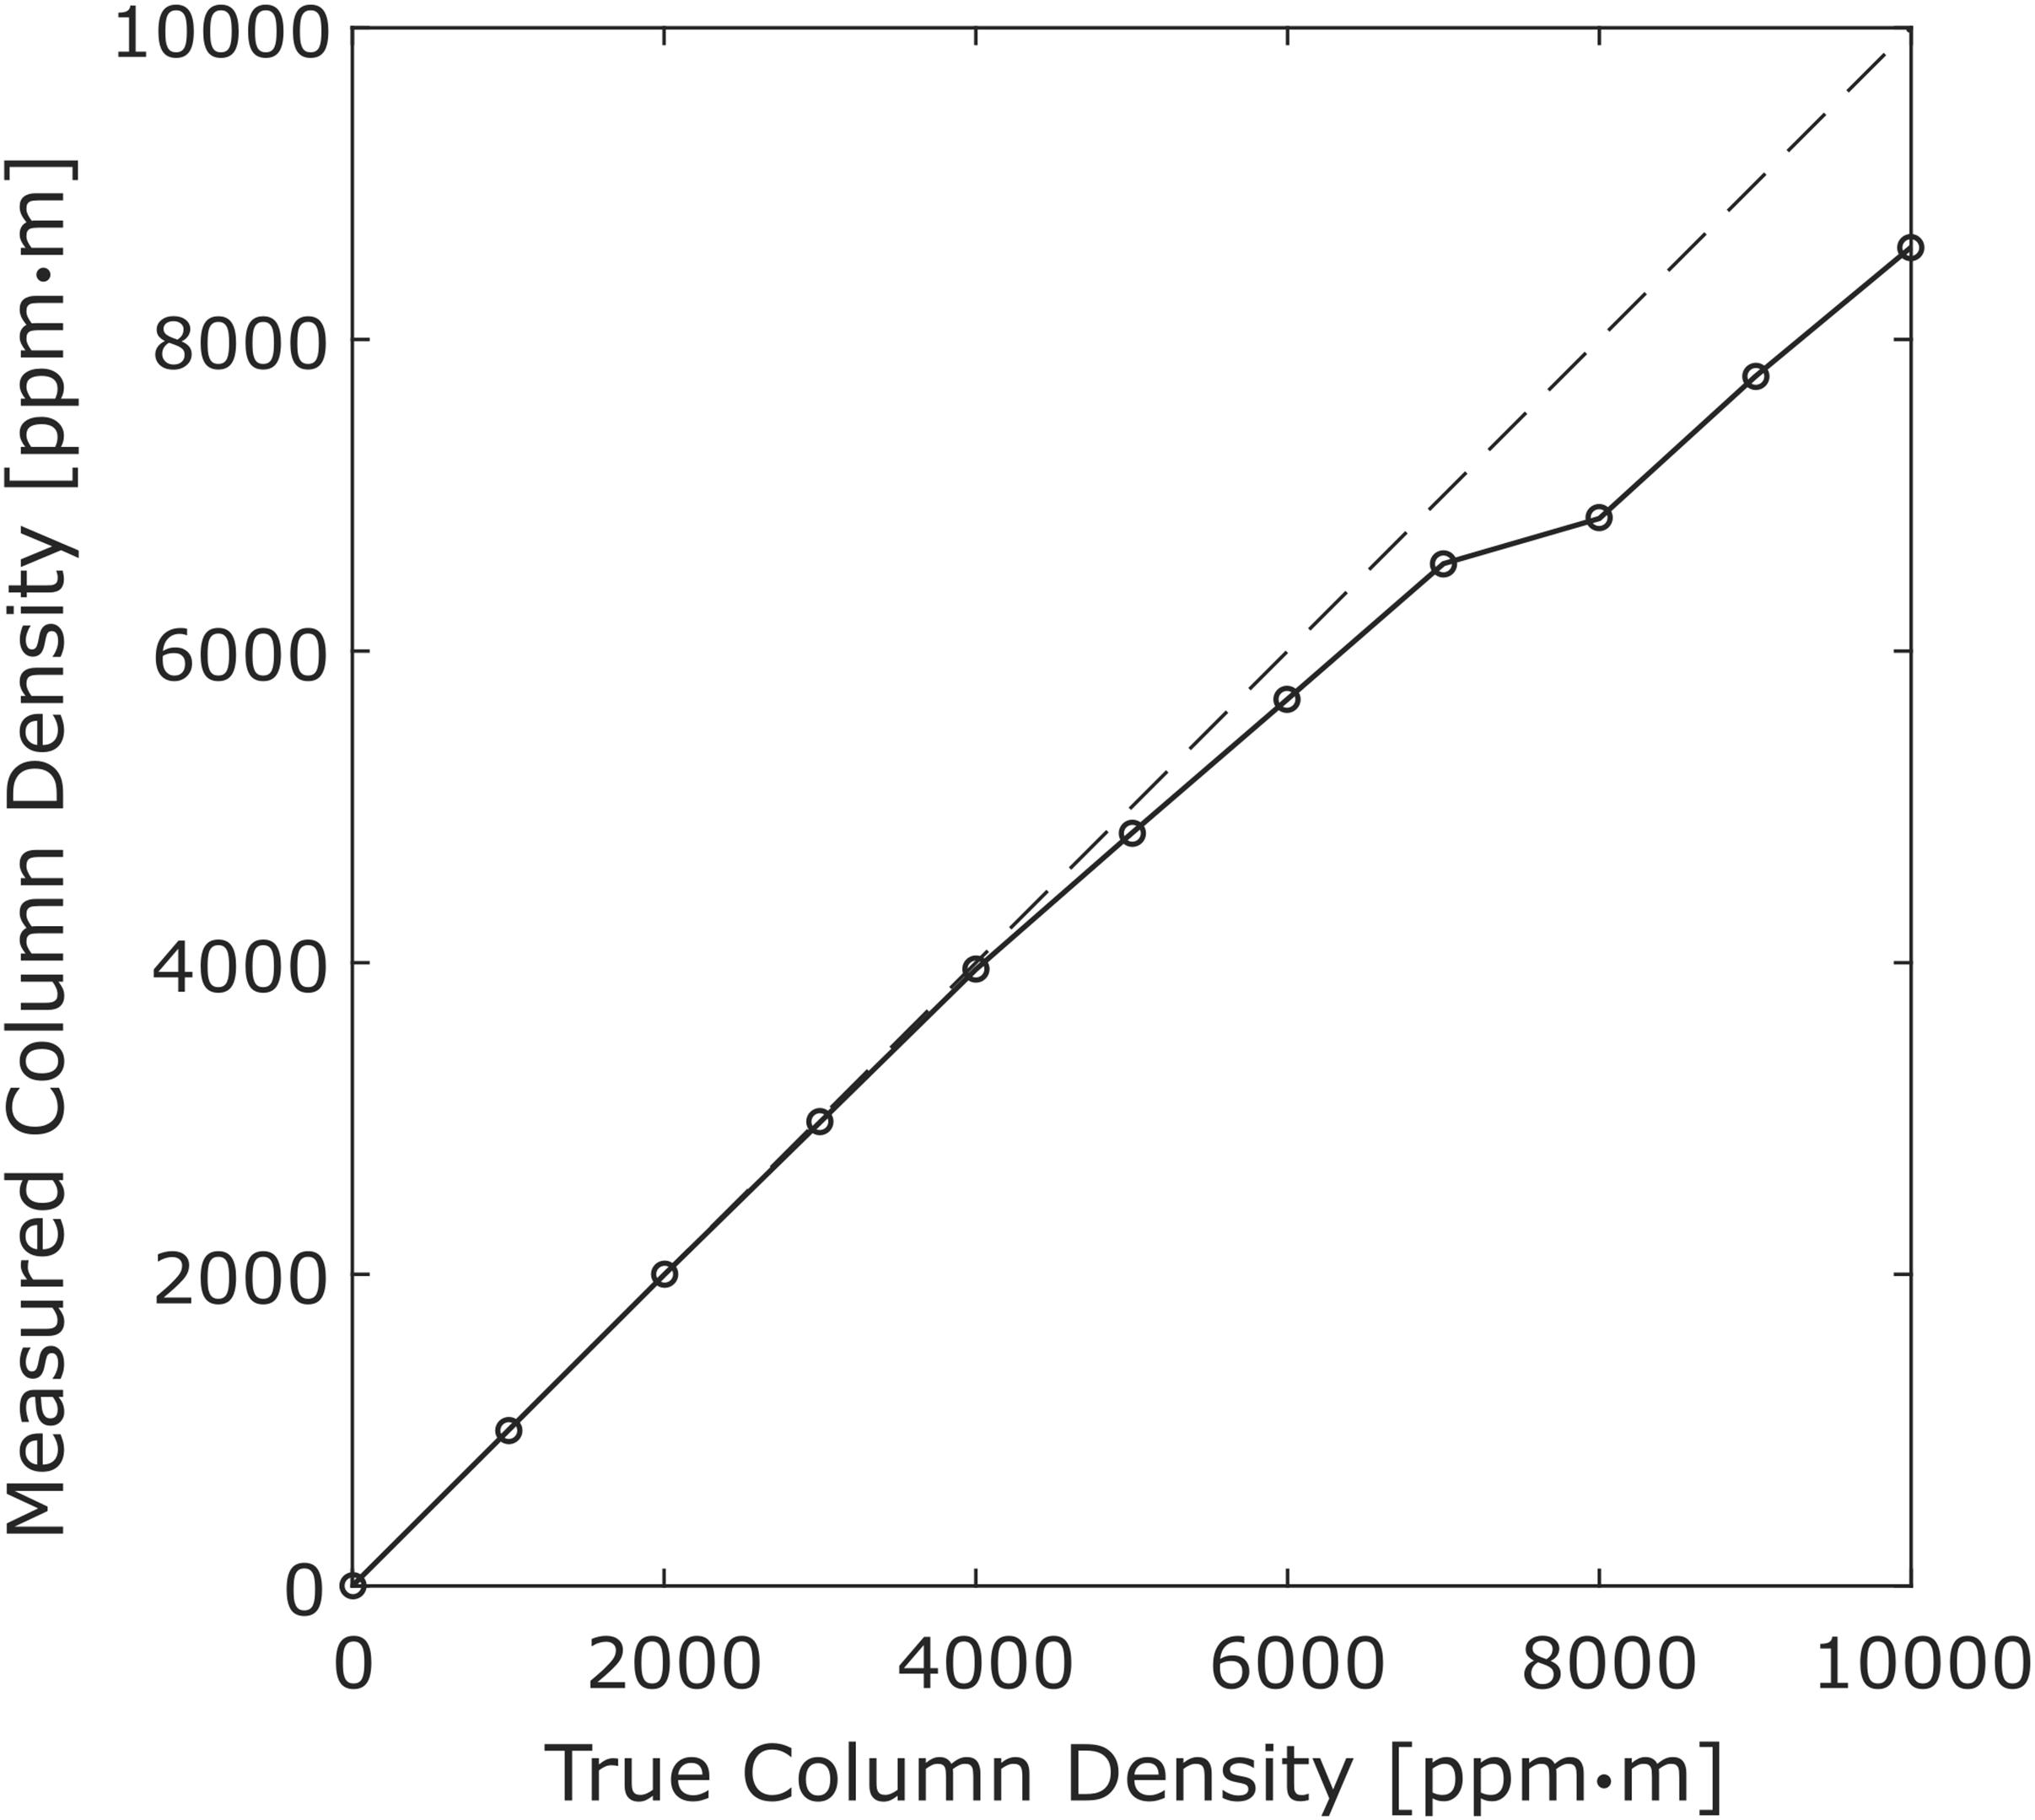
Figure 7. Modeled PiSpec response to SO2 in the fit window 314–324 nm. The response shows the saturation effect, whereby larger optical depths become non-linearly related to column densities, becomes significant above ≈4000 ppm ⋅ m. This model can be used to correct for retrieved column densities, or the DOAS fit window can be shifted to longer wavelengths to minimize the effect.
Conclusion
We have presented the first deployment of a custom-built spectrometer (PiSpec) for the retrieval of volcanic SO2 emission rates. Both scanning and driving traverse DOAS modes were performed on Masaya volcano in June 2017, with both sets of results lying within the bounds of rates measured by NOVAC spectrometers in early 2017 (Aiuppa et al., 2018) and DROAS traverses in May 2017 (Stix et al., 2018). Furthermore, we show that the thermal stability of the PiSpec is similar to commercial units quoted by Platt and Stutz (2008), with a wavelength shift of ≈0.046 nm/°C within the range 2.5–45°C. The PiSpec’s line shape is seen to change markedly across this temperature range, as would be expected. Whilst detection limits depend on a number of external (e.g., weather) as well as internal instrumental factors, typically the PiSpec’s detection limit was found to be less than ≈50 ppm ⋅ m during its deployment on Masaya; in some idealistic scenarios, a limit of less than 10 ppm ⋅ m may be possible. These results demonstrate the utility of the PiSpec to deliver broadly comparable performance to commercial DOAS systems in terms of volcanic plume observations. This is significant given the low cost of the PiSpec and the potential for further cost reduction, with mass production, in that this unit could be particularly useful in resource-poor settings to provide valuable data for monitoring and fundamental science applications. We therefore suggest that dissemination of these instruments should be a principal forthcoming objective. Future work on this instrument should also focus on assessing its long-term performance in the field, as well as improvements to the mounting of components in the PiSpec, which may improve the instrument’s thermal stability.
Author Contributions
TW primarily wrote the manuscript and performed the analyses. AM co-wrote the manuscript. TW, TP, and RE performed the field work. TW, AM, and JW designed the PiSpec instrument. RB co-supervised the project. AS assisted in thermal stability tests. AP and FM assisted in preparation of this manuscript.
Funding
TW was supported by a scholarship from the Department of Geography, University of Sheffield. TP and RE were supported by a University of Sheffield GLOSS studentship. JW acknowledges the support of an Engineering and Physical Sciences Research Council grant (EP/M009106/1).
Conflict of Interest Statement
The authors declare that the research was conducted in the absence of any commercial or financial relationships that could be construed as a potential conflict of interest.
Acknowledgments
We would like to thank reviewers RK and MDM, and editor JS, for their detailed comments on the initial manuscript, which we feel have greatly improved the quality of the article. We would like to thank Ulrich Platt for a number of useful discussions pertinent to this work. We would also like to thank the Laboratory Staff in the Department of Geography, University of Sheffield, for their continued support of our research needs. We acknowledge the use of the Generic Mapping Tool (Wessel et al., 2013) for drawing Figure 1.
Supplementary Material
The Supplementary Material for this article can be found online at: https://www.frontiersin.org/articles/10.3389/feart.2019.00065/full#supplementary-material
DATA SHEET S1 | Data for the 7 figures included in the manuscript.
References
Aiuppa, A., de Moor, J. M., Arellano, S., Coppola, D., Francofonte, V., Galle, B., et al. (2018). Tracking formation of a lava lake from ground and space: masaya volcano (Nicaragua), 2014-2017. Geochem. Geophys. Geosyst. 19, 2014–2017. doi: 10.1002/2017GC007227
Arellano, S., Yalire, M., Galle, B., Bobrowski, N., Dingwell, A., Johansson, M., et al. (2017). Long-term monitoring of SO2quiescent degassing from Nyiragongo’s lava lake. J. Afr. Earth Sci. 134, 866–873. doi: 10.1016/j.jafrearsci.2016.07.002
Bobrowski, N., Kern, C., Platt, U., Hörmann, C., and Wagner, T. (2010). Novel SO2 spectral evaluation scheme using the 360-390 nm wavelength range. Atmos. Meas. Tech. 3, 879–891. doi: 10.5194/amt-3-879-2010
Bobrowski, N., von Glasow, R., Aiuppa, A., Inguaggiato, S., Louban, I., Ibrahim, O. W., et al. (2007). Reactive halogen chemistry in volcanic plumes. J. Geophys. Res. Atmos. 112, 1–17. doi: 10.1029/2006JD007206
Carn, S. A., Fioletov, V. E., McLinden, C. A., Li, C., and Krotkov, N. A. (2017). A decade of global volcanic SO2 emissions measured from space. Sci. Rep. 7:44095. doi: 10.1038/srep44095
de Moor, J. M., Kern, C., Avard, G., Muller, C., Aiuppa, A., Saballos, A., et al. (2017). A new sulfur and carbon degassing inventory for the southern central american volcanic arc: the importance of accurate time-series data sets and possible tectonic processes responsible for temporal variations in arc-scale volatile emissions. Geochem. Geophys. Geosyst. 18, 4437–4468. doi: 10.1002/2017GC007141
Delmelle, P., Stix, J., Baxter, P., Garcia-Alvarez, J., and Barquero, J. (2002). Atmospheric dispersion, environmental effects and potential health hazard associated with the low-altitude gas plume of Masaya volcano, Nicaragua. Bull. Volcanol. 64, 423–434. doi: 10.1007/s00445-002-0221-6
Dingwell, A., Rutgersson, A., Claremar, B., Arellano, S., Yalire, M. M., and Galle, B. (2016). Seasonal and diurnal patterns in the dispersion of SO2 from Mt. Nyiragongo. Atmos. Environ. 132, 19–29. doi: 10.1016/j.atmosenv.2016.02.030
Frankenberg, C., Platt, U., and Wagner, T. (2005). Iterative maximum a posteriori (IMAP)-DOAS for retrieval of strongly absorbing trace gases: model studies for CH4 and CO2 retrieval from near infrared spectra of SCIAMACHY onboard ENVISAT. Atmos. Chem. Phys. 5, 9–22. doi: 10.5194/acpd-4-6067-2004
Galle, B., Johansson, M., Rivera, C., Zhang, Y., Kihlman, M., Kern, C., et al. (2010). Network for observation of volcanic and atmospheric change (NOVAC)—a global network for volcanic gas monitoring: network layout and instrument description. J. Geophys. Res. 115:D05304. doi: 10.1029/2009JD011823
Galle, B., Oppenheimer, C., Geyer, A., McGonigle, A. J. S., Edmonds, M., and Horrocks, L. A. (2003). A miniaturised ultraviolet spectrometer for remote sensing of SO2 fluxes: a new tool for volcano surveillance. J. Volcanol. Geotherm. Res. 119, 241–254. doi: 10.1016/S0377-0273(02)00356-6
Gordon, I. E., Rothman, L. S., Hill, C., Kochanov, R. V., Tan, Y., Bernath, P. F., et al. (2017). The HITRAN2016 molecular spectroscopic database. J. Quant. Spectrosc. Radiat. Transf. 203, 3–69. doi: 10.1016/j.jqsrt.2017.06.038
Granieri, D., Salerno, G. G., Liuzzo, M., La Spina, A., Giuffrida, G., Caltabiano, T., et al. (2015). Emission of gas and atmospheric dispersion of SO2 during the December 2013 eruption at san miguel volcano (El Salvador, Central America). Geophys. Res. Lett. 42, 5847–5854. doi: 10.1002/2015GL064660
Grutter, M., Basaldud, R., Rivera, C., Harig, R., Junkerman, W., Caetano, E., et al. (2008). SO 2 emissions from Popocatépetl volcano: emission rates and plume imaging using optical remote sensing techniques. Atmos. Chem. Phys. Atmos. Chem. Phys. 8, 6655–6663. doi: 10.5194/acp-8-6655-2008
Hidalgo, S., Battaglia, J., Arellano, S., Steele, A., Bernard, B., Bourquin, J., et al. (2015). SO2 degassing at Tungurahua volcano (Ecuador) between 2007 and 2013: transition from continuous to episodic activity. J. Volcanol. Geotherm. Res. 298, 1–14. doi: 10.1016/j.jvolgeores.2015.03.022
Hönninger, G., von Friedeburg, C., and Platt, U. (2004). Multi axis differential optical absorption spectroscopy (MAX-DOAS). Atmos. Chem. Phys. 4, 231–254. doi: 10.5194/acp-4-231-2004
Kantzas, E. P., McGonigle, A. J. S., and Bryant, R. G. (2009). Comparison of low cost miniature spectrometers for volcanic SO2 emission measurements. Sensors 9, 3256–3268. doi: 10.3390/s90503256
Kern, C., Masias, P., Apaza, F., Reath, K. A., and Platt, U. (2017). Remote measurement of high preeruptive water vapor emissions at Sabancaya volcano by passive differential optical absorption spectroscopy. J. Geophys. Res. Solid Earth 122, 3540–3564. doi: 10.1002/2017JB014020
Khokhar, M. F., Frankenberg, C., Van Roozendael, M., Beirle, S., Kühl, S., Richter, A., et al. (2005). Satellite observations of atmospheric SO2from volcanic eruptions during the time-period of 1996-2002. Adv. Space Res. 36, 879–887. doi: 10.1016/j.asr.2005.04.114
Klein, A., Lübcke, P., Bobrowski, N., Kuhn, J., and Platt, U. (2017). Plume propagation direction determination with SO2 cameras. Atmos. Meas. Tech. 10, 979–987. doi: 10.5194/amt-10-979-2017
Lübcke, P., Bobrowski, N., Arellano, S., Galle, B., Garzón, G., Vogel, L., et al. (2014). BrO/SO2 molar ratios from scanning DOAS measurements in the NOVAC network. Solid Earth 5, 409–424. doi: 10.5194/se-5-409-2014
McGonigle, A. J. S. (2007). Measurement of volcanic SO2 fluxes with differential optical absorption spectroscopy. J. Volcanol. Geotherm. Res. 162, 111–122. doi: 10.1016/j.jvolgeores.2007.02.001
McGonigle, A. J. S., Aiuppa, A., Ripepe, M., Kantzas, E. P., and Tamburello, G. (2009). Spectroscopic capture of 1 Hz volcanic SO2 fluxes and integration with volcano geophysical data. Geophys. Res. Lett. 36:L21309. doi: 10.1029/2009GL040494
McGonigle, A. J. S., Hilton, D. R., Fischer, T. P., and Oppenheimer, C. (2005). Plume velocity determination for volcanic SO 2 flux measurements. Geophys. Res. Lett. 32:L11302. doi: 10.1029/2005GL022470
McGonigle, A. J. S., Oppenheimer, C., Galle, B., Mather, T. A., and Pyle, D. M. (2002). Walking traverse and scanning DOAS measurements of volcanic gas emission rates. Geophys. Res. Lett. 29, 46-1–46-4. doi: 10.1029/2002GL015827
McGonigle, A. J. S., Oppenheimer, C., Tsanev, V. I., Saunders, S., Mulina, K., Tohui, S., et al. (2004). Sulphur dioxide fluxes from papua new guinea’s volcanoes. Geophys. Res. Lett. 31, 1–4. doi: 10.1029/2004GL019568
Meroni, M., Busetto, L., Guanter, L., Cogliati, S., Crosta, G. F., Migliavacca, M., et al. (2010). Characterization of fine resolution field spectrometers using solar fraunhofer lines and atmospheric absorption features. Appl. Opt. 49, 2858–2871. doi: 10.1364/AO.49.002858
Mori, T., and Burton, M. R. (2006). The SO2 camera: a simple, fast and cheap method for ground-based imaging of SO 2 in volcanic plumes. Geophys. Res. Lett. 33:L24804. doi: 10.1029/2006GL027916
Mori, T., Mori, T., Kazahaya, K., Ohwada, M., Hirabayashi, J., and Yoshikawa, S. (2006). Effect of UV scattering on SO2 emission rate measurements. Geophys. Res. Lett. 33, 3–7. doi: 10.1029/2006GL026285
Pering, T. D., Ilanko, T., Wilkes, T. C., England, R. A., Silcock, S. R., Stanger, L. R., et al. (2019). A rapidly convecting Lava Lake at Masaya Volcano, Nicaragua. Front. Earth Sci. 6:241. doi: 10.3389/feart.2018.00241
Platt, U., and Stutz, J. (2008). Differential Optical Absorption Spectroscopy, Principles and Applications, Series: Physics of Earth and Space Environments. Heidelberg: Springer, doi: 10.1007/978-3-540-75776-4
Rix, M., Valks, P., Hao, N., van Geffen, J., Clerbaux, C., Clarisse, L., et al. (2009). Satellite monitoring of volcanic sulfur dioxide emissions for early warning of volcanic hazards. IEEE J. Sel. Top. Appl. Earth Obs. Remote Sens. 2, 196–206. doi: 10.1109/JSTARS.2009.2031120
Salerno, G. G., Burton, M. R., Oppenheimer, C., Caltabiano, T., Tsanev, V. I., and Bruno, N. (2009). Novel retrieval of volcanic SO2 abundance from ultraviolet spectra. J. Volcanol. Geotherm. Res. 181, 141–153. doi: 10.1016/j.jvolgeores.2009.01.009
Shinohara, H., Aiuppa, A., Giudice, G., Gurrieri, S., and Liuzzo, M. (2008). Variation of H2O/CO2 and CO2/SO2 ratios of volcanic gases discharged by continuous degassing of mount etna volcano, Italy. J. Geophys. Res. Solid Earth 113, 1–11. doi: 10.1029/2007JB005185
Stephens, K. J., and Wauthier, C. (2018). Satellite geodesy captures offset magma supply associated with lava lake appearance at masaya volcano, nicaragua. Geophys. Res. Lett. 45, 2669–2678. doi: 10.1002/2017GL076769
Stix, J., De Moor, J. M., Rüdiger, J., Alan, A., Corrales, E., D’Arcy, F., et al. (2018). Using drones and miniaturized instrumentation to study degassing at turrialba and masaya volcanoes, central america. J. Geophys. Res. Solid Earth 123, 6501–6520. doi: 10.1029/2018JB015655
Stutz, J., and Platt, U. (1996). Numerical analysis and estimation of the statistical error of differential optical absorption spectroscopy measurements with least-squares methods. Appl. Opt. 35, 6041–6053. doi: 10.1364/AO.35.006041
Tamburello, G., McGonigle, A. J. S., Kantzas, E. P., and Aiuppa, A. (2011). Recent advances in ground-based ultraviolet remote sensing of volcanic SO2 fluxes. Ann. Geophys. 54, 199–208. doi: 10.4401/ag-5179
Theys, N., De Smedt, I., van Gent, J., Danckaert, T., Wang, T., Hendrick, F., et al. (2015). Sulfur dioxide vertical column DOAS retrievals from the ozone monitoring instrument: global observations and comparison to ground-based and satellite data. J. Geophys. Res. Atmos. 120, 2470–2491. doi: 10.1002/2014JD022417.Received
USGS (2018). Advanced Spaceborned Thermal Emission and Reflection Radiometer 1 arc-Second. ASTER DEM is a Product of METI and NASA.Available at: https://earthexplorer.usgs.gov/ (accessed May20, 2018).
Vandaele, A. C., Hermans, C., and Fally, S. (2009). Fourier transform measurements of SO2 absorption cross sections: II. Temperature dependence in the 29 000-44 000 cm-1 (227-345 nm) region. J. Quant. Spectrosc. Radiat. Transf. 110, 2115–2126. doi: 10.1016/j.jqsrt.2009.05.006
Venzke, E. (ed.) (2017). Bulletin of the Global Volcanism Network.Available at: https://volcano.si.edu.
Vogel, L., Galle, B., Kern, C., Delgado Granados, H., Conde, V., Norman, P., et al. (2011). Early in-flight detection of SO2 via differential optical absorption spectroscopy: a feasible aviation safety measure to prevent potential encounters with volcanic plumes. Atmos. Meas. Tech. 4, 1785–1804. doi: 10.5194/amt-4-1785-2011
Vogel, L., Sihler, H., Lampel, J., Wagner, T., and Platt, U. (2013). Retrieval interval mapping: a tool to visualize the impact of the spectral retrieval range on differential optical absorption evaluations. Atmos. Meas. Tech. 6, 275–299. doi: 10.5194/amt-6-275-2013
Wagner, T., Heland, J., Zöger, M., and Platt, U. (2003). A fast H2O total column density product from GOME - validation with in-situ aircraft measurements. Atmos. Chem. Phys. 3, 651–663. doi: 10.5194/acp-3-651-2003
Wenig, M., Jähne, B., and Platt, U. (2005). Operator representation as a new differential optical absorption spectroscopy formalism. Appl. Opt. 44,3246–3253. doi: 10.1364/AO.44.003246
Wessel, P., Smith, W. H. F., Scharroo, R., Luis, J., and Wobbe, F. (2013). Generic mapping tools: improved version released. EOS 94, 409–410. doi: 10.1002/2013EO450001
Wilkes, T. C., McGonigle, A. J. S., Pering, T. D., Taggart, A., White, B., Bryant, R., et al. (2016). Ultraviolet imaging with low cost smartphone sensors: development and application of a raspberry pi-based UV camera. Sensors 16:1649. doi: 10.3390/s16101649
Wilkes, T. C., McGonigle, A. J. S., Willmott, J. R., Pering, T. D., and Cook, J. M. (2017). Low-cost 3D printed 1 nm resolution smartphone sensor-based spectrometer: instrument design and application in ultraviolet spectroscopy. Opt. Lett. 42, 4323–4326. doi: 10.1364/OL.42.004323
Wilkes, T. C., Stanger, L., Willmott, J., Pering, T. D., McGonigle, A. J. S., and England, R. (2018). The development of a low-cost, near infrared, high-temperature thermal imaging system and its application to the retrieval of accurate lava lake temperatures at masaya volcano, nicaragua. Remote Sens. 10:450. doi: 10.3390/rs10030450
Keywords: UV spectroscopy, DOAS, sulfur dioxide, volcanic emissions, Masaya volcano, smartphone sensor, Raspberry Pi, 3D printing
Citation: Wilkes TC, Pering TD, McGonigle AJS, Willmott JR, Bryant R, Smalley AL, Mims FM III, Parisi AV and England RA (2019) The PiSpec: A Low-Cost, 3D-Printed Spectrometer for Measuring Volcanic SO2 Emission Rates. Front. Earth Sci. 7:65. doi: 10.3389/feart.2019.00065
Received: 14 September 2018; Accepted: 14 March 2019;
Published: 16 April 2019.
Edited by:
John Stix, McGill University, CanadaReviewed by:
Ryunosuke Kazahaya, Geological Survey of Japan (AIST), JapanJ. Maarten De Moor, OVSICORI-UNA, Costa Rica
Copyright © 2019 Wilkes, Pering, McGonigle, Willmott, Bryant, Smalley, Mims, Parisi and England. This is an open-access article distributed under the terms of the Creative Commons Attribution License (CC BY). The use, distribution or reproduction in other forums is permitted, provided the original author(s) and the copyright owner(s) are credited and that the original publication in this journal is cited, in accordance with accepted academic practice. No use, distribution or reproduction is permitted which does not comply with these terms.
*Correspondence: Thomas Charles Wilkes, dGN3aWxrZXMxQHNoZWZmaWVsZC5hYy51aw==