- 1Faculty of Science and Technology, Kochi University, Kochi, Japan
- 2Department of Geology and Petroleum Geology, University of Aberdeen, Aberdeen, United Kingdom
- 3Center for Deep Earth Exploration, Japan Agency for Marine-Earth Science and Technology, Yokosuka, Japan
- 4Department of Earth Sciences, University of Toronto, Toronto, ON, Canada
- 5Kochi Institute for Core Sample Research, Japan Agency for Marine-Earth Science and Technology, Nankoku, Japan
- 6Department of Urban Management, Kyoto University, Kyoto, Japan
- 7Department of Mathematical Science and Advanced Technology, Japan Agency for Marine-Earth Science and Technology, Yokosuka, Japan
- 8Korea Institute of Ocean Science and Technology, Uljin, South Korea
- 9Research and Development Center for Ocean Drilling Science (ODS), Japan Agency for Marine-Earth Science and Technology, Yokosuka, Japan
- 10Mantle Drilling Promotion Office (MDP), Institute for Marine-Earth Exploration and Engineering (MarE3), Japan Agency for Marine-Earth Science and Technology, Yokosuka, Japan
- 11Graduate School of Science, Kochi University, Kochi, Japan
- 12MARUM - Center for Marine Environmental Sciences and Faculty of Geosciences, University of Bremen, Bremen, Germany
X-ray computed tomography (XCT) can be used to identify lithologies and deformation structures within geological core, with the potential for the identification processes to be applied automatically. However, because of drilling disturbance and other artifacts, the use of large XCT-datasets in automated processes requires methods of quality control that can be applied systematically. We propose a new systematic method for quality control of XCT data that applies numerical measures to CT slices, and from this obtains data reflective of core quality. Because the measures are numerical they can be applied quickly and consistently between different sections and cores. This quality control processing protocol produces downhole radiodensity profiles from mean CT-values that can be used for geological interpretation. The application of this quality control protocols was applied to XCT data from International Ocean Discovery Program (IODP) Expedition 370 Site C0023 located at the toe of the Nankai accretionary complex. The evaluation of core quality based on this protocol was found to be a good fit to standard-evaluations based on the visual description of core, and could be used to select samples free from drilling disturbance or contamination. The quality-controlled downhole mean CT-value profile has features that can be used to identify lithologies within a formation, the presence and type of deformation structures and to distinguish formations.
1. Introduction
Studies of structural geology and mountain building processes have benefitted enormously from the drilling of deep sea sediments and the recovery of rock and sediment cores. However, visual core description (VCD) only utilizes a part of the information recorded in sediments. For example, even though microscopy can resolve small features, the measurements of lithological or small structural features across sampling distances that are a kilometer or more in length are impractical for many reasons; time, scale and also the 3D volume involved (e.g., internal surfaces are not exposed at the surface). The physical properties of core (e.g., bulk density, P-wave velocity) can also be measured and used to generate downhole profiles, but these also have a low spatial resolution. It is an aim of scientific drilling to completely document and acquire all of the information present in geological cores, but the achievement of this aim is held back by an inability to use all the data available, whilst at the same time taking into consideration the fine and large scales. The capability to measure and use all geological features at the greatest resolution possible would be of great benefit.
X-ray computed tomography (XCT) is a radiological imaging method initially developed for medical applications (Hounsfield, 1973) and subsequently applied to many fields of Earth Sciences. Areas of application within Earth Science include paleontology, sedimentology, structural geology and petrophysics (e.g., Johns et al., 1993; Row, 1996; Ketcham and Carlson, 2001; Mees et al., 2003; Tanaka et al., 2011; Watanabe et al., 2011; Yun et al., 2013) with microfocus XCT scanners also seeing widespread use (e.g., Van Geet et al., 2000; Nakashima and Kamiya, 2007; Uramoto et al., 2014; Nomaki et al., 2015). For some time scientific drilling has also used three-dimensional XCT images of cores to support interpretations of lithology and structure as well as to preserve a digital record of core prior to destructive analyses (e.g., Ashi, 1997; Ujiie et al., 2004).
Most recently the potential of CT measurements to provide downhole profiles of radiodensity has been recognized as the physical properties of geological formations vary and thus CT-value profiles lend themselves to geological interpretations (e.g., Støren et al., 2010; Tanaka et al., 2011; Fortin et al., 2013; Reilly et al., 2017). However, cores can be broken by fractures or drilling disturbance, and the broken intervals show anomalies within the CT-value profiles and prevent accurate geological interpretations. Thus, systematic quality control is needed for so that reliable radiodensity profiles can be obtained.
Systematic quality control of XCT data is also useful for selecting high-quality sample, where “high quality” means free from artificial disturbance and free from and contamination by drilling fluids (fractured intervals are more permeable and more easily contaminated by drilling fluids). Additionally, many analyses that are concerned with contamination are also time-sensitive and notably sensitive to procedures such as core-splitting or opening core lines, and thus contamination tests should preferably be performed without sample destruction. Non-destructive and quick XCT techniques are suitable for such sample selection (e.g., Inagaki et al., 2015). An improvement could be made by developing a systematic XCT-based method for contamination monitoring that could be applied consistently between cores, as well as potentially between projects or expeditions.
Here, we introduce a new method for processing of full XCT datasets and show the potential of XCT scanning as an automated core logging tool for the identification of structural features in geological archives. Our method consists of the following data processing steps: (1) Assignment of slice quality (SQ) to each CT slice by image processing; (2) Assignment of a mean CT number (MCN) to each CT slice, characterizing its average radiodensity; (3) Creation of quality-controlled mean radiodensity profiles from MCN values of filtered CT slices. In order to test whether automated processing for XCT data can capture fine-scale lithological features and natural deformation structures, and whether it correctly recognizes drilling disturbances, we applied our method to XCT-images that were generated from sediment cores during Expedition 370 of the International Ocean Discovery Program (IODP) (Heuer et al., 2017b). The expedition drilled and cored sediments in the Nankai Trough Subduction Zone off Muroto, Japan, where a drastic change in sedimentation rate, volcaniclastic ash layers, hydrothermal veins and faults have yielded characteristic geological features.
2. Methods
2.1. X-Ray CT Image
Tomographic images of XCT are reconstructed by inversion of the Radon transform (Radon, 1917, 1986) of the X-ray Linear Attenuation Coefficient (LAC). The LAC is a physical index describing the reduction of X-ray beam intensity during transmission through objects and mainly relates to density, but also chemical composition and state. A transmitted X-ray intensity varies as a function of X-ray path length and the LAC of the object and is expressed by Beer's law:
where I and I0 are the transmitted and initial X-ray intensity, respectively. μt and L are functions of the LAC of the object and X-ray path length through the object. The CT number is given by the following equation:
where μw is the LAC of water.
2.2. Slice Quality (SQ)
The proposed slice quality (SQ) is measured for an interval of a core using scanned Digital Imaging and Communications in Medicine (DICOM) slice images. In other literature and contexts the term “section” might refer to an interval of core or other geological span, but here we use the term “interval” to refer to an arbitrary selected interval of core samples, and the term “section” within the IODP convention of dividing core into a number of sections, which are up to 1.5 m long.
Figure 1 illustrates a processing and measurement workflow for SQ. First, for a defined interval (e.g., a standard IODP section or a specific interval of subsampling), a circular area is visually selected by a researcher for a given interval, and the CT number of each voxel within that area examined using an image processing program (Figure 1A). A voxel is a value on a regular grid in three-dimensional space, and represents the basic unit of CT data.
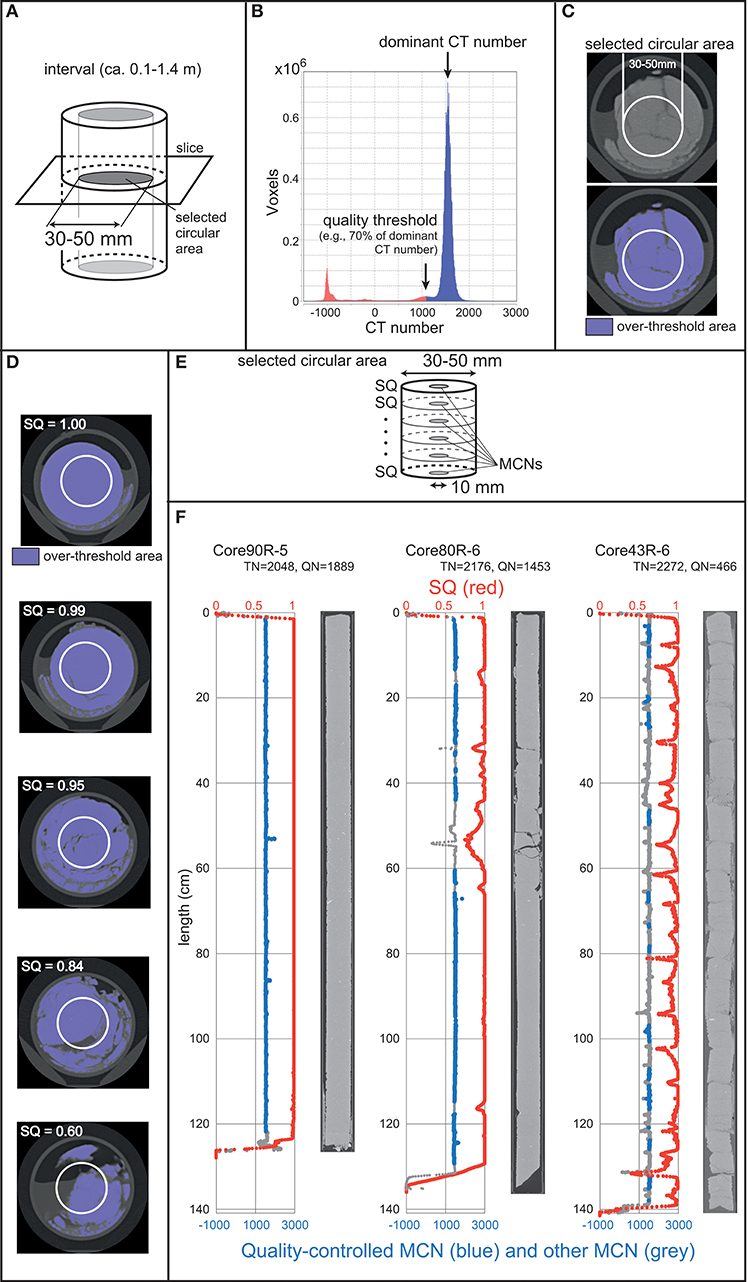
Figure 1. Processing and measurement flow of slice quality (SQ) and quality-controlled mean CT number (MCN) profiles. (A) A selected circular area of a CT slice for SQ. (B) A histogram of voxel numbers against CT numbers for a selected interval. (C) Over-threshold areas of a CT slice. (D) CT slices showing different SQ. (E) Schematic image showing areas of SQ and MCNs. (F) SQs and MCNs of some typical intervals in the core samples of International Ocean Discovery Program (IODP) Expedition 370 Hole C0023A. TN, total slice number; QN, quality-controlled slice number.
Second, a quality threshold of CT number is determined for a given interval using a histogram of CT numbers (Figure 1B). The major material within an interval will have a dominant CT number which is visualized as a peak in the histogram (Figure 1B). The quality threshold for the interval can be determined based on the dominant CT number (e.g., 70% of the dominant CT number taking into consideration the variation) and the voxels with CT numbers greater than the threshold are considered “over-threshold areas” (Figure 1C). Finally, the proportion of over-threshold areas for the selected circular area of a slice in the interval is used to determine the SQ (Figure 1D). When a slice has a SQ higher than a slice quality threshold, it is regarded as a “over-threshold slice.” This process is repeated for all slices in an interval (Figure 1E) and the slices are subsequently designated as “over-threshold” or “under-threshold” (Figure 1F). This process was automated by performing measurements on slices using a plugin for ImageJ, a free open access image processing program (Schneider et al., 2012).
2.3. Mean CT Number (MCN) Profile
To create quality-controlled radiodensity profiles from CT-values, the mean CT number (MCN) was calculated for each CT slice. In terms of lithological composition, MCN better captures the physical property of a whole CT slice than the CT number of single voxels, as typically a rock will comprise a mixture of mineral components and pore spaces. Furthermore, even within a single homogenous slice, the CT-values of the outer rim of a slice may show anomalies because of beam-hardening during CT-scanning (e.g., Ketcham and Carlson, 2001). Therefore, the MCN of each slice in this study was measured using a 10 mm-diameter circular area at the center of the selected areas (Figure 1E).
In this study, CT slices regarded as under-threshold due to their lower SQs were removed because they would generate anomalies (suppressed-values) within MCN profiles. Additionally, the higher MCNs anomalies that would be caused by the presence of heavy-mineral assemblages also complicate the interpretation of lithological and/or deformational characteristics of drilling cores from MCN profiles and thus such anomalous slices must also be removed. The effects of processing to removing CT slices that are anomalously high or low are illustrated in Figure 1F.
2.4. Application to a Natural Dataset (IODP Expedition 370)
The XCT data used for this study was measured on core samples acquired at Site C0023 of IODP Expedition 370, Temperature-Limit of the Deep Biosphere off Muroto, Japan (Figure 2). This expedition was conducted in the Nankai Trough Subduction Zone, where the Philippine Sea Plate is subducting beneath the Japan Archipelago (Heuer et al., 2017a). The borehole reached 1,180 meters below the sea floor (mbsf), penetrating the frontal portion of the décollement (plate boundary fault) zone at 758.2–796.4 mbsf and basement igneous rocks at 1125.9 mbsf (Figure 3). Sediment thickness and type vary along the Nankai Trough (e.g., Ike et al., 2008; Underwood, 2018), and six sediment facies are recognized at the site; axial trench-wedge facies, outer trench-wedge facies, trench-to-basin facies, Upper Shikoku Basin facies, Lower Shikoku Basin facies and acidic volcaniclastic facies (Heuer et al., 2017b). 112 cores were recovered in total and core recovery was 76% on average (Heuer et al., 2017a) (Figure 3).
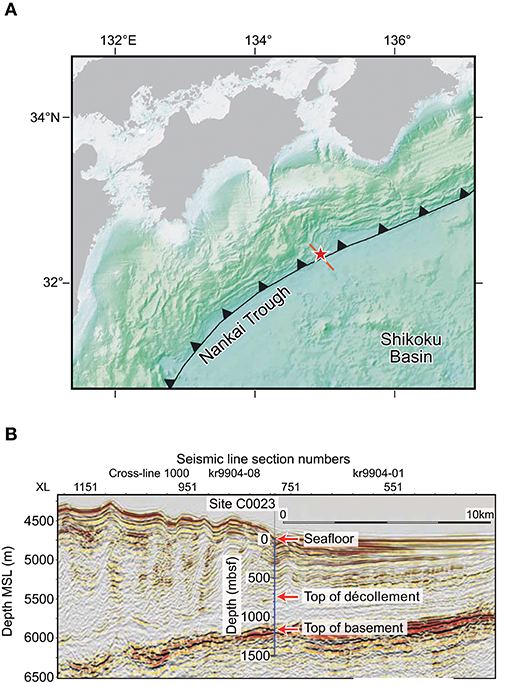
Figure 2. (A) Regional map around IODP Site C0023 (Heuer et al., 2017b). The star symbol and red line show the locations of the site and seismic line section of (B), respectively. (B) A seismic section at the toe portion of the Nankai Trough off Muroto (Heuer et al., 2017b). The arrows indicate the horizons of the sea floor, the top of the décollement zone, and the top of the oceanic basement.
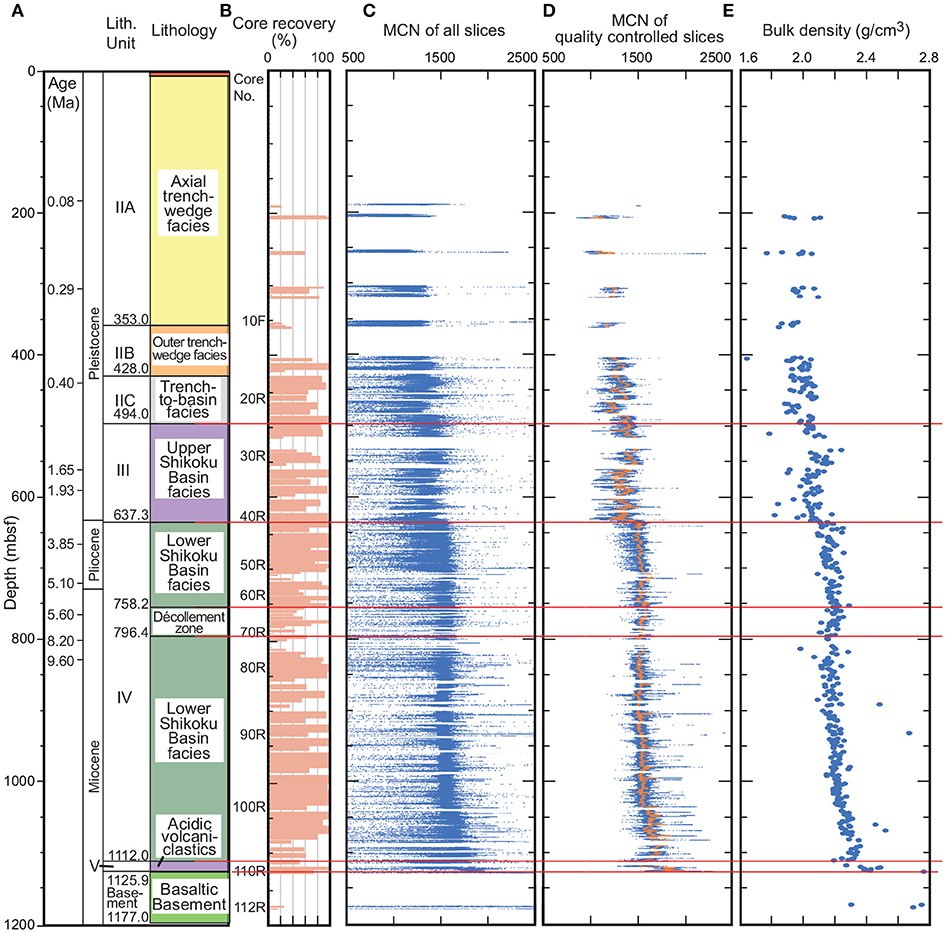
Figure 3. Site summary diagram of X-ray CT scanning for Site C0023 from 0 to 1,200 mbsf. Original data are from Heuer et al. (2017b). (A) Lithological facies. (B) Core recovery. (C) Mean CT number (MCN) profile using all CT slices. (D) Quality-controlled MCN profile. Orange plots are 500-slices moving averages of MCN. (E) Bulk density. mbsf, meter below sea floor; Lith. Unit, Lithological Unit.
XCT measurements were performed on the D/V Chikyu using a Discovery CT 750HD (GE Medical Systems) which is capable of generating thirty-two 0.625 mm thick slice images every 0.4 s. Data generated for each core-section consist of core-axis-normal planes of X-ray attenuation with dimensions of 512 × 512 voxels, corresponding to an area of 90 mm × 90 mm. To calculate CT numbers of samples standards were used; air (CT number = -1000), water (CT number = 0) and aluminum (2,477 < CT number < 2,487). All three standards were run once a day during the measurement period. For each standard analysis, the CT number was determined for a 24.85 mm2 area at fixed coordinates near the center of the cylinder. The scanning was done immediately after dividing the core into sections and before splitting each section (Heuer et al., 2017b).
The circular area selected for SQ measurements ranges from 30 to 50 mm diameter depending on the diameter of the core (Figure 1A) and the quality threshold for CT numbers in an interval was set to 70% of the dominant CT number within that interval (Figure 1B). Based on the relationship between SQ and the degree of fractures, the slice was regarded as a “over-threshold slice” if the SQ was greater than 0.99 (Figure 1D). When CT images and VCD are compared, the majority of the core has CT numbers less than 2,500, on the other hand, CT numbers of the area composed of heavy-mineral assemblages are greater than 3,000. Thus, the final selection criteria used to determine “over-threshold” slices was a SQ greater than 0.99 without a CT number area more than 3,000 (Figure 1F). Slices not meeting these criteria were removed from the radiodensity profile and 42.4% of the total CT slices remained.
3. Results and Discussions
3.1. General Trends in MCN
Figure 3 summarizes MCN and other information for Site C0023. Comparing Figures 3C,D it can be seen that the quality-controlled MCN radiodensity profile shows a much clearer trend, after the removal of the many slices within a low SQ and low MCN. The quality-controlled MCNs show generally increase with increasing depth, and MCN mostly ranges from 1,200 to 1,900 and appears to co-vary with bulk density downhole (Figures 3D,E). Bulk densities of a downhole core normally increase with depth due to diagenesis (compaction, cementation and mineral replacement) and this is probably the main cause of the general increase of the quality-controlled MCNs with depth at the site. The main lithology of the site is mud and mudstone, and there is no significant variation in elemental or mineralogical composition (Heuer et al., 2017b). Consequently, it is likely that the MCNs of slices comprising mud or mudstone mainly reflect their bulk density. The bulk densities of mud and mudstone are compared to MCN in Figure 4, and the greater part of the 316 measurements cluster around values of 2.1–2.3 g/cm3 and 1,500–1,600 for bulk density and MCN, respectively. There is a positive correlation (Figure 4), the results of which give the following equation:
where ρ and MCN are bulk density and MCN value, respectively. The positive correlation between bulk density and CT number of mud/mudstone or marine sediments seen at Site C0023 has also been observed at other ODP (Ocean Drilling Program) sites in the Nankai Trough (Ujiie et al., 2004) and other areas (Orsi et al., 1994; Ashi, 1997; Orsi and Anderson, 1999; Tanaka et al., 2011).
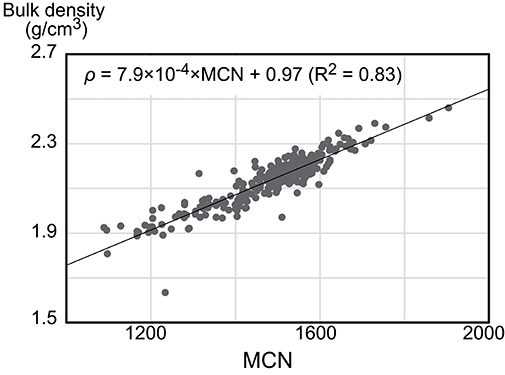
Figure 4. Relationship between mean CT number (MCN) and bulk density (ρ) data of the mud/mudstone of the IODP Site C0023. Bulk density data are from Heuer et al. (2017b).
In addition, the quality-controlled MCNs correspond to lithologies of the cores very well. Figure 5 shows the MCNs of CT slices comprising mud or mudstone, calcareous mud or mudstone, tuffaceous rocks and hydrothermally altered sediments. Among them tuffaceous rocks show lower MCNs than adjacent mud or mudstones, and hydrothermally altered sediments show higher MCNs than stratigraphically adjacent rocks. Some units of mudstone reacted strongly to 10% hydrochloric acid, and thus were logged as calcareous mud or mudstones and separated from other mud or mudstone (Heuer et al., 2017b). It can be seen that in some instances the radiodensities of these different mud or mudstones overlap, but in other instances such as at 650 to 750 mbsf and 1,000 to 1,100 mbsf the calcareous mudstones have the highest densities within an interval (blue triangles) and the mud the lowest (Figure 5).
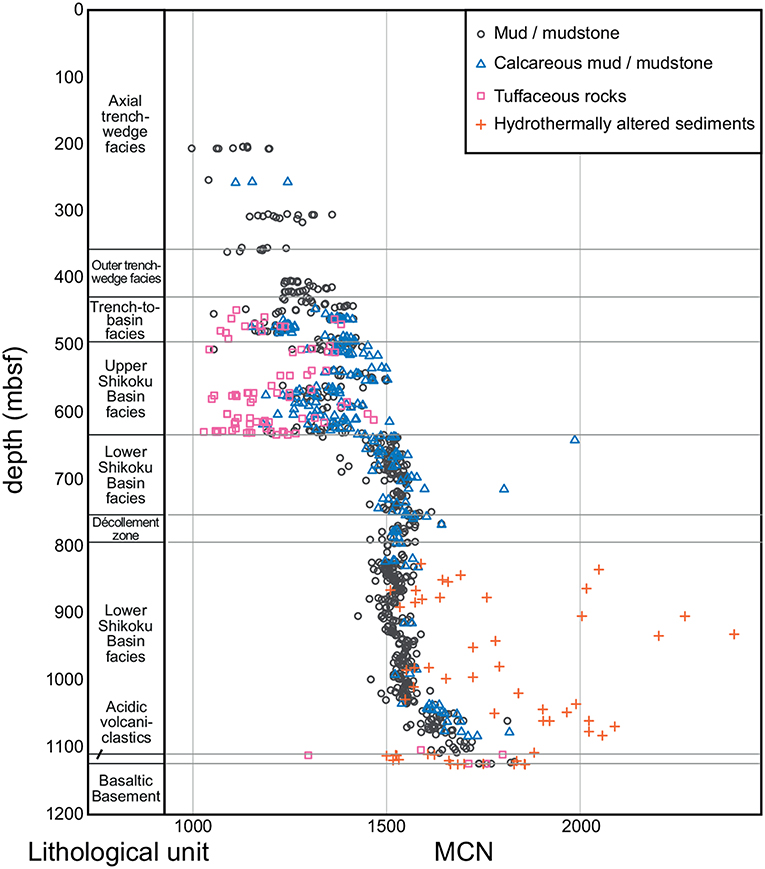
Figure 5. Relationship between graphic lithology and MCN of the IODP Site C0023. Graphic lithology data are from Heuer et al. (2017b).
3.2. Comparison MCN to Lithologies and Deformation Structures
In addition to a general increase of MCN with depth, there are distinctive features in the downhole quality-controlled radiodensity profile of Site C0023, namely; (1) positive spikes, (2) negative spikes, (3) abrupt downhole increases or decreases of 30–200 in the MCN value and (4) intervals with tiny cyclic negative anomalies. Correspondence between these characteristics and individual features of the lithologies and/or deformation structures are discussed in the following subsections.
3.2.1. Positive Spikes
Positive MCN spikes of 3–30 cm thickness are present throughout the hole. They are relatively rare in the shallower facies, but frequent below the décollement zone of the Lower Shikoku Basin facies (Figure 3). These positive spikes mainly represent lithologies other than mud or mudstone. For example, positive spikes in the trench-to-basin facies and the Upper Shikoku Basin facies are about 5–10 cm thick and some of them correspond to whitish discolored intervals and healed faults (Figures 6, 7). Below the décollement zone of the Lower Shikoku Basin facies, some large positive spikes correspond to the hydrothermal alternation of sediments (Figure 8) or the mineral veins filling fractures or faults.
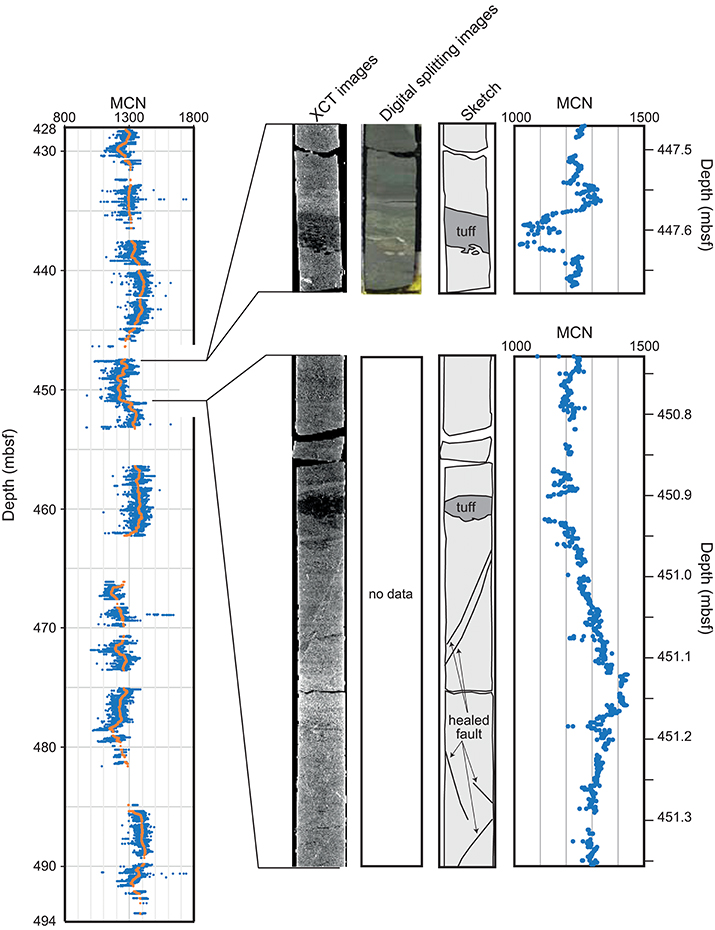
Figure 6. Downhole quality-controlled MCN profile of the trench-to-basin facies (428.0–494.0 mbsf). Orange plots are 500-slices moving averages of MCN. XCT images, digital splitting images, sketches and close up MCN profiles around typical negative (core C0023A-20R-1, 48–67 cm) and positive spikes (from core C0023A-20R-3, 116 cm to core C0023A-20R-4, 52 cm) of the facies are shown.
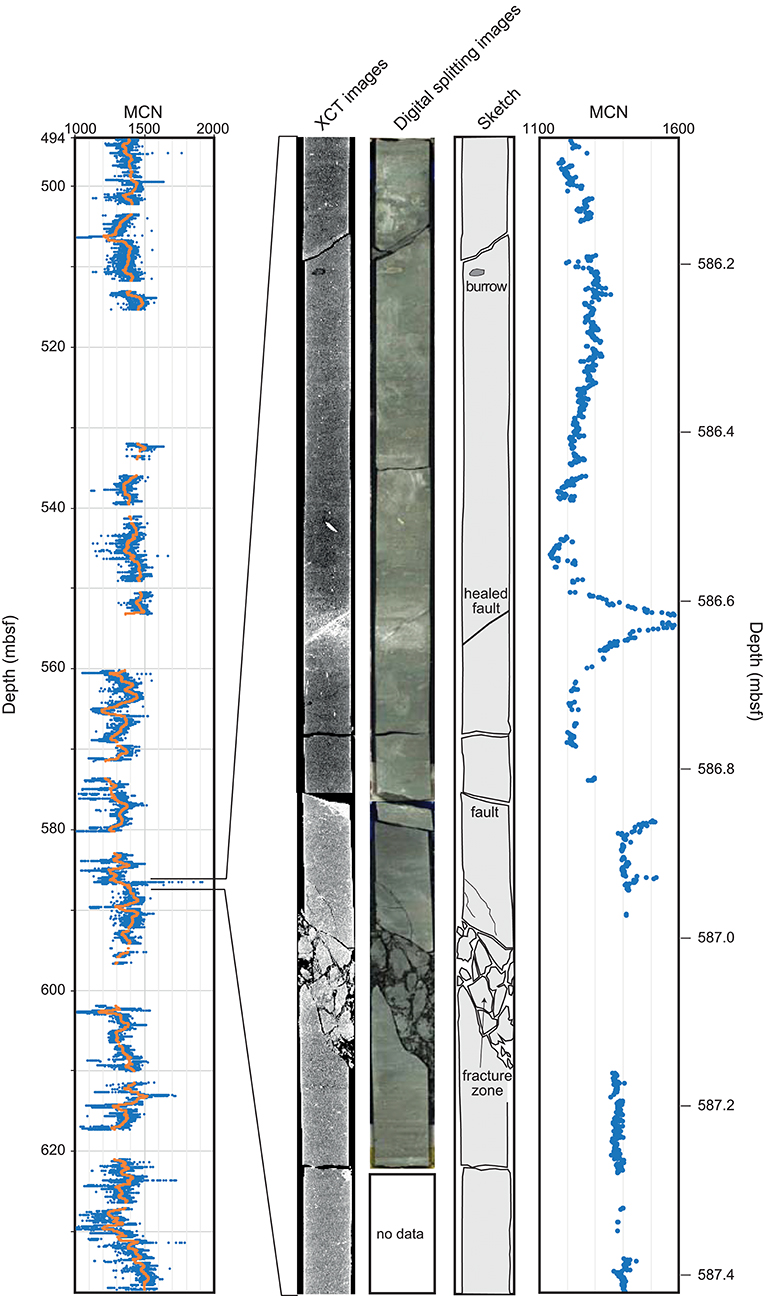
Figure 7. Downhole quality-controlled MCN profile of the Upper Shikoku Basin facies (494.0–637.3 mbsf). Orange plots are 500-slices moving averages of MCN. XCT images, digital splitting images, a sketch and a close up MCN profile of an abrupt increase around a positive spike are shown (from core C0023A-36R-3, 64 cm to core C0023A-36R-4, 57 cm).
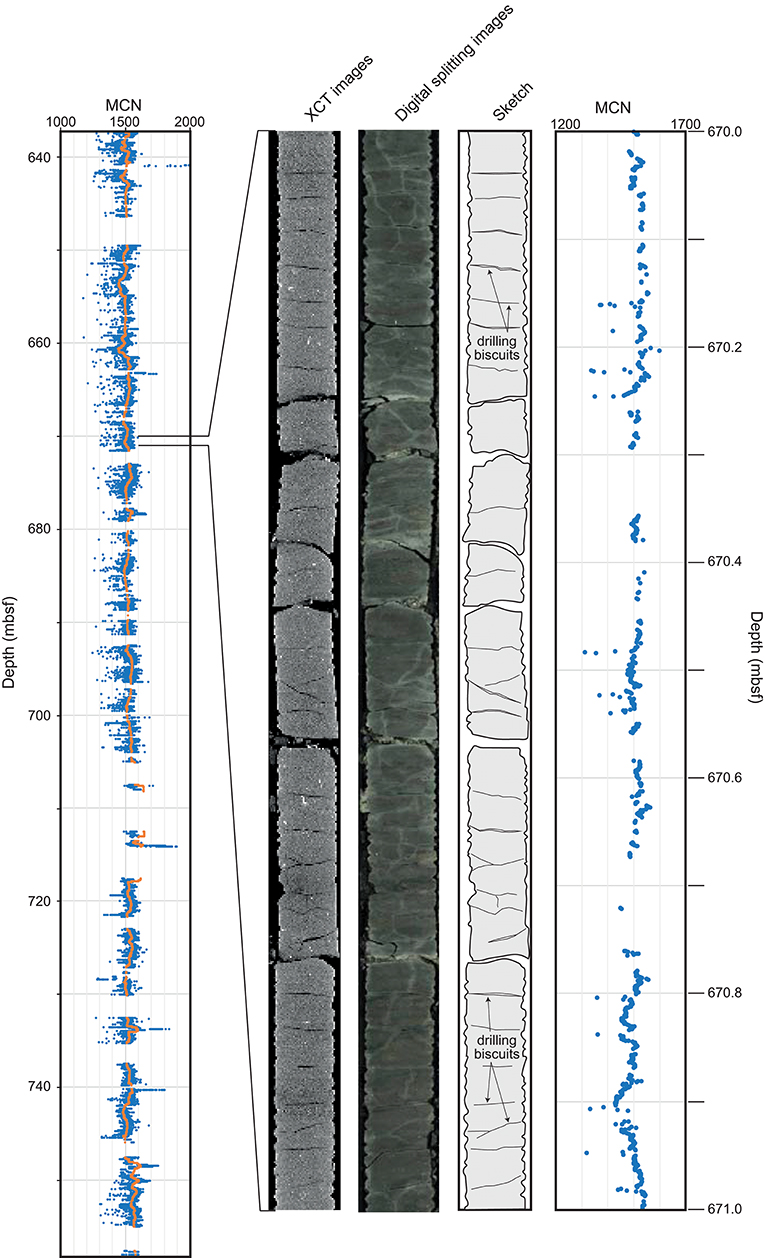
Figure 8. Downhole quality-controlled MCN profile of the shallower part of the Lower Shikoku Basin facies (637.3–758.2 mbsf). Orange plots are 500-slices moving averages of MCN. Selected XCT images, digital splitting images, a sketch and a close up MCN profile of the interval where there are tiny negative anomalies corresponding to drilling biscuits are shown (from core C0023A-45R-2, 29-129 cm).
In the case of intervals logged as hydrothermally altered sediments, their radiodensities are notably higher (Figure 5). In these intervals authigenic or epigenetic heavy-mineral assemblages (pyrite, barite, anhydrite, rhodochrosite, etc.), fill pores and fractures or replace specific sedimentary structures e.g., burrows (Heuer et al., 2017b). CT numbers of such heavy-minerals are usually much higher than those of the dominant rock forming minerals because of their higher grain densities. When a greater part of a CT slice comprises heavy-mineral assemblages, the MCN of the slice becomes significantly higher than the maximum threshold for a quality-controlled MCN profile (3,000 in this study) and is removed from the profile. However, if these mineral phases and individual crystals constitute a small volume, for example a volume less than a voxel, the MCN of the slice will reflect the CT number of the other rock forming minerals as well as the authigenic mineral phases and thus range between the MCN of the slices and the maximum threshold. As a result, the slice will make a positive anomaly and in most instances it will still be present in the quality-controlled radiodensity profile based on MCN.
3.2.2. Negative Spikes
Negative spikes in the radiodensity profile 3–30 cm thick are notable in the trench-to-basin facies and the Upper Shikoku Basin facies (Figures 3, 6, 7). These negative spikes are typically around 5–10 cm thick with MCNs less than 1,100 and correspond to tuffaceous rocks. The MCN profiles above and below the negative spikes often show no great change with depth. However, intervals above negative spikes exhibit a decrease of 50–200 downwards toward the spikes. At 560.0–587.2 mbsf and 624.0–631.0 mbsf, many negative spikes are observed, and other MCNs in the intervals are also slightly lower than that of other intervals within the same facies (Figure 6).
The CT slices comprised of tuffaceous rocks show lower MCNs (Figure 5) due to the higher porosities, and thus, lower bulk densities. Bulk densities of the tuffaceous rocks in the trench-to-basin and the Upper Shikoku Basin facies are 1.80–1.90 g/cm3 and obviously lower than that of adjacent mud or mudstone (1.88–2.20 g/cm3) (Heuer et al., 2017b). In the acidic volcaniclastic facies and the deeper part of Lower Shikoku Basin facies, bulk densities of the tuffaceous rocks are 2.18–2.40 g/cm3 which is lower than that of adjacent lithologies, although data in this interval is sparse. Thus, the CT numbers of the tuffaceous rocks are lower than that of the muds or mudstones, and are often lower than the quality threshold of the interval. As a result, CT slices comprising tuffaceous rocks may have lower SQ and may be classified as under-threshold. Even if they pass the SQ filtering, they show lower MCNs than adjacent slices and can be seen as negative spikes within the quality-controlled MCN profile (Figure 6).
3.2.3. Abrupt Downhole Increases or Decreases
Abrupt downhole increases or decreases of 30–200 in the MCN value are prominent in the trench-to-basin facies and the Upper Shikoku Basin facies (Figures 3, 6, 7). For example, CT images show faulting from 450.95 to 451.1 mbsf and the MCNs abruptly increase with depth from 1,200 to 1,300 through the fault (Figure 6). Another example is found immediately above a fracture zone at 586.8 mbsf (can be seen in CT images), where MCNs abruptly increase with depth from 1,200 to 1,400 (Figure 7). The detailed shape of some excursion in radiodensity profile are unclear because of lack of core recovery and slices that pass quality-control protocol. But in other intervals change and excursions in MCN are abrupt, and occur across distances of a few tenths of centimeters, and can clearly be shown to correspond to faults. In the region below the décollement zone, within the Lower Shikoku Basin facies, there are several abrupt increases in MCN with depth, for example 1034.4–1035.6 mbsf and 1047.0–1050.5 mbsf. Such increases in radiodensity correspond with occurrences of mudstones with a calcareous matrix, indicating cementation of intraformational breccias.
The abrupt changes of MCNs with depth are geologically meaningful. Based on the correlation between bulk density and MCN of Site C0023 measurements (Equation 3), a MCN value of one is roughly comparable to about 0.001 g/cm3. Inazaki et al. (1995) indicated that the precision of bulk density measurements estimated from the CT number is better than ±0.02 g/cm3 on a medical X-ray CT system (TCT-700S) at 120 kV/55–200 mA. The abrupt changes at Site C0023 range from 30 to 200 in MCN (i.e., CT number), which roughly corresponds to 0.03–0.20 g/cm3 . Therefore, they are statistically significant and reflect true material changes.
Lithological boundaries that are sedimentary or deformational in origin might be expected to cause sudden jumps in radiodensity profile. At Site C0023 few such jumps are evident, but there are many abrupt changes that correspond to fracture assemblages or fracture zones. Some of these assemblages or zones accompany lithological changes as mentioned above. In addition, faults with vertical displacement, some of which accompanied with fractures, could also generate MCN (i.e., bulk density) gaps. Such vertical displacement and accompanied lithological changes probably cause the abrupt MCN-changes in the site. There are also fracture zones without significant MCN-changes, and a lack of response in the radiodensity profile may be due to a small vertical displacement for the zones concerned.
The deposition or redeposition of sediments by mass transport may also bring about sedimentary horizons that record abrupt changes in a downhole MCN profile. Mass transport deposits are reported from the Nankai Trough (e.g., Strasser et al., 2011; Kitamura and Yamamoto, 2012), and this is indeed the likely mode of emplacement for many of the tuffaceous rocks at the site (Heuer et al., 2017b). However, no thick mass transport deposits which might be expected to cause formation-scale changes in bulk density have been observed during visual core inspection of Site C0023, and thus significant perturbations of downhole MCN profile cannot be demonstrated in this case.
3.2.4. Intervals With Tiny Cyclic Negative Anomalies
Intervals with tiny cyclic negative anomalies in the MCN profile are noticeable in the shallower part of the Lower Shikoku Basin facies (Figure 8), but they can also be seen in some hydrothermally altered sediments in the deeper part of the Lower Shikoku Basin and in the acidic volcaniclastic facies. These anomalies are in 5–30 cm intervals and correspond to the presence of drilling biscuits (Figure 8). Drilling biscuits are drilling-induced discrete blocks typically several centimeters thick (Leggett, 1982) and are identified by their cyclic separation and the presence of circular striations at the top and the bottom of the core pieces (biscuits). The biscuits often sit in a matrix of mud which results from grinding of the biscuits. The mud that fills the gaps between biscuits has a lesser radiodensity than the biscuits. Although the CT slices measured within the mud-filled fractures were mostly identified by SQ and filtered, some of them pass the filtering because of small area of the mud-fill (less than 1% of the slice) and form tiny cyclic negative excursions (Figure 8).
3.3. Implications
3.3.1. On the Methodology
It can thus be shown that the quality-controlled MCN data yields downhole radiodensity profiles in which lithological and structural features can readily be seen. This implies that fractures (including drilling artifacts) have largely been identified by their SQ and removed because they no longer dominate the radiodensity profile. Consequently, SQ is an effective measure to evaluate the quality of core and useful for creating clear and reliable MCN profiles. There are further advantages to using SQ to evaluate core and these are explained below.
Firstly, SQ enables a consistent quality-evaluation of samples that does not rely solely on visual identification of features. Certainly a two- or three-dimensional XCT image can be helpful or even a substitute for visual inspection of core. But even a visual interpretation of core in this way may be too intricate or too complex a job to perform at a level necessary for a high number of small subsamples of core for example. Additionally, different scientists may apply different recognition criteria, or criteria may vary from site to site. SQ is a simplified numerical measures based on relatively consistent criteria, and once it has been trued or calibrated it can be applied by any user to evaluate core quality.
Secondly, XCT data has a high spatial resolution and covers a high volume of sample; higher than both conventional contamination tests and physical property data. The size of a voxel of XCT data in this study is about 0.176 × 0.176 × 0.625 mm. Thus, lithological components and fractures up to a millimeter in size can be detected. The detection and measurement of all fractures this size would be impracticable if only visual confirmation on CT images or by VCD was used.
The third advantage is that the method is quick. In many cases a quick selection of samples is better because it reduces contamination by fluids diffusion through core. Other contamination tests such as using sulfate as a proxy for seawater or PFC concentration take far longer to provide results, and thus are retrospectively applied to screen samples. A method based on XCT requires a relatively short time and is ideal because it is nondestructive and therefore will not forward contaminate samples, and if automated can be applied to screen samples ahead of their potential consideration for further analysis.
Although numerical, the process remains subjective to a certain extent due to the setting of some parameters; the interval range over which SQ-criteria are applied, the processing area of a CT slice, the quality threshold for CT numbers and the selection criteria for over-threshold slices (Figure 1). For example, in the current iteration of the method used for this study, the area of analysis taken from a CT slice is visually selected to take account of variations due to core cutting. However, this approach has an arbitrary element and might be considered non-reproducible. A selection process, applied automatically and based on non-visual criteria, might yield a more objective process with respect to its application to different core, although the choice of one criterion or another is still a subjective decision. Repeated iterations of similar XCT processing methods in different contexts should help identify which criteria are most valid or matter most in a given situation. Choices concerning the area of analysis or other thresholds are effectively choices about the strictness of the level of quality control to be perused, so an alternative perspective would be that flexible criteria permit reasonable adaption to circumstance or purposes (e.g., different users in different circumstances may accept different risks). What is important is that the same set of parameters and same process can be repeated to all cores or samples. The simple and adaptable concept of the method we present is applicable not only to medical XCT data but also potentially micro XCT data. Thus, as the method we present here is applied in different contexts, improvement with respect to processing criteria would be expected.
SQ also allows for an objective assessment of core quality. For example, core quality factor (CQF) can be calculated based on the ratio of over-threshold slices to all slices within a given interval of recovered cores. CQF is convenient to select intervals for sensitive analyses or to consider later drilling conditions.
3.3.2. Geological Implications
The radiodensity gradient (change in MCN with respect to depth) varies by unit or formation-level, dividing the site into several intervals where gradients are similar (Figures 3, 5). Although an accurate analysis is not provided here, some aspects of radiodensity gradient are notable, such as the transition from the trench-to-basin to the Upper Shikoku Basin facies, and from the Upper Shikoku Basin facies to Lower Shikoku Basin facies (Figures 3, 5). The most likely explanation for the change in MCN during the transition from basin to trench facies is the change in sedimentation rate which is significantly higher under trench conditions (Hagino and Expedition 370 Scientists, 2018).
Another noteworthy change in radiodensity gradient occurs around the deepest part of the Lower Shikoku Basin facies (1030.0–1050.0 mbsf). Particularly, in the lower part of the acidic volcaniclastic facies (1121.0–1125.0 mbsf), MCNs abruptly increase with depth and are remarkably higher than in other intervals of the site (Figures 3, 5). Although the sedimentation rate below 1050.0 mbsf is not constrained by age-data, a hemipelagic depositional environment would not be likely to see high rates of sedimentation. In this case it is plausible that a lithological change that has been caused by diagenesis or hydrothermal alteration which involves cementation. The in-situ strength of sediments in this interval was calculated from drilling parameters and shows an abrupt increase with depth below about 1,050 mbsf (Hamada et al., 2018), and this is consistent with a lithological change brought about by cementation.
The downhole quality-controlled MCN profile of Site C0023 evidences high abundances of faults in the trench-to-basin and the Upper Shikoku Basin facies (Figures 3, 6, 7). The presence of abrupt positive and negative shifts suggests that these are both normal faults and thrusts in these facies. Normal faults in these facies were observed within core (Heuer et al., 2017b) and have also been observed in seismic reflection studies seaward of Site C0023 (Heffernan et al., 2004). The seismic sections of the trench-to-basin and the Upper Shikoku Basin facies at Site C0023 are unclear. Fewer thrusts have been described in these facies, and one possibility is a poor recovery of core samples with fault planes or zones. Although Site C0023 is located within the imbricate thrust zone (Moore et al., 2001), frontal thrusts do not significantly penetrate the site. Thus, the thrusts that are observed may be minor thrusts branched from the main frontal thrusts. The many negative abrupt changes in the MCN profile are indicative such minor thrusts.
The MCN profile also implies a concentration of normal faults in the deeper part (below the décollement zone) of the Lower Shikoku Basin facies (Figure 3). Positive abrupt changes are dominant in the interval and correspond to the presence of normal faults within core (Heuer et al., 2017b). Normal faulting developed between the deeper part of the Lower Shikoku Basin facies and the shallower part of the basement around the site, which are speculated to be constrained by ridge topography (Ike et al., 2008). The positive abrupt changes may reflect this normal faulting.
4. Conclusions
XCT data can be used to evaluate the quality of core obtained during scientific drilling and to generate downhole radiodensity profiles. When slice quality (SQ) is used as part of a processing protocol to filter XCT data, there are several benefits:
(1) Numerical evaluation of data quality becomes consistent between cores, formations and sites.
(2) Evaluation of core quality with respect to drilling disturbance becomes a rapid and non-destructive process that can be applied a priori.
(3) Large numbers of core samples can be assessed easily with a high spatial resolution.
When used to process XCT data, SQ provides well-filtered and reliable downhole profiles of quality-controlled mean CT numbers (MCNs). Data processed in this way reflect characteristics of lithologies and deformation structures. For core samples from IODP Site C0023, the MCN profile identifies lithologies, matches physical properties and can measure features meters to millimeters in size. This is potentially transformative because it permits the measurement of high numbers of small features, for example fault-concentrations. Measurement of these small features at high abundances over large distances would not be possible with conventional core logging because of the scales involved. Thus, the quality-controlled MCN data has the potential to provide consistent measures of lithologies and deformation structures.
Data Availability
The datasets generated for this study are available on request to the corresponding author.
Author Contributions
ST, YK, YM, VH, FI, and Expedition 370 Scientist conceived the idea. ST, YK, M-YT, and KI conducted the analyses of the XCT data. ST, YK, M-YT, SB, YuY, and KY participated in the method setup discussion. ST, TH, and NK participated in the comparing XCT data to bulk density data. ST, M-YT, SB, YaY, VH, and Expedition 370 Scientists wrote and edited the manuscript.
Funding
ST acknowledges financial support from IODP Exp.370 After Cruise Research Program, JAMSTEC. M-YT acknowledges funding from the ECORD Research Grant and the Centre for Global Change Science (Toronto). SB acknowledges IODP NERC award NE/P015182/1. VH acknowledges funding of her research by the Cluster of Excellence: The Ocean Floor - Earth's Uncharted Interface and DFG Project Grant HE8034/1-1.
Conflict of Interest Statement
The authors declare that the research was conducted in the absence of any commercial or financial relationships that could be construed as a potential conflict of interest.
Acknowledgments
This research used data provided by the International Ocean Discovery Program (IODP). We are grateful to the IODP and thank crew, drilling team, geologists and lab technicians on Chikyu and the staff of the Kochi Institute for Core Sample Research for supporting IODP 370-operations. We would like to thank Lucia Mancini for handling the editorial process and the three reviewers for submitting their helpful comments and improving the manuscript.
Expedition 370 Scientists
Lena Maeda, Margaret Cramm, Susann Henkel, Kira Homola, Tatsuhiko Hoshino, Akira Ijiri, Hiroyuki Imachi, Masanori Kaneko, Lorenzo Lagostina, Hayley Manners, Harry-Luke McClelland, Kyle Metcalfe, Natsumi Okutsu, Donald Pan, Maija Jocelyn Raudsepp, Justine Sauvage, Florence Schubotz, Arthur Spivack, Tina Treude, Bernhard Viehweger, David T. Wang, Emily Whitaker, Masataka Kinoshita.
References
Ashi, J (1997) “Computed tomography scan image analysis of sediments,” in Proceedings of the Ocean Drilling Program, Scientific Results, eds T. H. Shipley, Y. Ogawa, and P. Blum, Vol. 156 (College Station, TX: Ocean Drilling Program), 151–159.
Fortin, D., Francus, P., Gebhardt, A. C., Hahn, A., Kliem, P., Lisé-Pronovost, A., et al. (2013). Destructive and non-destructive density determination: method comparison and evaluation from the Laguna Potrok Aike sedimentary record. Quat. Sci. Rev. 71, 147–153. doi: 10.1016/j.quascirev.2012.08.024
Hagino, K. (2018). “Data report: calcareous nannofossils from the middle Miocene to Pleistocene, IODP Expedition 370 Site C0023,” in Proceedings of the International Ocean Discovery Program Volume 370 (College Station, TX: International Ocean Discovery Program).
Hamada, Y., Hirose, T., Ijiri, A., Yamada, T., Sanada, Y., Saito, S., et al. (2018). In-situ mechanical weakness of subducting sediments beneath a plate boundary décollement in the Nankai Trough. Prog. Earth Planet. Sci. 5:70. doi: 10.1186/s40645-018-0228-z
Heffernan, A. S., Moore, J. C., Bangs, N. L., Moore, G. F., and Shipley, T. H. (2004). Initial deformation in a subduction thrust system: polygonal normal faulting in the incoming sedimentary sequence of the Nankai subduction zone, southwest Japan. Geol. Soc. Lond. Mem. 29, 143–148. doi: 10.1144/GSL.MEM.2004.029.01.14
Heuer, V. B., Inagaki, F., Morono, Y., Kubo, Y., and Maeda, L. (2017a). International Ocean Discovery Program Expedition 370 Preliminary Report: temperature limit of the deep biosphere off muroto. Int. Ocean Discov. Prog. doi: 10.14379/iodp.pr.370.2017
Heuer, V. B., Inagaki, F., Morono, Y., Kubo, Y., and Maeda, L. (2017b). “Temperature limit of the Deep Biosphere off Muroto,” in Proceedings of the International Ocean Discovery Program, 370 (College Station, TX: International Ocean Discovery Program).
Hounsfield, G. N. (1973). Computerized transverse axial scanning (tomography): part I. Description of system. Brit. J. Radiol. 46, 1016–1022. doi: 10.1259/0007-1285-46-552-1016
Ike, T., Moore, G. F., Kuramoto, S., Park, J., Kaneda, Y., and Taira, A. (2008). Variation in sediment thickness and type along the northern Philippine Sea Plate at the Nankai Trough. Island Arc 17, 342–357. doi: 10.1111/j.1440-1738.2008.00624.x
Inagaki, F., Hinrichs, K. U., Kubo, Y., Bowles, M. W., Heuer, V. B., Hong, W. L, et al. (2015). Exploring deep microbial life in coal-bearing sediment down to 2.5 km below the ocean floor. Science 349, 420–424. doi: 10.1126/science.aaa6882
Inazaki, T., Inouchi, Y., and Nakano, T. (1995). Use of medical X-ray CT scanner for nondestructive and quantitative analysis of lake sediments. Bull. Geol. Surv. Jpn. 46, 629–642.
Johns, R. A., Steude, J. S., Castanier, L. M., and Roberts, P. V. (1993). Nondestructive measurements of fracture aperture in crystalline rock cores using X ray computed tomography. J. Geophys. Res. 98, 1889–1900. doi: 10.1029/92JB02298
Ketcham, R. A., and Carlson, W. D. (2001). Acquisition, optimization and interpretation of X-ray computed tomographic imagery: applications to the geosciences. Comput. Geosci. 27, 381–400. doi: 10.1016/S0098-3004(00)00116-3
Kitamura, Y., and Yamamoto, Y. (2012). “Records of submarine landslides in subduction input recovered by IODP Expedition 322, Nankai Trough, Japan,” in Submarine Mass Movements and Their Consequences, Vol. 31. Advances in Natural and Tecnological Hazards Research, eds Y. Yamada, K. Kawamura, K. Ikehara, Y. Ogawa, R. Urgeles, D. Mosher, J. Chaytor, and M. Strasser (Dordrecht: Springer), 659–670.
Leggett, J. K. (1982). 18. Drilling-induced structures in Leg 66 Core. Init. Reports Deep Sea Drilling Project 66, 531–538.
Mees, F., Swennen, R., Geet, M. V., and Jacobs, P. (2003). Applications of X-ray computed tomography in the geosciences. Geol. Soc. Lond. Spec. Publ. 215, 1–6. doi: 10.1144/GSL.SP.2003.215.01.01
Moore, G. F., Taira, A., Klaus, A., Becker, L., Boeckel, B., Cragg, B. A., et al. (2001). New insights into deformation and fluid flow processes in the Nankai Trough accretionary prism: results of Ocean Drilling Program Leg 190. Geochem. Geophys. Geosyst. 2:2001GC000166. doi: 10.1029/2001GC000166
Nakashima, Y., and Kamiya, S. (2007). Mathematica programs for the analysis of three-dimensional pore connectivity and anisotropic tortuosity of porous rocks using X-ray computed tomography image data. J. Nucl. Sci. Technol. 44, 1233–1247. doi: 10.1080/18811248.2007.9711367
Nomaki, H., Toyofuku, T., Tsuchiya, M., Matsuzaki, T., Uematsu, K., and Tame, A. (2015). Three-dimensional observation of foraminiferal cytoplasmic morphology and internal structures using uranium–osmium staining and micro-X-ray computed tomography. Mar. Micropaleontol. 121, 32–40. doi: 10.1016/j.marmicro.2015.09.003
Orsi, T. H., and Anderson, A. L. (1999). Bulk density calibration for X-ray tomographic analyses of marine sediments. Geo-Marine Lett. 19, 270–274. doi: 10.1007/s0036700501
Orsi, T. H., Edwards, C. M., and Anderson, A. L. (1994). X-ray computed tomography: a nondestructive method for quantitative analysis of sediment cores. J. Sediment. Res. A 64, 690–693.
Radon, J. (1917). Über die Bestimmuug von Funktionen durch ihre Integralwerte längs gewisser Mannigfaltigkeiten. Berichte der Sächsischen Akadamie Wissenschaft 69, 262–277.
Radon, J. (1986). On the determination of functions from their integral values along certain manifolds. IEEE Trans. Med. Imaging MI-5, 170–176. doi: 10.1109/TMI.1986.4307775
Reilly, B. T., Stoner, J. S., and Wiest, J. (2017). SedCT: MATLABTM tools for standardized and quantitative processing of sediment core computed tomography (CT) data collected using a medical CT scanner. Geochem. Geophys. Geosyst. 18, 3231–3240. doi: 10.1002/2017GC006884
Row, T. (1996). Coevolution of the mammalian middle ear and neocortex. Science 273, 651–654. doi: 10.1126/science.273.5275.651
Schneider, C. A., Rasband, W. S., and Eliceiri, K. W. (2012). NIH Image to ImageJ: 25 years of image analysis. Nat. Methods 9, 671–675. doi: 10.1038/nmeth.2089
Støren, E. N., Dahl, S. O., Nesje, A., and Paasche, Ø. (2010). Identifying the sedimentary imprint of high-frequency Holocene river floods in lake sediments: development and application of a new method. Quat. Sci. Rev. 29, 3021–3033. doi: 10.1016/j.quascirev.2010.06.038
Strasser, M., Moore, G. F., Kimura, G., Kopf, A. J., Underwood, M. B., Guo, J., et al. (2011). Slumping and mass transport deposition in the Nankai fore arc: evidence from IODP drilling and 3-D reflection seismic data. Geochem. Geophys. Geosyst. 12:Q0AD13. doi: 10.1029/2010GC003431
Tanaka, A., Nakano, T., and Ikehara, K. (2011). X-ray computerized tomography analysis and density estimation using a sediment core from the Challenger Mound are in the Porcupine Seabight, off Western Ireland. Earth Planet. Space 63, 103–110. doi: 10.5047/eps.2010.12.006
Ujiie, K., Maltman, A. J., and Sánchez-Gómez, M. (2004). Origin of deformation bands in argillaceous sediments at the toe of the Nankai accretionary prism, southwest Japan. J. Struct. Geol. 26, 221–231. doi: 10.1016/j.jsg.2003.06.001
Underwood, M. B. (2018). The origin of strata within the inner accretionary prism of Nankai Trough: evidence from clay mineral assemblages along the NanTroSEIZE transect. Island Arc 27:e12252. doi: 10.1111/iar.12252
Uramoto, G., Morono, Y., Uematsu, K., and Inagaki, F. (2014). An improved sample preparation method for imaging microstructures of fine-grained marine sediment using microfocus X-ray computed tomography and scanning electron microscopy. Limnol. Oceanogr. Method 12, 469–483. doi: 10.4319/lom.2014.12.469
Van Geet, M., Swennen, R., and Wevers, M. (2000). Quantitative analysis of reservoir rocks by microfocus X-ray computerised tomography. Sediment. Geol. 132, 25–36. doi: 10.1016/S0037-0738(99)00127-X
Watanabe, N., Ishibashi, T., Ohsaki, Y., Tsuchiya, Y., Tamagawa, T., Hirano, N., et al. (2011). X-ray CT based numerical analysis of fracture flow for core samples under various confining pressures. Eng. Geol. 123, 338–346. doi: 10.1016/j.enggeo.2011.09.010
Keywords: X-ray computed tomography, scientific drilling, International Ocean Discovery Program, Nankai Trough, accretionary complex
Citation: Tonai S, Kubo Y, Tsang M-Y, Bowden S, Ide K, Hirose T, Kamiya N, Yamamoto Y, Yang K, Yamada Y, Morono Y, Heuer VB, Inagaki F and Expedition 370 Scientists (2019) A New Method for Quality Control of Geological Cores by X-Ray Computed Tomography: Application in IODP Expedition 370. Front. Earth Sci. 7:117. doi: 10.3389/feart.2019.00117
Received: 19 February 2019; Accepted: 06 May 2019;
Published: 31 May 2019.
Edited by:
Lucia Mancini, Elettra Sincrotrone Trieste, ItalyReviewed by:
Richard Ketcham, University of Texas at Austin, United StatesAlessandro Maria Michetti, University of Insubria, Italy
Miller Zambrano, University of Camerino, Italy
Copyright © 2019 Tonai, Kubo, Tsang, Bowden, Ide, Hirose, Kamiya, Yamamoto, Yang, Yamada, Morono, Heuer, Inagaki and Expedition 370 Scientists. This is an open-access article distributed under the terms of the Creative Commons Attribution License (CC BY). The use, distribution or reproduction in other forums is permitted, provided the original author(s) and the copyright owner(s) are credited and that the original publication in this journal is cited, in accordance with accepted academic practice. No use, distribution or reproduction is permitted which does not comply with these terms.
*Correspondence: Satoshi Tonai, cy10b25haUBrb2NoaS11LmFjLmpw
 Satoshi Tonai
 Yusuke Kubo3
 Man-Yin Tsang
 Stephen Bowden
 Kiho Yang
 Yasuhiro Yamada
 Yuki Morono
 Verena B. Heuer
 Fumio Inagaki