 Christopher S. Lowry
 Michael N. Fienen2
 Damon M. Hall
- 1Department of Geology, University at Buffalo, Buffalo, NY, United States
- 2Upper Midwest Water Science Center, United States Geological Survey, Middleton, WI, United States
- 3School of Natural Resources, Department of Biomedical, Biological and Chemical Engineering, University of Missouri, Columbia, MO, United States
- 4Rubenstein School of Environment and Natural Resources, University of Vermont, Burlington, VT, United States
Citizen science-based approaches to monitor the natural environment tend to be bimodal in maturity. Older and established programs such as the Audubon’s Christmas bird count and Community Collaborative Rain, Hail, and Snow Network (CoCoRaHS) have thousands of participants across decades of observations, while less mature citizen science projects have shorter lifespans often focused on local or regional observations with tens or hundreds of participants. For the latter, it can be difficult to transition into a more mature and sustainable citizen science-based research program. This paper focuses on this transition by evaluating CrowdHydrology (ca. 2010), a citizen science project that has transitioned from a regional to national network. It evaluates the data accuracy, citizen participation, and station popularity. The CrowdHydrology network asks citizens to send in text messages of water levels in streams and lakes, which has resulted in 16,294 observations submitted by over 8,000 unique participants at 120 unique locations. Using water level data and participation records from CrowdHydrology, we analyze the expansion and citizen participation from a regional to national citizen science network. We identify barriers to participation and evaluate why some citizen science observation stations are popular while others are not. We explore our chosen contributory program model for CrowdHydrology and the influence this model has had on long-term participation. Results demonstrate a highly variable rate of contributions of citizen scientists. This paper proposes hypotheses on why many of our observations are from one-time participants and why some monitoring stations are more popular than others. Finally, we address the future expansion of the CrowdHydrology network by evaluating successful monitoring locations and growing interest of watershed groups to expand the network of gauges.
Introduction
In developing new methods for analyzing and monitoring natural hazards, citizen science can be a powerful tool to collect critical environmental observations for both research and long-term monitoring. While, citizen science may lack technical rigor, which can cause professional scientists to use caution in adopting these methods, the time has come to reevaluate our current scientific paradigm. Under a changing climate we expect rising sea levels and higher intensity storm events in addition to longer droughts, which pose increased risk to humans and directs us as professional scientists to look to new methods for monitoring environmental change. Among scientific revolutions, technology is a consistent driver in paradigm shifts (Kuhn, 1962). With the advancements in computing and seamless flow of information between professional scientists, the scientific field has benefited by exponential growth (Szalay and Gray, 2006). It can be argued this growth further increases the gap between professional scientists and some sectors of the general public (Gauchat, 2012). Yet, the underlying driver of advancements in technology is not exclusive to professional science. Over 77 percent of the general public now hold high powered computer processors and advanced telemetry systems in the palm of their hands in the form of smartphones, with 95 percent of the population in the United States owning some form of mobile phone (Pew Research Center, 2018). Professional scientists have an opportunity to embrace the power of technologically advanced citizen science-based observers. While opportunities in citizen science-based observation networks are not new, it is time scientists recognize and learn how to tap into the potential.
As a methodology for collecting environmental data, citizen science spans the continuum from qualitative to quantitative measurement techniques. One of the most successful research projects using qualitative measurements by citizen scientists involves ground verification of precipitation using the mobile phone applications mPing (Elmore et al., 2014). This class of techniques termed “qualitative guided” measurements, uses phone-based applications that ask participants to describe the current atmospheric conditions and submit these observations, which are georeferenced and time stamped, to a central database. A related use of citizen observations is termed “qualitative binary,” where participants are asked to identify binary phenomenon such as if a stream is flowing or dry (i.e., Kampf et al., 2018)1. These qualitative guided and binary techniques are used primarily as tools for data validation. In contrast to these, CoCoRaHS is one of the most successful citizen science projects engaging over 7,000 observers daily to measure precipitation across the United States (Cifelli et al., 2005). Citizens use standardized rain gauge and snow platforms to report precipitation totals. This method can be classified as “quantitative guided” because it requires some sort of training (e.g., videos) and active participation by citizen scientists. Other quantitative guided projects include measures of stream nutrient or pesticide concentrations (Breuer et al., 2015), and water clarity (Lottig et al., 2014, Canfield et al., 2016). There is also a classification termed “quantitative passive,” where citizen scientists may not initially realize they are collecting quantitative data. These projects include data mining of social media channels such as YouTube to collect observations of streamflow (Le Coz et al., 2016) or water levels (Michelsen et al., 2016). Quantitative passive data collection can also include citizen scientists who agree to have instruments installed on their phones or property that passively collect scientific data. Quantitative passive collection can include private wells owners installing water level sensors (Little et al., 2016) or internet enabled weather stations (Bell et al., 2013), which can then be shared in real-time with the scientific community.
Given the context to the range of methods available in citizen science-based data collection, the objectives of this research are to assess what factors support the growth and sustainability of a citizen science program. Our primary hypothesis is that a strong citizen science network is maintained by a core group of engaged citizen scientists who are brought together by a locally relevant scientific question. Our secondary hypothesis proposes that a critical mass of observations and/or measurement stations are needed to build sufficient public interest to maintain a sustainable network. We test these hypotheses by reviewing participation in the CrowdHydrology program (Lowry and Fienen, 2013), to determine what allows a citizen science-based observation network to grow from a small set of observation stations to a national or international network. While it is easy to start a citizen science research program, it is difficult to develop a network of interested participants that is sustainable and has scientific reach beyond a single research project. While there are a few successful large-scale programs such as the Audubon Christmas Bird Count (Butcher et al., 1990), CoCoRaHS (Cifelli et al., 2005), and PhenoCam (Richardson et al., 2018), these programs seem to be the exception to the thousands of smaller projects cataloged on citizen science databases such as SciStarter.com. This paper evaluates participation in CrowdHydrology, a hydrology-based citizen science program that has successfully made it past the initial network development phase and is now reaching maturity. It explores the rates of participation and the successful and not so successful methods in collecting hydrologic data. We quantitatively evaluate participation rates of citizen scientists and qualitatively explore reasons behind these figures such as why some observation locations seem to be popular while other are not. The aim is to support other citizen science-based observation networks by detailing what we believe are the key components to long-term engagement with citizen scientists for successfully transitioning from local to national-scale projects.
The CrowdHydrology Program
Throughout the United States, there are approximately 7,600 United States Geological Survey gauges placed in rivers and streams gathering a variety of water resources data (stream height, flow, water temperature, and sometimes water quality metrics) for a variety of uses such as forecasting floods, characterizing water quality conditions, monitoring quantity of power production, recreation, culvert design, and wildlife habitat, among others. As Earth’s systems change, these long-term data are critically important to understand, predict, and manage the health of our watersheds for all who depend upon these resources. However, maintaining the quality of long-term data has its costs. One stream gauge station requires about $18,000 to install and $16,000 to $21,000 annually for the United States Geological Survey to service the physical system, perform quality assurance, maintain rating curves converting stage to discharge, and to serve and display these data. Such costs prohibit many streams from being monitored. Data from these–often smaller–streams are essential for hydrologists, fisheries biologists, indigenous tribes, water recreationalists, anglers, natural resources management agencies, and all of the related industries.
To augment formally collected data, could we solicit citizen scientists to collect at least water-level data? While not a replacement for official data, maybe citizen scientists could provide a valuable supplement. To test this, a class A staff gauge was installed at the Buffalo Audubon Society nature center in North Java, NY, United States in 2010 and with a sign that asked passers-by to use their phones to text message the readings (data) to the researchers (Lowry and Fienen, 2013). It worked. These data were then used to model the hydrology of a stream and wetland system using MODFLOW (Feiner and Lowry, 2015). These citizens provided valuable stream-height information where there was none (Seibert and Vis, 2016; van Meerveld et al., 2017). Additional gauges were installed and the network was dubbed CrowdHydrology. Through this monitoring network, crowd-sourced data were presented on a website2. Below, we describe how this one gauge grew into a network of gauges and we assess this growth.
Materials and Methods
To participate in CrowdHydrology, citizen scientists read the water level in streams and ponds on a staff gauge and send in text messages reporting their observed water levels (Lowry and Fienen, 2013). At each physical gauge there are two signs, one on the shore that informs the participant on how they can contribute (Figure 1B) to the project and a second sign at the top of the staff gauge (Figure 1A). The participant is asked to send in a text message of the water level and the station ID to a specific phone number. Once a citizen scientist chooses to participate, their text message is sent via their mobile phone to a central computer server. The central server then runs the Social.Water python code (Fienen and Lowry, 2012), which is open-source and freely available to the public3, that reads and parses each text message. The Social.Water code extracts the time stamp of the observation, water level, and creates a unique identifier (obscuring name and phone number) for each participant based on the participant’s phone number. These data are added to the associated station database. Within a maximum of 5 min of a citizen scientist texting in a water level, their reported water level is published on the web (see text footnote 2) and is available for distribution.
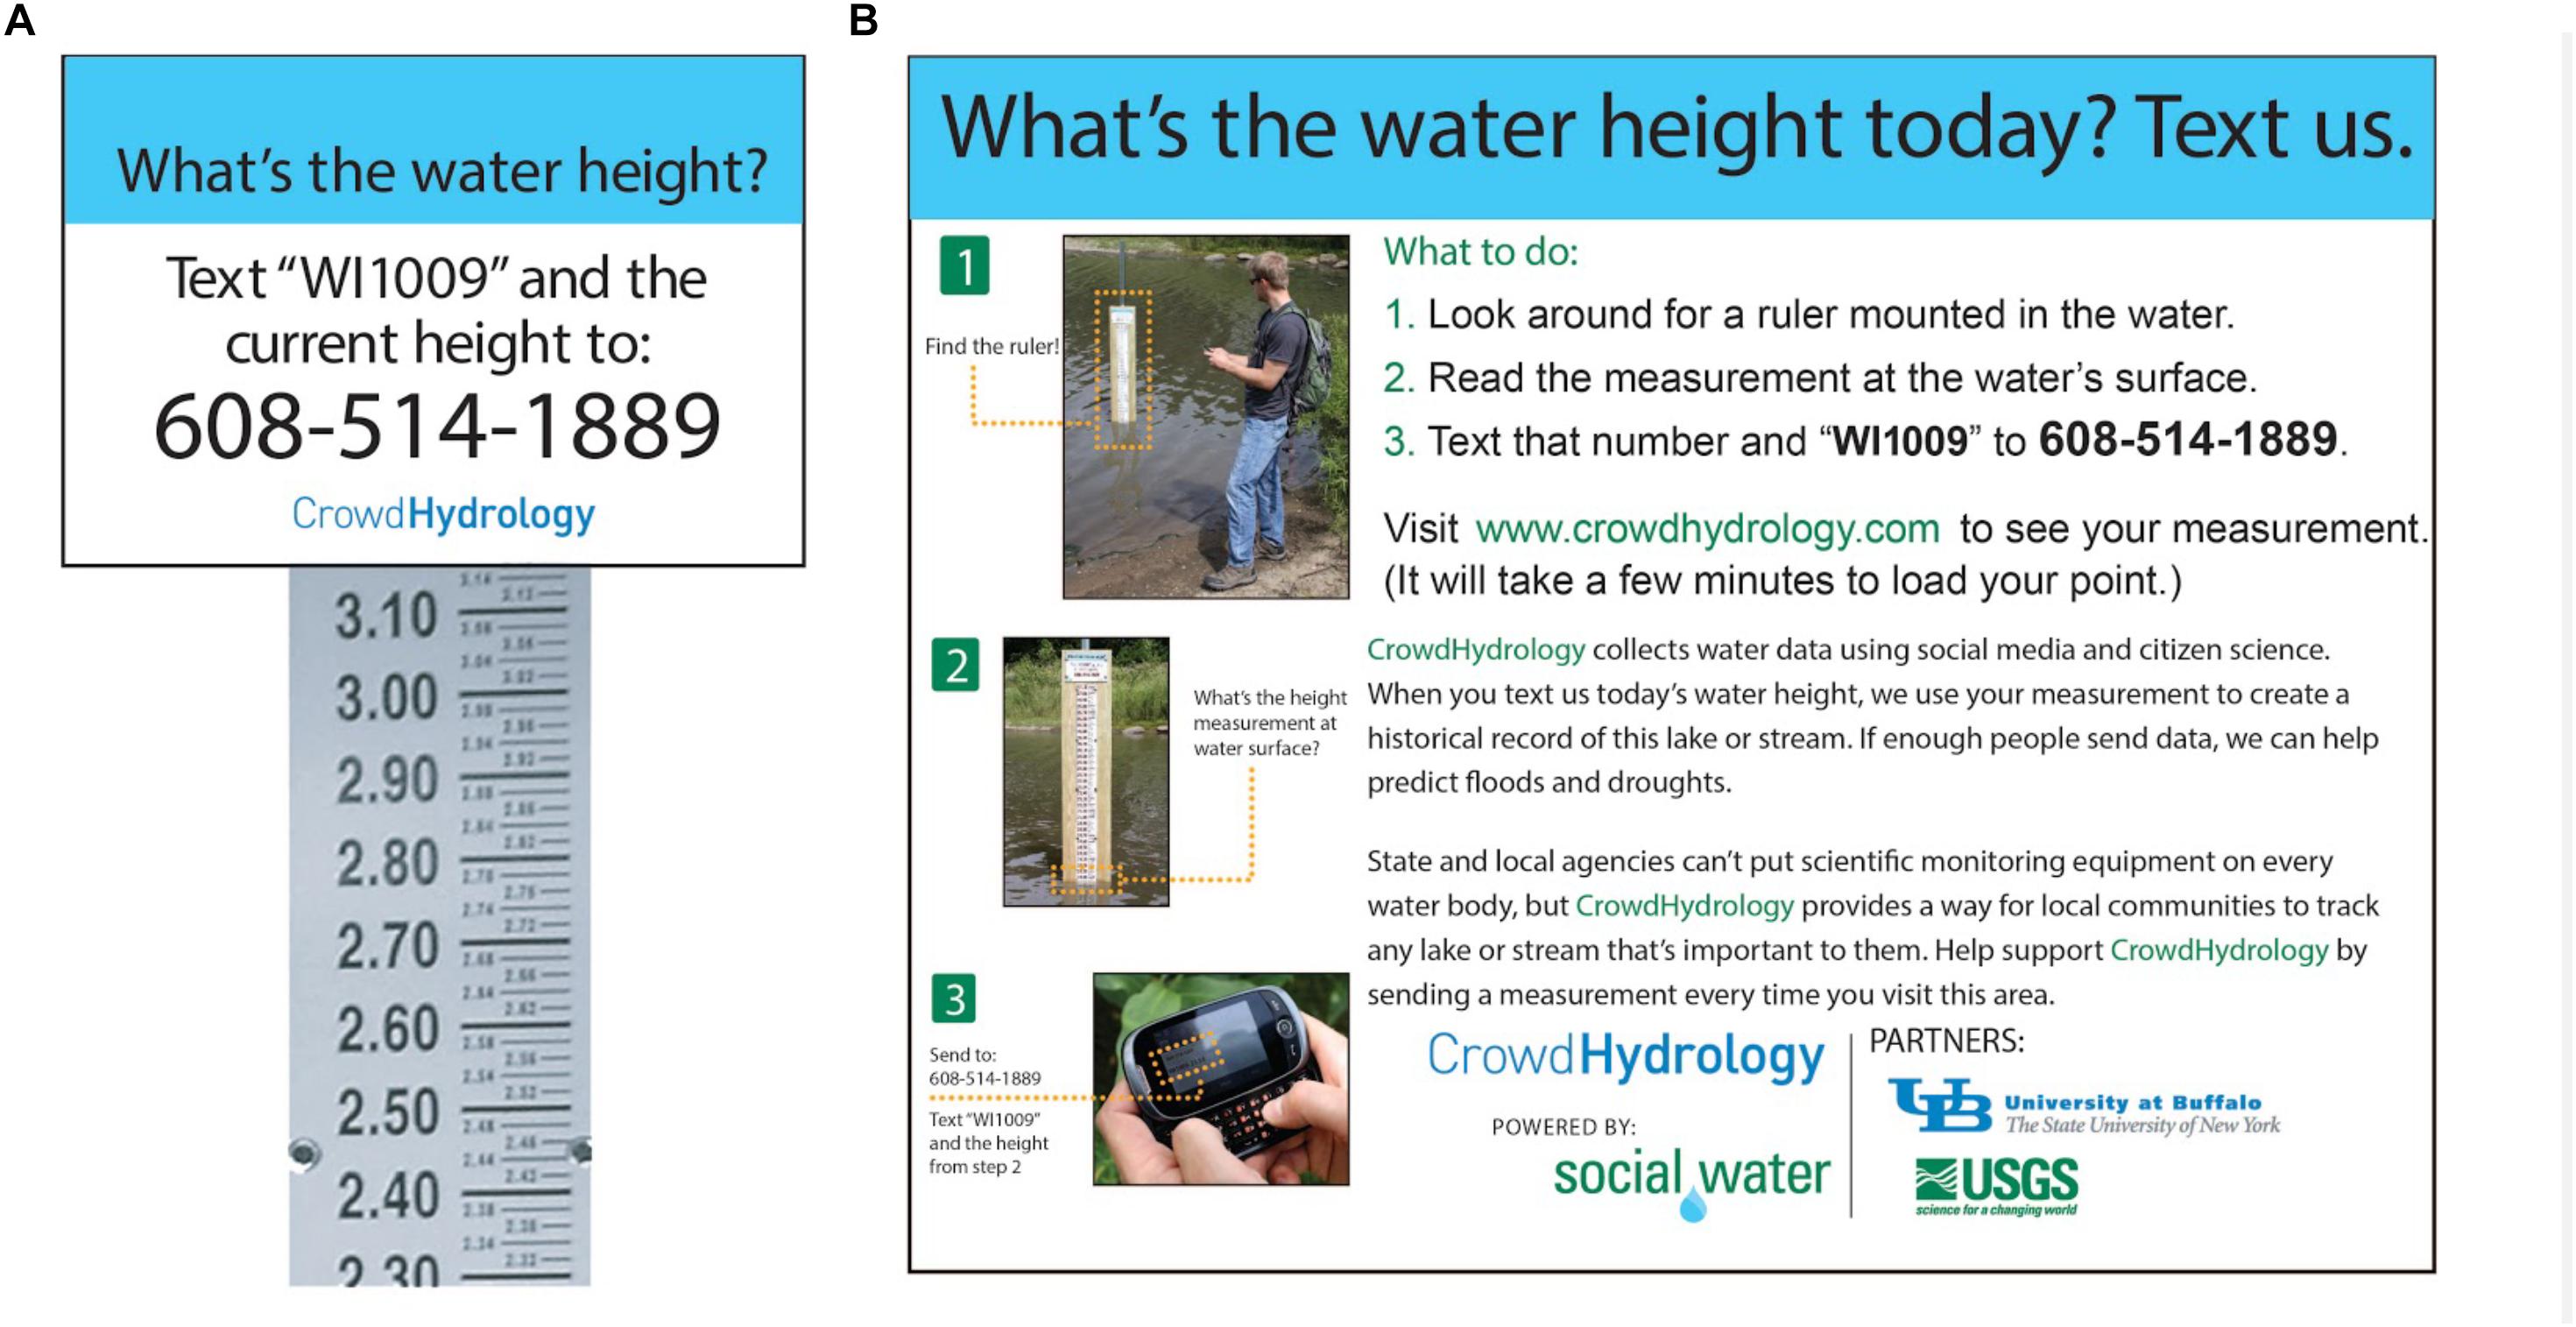
Figure 1. CrowdHydrology informational signage in (A) stream and (B) on shore asking citizen scientists to send in observations of water levels.
The placement of these gauges is critical to citizen science engagement. Popular stream access locations for placing gauges do not always align with professional scientists’ research questions. Often, the placement of one of these gauges depends upon the support of a watershed group or nature center staff to commit to maintaining the station. Early in the project, we spent a significant amount of time trying to get permission to place these stations in streams, but after 8 years in operation most new stations are initiated by partner watershed and environmental groups. Due to the physical location of the original project team, most stations are within the Great Lakes region with limited expansion in the western and eastern United States (Figure 2).
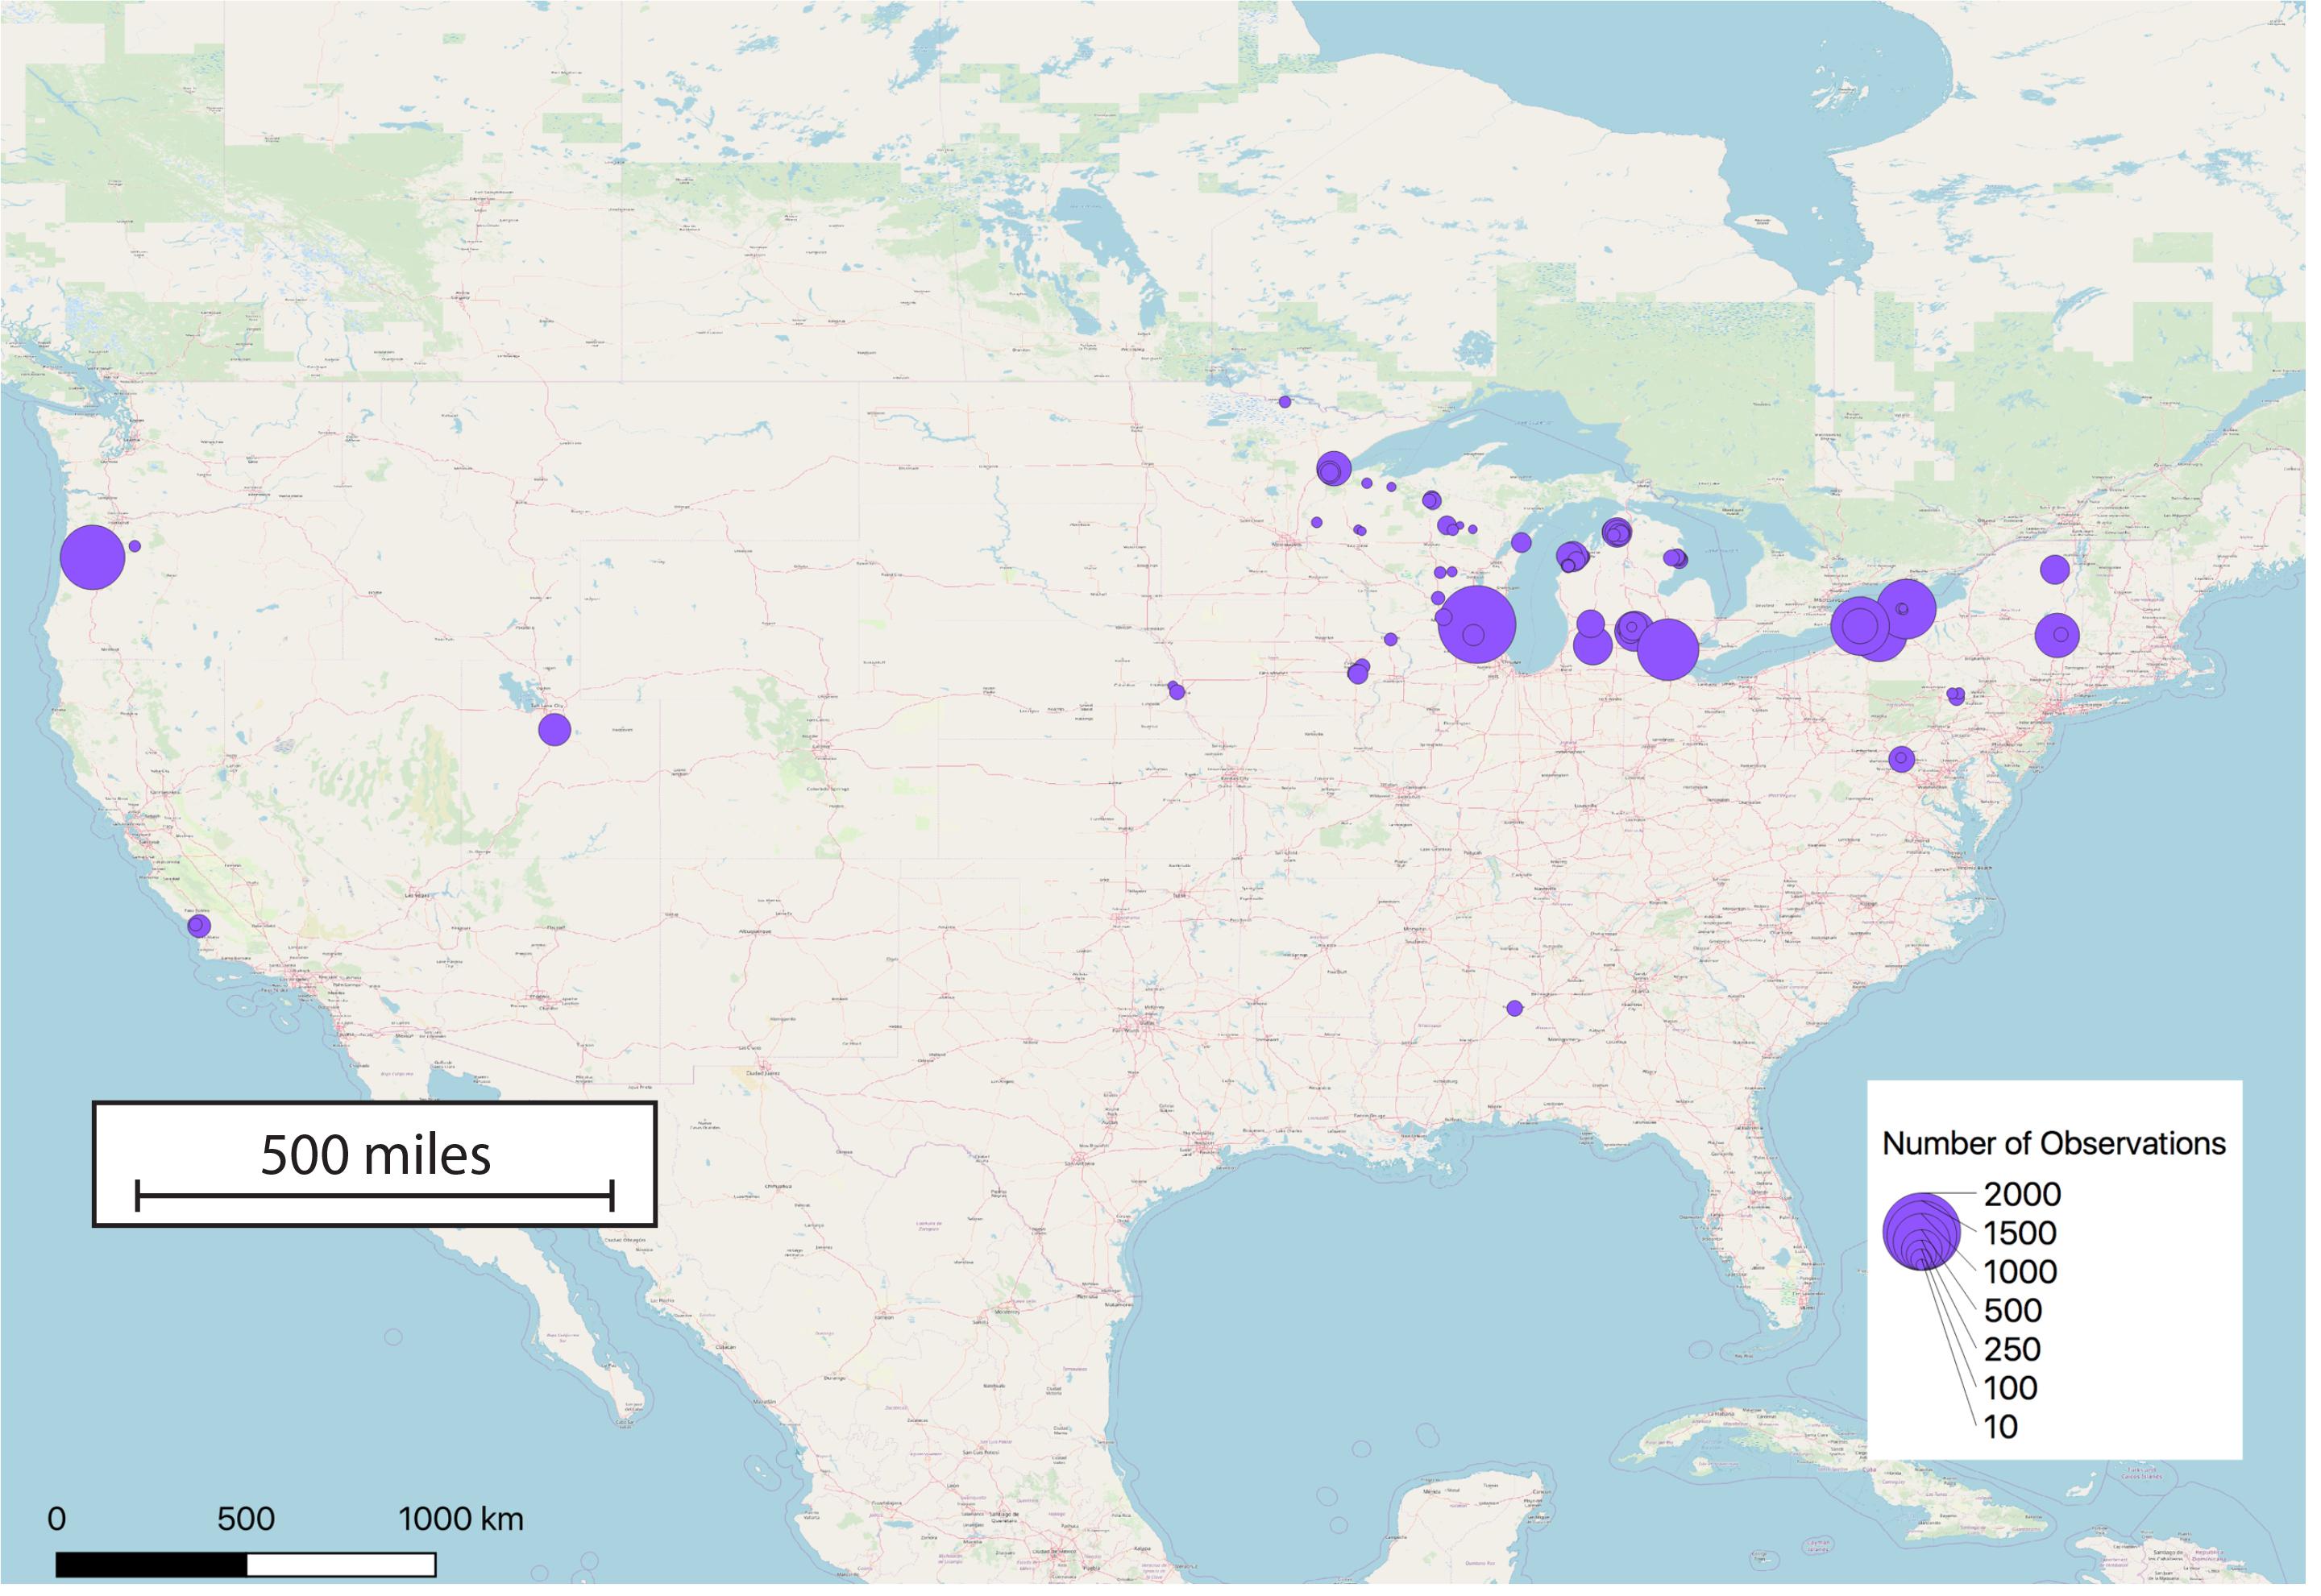
Figure 2. Locations of CrowdHydrology gauges as of July 2018 with the size of the marker indicating the number of citizen science observations.
The methodology of hydrology data collection via this program has been described elsewhere (Fienen and Lowry, 2012; Lowry and Fienen, 2013), and this research focuses on analyzing when and where citizen scientists chose to participate and what conditions are most conducive to their participation. The results presented here are based on citizen observations from approximately 8,000 unique participants over 8 years. These data allow us to identify how often and where a given citizen scientist has chosen to provide an observation, the seasonality of observations, the popularity of given observation stations, and the mobility of participants who send in observations across multiple locations.
Results
From July 2011 to July 2018, the cumulative growth of CrowdHydrology reached 120 stations in 13 states (Figure 3). The first 2 years of the project showed small growth while the network was still a regional network in New York State. The transition to a multi-state network is shown by the state abbreviations on Figure 3, which represent the time when the first new stations in a given state joined the network. Rapid growth in the summer of 2013 likely corresponded with personal networking with several watershed groups in Michigan and a National Public Radio story on Weekend Edition (see NPR marker, Figure 3). Other step increases, such as during the summer of 2016, are attributed to expansion of the network within existing states.
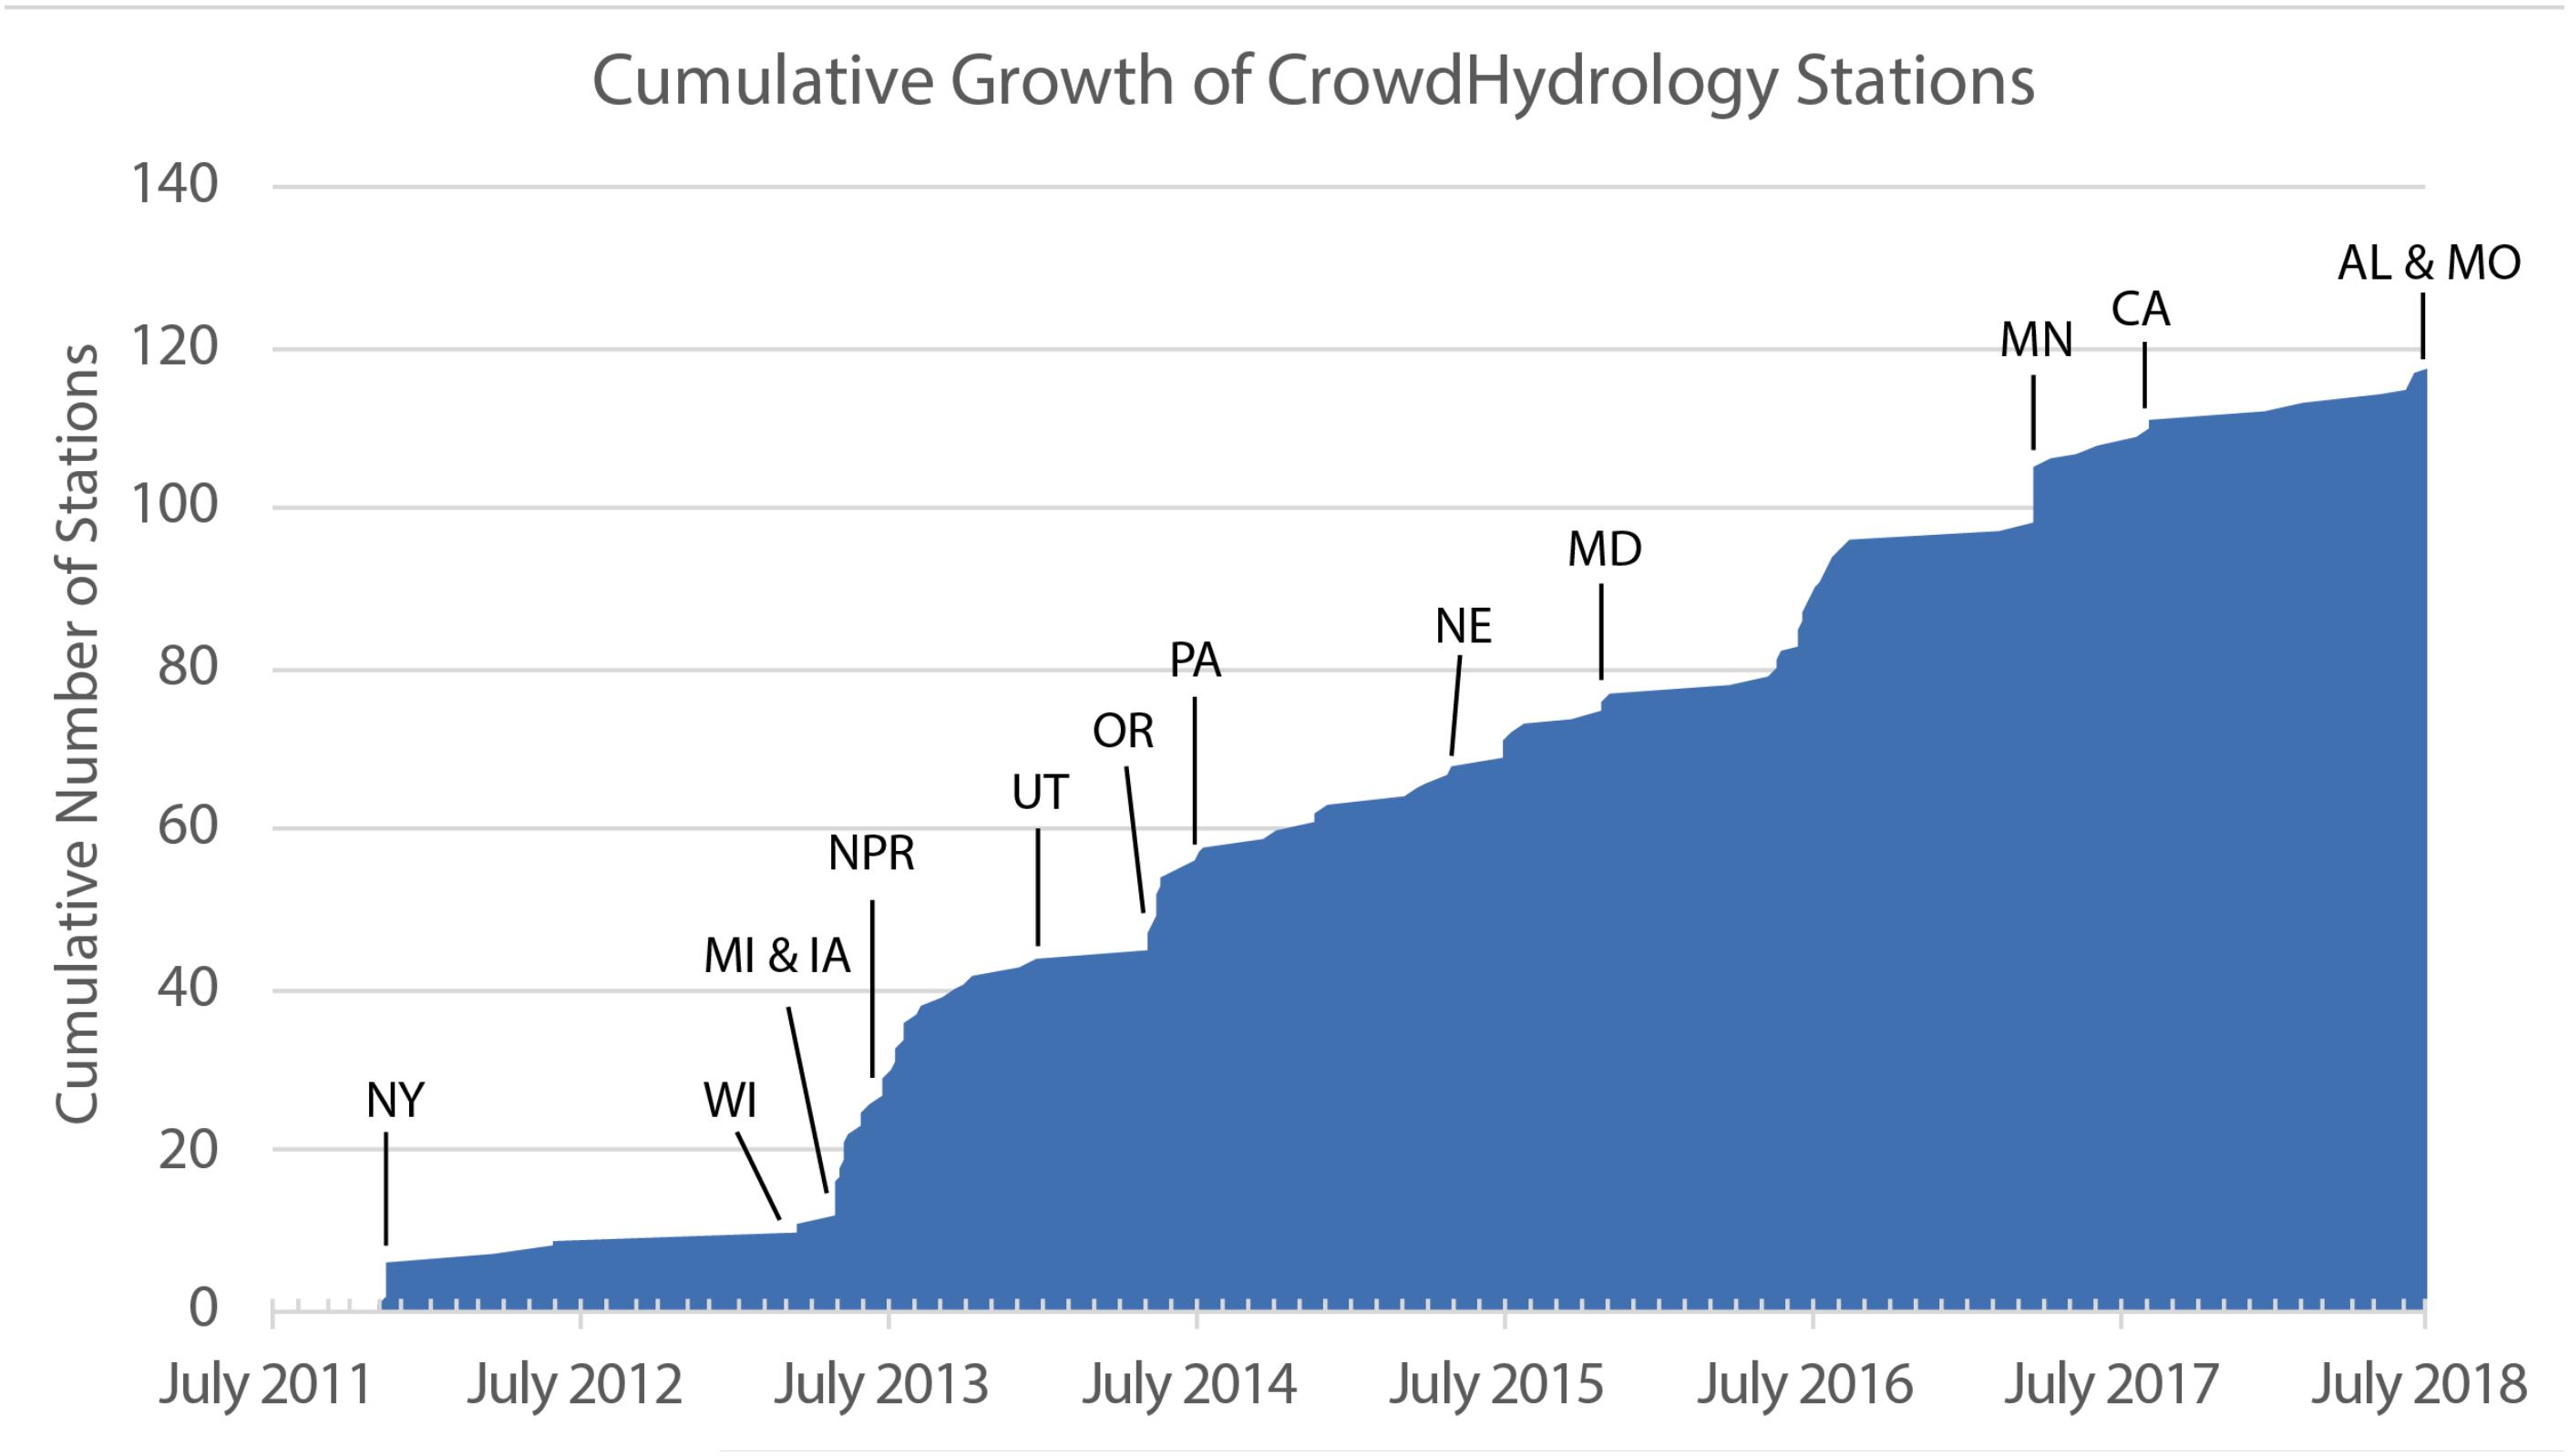
Figure 3. Growth of the CrowdHydrology network. State initials designates the time the first CrowdHydrology station became active. NPR represents date of national radio coverage.
Participants
For the study period, the CrowdHydrology system received 16,294 observations from 8,255 unique participants. The majority (86%) of participants submitted only a single observation (Figure 4). The distribution of the number of observations per participant decreased with increased observations per participant. Eleven people or 0.1% of the citizen scientists sent in over 100 observations. Participants with over 100 observations are classified here as “champions.” While this group of champions was small, they contributed 19% of all observations. Most champions sent in observations for a single site, while only four champions sent in observations at more than one site. The greatest number of sites a single champion contributed to was six, while the largest number of champions at a single gauge was two. Three sites had two champions each (MI1033, NY1008, and OR1000).
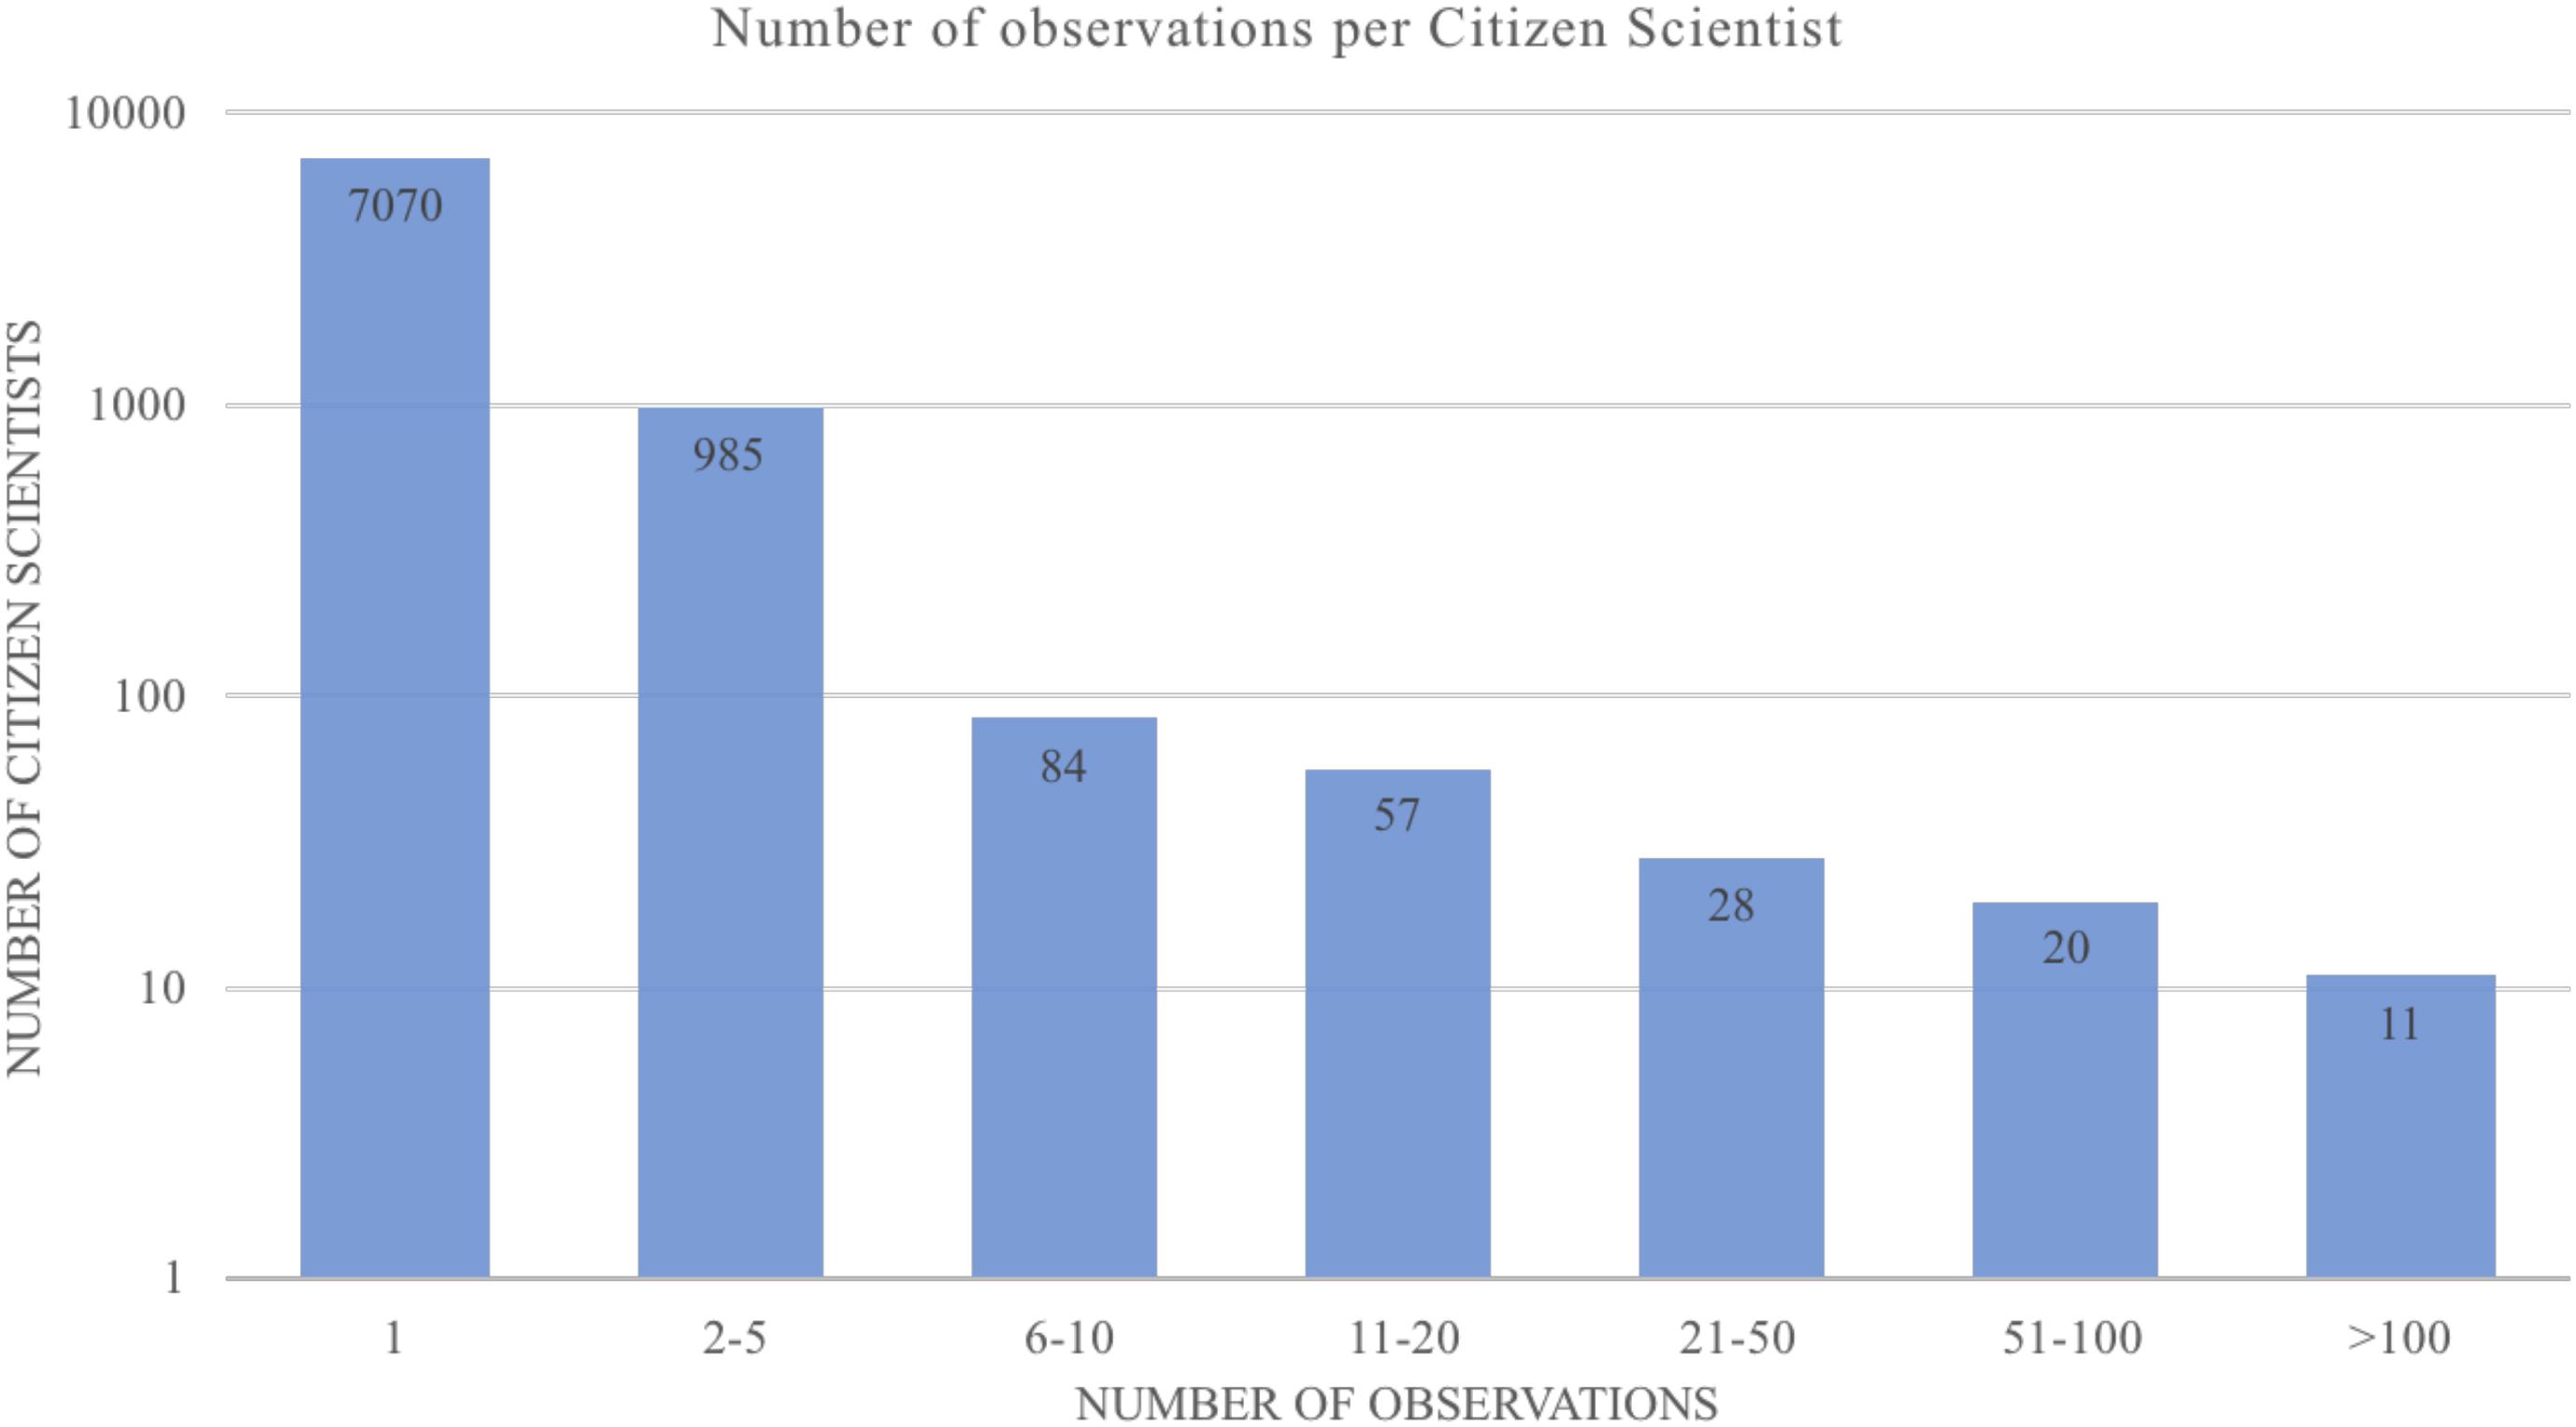
Figure 4. Number of observations submitted per citizen scientist.
Station Popularity
The ten most popular stations in the network represent 62% of the total network observations (Table 1). The locations of these stations are grouped into three categories: nature centers, hiking trails, and city parks. Of the three categories of locations, only the nature centers have personnel on site who may encourage citizen scientists to contribute observations. The top three stations, on average, received almost one observation a day without having any educator or staff on site to promote participation in the program. Three of the top 10 stations had two champions at each station and two of the top 10 stations has a single champion (NY1000, NY1009). The percentage of total observations from champions at these stations varies from 79% (MI1033) to 27% (NY1009) with an average of 45% of the observations coming from champions and no trend in location type.
Discussion
Lessons Learned
Data Accuracy
There is always the question of accuracy of the participants’ data. Numerous comparison studies of volunteer vs. professional water resources data suggest that volunteer data are generally comparable to professional data for chemical (Obrecht et al., 1998; Loperfido et al., 2010), physical (Rodrigues and Castro, 2008), and biological (Fore et al., 2001; Vail et al., 2003; Gowan et al., 2007; Stepenuck et al., 2011) monitoring. Notably, in all of these studies, volunteers were trained to carry out the monitoring in which they were engaged. Alternatively, untrained volunteers have been observed to produce less accurate data when sorting and identifying macroinvertebrates (Nerbonne and Vondracek, 2003). Arguably that was a more challenging type of monitoring than is employed in the CrowdHydrology network. One concern is that one-time participants may submit inaccurate observations due to a lack of familiarity with the methods. Nonetheless, to ensure accurate observations are made over time, developing a short training video that participants can view on their phones at the field sites may help ensure accuracy of the submitted data across participants. Limited validation in the CrowdHydrology project, using a co-located pressure transducer (Lowry and Fienen, 2013), revealed root mean square error of participant data versus researcher data of about 0.02 feet – roughly the resolution of a class A staff gauge.
Citizen Participation
The CrowdHydrology network is dominated by one-time participants who submitted just under half of all observations received into the system. Fewer than three percent of the total participants (8,255) sent in more than five observations. This may be due to the program design, which engages volunteers in data collection to address scientist-defined questions, and provides limited communications between scientists and volunteers. Such programs, sometimes termed contributory, are predicted to be effective in adding to large scale data collection efforts (Shirk et al., 2012), as has been demonstrated with the CrowdHydrology network. However, because contributory programs are scientist-led, the likelihood that the monitoring efforts address public interests is minimized (Shirk et al., 2012). This has been suggested to limit participant ownership of these data (Cornwall and Jewkes, 1995). As such, it may limit volunteer motivation to contribute data over time (Rotman et al., 2014). Further, in contributory programs, limited communications between program leaders and participants reduces opportunity for relationship building and trust development (Shirk et al., 2012). Ongoing communications to share program goals, outcomes, and status, are critical to ensure long-term participation (Rotman et al., 2014) and to sustain volunteer commitment over time (Devlin et al., 2001). CoCoRaHS, for instance, maintains a message blog, sharing educational information relevant to the program, and summarizing data submissions at least weekly, and often every few days4. In the CrowdHydrology network, the lead scientists have communicated very little with participants over time, including not acknowledging data contributions with a reply text message after measurements are submitted. Modifying the methodology in these two ways could fix perceived issues of lack of information, interest, and feedback among one-time participants.
One-time participants are helpful and may be all that are needed in the case of monitoring a specific event in real-time. However, for developing historical trends at a site for monitoring long-term change (Hayhoe et al., 2007), requires transitioning one-time participants into champions. Currently, we have four hypotheses as to why a participant may only send in one observation. The first hypothesis is due to lack of information provided by the professional scientists, causing participants to think it may be only necessary to send in one measurement. This hypothesis is based on anecdotal evidence from talking to one-time participants while performing maintenance on several of the gauges. The onshore signage points out the need for repeated measurements but it is unclear whether participants read and internalize the information from that signage. The second hypothesis is that those who participate have a lack of interest in long-term participation. The one-time participants may find it a novelty to send in a single observation without any true interest in participating in the future. The third hypothesis is that lack of feedback causes participants to become disengaged (or never to become engaged); we have chosen not to send text messages back to citizen scientists thanking them for their observations, or summarizing station results over time. Citizen scientists who have used our system in the past have recently requested feedback to make sure their observation was recorded and to provide further information on why their data are important. This hypothesis is supported by existing research that suggests that without communications, participants have no ownership of the results and do not feel like partners working toward a common scientific mission (Rotman et al., 2014). The fourth hypothesis is that the sparsity of station locations results in limited awareness of the program and ability to contribute over time. This is particularly true when a given citizen scientist does not live near any of the existing gauges and may have submitted their only observation via text message, say, while on vacation. While the fourth hypothesis is not easily addressed, the first three potential hypotheses of one-time participants can be tested, with the hope that we can transition one-time participants into champions.
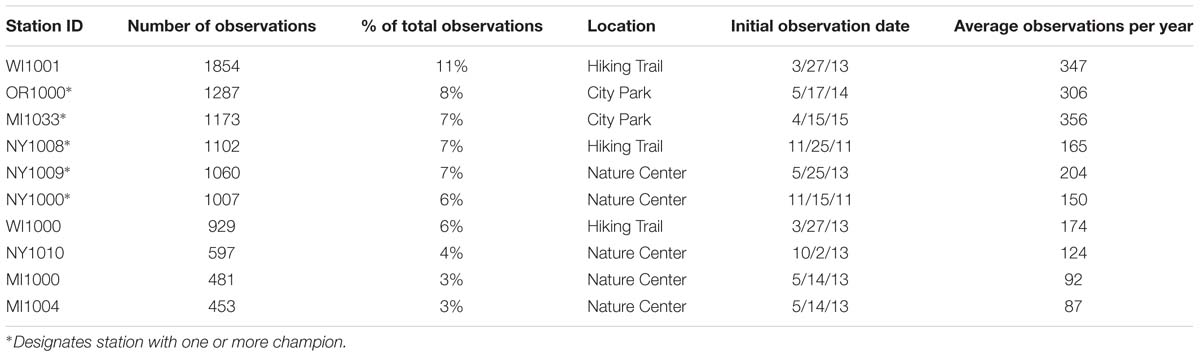
Table 1. Top ten CrowdHydrology stations based on total number of observations.
Champions, who are those participants who send in more than 100 observations, represent a small fraction of the citizen scientist that participate, yet they produce 19% of the network observations. Five of the top ten CrowdHydrology sites are sustained by champions. These champions tend to have a single station to which they contribute. There is only one champion that has contributed to more than two stations, their contributions are limited to the State of Michigan but cover stations that are spread across the state. As a result of not collecting personal information, it is unclear what motivates this participant but they seem to be an outlier.
Station Popularity
Our classification of popular stations is based on the total number of observations not on the total number of citizen scientists sending in observations. For professional scientists, the number of observations outweigh the number of participants. Using this classification, the three most common locations – nature centers, hiking trails, and city parks – all represent locations where the general public is commonly present, and likely recreating, which affords them the time and opportunity to participate. Volunteer motivation to participate in citizen science projects relates to participants’ interests in helping the environment and contributing to science (Domroese and Johnson, 2017).
Stations that proved unpopular included those at boat ramps, near major roads, and at popular fly-fishing holes. In part, the lack of popularity may be the access to a participant’s phone at these locations as the participant is in or very near the water. Boat ramps can also be stressful locations as they are shared access points and people tend to be in a rush to move boats in and out of the water. At stations near major roads, it appears that participants do not want to stop or are moving quickly to get away from the road and onto more desirable amenities. Finally, in talking with fly fishermen we have found that many do not carry their phones because they simply want to fish and do not want to be reached. While some of these locations may be scientifically important for a particular study, they lack in citizen engagement.
Future Directions
Changes to Our Methodology
While the growth of the CrowdHydrology network over the last 8 years has been consistent, modification to our methodology is necessary to preserve and expand the network. Based on our historical data we have a hypothesis of why one station location may be more popular than other stations but we need to communicate with the participants at these sites to determine their true motivations. Based on opportunistic conversations with participants we have learned that citizen scientists would like feedback that their message has been received. This is consistent with others’ findings as well (Devlin et al., 2001; Rotman et al., 2014). We are currently modifying our methodology to confirm a participant’s message was received and respond when an observation is perceived to be incorrect based a preset range of water levels at a given station. This should increase engagement. A mistake in our first 2 years of network operation was not actively engaging with citizens in the local area around CrowdHydrology stations. We have seen rapid growth in the network after engaging several large watershed groups in Michigan and getting some good national level press coverage. There is also a great need to quantify the accuracy of one-time participants as compared to champions. In the application of citizen science for natural hazards, real-time data will likely come from one-time participants. As professional scientists, we need to know what types of data we can count on these citizen scientists to report and we need to know the accuracy of those data. All of these require close examination and reflection on our communications with participants to assess how we can more meaningfully engage citizens based on their interests, concerns, and data needs (Hall et al., 2016). Finally, we have no data on non-participation–individuals who may visit one of the CrowdHydrology stations and choose not to make an observation. Non-participation is likely extremely high, but in understanding the motivation of potential citizen scientists we have an opportunity for further engagement and thus expansion.
Several CrowdHydrology network modifications, if implemented, may aid in nurturing some of the one-time volunteers to submit additional observations. First, to address possible participant confusion over their role as data contributors, we could update signage at sites to more prominently ask people to visit and report data on multiple occasions. To address the potential that people are only participating as a novelty or are not engaging or becoming disengaged due to lack of feedback, as noted previously, we are generating automated text messages to be sent in response to those who submit observations as confirmation that there is a purpose and reason for their actions. When we initiated the project, we were concerned that a response message might trigger privacy concerns among participants, but subsequent literature has suggested that the value to participation would likely eclipse such privacy concerns, and in our response, we can include an opt-out option. We could also develop partnerships with local emergency management agencies or weather forecasters, educating them about the available water level data, and thereby creating a meaningful, altruistic reason for people to continue to submit results – as their observations may inform flood forecasting or be a first indicator, or a unique indicator, of an extreme event. The Cooperative Observer and CoCoRaHS networks both share data with the National Weather Service and other weather forecasting agencies, with individual observers occasionally being credited publicly (e.g., Jankoski, 2016). Notably, the Cooperative Observer Network is one of the oldest citizen science networks in the United States, beginning in 1890 (Kunkel et al., 2005). Further, gamification, such as recording the number of observations per volunteer or a providing a forum platform where participants can share anecdotes from their sites to the network website may help people to build a personal connection among participants, and encourage gentle competition among them to help them to engage repeatedly over time. Such an approach was recently adopted by a similar program, CrowdWater (Seibert et al., 2019), which operates primarily in Europe5. While altruistic reasons have been observed to be a motivation for volunteers early in a program, we know that building personal networks is cited as a valued outcome and motivator for continued participation over time (Ryan et al., 2001; Gooch, 2005). This deserves future attention.
Champions are key to developing a robust network fueled by consistent observations at specific locations. However, champions seem to contribute to a single station, even when multiple stations are located near each other. Future work should focus on understanding motivations of current champions, and using that information, identifying potential champions at a given station and then encouraging them to become champions. We have no evidence to suggest that champions are motivated to visit a site explicitly to send in a measurement, but with some gamification or reward mechanism, they might be motivated. Surveying current champions to assess their motivations will help hone our actions. Developing strategic partnerships with organizations with existing volunteer bases and communications networks could result in expanded environmental data collection and the ability to identify long-term trends (Imperial, 2005). Further, such partnerships with local watershed organizations, state agencies or non-profits could enable CrowdHydrology gauges to be installed in targeted areas where there have been or are predicted to be flooding or other critical events. A recent study suggests that volunteer water monitoring groups that focus their efforts to address environmental crises report more impacts for natural resource policy and management (Stepenuck and Genskow, 2019).
Network Expansion
Results show an initially slow expansion of the CrowdHydrology network with 2 years of limited growth. This was followed by a marked increase in stations as methodologies were validated, new partnerships were formed, and national media attention was gained. This record does not include the initial method development starting in 2010 where data processing procedures were developed and tested at a single site. Starting at the end of 2012, we presented the methodology used for data processing at scientific conferences, and demonstrated the accuracy of the method (Fienen and Lowry, 2012; Lowry and Fienen, 2013). Publishing our first two papers convinced professional scientists that these methods could be useful. This validation contributed to the expansion of the network into three new states. Additionally, in the spring of 2013, the National Public Radio show Weekend Edition6 reported a story on the CrowdHydrology network. This publicity resulted in doubling the number of stations in the network and connected us with other professional scientists across the country. As a result, the network has experienced steady growth over the last 5 years.
There also appears to be a critical mass effect where watersheds with one or two stations (i.e., CA, OR, UT) do not seem to promote additional stations, however, having 10 or more stations (i.e., MI) in a watershed promotes rapid growth of additional stations. The promotion of additional stations may also be impacted by the type of organization that installed the gauge. The gauges installed in OR and UT are maintained by academic institutions, which may not have a vested interest beyond a specific stream location, or capacity to promote participation in or expansion of the network. Conversely, the MI sites are maintained by a variety of watershed groups that likely promote the growth of the network. Many watershed groups benefit from having a network of members with a shared interest in protecting a waterbody, and are motivated to engage in monitoring as part of their membership (Middleton, 2001).
Conclusion
Analysis of the results over an 8-year data collection period partially support our primary hypothesis that a strong citizen science network is maintained by a core group of engaged individuals. Almost 20% of the CrowdHydrology observations were reported by just 0.1% of the total number of participants; these “champions” submitted greater than 100 observation per person. An opportunity exists to engage in future research to understand motivations of these individuals and to use that information to encourage more extensive participation by others. Our results also suggest missed opportunities to engage with one-time users to promote further participation. This is a lesson not only to us, but to other citizen science programs globally. We intend to shift our recruitment methodologies to promote participation through active requests for data collection (e.g., by updating signage at monitoring sites), and our ongoing communications to provide feedback to participants to encourage great participation.
Citizen science projects take time to build a robust and sustainable network. The expansion of the CrowdHydrology network took almost 3 years to grow beyond a small regional network. The network expansion corresponded with the validation of the methodology, development of connections with watershed groups, and some good publicity. These factors are credited with expansion of the network into the larger Great Lakes region and midwestern region of the United States. Continued network expansion seems to be most successful where there is a critical mass of stations, which partially supports our secondary hypothesis. The growth of the network seems to do best when there are more than 10 stations in a given watershed causing potential participants in neighboring watersheds to set up stations. One or two stations in a small watershed seem to do little to promote the growth of the network, which does not support our secondary hypothesis. Even with a set of champions at a given station (i.e., OR1000) resulting in a robust time series, the lack of a critical mass of stations seems to prevent expansion within a watershed. This leads to the idea that quantity of stations not quality of data at a single station may be the driving factor in network expansion in a region.
The popularity of a station seems to be highly dependent on its physical location. Locations at nature centers, hiking trails, and city parks represent stations with the largest participation. The commonality of these stations seems to be locations where the public are physically moving slowly and in locations that predispose participants to observe nature. Areas near roadways and recreational water locations (boat ramps and fishing spots) were found to be poor locations based on our observation record. These locations, with low observational counts, represent locations where the potential citizen scientists are focused on specific tasks other than measuring water levels. When considering the placement of future observational stations these patterns may be helpful. However, these locations may not align with fundamental research questions posed by professional scientists.
Citizen science programs can generate extensive data sets that can aid researchers in addressing locally specific and broad scale questions. However, to generate the most comprehensive and useful datasets, professional scientists must take care to not only formulate specific questions, but to communicate required data needs to intended citizen participants. Without such information, many participants may contribute only limited data, thus hindering the ability of the researcher to understand systems or to draw conclusions. Recommendations for ensuring complete datasets include providing feedback to participants about the data submitted, data needs, and scientific purpose and importance of the data being collected.
Ethics Statement
As a citizen science project, this study uses observations from humans of water levels in streams and lakes in the form of text messages. Our methodology converts all incoming text messaged to a universally unique identifier (UUID) using our Social.Water code resulting in no identifiable information collected from subjects. We contacted the IRB office at the University at Buffalo and were told this study does not require approval as no personal identifiable data is collected.
Author Contributions
CL and MF developed the CrowdHydrology network. MF wrote the Social.Water code used to compile observations and identify unique participants. CL analyzed and processed these data. DH and KS analyzed the trends in citizen science observations. CL, MF, DH, and KS contributed to the writing of the manuscript.
Funding
This research was supported by the National Science Foundation under grants ABI-1661324 and SCC-1831475.
Conflict of Interest Statement
The authors declare that the research was conducted in the absence of any commercial or financial relationships that could be construed as a potential conflict of interest.
Acknowledgments
This work would not be possible without the support of thousands of citizen scientists and watershed organizations that took the time to install CrowdHydrology gauges and send in water level measurements. Any use of trade, firm, or product names is for descriptive purposes only and does not imply endorsement by the U.S. Government.
Footnotes
- ^ StreamTracker.org
- ^ www.CrowdHydrology.com
- ^ https://github.com/mnfienen-usgs/Social.Water
- ^ http://cocorahs.blogspot.com
- ^ https://www.crowdwater.ch/en/welcome-to-crowdwater/
- ^ https://www.npr.org/templates/story/story.php?storyId=203890657?storyId=203890657
References
Bell, S., Cornford, D., and Bastin, L. (2013). The state of automated amateur weather observations. Weather 68, 36–41. doi: 10.1002/wea.1980
Breuer, L., Hiery, N., Kraft, P., Bach, M., Aubert, A. H., and Frede, H.-G. (2015). HydroCrowd: a citizen science snapshot to assess the spatial control of nitrogen solutes in surface waters. Sci. Rep. 5:16503. doi: 10.1038/srep16503
Butcher, G., Fuller, M., McAllister, L., and Geissler, P. (1990). An Evaluation of the christmas bird count for monitoring population trends of selected species. Wildlife Soc. Bull. 18, 129–134.
Canfield, D. E. Jr., Bachmann, R. W., Stephens, D. B., Hoyer, M. V., Bacon, L., Williams, S., et al. (2016). Monitoring by citizen scientists demonstrates water clarity of Maine (USA) lakes is stable, not declining, due to cultural eutrophication. Inland Waters 6, 11–27. doi: 10.5268/iw-6.1.864
Cifelli, R., Doesken, N., Kennedy, P., Carey, L. D., Rutledge, S. A., Gimmestad, C., et al. (2005). The community collaborative rain, hail, and snow network: informal education for scientists and citizens. Bull. Am. Meteorol. Soc. 86, 1069–1077.
Devlin, M., Waterhouse, J., and Brodie, J. (2001). Community and connectivity: summary of a community based monitoring program set up to assess the movement of nutrients and sediments into the great barrier reef during high flow events. Water Sci. Technol. 43:121. doi: 10.2166/wst.2001.0522
Domroese, M. C., and Johnson, E. A. (2017). Why watch bees? Motivations of citizen science volunteers in the great pollinator project. Biol. Conserv. 208, 40–47. doi: 10.1016/j.biocon.2016.08.020
Elmore, K. L., Flamig, Z. L., Lakshmanan, V., Kaney, B. T., Farmer, V., Reeves, H. D., et al. (2014). MPING: crowd-sourcing weather reports for research. Bull. Am. Meteorol. Soc. 95, 1335–1342. doi: 10.1175/bams-d-13-00014.1
Feiner, K., and Lowry, C. S. (2015). Simulating the effects of a beaver dam on regional groundwater flow through a wetland. J. Hydrogeol. Reg. Stud. 4, 675–685. doi: 10.1016/j.ejrh.2015.10.001
Fienen, M. N., and Lowry, C. S. (2012). Social. water—A crowdsourcing tool for environmental data acquisition. Comp. Geosci. 49, 164–169. doi: 10.1016/j.cageo.2012.06.015
Fore, S. L., Paulsen, K., and O’laughlin, K. (2001). Assessing the performance of volunteers in monitoring streams. Freshwater Biol. 46, 109–123. doi: 10.1046/j.1365-2427.2001.00640.x
Gauchat, G. (2012). Politicization of science in the public sphere: a study of public trust in the United States, 1974 to 2010. Am. Sociol. Rev. 77, 167–187. doi: 10.1177/0003122412438225
Gooch, M. (2005). Voices of the volunteers: an exploration of the experiences of catchment volunteers in coastal Queensland, Australia. Local Environ. 10:5. doi: 10.1080/1354983042000309289
Gowan, C., Ruby, M., Knisley, R., and Grimmer, L. (2007). Stream monitoring methods suitable for citizen volunteers working in the coastal plain and lower piedmont regions of virginia. Am. Entomol. 53, 48–57. doi: 10.1093/ae/53.1.48
Hall, D. M., Gilbertz, S. J., Anderson, M., and Ward, L. (2016). Beyond “buy-in”: designing citizen participation in water planning as research. J. Cleaner Prod. 133, 725–734. doi: 10.1016/j.jclepro.2016.05.170
Hayhoe, K., Wake, C. P., Huntington, T. G., Luo, L., Schwartz, M. D., Sheffield, J., et al. (2007). Past and future changes in climate and hydrological indicators in the US Northeast. Clim. Dyn. 28:381. doi: 10.1007/s00382-006-0187-8
Imperial, M. T. (2005). Using collaboration as a governance strategy: Lessons from six watershed management programs. Administr. Soc. 37, 281–320. doi: 10.1177/0095399705276111
Jankoski, T. (2016). Become a CoCoRaHS Weather Observer! NBC Connecticut. Available at: https://www.nbcconnecticut.com/weather/stories/CoCoRahs-March-Madness-Become-a-Weather-Observer-370945001.html (accessed October 23, 2018).
Kampf, S., Strobl, B., Hammond, J., Anenberg, A., Etter, S., Martin, C., et al. (2018). Testing the Waters: Mobile Apps for Crowd Sourced Stream Flow Data. Seattle: EOS.
Kuhn, T. S. (1962). The Structure of Scientific Revolutions. Chicago: University of Chicago Press, 264.
Kunkel, K. E., Easterling, D. R., Hubbard, K., Redmond, K., Andsager, K., Kruk, M. C., et al. (2005). Quality control of pre-1948 cooperative observer network data. J. Atmos. Ocean. Technol. 22, 1691–1705. doi: 10.1175/JTECH1816.1
Le Coz, J., Patalano, A., Collins, D., Guillén, N. F., García, C. M., Smart, G. M., et al. (2016). Crowdsourced data for flood hydrology: feedback from recent citizen science projects in Argentina, France and New Zealand. J. Hydrol. 541, 766–777. doi: 10.1016/j.jhydrol.2016.07.036
Little, K. E., Hayashi, M., and Liang, S. (2016). Community-based groundwater monitoring network using a citizen-science approach. Groundwater 54, 317–324. doi: 10.1111/gwat.12336
Loperfido, J. V., Beyer, P., Just, C. L., and Schnoor, J. L. (2010). Uses and biases of volunteer water quality data. Environ. Sci. Technol. 44, 7193–7199. doi: 10.1021/es100164c
Lottig, N. R., Wagner, T., Norton Henry, E., Spence Cheruvelil, K., Webster, K. E., Downing, J. A., et al. (2014). Long-term citizen-collected data reveal geographical patterns and temporal trends in lake water clarity. PLoS One 9:e95769. doi: 10.1371/journal.pone.0095769
Lowry, C. S., and Fienen, M. N. (2013). CrowdHydrology: crowdsourcing hydrologic data and engaging citizen scientists. Ground Water 51, 151–156. doi: 10.1111/j.1745-6584.2012.00956.x
Michelsen, N., Dirks, H., Schulz, S., Kempe, S., Al-Saud, M., and Schüth, C. (2016). YouTube as a crowd-generated water level archive. Sci. Total Environ. 568, 189–195. doi: 10.1016/j.scitotenv.2016.05.211
Middleton, J. V. (2001). The stream doctor project: community-driven stream restoration: through the sos program, the izaak walton league is working to increase public awareness of water pollution issues and to build an active network of watershed stewards to monitor and restore community streams and rivers. AIBS Bull. 51, 293–296.
Nerbonne, J. F., and Vondracek, B. (2003). Volunteer macroinvertebrate monitoring: assessing training needs through examining error and bias in untrained volunteers. J. North Am. Benthol. Soc. 22, 152–163. doi: 10.2307/1467984
Obrecht, D. V., Milanick, M., Perkins, B. D., Ready, D., and Jones, J. R. (1998). Evaluation of data generated from lake samples collected by volunteers. Lake Reserv. Manag. 14, 21–27. doi: 10.1080/07438149809354106
Pew Research Center (2018). Internet and Technology Mobile Fact Sheet. Available at: http://www.pewinternet.org/fact-sheet/mobile/ (accessed October 23, 2018).
Richardson, A. D., Hufkens, K., Milliman, T., Aubrecht, D. M., Chen, M., Gray, J. M., et al. (2018). Tracking vegetation phenology across diverse North American biomes using PhenoCam imagery. Sci. Data 5:180028. doi: 10.1038/sdata.2018.28
Rodrigues, A. S. L., and Castro, P. T. A. (2008). Adaptation of a rapid assessment protocol for rivers on rocky meadows. [Adaptacao de um protocolo de avaliacao rapida para rios em campos rupestres]. Acta Limnol. Brasil. 20, 291–303.
Rotman, D., Hammock, J., Preece, J., Hansen, D., Boston, C., Bowser, A., et al. (2014). “Motivations Affecting Initial and Long-Term Participation in Citizen Science Projects in Three Countries,” in Proceedings of the iConference 2014, (London: ACM), 110–124.
Ryan, R. L., Kaplan, R., and Grese, R. E. (2001). Predicting volunteer commitment in environmental stewardship programmes. J. Environ. Plan. Manag. 44, 629–648. doi: 10.1080/09640560120079948
Seibert, J., Strobl, B., Etter, S., Hummer, P., and van Meerveld, H. J. (2019). Virtual staff gauges for crowd-based stream level observations. Front. Earth Sci. 7:70. doi: 10.3389/feart.2019.00070
Seibert, J., and Vis, M. J. P. (2016). How informative are stream level observations in different geographic regions? Hydrol. Process. 30, 2498–2508. doi: 10.1002/hyp.10887
Shirk, J. L., Ballard, H. L., Wilderman, C. C., Phillips, T., Wiggins, A., Jordan, R., et al. (2012). Public participation in scientific research: a framework for deliberate design. Ecol. Soci. 17:29.
Stepenuck, K. F., and Genskow, K. D. (2019). Understanding key traits of volunteer water monitoring programs that report natural resource management and policy outcomes. Soc. Nat. Resour. 32, 275–291. doi: 10.1080/08941920.2018.1511022
Stepenuck, K. F., Wolfson, L. G., Liukkonen, B. W., Iles, J. M., and Grant, T. S. (2011). Volunteer monitoring of E. coli in streams of the upper Midwestern United States: a comparison of methods. Environ. Monitor. Assess. 174, 625–633. doi: 10.1007/s10661-010-1483-7
Szalay, A., and Gray, J. (2006). 2020 computing: science in an exponential world. Nature 440, 413–414. doi: 10.1038/440413a
Vail, J. H., Morgan, R., Merino, C. R., Gonzales, F., Miller, R., and Ram, J. L. (2003). Enumeration of waterborne escherichia coli with petrifilm plates: comparison to standard methods. J. Environ. Qual. 32, 368–373.
Keywords: citizen science, CrowdHydrology, crowdsourcing, hydrology, public participation, stream stage, water resources
Citation: Lowry CS, Fienen MN, Hall DM and Stepenuck KF (2019) Growing Pains of Crowdsourced Stream Stage Monitoring Using Mobile Phones: The Development of CrowdHydrology. Front. Earth Sci. 7:128. doi: 10.3389/feart.2019.00128
Received: 30 October 2018; Accepted: 13 May 2019;
Published: 28 May 2019.
Edited by:
Jonathan D. Paul, Imperial College London, United KingdomReviewed by:
Joern Lauterjung, GFZ German Research Centre for Geosciences, GermanyStefano Martellos, University of Trieste, Italy
Copyright © 2019 Lowry, Fienen, Hall and Stepenuck. This is an open-access article distributed under the terms of the Creative Commons Attribution License (CC BY). The use, distribution or reproduction in other forums is permitted, provided the original author(s) and the copyright owner(s) are credited and that the original publication in this journal is cited, in accordance with accepted academic practice. No use, distribution or reproduction is permitted which does not comply with these terms.
*Correspondence: Christopher S. Lowry, Y3Nsb3dyeUBidWZmYWxvLmVkdQ==