- 1HydroGeophysics Group, Department of Geoscience, Aarhus University, Aarhus, Denmark
- 2Sweco, Glostrup, Denmark
- 3DTU Environment, Department of Environmental Engineering, Technical University of Denmark, Lyngby, Denmark
This study presents a novel expansion of the clay-fraction (CF)/resistivity clustering method aiming at developing realizations of subsurface structures based on multiple point statistics (MPS). The CF-resistivity clustering method is used to define a data driven training image (TI) for MPS simulations. By combining this TI with uncertainty estimates obtained from correlation between the resistivity models and the unique categories in the TI, subsurface realizations are generated honoring geophysical and lithological data. The generated subsurface realizations were calibrated in a steady state groundwater model. Forecasts of well catchment zones were derived based on two wells located in areas with different levels of structural uncertainty. The catchment probability maps derived from the structural realizations were compared with the well catchment forecasted by a deterministic subsurface structure, and we are able to capture this catchment within the estimated uncertainties. We believe that this study is the first to combine MPS methods with a complete data driven workflow going directly from lithological and geophysical data to realizations of the subsurface structures. The main benefits of this is that it is data driven, fast, reproducible, and transparent.
HIGHLIGHTS
- Fast, transparent, and data driven uncertainty estimate for subsurface structures in groundwater models.
- The methodology uses multiple point statistics to capture the complexity of the subsurface structures better.
- Method supports generation of three-dimensional training images for practical application of multiple point statistics.
Introduction
Groundwater models are routinely used as tools for decision support in water resource related questions (e.g., Boronina et al., 2003; Almasri and Kaluarachchi, 2007; Mylopoulos et al., 2007; Saravanan et al., 2011; Sedki and Ouazar, 2011; Manghi et al., 2012; Enzenhoefer et al., 2014). However, despite being advocated often (e.g., Pappenberger and Beven, 2006; Tartakovsky et al., 2012) uncertainty analysis is still not common practice in practical applications of groundwater modeling studies (Sanchez-Vila and Fernandez-Garcia, 2016; Delottier et al., 2017). Some arguments for the missing adaptation amongst professionals include limited access to software solutions (Renard, 2007; Tartakovsky et al., 2012), insufficient teaching and training of students, that can bring methods into practice (Renard, 2007; Sanchez-Vila and Fernandez-Garcia, 2016), reluctance among clients and decision makers to embrace model results presented with uncertainty (Freeze, 2004), and a further push for application of stochastic methods in practice (Renard, 2007), and finally limited access to regional scale, high resolution datasets. Most of the literature cited above, refers to uncertainty analysis in a broad context.
In the following, we will limit our focus to the sub-domain that deals with stochastic methods to represent uncertainty on subsurface structures in hydrological models. Traditionally, when performed, these stochastic simulations have been based on 2-point statistics such as sequential indicator simulation or sequential Gaussian simulation (Deutsch and Journel, 1998). However, the simplified assumptions of the 2-point statistics will often be insufficient to describe the complexity of the subsurface that governs groundwater flow (Zinn and Harvey, 2003). An alternative to the 2-point statistics is multiple-point statistics (MPS) (Hu and Chugunova, 2008; Mariethoz and Caers, 2015). In MPS, the statistical model consists of a training image (TI). This TI describes the spatial variability and patterns expected in the subsurface. As the name implies, MPS use multiple point information to estimate the correlation in structural patterns, and thus yields a more realistic representation of subsurface structure. A detailed review of the various MPS methods available will not be provided here, additional information can be found in e.g., Hu and Chugunova (2008) or Linde et al. (2015).
A common challenge for practical application of MPS methods is the lack of availability of a TI (Bastante et al., 2008; dell’Arciprete et al., 2012). TI’s are often of conceptual nature, and encapsulates the experts knowledge of the system being analyzed (Caers, 2001). TI’s can also be generated using parametric equations or simple templates (Maharaja, 2008). Using this approach a set of TI can easily be developed that encapsulates different conceptual interpretations. This approach was used by Hermans et al. (2015) for a local scale study of an alluvial aquifer. A limitation of this approach is that it is difficult to produce TI’s that resemble the full complexities of the system, and the resulting TI will often be an over simplified version of the field conditions. Another common approach to generating TI is through manual interpretation of subsurface structures (Huysmans et al., 2008; Hoyer et al., 2017; Barfod et al., 2018). This approach integrates geological expert knowledge about the system, thus making it a more direct representation of it. For practical applications this approach has two limitations. First, it is a more time consuming methodology, resulting in a more expensive end product. Second, the derived TI may be highly non-stationary, therefore putting high constraints on additional auxiliary data to constrain the modeling (Strebelle, 2002). A TI can also be generated directly from the datasets collected in the field (Silva and Deutsch, 2014). Similar to manual interpretations, this approach will often result in a non-stationary TI, and the simulations must therefore be made by including additional auxiliary variables. Another limitation to this approach is that the resolution of the TI is limited by the collected data (Linde et al., 2015). Processes resulting in structural variability below this scale of resolution can therefore not be encapsulated in the TI. It is therefore important, to acknowledge that model realizations cannot be produced with a higher resolution than the input dataset can provide. This methodology also requires input datasets with a sufficiently high spatial density and areal coverage rarely possible to obtain by e.g., drilling.
Large spatial coverage can be obtained using airborne electromagnetic (AEM) methods. The SkyTEM system (Sørensen and Auken, 2004) is one of the available AEM methods that have been used extensively for groundwater mapping (Møller et al., 2009b; Pryet et al., 2012; Korus et al., 2017; Knight et al., 2018). By inverting the EM dataset a model of the electrical resistivity of the subsurface can be produced. In sedimentary environments where the groundwater is uninfluenced by pore water salinity, structures with high resistivity will often be the water bearing units or aquifers, and structures with low resistivity will be the aquitards or confining units. This link between subsurface hydrological units and resistivity can, however, be both spatially variable and uncertain. To reduce this uncertainty, the interpretations can be assisted using lithological logs from boreholes. This process has been formalized in the clay fraction (CF) inversion method (Christiansen et al., 2014; Foged et al., 2014). Marker et al. (2015) further extended this methodology using k-means clustering to reduce the dimensionality of the CF and resistivity data to derive a set of hydrogeological units. In the following this methodology will be named CF-resistivity clustering.
In this study, we investigate how to utilize the CF-resistivity clustering method to create a 3D TI. A TI can thereby be created specifically for the investigated area using a fast and data driven approach. Subsequently, this TI is used together with an estimate of the subsurface uncertainty and hard data from boreholes to generate multiple realizations of the subsurface structures. Structural realizations are then incorporated into a groundwater flow model and calibrated to available hydrological data. Finally, the model realizations are used to estimate the uncertainty of a well catchment zone. By presenting an approach to deal with structural uncertainty analysis, we show how geostatistical methods can be applied to problems relevant to most groundwater resource professionals.
Materials and Data
Study Area
The study area used to document the proposed methodology is located north-west of the town of Aarhus, Denmark (Figure 1). It is of principle interest to the local authorities and the public water supply company, due to its proximity to Aarhus, and its rich groundwater resources are important for the supply of drinking water. The area has been subject to several geophysical and geological mapping campaigns (Kronborg et al., 1990; Danielsen et al., 2003; Sandersen and Jørgensen, 2003; Jørgensen and Sandersen, 2006; Møller et al., 2009a; Høyer et al., 2015). These studies have revealed a dense network of buried valley structures, which are incised into a thick sequence of Paleogene clays. In most parts of the area, these clays form the lower impermeable bed for the primary groundwater reservoirs located inside these valley structures. However, not all valleys are filled with sand and gravel (thus constituting aquifers); some are filled up with glacial deposits mainly consisting of clay till. These clay-filled valleys can act as hydraulic barriers and clay layers covering the primary aquifers. Besides the valley structures, plateaus between the valleys can hold till deposits consisting of either sand/gravel and clay deposited during the last glaciation. A more detailed description of the geological structure of the area can be found in Høyer et al. (2015).
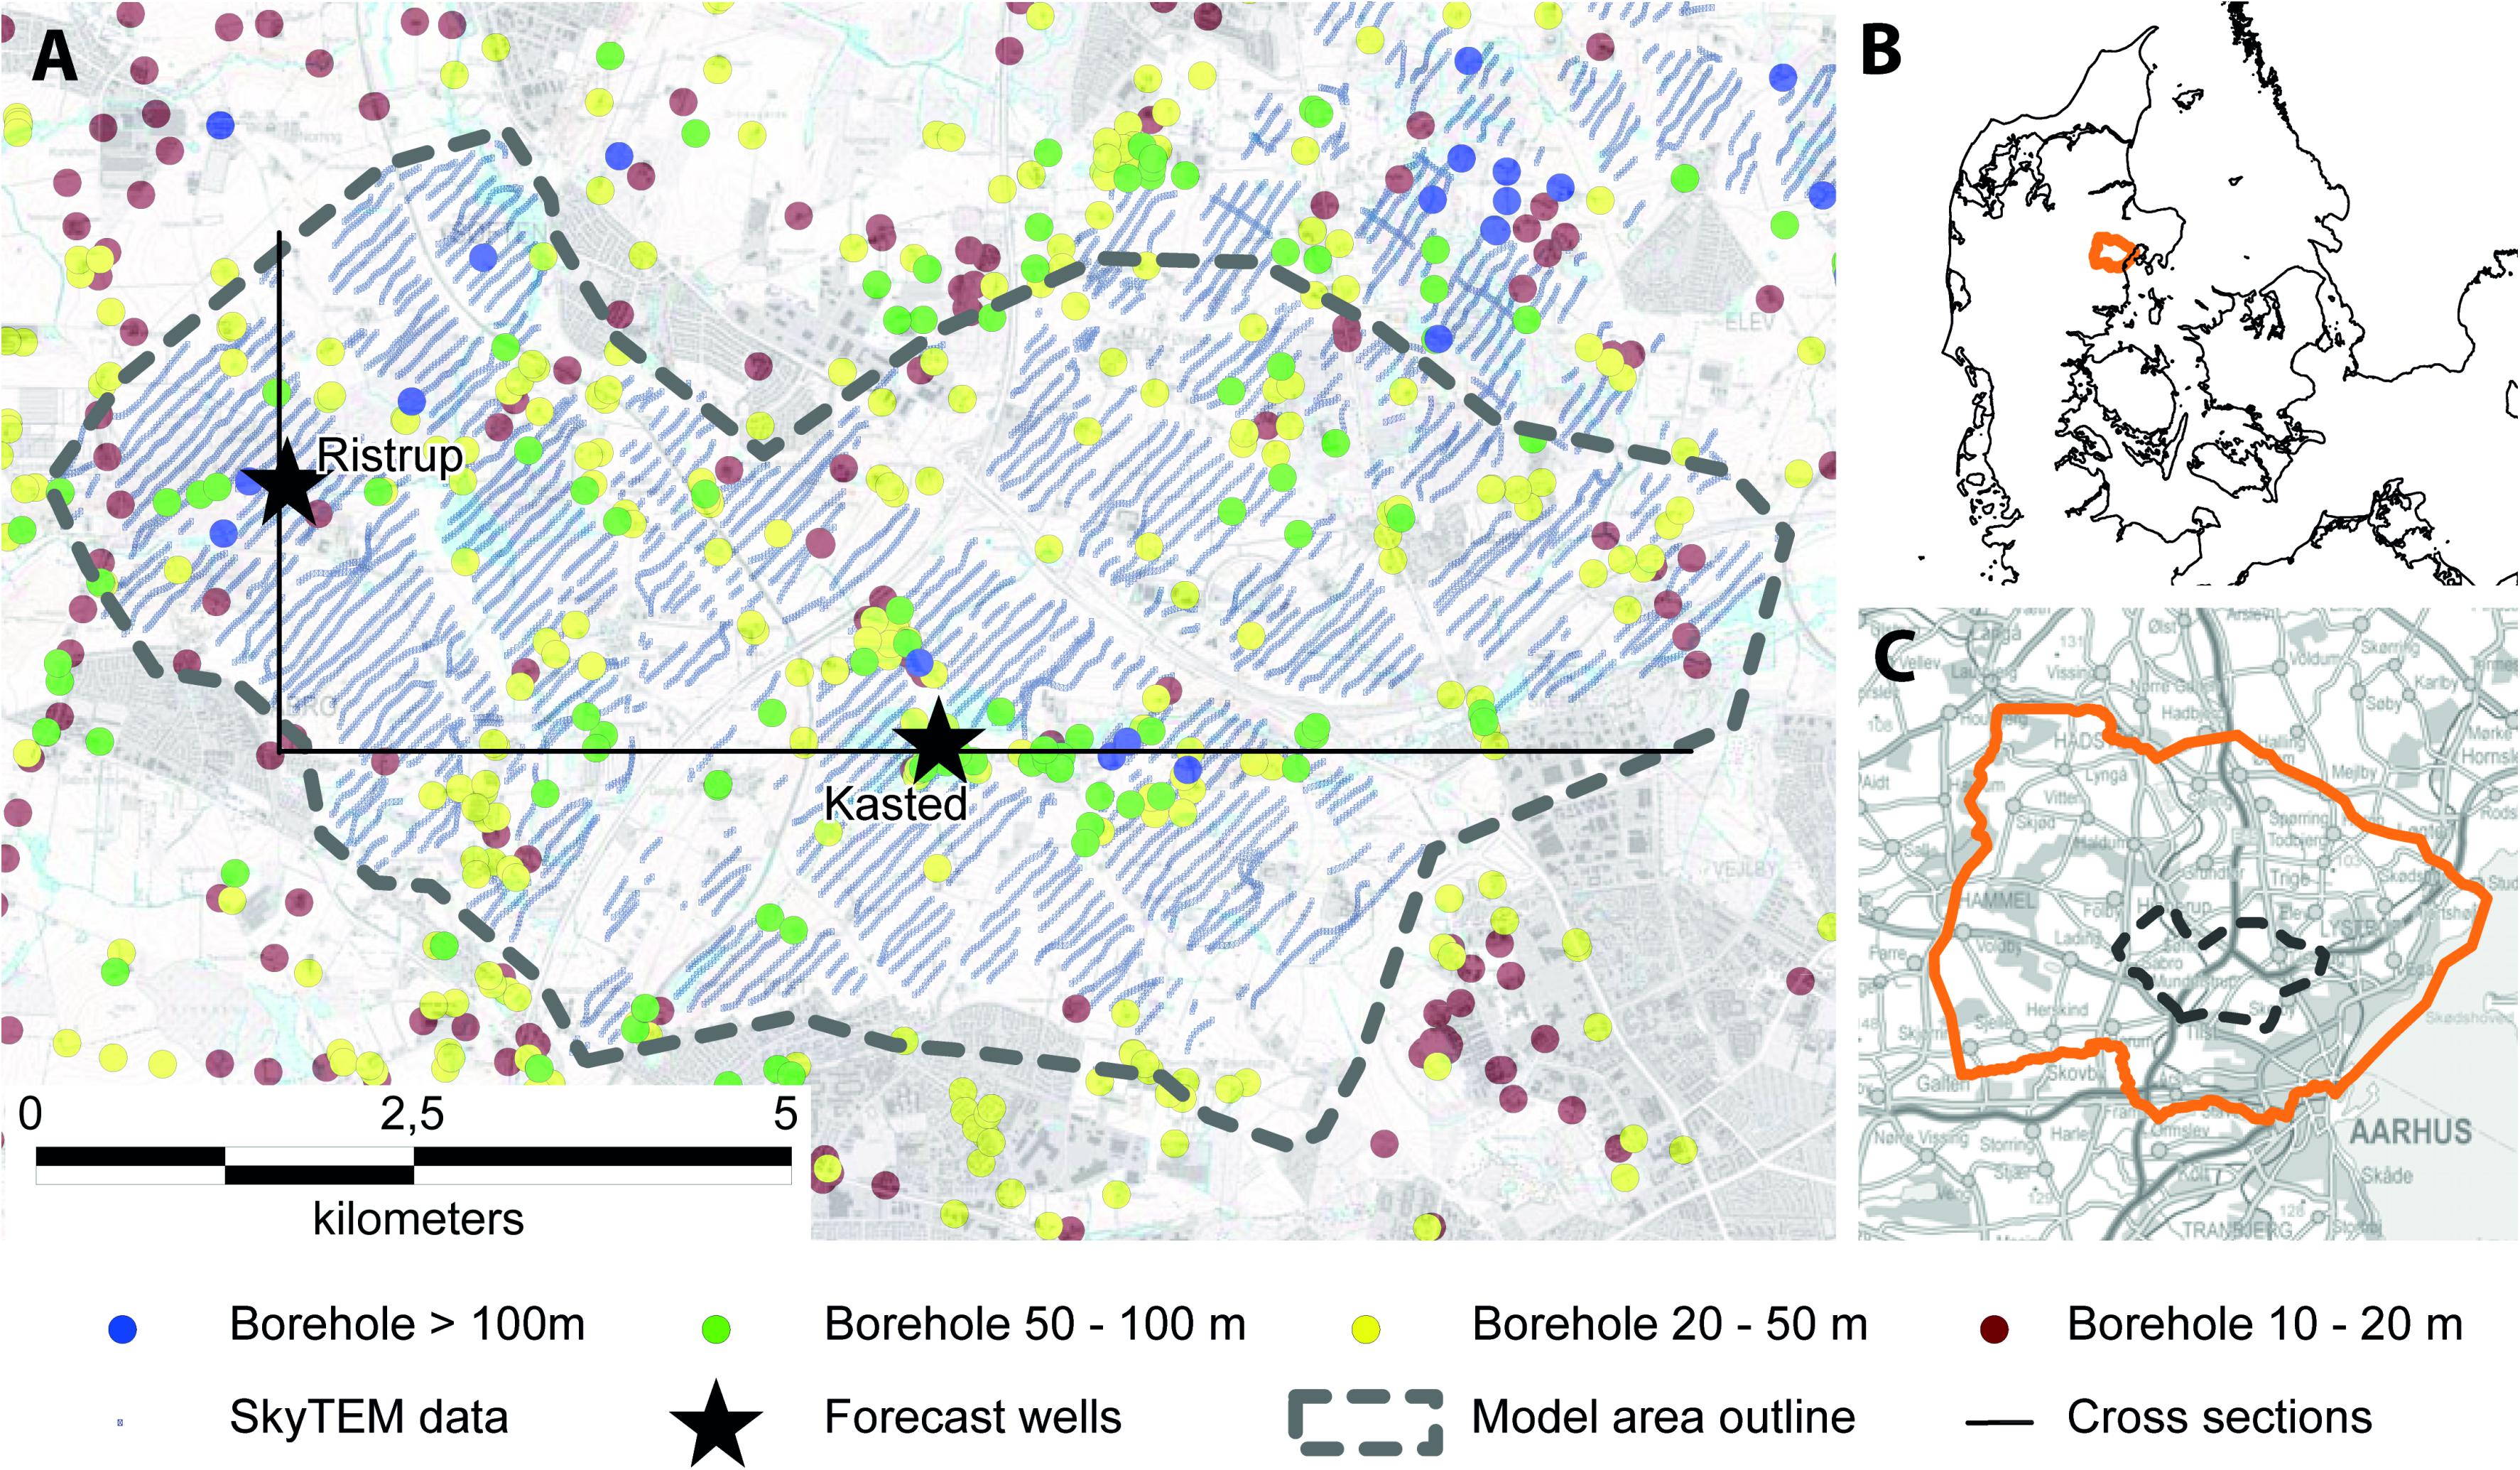
Figure 1. Outline of the investigated area located outside the town of Aarhus, Denmark (A). Local scale groundwater model imbedded into the regional model setup outlined in (C). The Regional model is located in the central part of the Jutland peninsula in Denmark (B).
Geophysical and Lithological Data
Lithological information from boreholes was extracted from the Danish national well database, Jupiter (Møller et al., 2009a). Within the test site, approximately 400 boreholes were available. The majority of these boreholes are shallow (below 50 m depth), and only a small subset (∼3%) reaches depths of more than 100 m (Figure 1). The quality of the lithological information provided by these boreholes varied, based on their drilling method, purpose, age, etc. Therefore, to utilize these boreholes in a modeling context, their quality must be quantified. In the present study, this was done using the weighting scheme presented by He et al. (2015).
The geophysical dataset was collected using the SkyTEM304 system (Sørensen and Auken, 2004) in August 2013. The data consist of 24.600 SkyTEM soundings collected over 330 line kilometers flown with a line spacing of 100 m. Soundings were made with a spacing of 25 m along the flight lines. The geophysical dataset was processed using Aarhus Workbench following the methodology described by Auken et al. (2009). During processing, data biased by EM-noise are removed. The resulting data positions after processing are shown in Figure 1, where each position represents one 1D EM model. The inversion was carried out in a spatially constrained inversion (SCI) (Viezzoli et al., 2008) with a 1D sharp model formulation (Vignoli et al., 2015) as implemented in the AarhusInv inversion code (Auken et al., 2015). In an SCI, a stratified geological environment is mimicked through horizontal and vertical regularization constraints between proximate 1D resistivity models. The sharp inversion setup secures that smooth vertical and horizontal transitions in resistivity are penalized in the objective function, thus promoting more homogeneous resistivity models with fewer but sharper boundaries. To avoid over interpreting resistivity models with low sensitivity at large depths, all models have been individually blanked at their estimated depth of investigation (DOI) calculated as described by Christiansen and Auken (2012).
Hydrological Data and Forcing
Time series of stream base-flow estimates were determined for three sub-catchments within the regional model domain (outlined in Figure 1C), using the automatic filter approach presented by Arnold and Allen (1999) and Arnold et al. (1995).
Estimates of steady state hydraulic heads were obtained for a total of 506 samples within the regional model area (Figure 1C). 106 of these samples were collected in the 62 wells that are screened in multiple aquifers, while 336 of the wells only have one screening interval, and thus a single steady state head estimate. Within the local groundwater model area, a total of 94 observations were available. 19 of the samples were collected from the 11 wells screened at multiple depths, while 75 of the wells only have one screening interval. Uncertainty of each head estimate was evaluated, taking into account factors such as the source of xy coordinates (GPS, read from map etc.); the method used to determine the reference level of a borehole; the length and temporal variation of time series used for estimating steady state heads; and the quality of the borehole (ranging from boreholes being part of the national groundwater monitoring program to old wells used for single household water supply).
Recharge rates were estimated using input from the national groundwater resource model of Denmark (Henriksen et al., 2003; Sonnenborg et al., 2003). First, the three dominating soil types near terrain were extracted from the model (sand, clay, and humus). On top of that, four land use types were defined (urban, farmland, forest, and water). By combining these, a total of 11 unique combinations were achieved. Subsequently, information on temperature, daily potential evapotranspiration, and precipitation was extracted from the national water resource model (assumed constant over the domain), and these were mapped onto the 11 unique zones. The recharge time series was then estimated using a simple linear root zone model (Jeppesen, 2001). Since the model used in the present study is steady state, these recharge estimates were averaged to a single value for each of the 11 zones.
Groundwater Model Setup
The groundwater model used in the study is set up in MODFLOW-USG. This version of MODFLOW was chosen such that the regional groundwater flow could be incorporated into the model setup while still having a fine numerical resolution within the local focus area. Details on the definition of the regional flow model can be found in Vilhelmsen et al. (2018), and the same model setup was used in Marker et al. (2017). The outline of the regional scale model can be seen from Figure 1C where it is marked with an orange line. The outline of the local scale model can be seen from Figure 1A where it is marked with a gray dotted line. Both the local model and the regional model have 11 model layers, and the local and the regional model have a horizontal discretization of 50 m and 100 m, respectively.
Two pumping wells have been chosen as focus for the present study. Both wells are located in existing well field areas. The location of the wells is marked with black stars on Figure 1. The Kasted well is part of the Kasted well field, and the Ristrup well is located within the Ristrup well field. These two locations were also chosen to represent a subarea with more complex geological settings (Kasted well), where noise in the geophysical data set resulted in areas with limited data coverage. The other well (Ristrup well) is located in a more homogeneous geological setting, where there was almost full coverage of the EM data.
Methods and Theory
Clay Fraction-Resistivity Clustering
To obtain categorical information from lithological logs and resistivity models, we used the clay fraction (CF)-resistivity clustering methodology at borehole locations and sounding sites (Marker et al., 2017). The basic idea of the CF-resistivity clustering is to reduce the dimensionality of the input data (resistivity models and lithological logs), such that these are represented by a few (three or four) categorical variables. These categorical variables form the basis for the structural analysis of the subsurface.
The first step in this analysis is the clay-fraction inversion. Details on this methodology can be found in Christiansen et al. (2014) and Foged et al. (2014), and only a short resumé will be given here. In the CF inversion, boreholes are subdivided into equal discrete vertical intervals. Within each interval, the fraction of clay is determined, such that a CF of 1.0 is obtained if the discrete interval only contains clay and a CF of 0.0 if the interval does not have clay layers. The CF estimated at the boreholes, together with the resistivity models (averaged over the same elevation intervals), constitutes the dataset used in the CF inversion. The objective of the inversion is then to estimate a two-parameter error function that translates resistivities into CF such that the optimal translation occurs between CF estimated from boreholes and CF estimated from the resistivity models. Here, the two parameters are defined as the upper threshold, where all resistivities are translated to 0% clay, and the lower threshold is where resistivity values are translated to 100% clay. Since the correlation between resistivity and borehole lithology can vary spatially within the survey area, the translation function parameters are defined on a 3D grid, where each grid node holds the two- parameter translation model. To constrain the inversion, the translation functions are regularized such that smooth translation parameters are preferred.
Once the CF inversion has been completed, each sounding site will have a set of resistivity and CF values with a predefined vertical resolution. To include the information at borehole locations, we also chose to interpolate a resistivity value using kriging from the geophysical soundings onto the boreholes. This provided us with both a resistivity and a CF at borehole locations.
For dimensionality reduction of the multivariable cloud to obtain a categorical dataset, we used K-means clustering (Wu, 2012), as implemented in Scikit-Learn in Python (Pedregosa et al., 2011). The clustering was performed on the principal components of the CF and the normalized resistivities (these were normalized to a scale of 0.0 to 1.0).
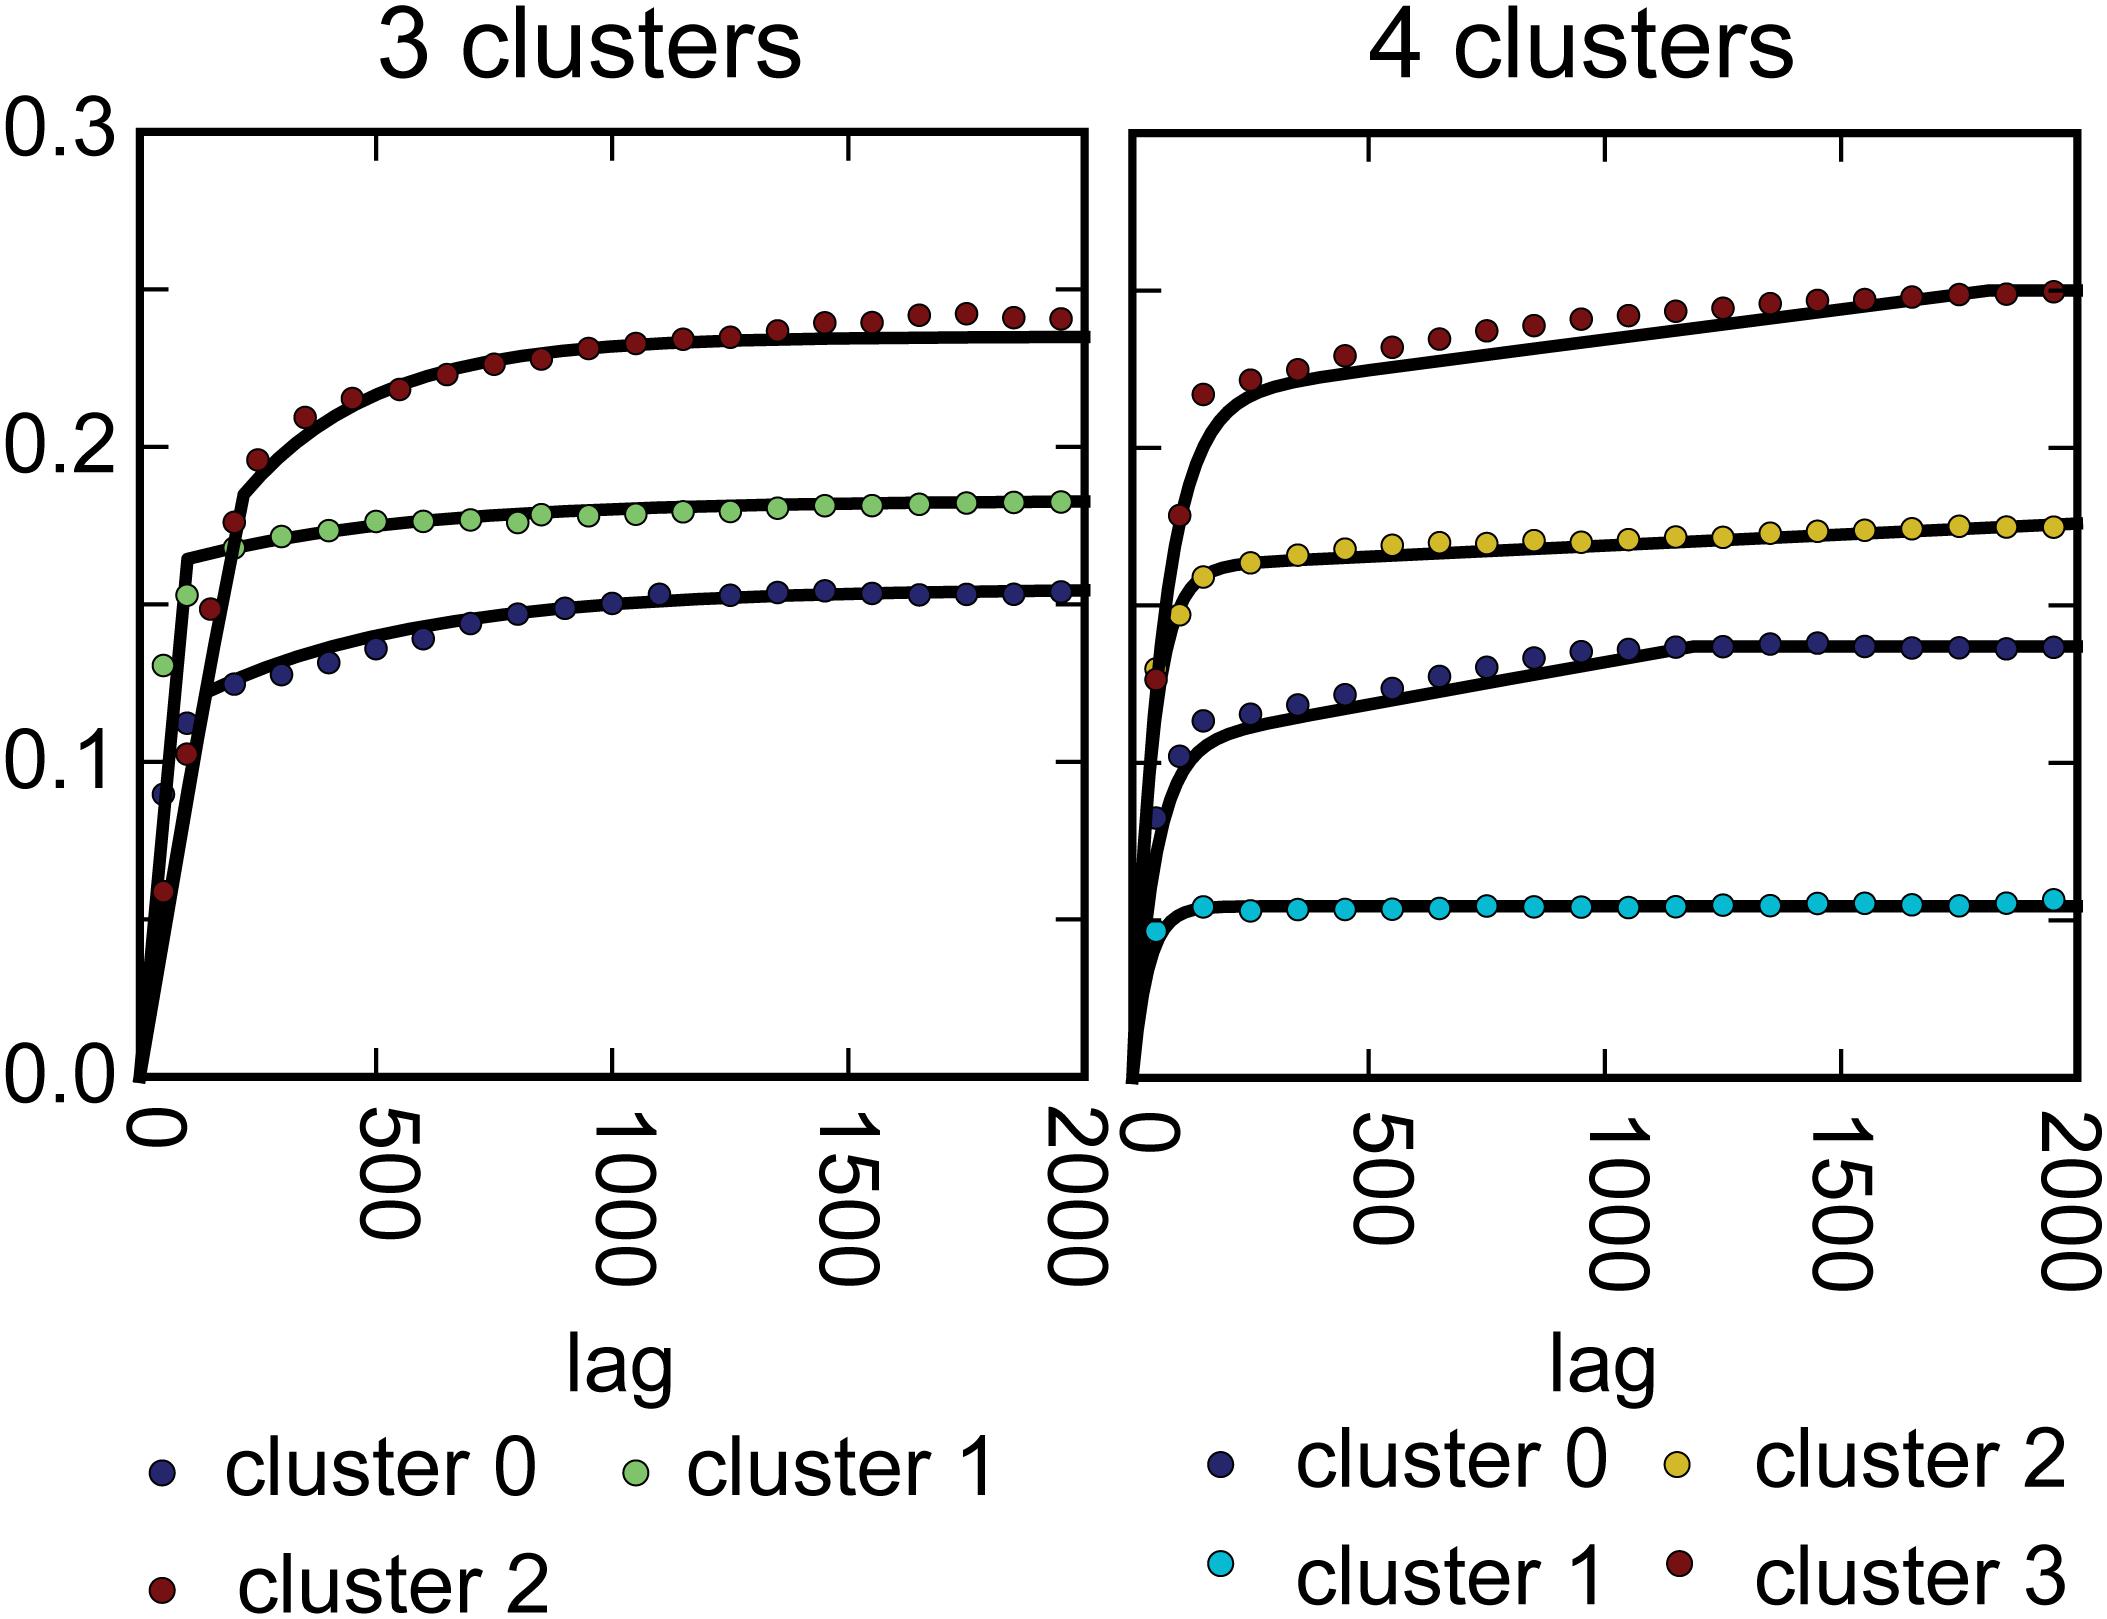
The outcome of the cluster analysis is a set of categorical values distributed in a three-dimensional space, which we can use to condition the generation of the subsurface realizations. The location of the categorical values is defined by the location and depth of the SkyTEM soundings and the locations and drilling depth of the boreholes. To fill the gaps between these data points, we use simple indicator kriging (IK) (Goovaerts, 1997, p. 293). Here, each cluster was treated as an indicator variable, which was each fitted with a variogram model. IK was then used to estimate the probability of each cluster distributed on a 3D grid. Based on these probabilities, an estimate of the most likely representation of the subsurface structure, given a predefined number of clusters, was created. This model constitutes the TI in the following simulations.

Table 1. Parameters used in the SNESIM simulations. Parameters are only defined when they deviate from the default values.
Multiple-Point Geostatistics
We could have used the estimated distribution of categorical variables together with the estimated variogram models to generate realizations of the subsurface structures with sequential indicator simulation (SIS) (Deutsch and Journel, 1998). This approach was used by Marker et al. (2017) for the same study area. However, SIS is limited by the amount of structural information that can be carried in the variogram model (Journel, 2005; Journel and Zhang, 2006). As the density of conditioning data increases, the dependency of the simulation result on the variogram model is reduced. However, to approximate the required data coverage the geophysical data had to be treated as hard data in the simulation. This constitutes a problem, since the probability of a given cluster will be dependent on the CF and the resistivity value of the pertaining data point. By treating the geophysical data as soft data, this information can be incorporated into the analysis, but it reduces the amount of hard data for the SIS, thus rendering it inapplicable.
To alleviate this problem, we have employed the MPS method single normal equation simulator (SNESIM) (Strebelle, 2002) in the present study. The higher order statistics incorporated in MPS methods allows them to capture and reproduce more complicated structures compared to variogram-based methods. Structural realizations will also create more coherent geological units, often making a better representation of actual field conditions. In SNESIM, the conditional information needed for the geostatistical simulation is obtained by scanning the TI. In SNESIM, this scanning is performed once, and the information is stored in a search tree structure. SNESIM is a sequential approach and it will visit each simulation node in the grid based on a random path. To incorporate hard data in the simulation, the data categories are assigned to the most proximate grid node prior to simulation. Soft data is incorporated into the analysis by updating the TI based probabilities, using the soft data probabilities. This update is done using the tau model (Journel, 2002). Conditional soft data must therefore be transformed into probabilities that can be used for conditioning. In the present study, this is done based on the conditional probabilities derived from cluster histograms. Alternatively, this information could be obtained from other statistical correlations between geophysics and lithology (Hermans et al., 2015; Barfod et al., 2016; Christensen et al., 2017b).
Single normal equation simulator is a complex algorithm, with many adjustable parameters. Fine tuning of the algorithm is therefore not always straight forward. In the present study, we derived our settings using a combination of the guidelines defined by Liu (2006) and He et al. (2014), and looping over parameter combinations using the Python interface implemented in SGeMS (Remy et al., 2009). The optimal parameters for the present study is defined in Table 1. These parameters were defined based on a compromise between simulation results and computational burden. Parameters are only defined for the subset of parameters that deviate from default values (Remy et al., 2009).
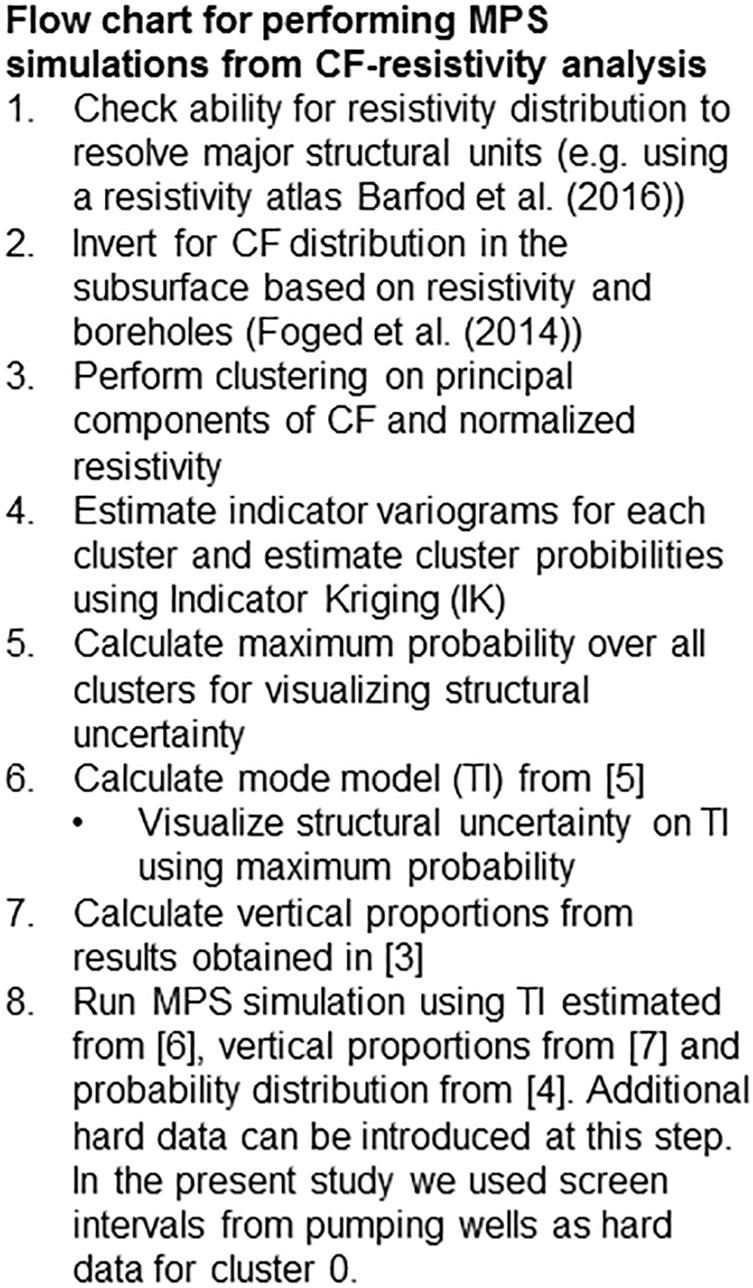
In the present study we used vertical proportions and soft conditioning to define the target distributions. Both were defined based on the outcome of the cluster analysis. The entire workflow for generating structural realizations from MPS based on CF-resistivity clustering is outlined in Figure 2.
Groundwater Model, Particle Tracking and Inversion
The groundwater model was defined in MODFLOW-USG (Panday et al., 2015). MODFLOW-USG is a control-volume finite difference version of the well-known USGS groundwater flow code MODFLOW (Harbaugh et al., 2000; Harbaugh, 2005). Recharge was incorporated using the recharge package. Major stream segments were simulated using the River package. Trenches and minor stream segments were simulated using the drain package. Groundwater abstraction wells were simulated using the well package, and outer boundary conditions on the regional model edge were defined as either no-flow or constant head boundaries. This was determined based on the local hydrological conditions.
All model realizations, generated using SNESIM, were incorporated into the groundwater flow model and calibrated using PEST (Doherty, 2016). This was done by introducing the local groundwater model in a regional model used to simulate the potential interactions with the regional flow system. The parameters included in the inversion were the horizontal hydraulic conductivities of the determined clusters (except for the largest cluster, which was fixed based on sensitivity analysis in both the three- and the four-cluster model). Vertical hydraulic conductivities were tied to their horizontal counterparts at a ratio of 1:10. The two other parameter groups were the conductance terms of the drains and the streams within the local area, and the recharge multiplier. The objective function was defined as
Where Nh is the number of steady state head observations, hsim is the model simulated hydraulic heads, and hobs are their observed counter parts. The residuals on the heads were weighted with the inverse of the observation standard deviation. Similar, qsimq, qobs, and σq are the simulated, observed and uncertainty of the stream flow data. For the head data we also introduced an arbitrary weight (wi) to the hydraulic heads. This was done to reduce the individual contribution to groups of observations located closely. All inversions were well posed, and we did not need to impose any regularization constrains.
To determine the catchment zones for the two pumping well scenarios we used mod-PATH3DU (Muffels et al., 2014). Catchment zones were determined using backward tracking with 16.000 particles from the pumping well to terrain. This number of particles was the minimum required to make the catchment independent on the particle starting locations. Particle starting locations were randomly distributed within a cylinder. The height of this cylinder was equal to the pumping-well screening interval, and the diameter of the cylinder was determined such that the amount of recharge occurring within the well catchment zone balanced the amount of groundwater abstracted by the well. This estimation was done by trial and error based on the calibrated mode model. The catchment was discretized into 50 m by 50 m cells, and a cell was determined to be part of the catchment if at least one particle terminated in the cell. This tracking was performed for each of the stochastically generated subsurface structures. Once completed, the catchment probability maps were generated based on an averaging over all realizations.
Results
Figure 3 shows the results of the k-means cluster analysis. The clustering was performed for three and four clusters. This was chosen based on two criteria. The three-cluster model was chosen since this is most comparable with the deterministic model available for the area, and the four-cluster model was chosen since this was deemed optimal in Marker et al. (2017), based on an optimal data fit criteria. The number of units are also limited by the resolution of the input variables. In this case consisting of resistivity and CF values. The subdivision of clusters in the clouds spanned by the resistivities and the CF can be seen in the bottom subplots (E and F). Each point in these clouds thus represents a single pair of CF and resistivity values. These clusters are then mapped in histograms for the resistivities (subplot A and B). These histograms can also be used to estimate the conditional probabilities based on the kernel density functions (subplot C and D).
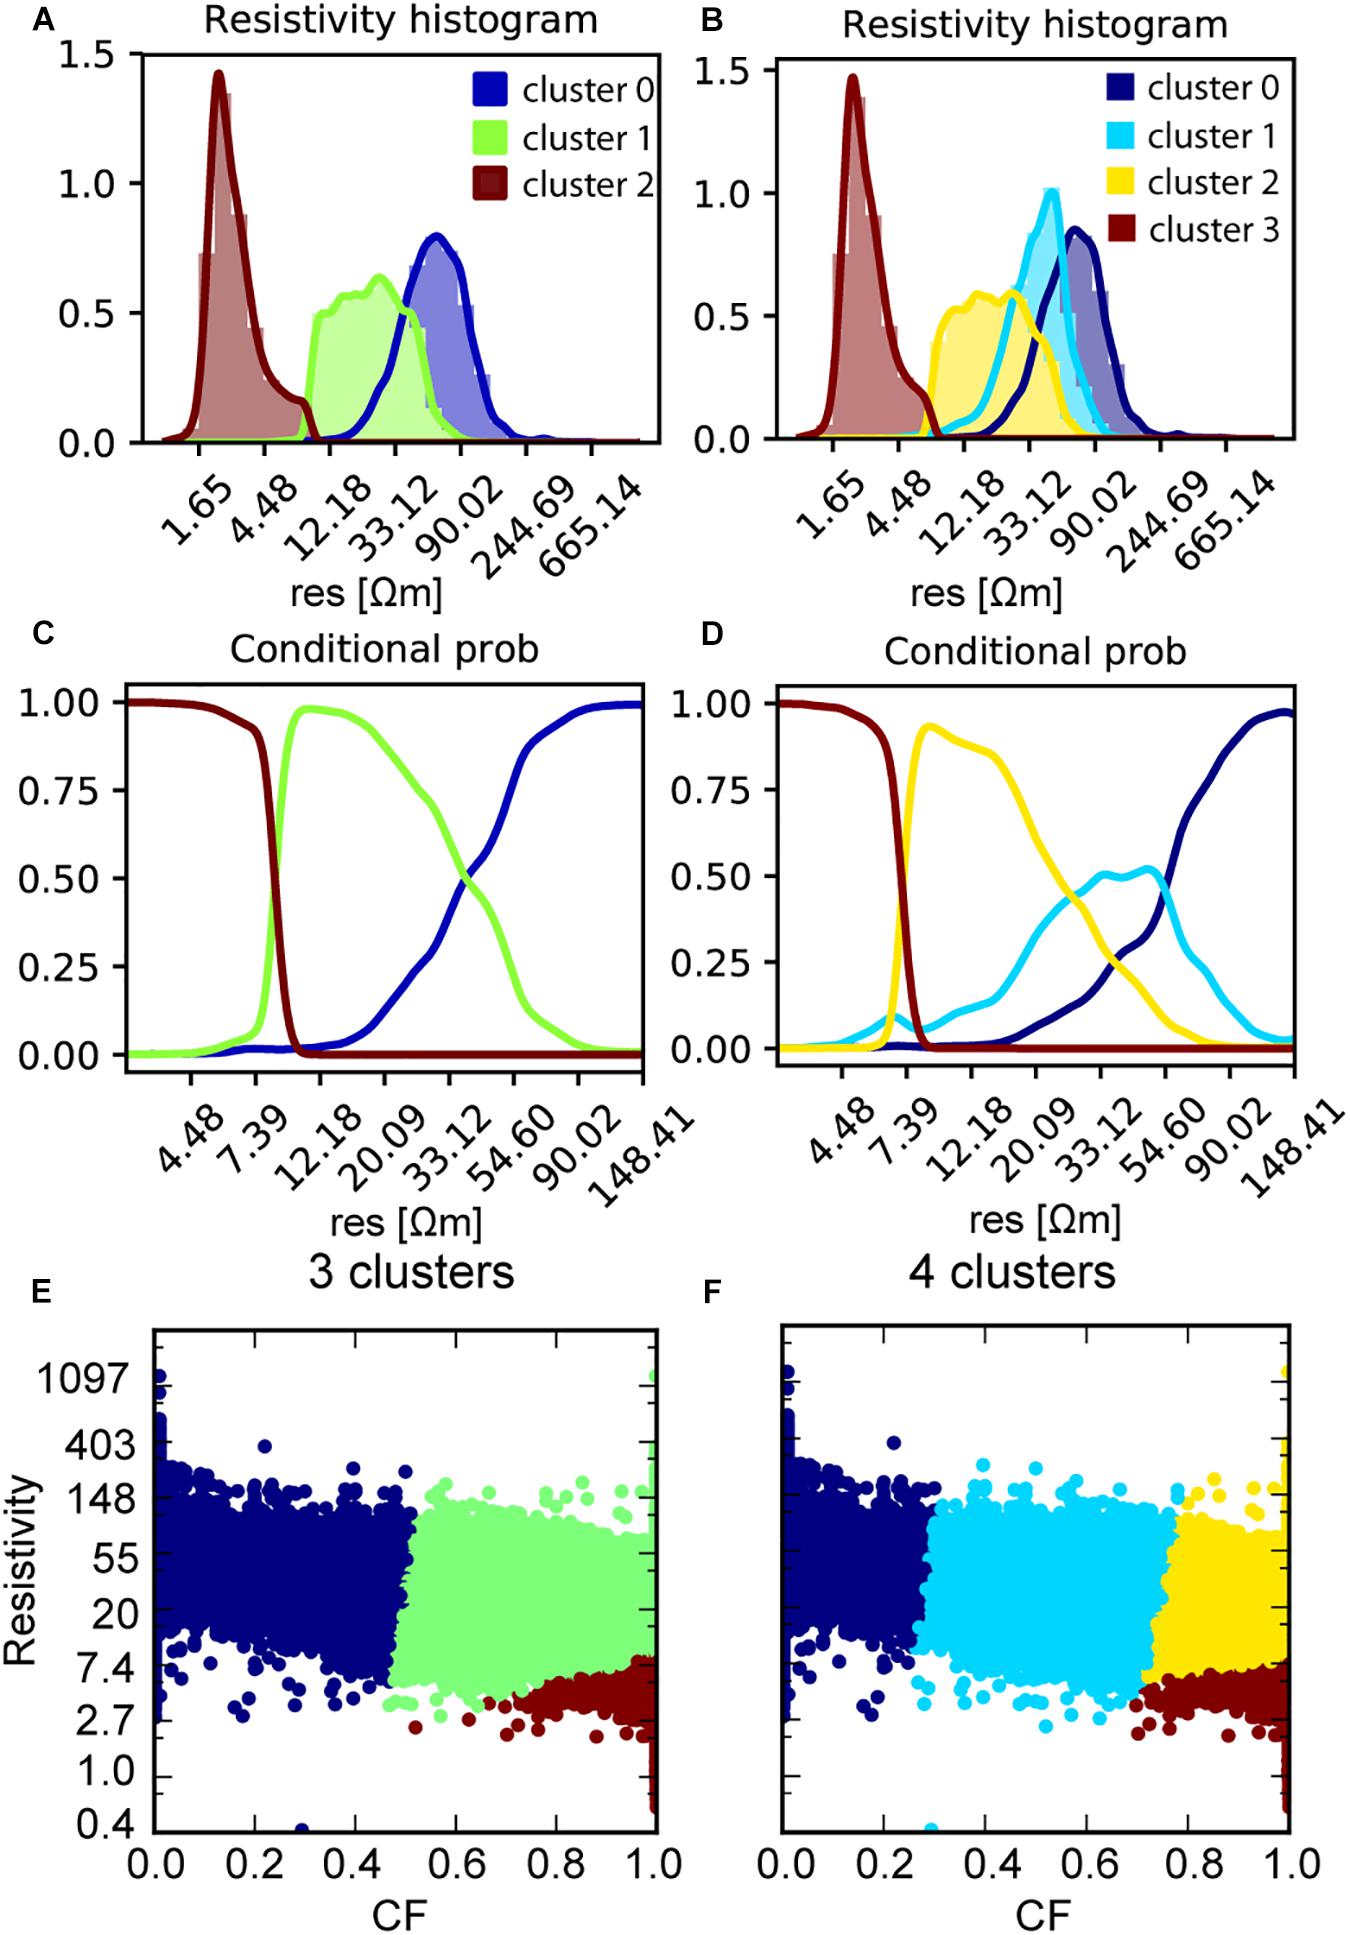
Figure 3. Results of the cluster analysis on CF and resistivities. (A) shows the result of the 3-cluster analysis plotted as histograms in the resistivities. (B) shows the histograms for the 4-cluster analysis on resistivities. (C) shows the conditional probabilities of the 3-cluster analysis. (D) shows the conditional probabilities of the 4-cluster analysis. (E) show clustering of the cloud spanned by resistivities and CF into 3 clusters. Finally, (F) shows the clustering of the cloud spanned by resistivities and CF subdivided by 4 clusters.
Each point in the data clouds represents a specific discrete interval in a resistivity sounding or a borehole. This means that the clusters can be mapped back as a point distribution in three dimensions. The fitted variogram models used for IK can be seen from Figure 4. Very importantly, the model obtained with IK (the mode model) is used as a TI in the MPS simulations. Cross sections through the mode model are shown in Figure 5. From the three-dimensional distribution of clusters, we can also calculate the vertical fractions of each cluster with depth. The result of this calculation can be seen from Figure 5. This information is used as additional conditional information in the SNESIM algorithm.
Figure 5 contains the information needed for the MPS simulations for the three-cluster model. A similar plot can be made for the four-cluster model, but this was considered redundant in the present case. The figure shows cross sections through the TI in the top left, and the vertical fractions in the top right. In the bottom, probability maps for each cluster are shown. These probability maps are determined from the conditional probabilities estimated using the histograms shown in Figures 3A,B. For each data point in space, we calculated the conditional probability of a given cluster based on the histograms. Subsequently, a variogram model was fitted to the probabilities for each cluster, and the probabilities were interpolated in three dimensions to fill out the model grid. Finally, the probabilities over all clusters were scaled such that they summed to one within each cell in the model grid. These probability grids are the ones shown in the bottom of Figure 5. The same methodology was used to estimate the probabilities in the four-cluster model. A similar methodology to estimate the probabilities was used by Hermans et al. (2015). The only conditional data that is not presented in Figure 5 is the hard data used in the analysis. Hard data were only used for screen intervals of pumping wells in groundwater model. In the MPS simulations, these intervals were conditioned to be part of cluster 0, namely the cluster with the highest sand fraction. This is a reasonable assumption, since most of these wells have been active for several years and must therefore be screened in sandy deposits.
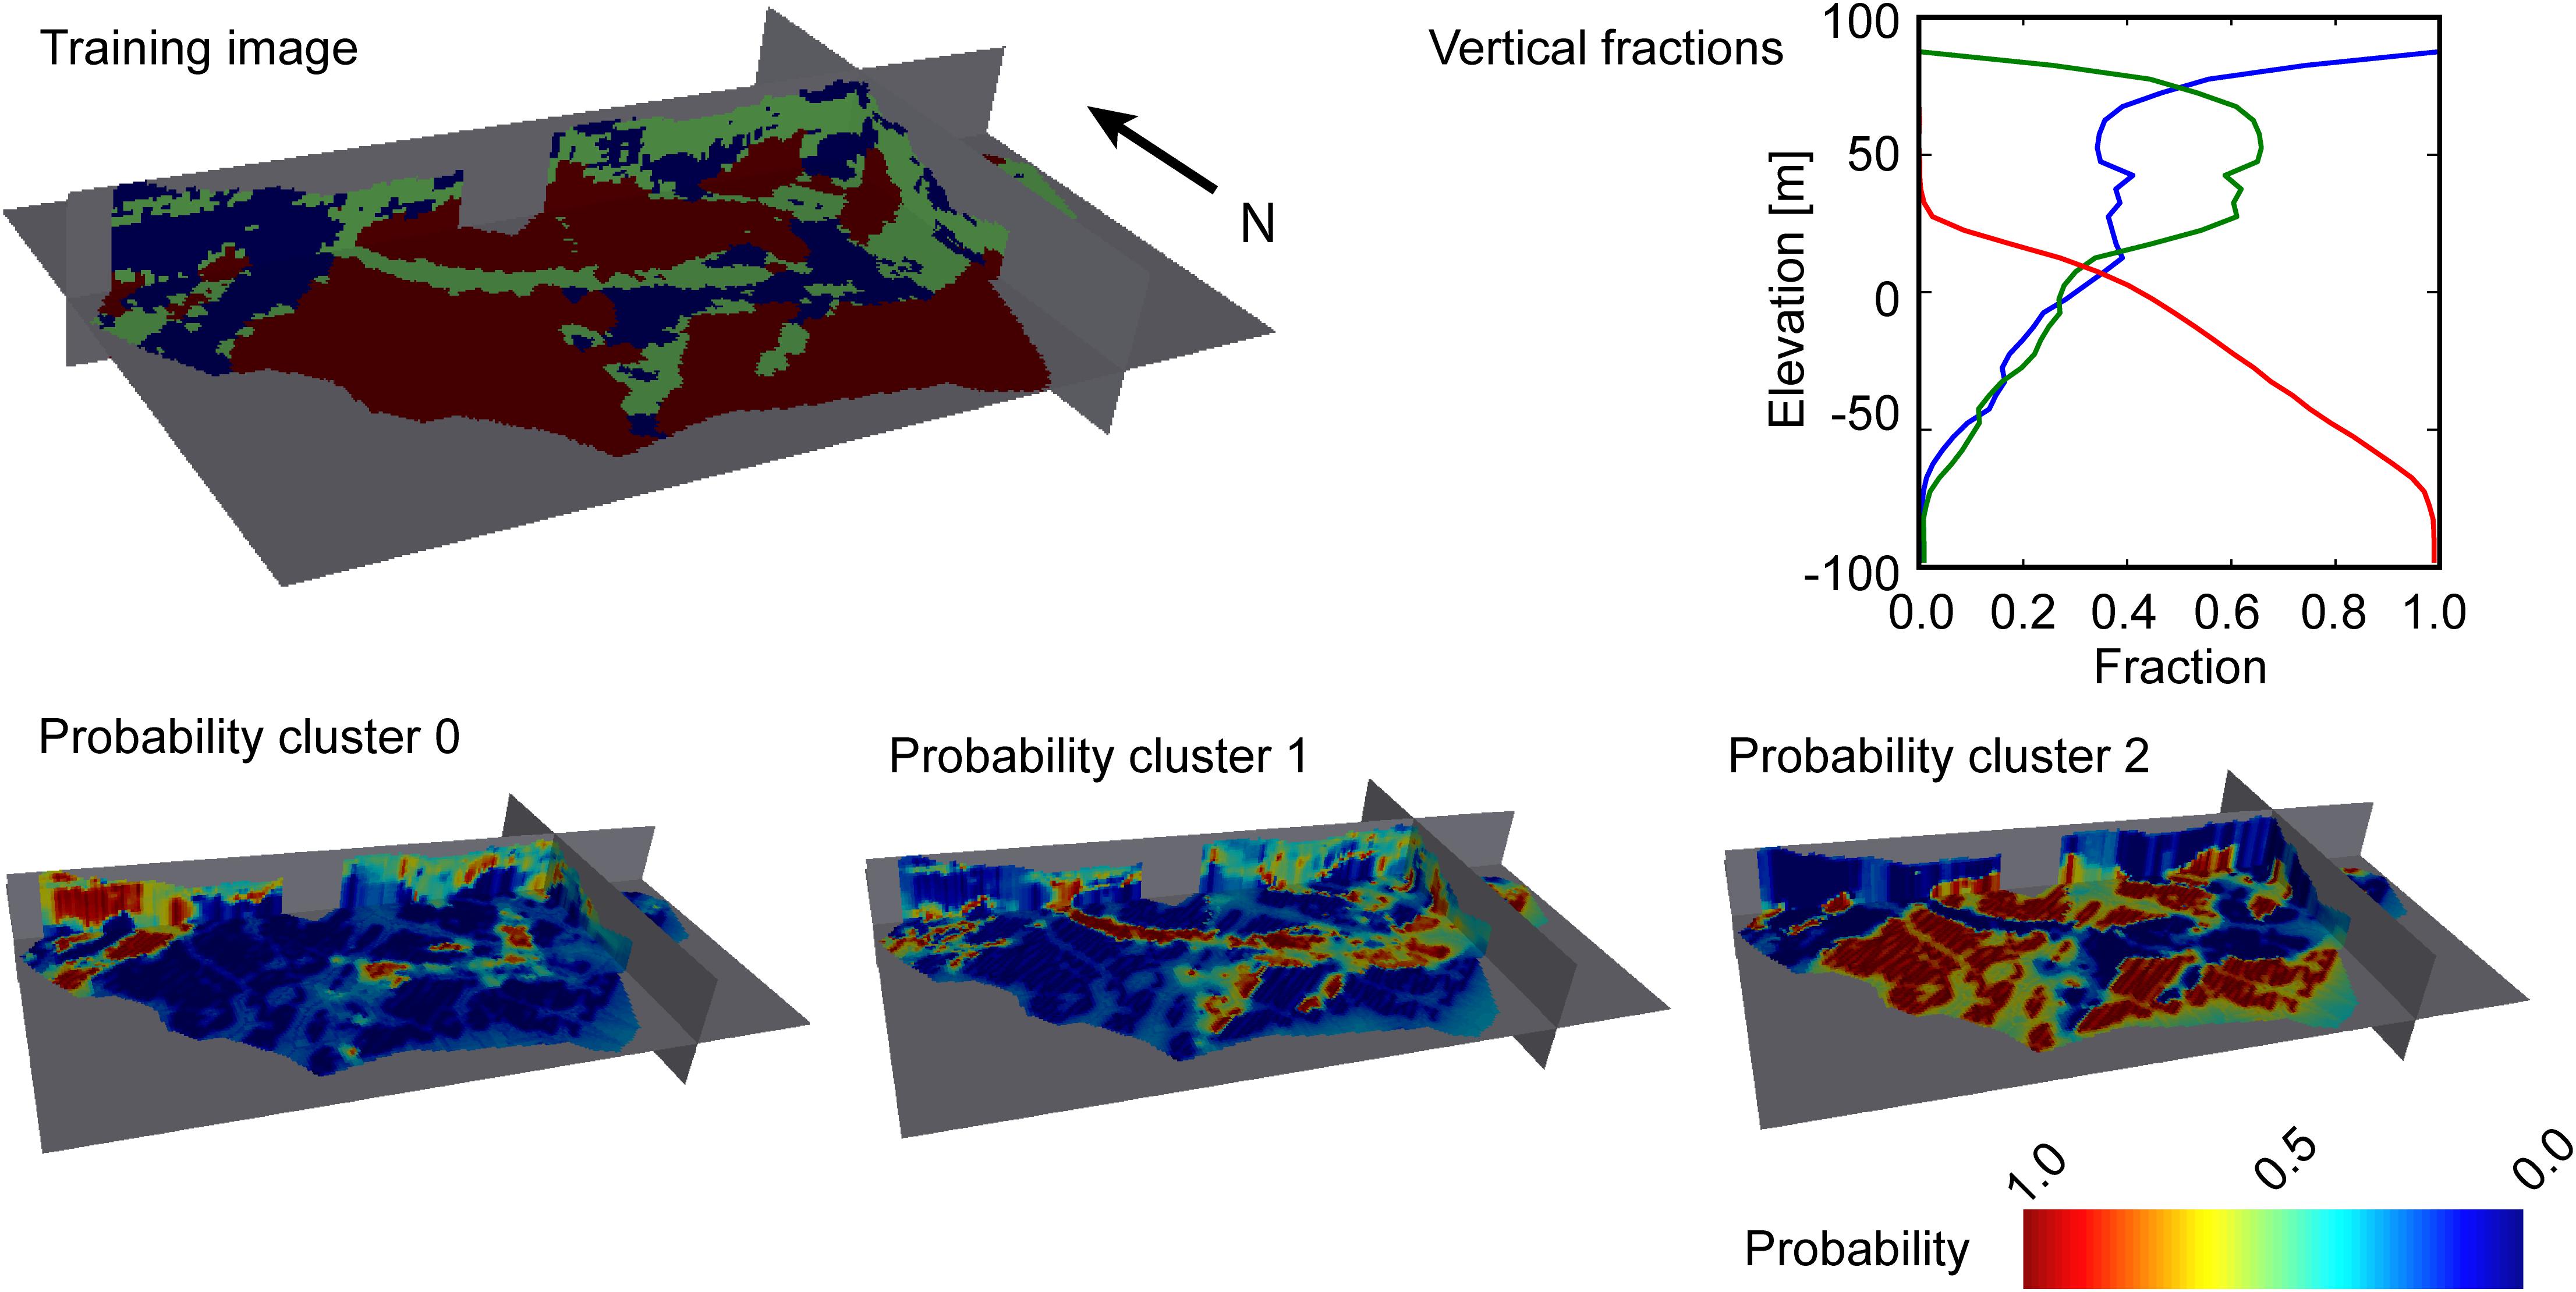
Figure 5. Example of the MPS inputs needed in the analysis. The figure shows the data derived TI, the vertical proportions obtained from the cluster analysis and the cluster probabilities derived from the conditional probabilities estimated based on the histograms in Figure 3A.
Besides using the estimated probabilities for conditioning the MPS simulations, they can also be used to illustrate the uncertainty of the underlying structures. Such plots have been generated in Figures 6, 7. Figure 6 shows a cross section through the Kasted well field (the location of the cross section can be seen from Figure 1). Figure 6A shows the cross-section through the three-cluster model, Figure 6C shows the cross section through the four-cluster model, and Figure 6D show the cross section through the deterministic model structure. Each of these models have then been overlaid with a transparency filter based on the uncertainties determined using the approach described above. Here transparent parts indicate high uncertainty. For the deterministic model we used the uncertainties derived from the three-cluster model. Similar plots can be seen for the cross section through the Ristrup well field in Figure 7. Based on the cross sections- some interesting aspects can be observed. First, many of the dissimilarities between the deterministic and the auto generated models are smeared out. Second, the plots conform with the background information from the area, namely that the heterogeneity and the uncertainty in the structure appears larger in the Kasted well field compared to the Ristrup well field. Making this comparison, it should of course be taken into account that the Kasted profile is three times as long as the Ristrup profile.
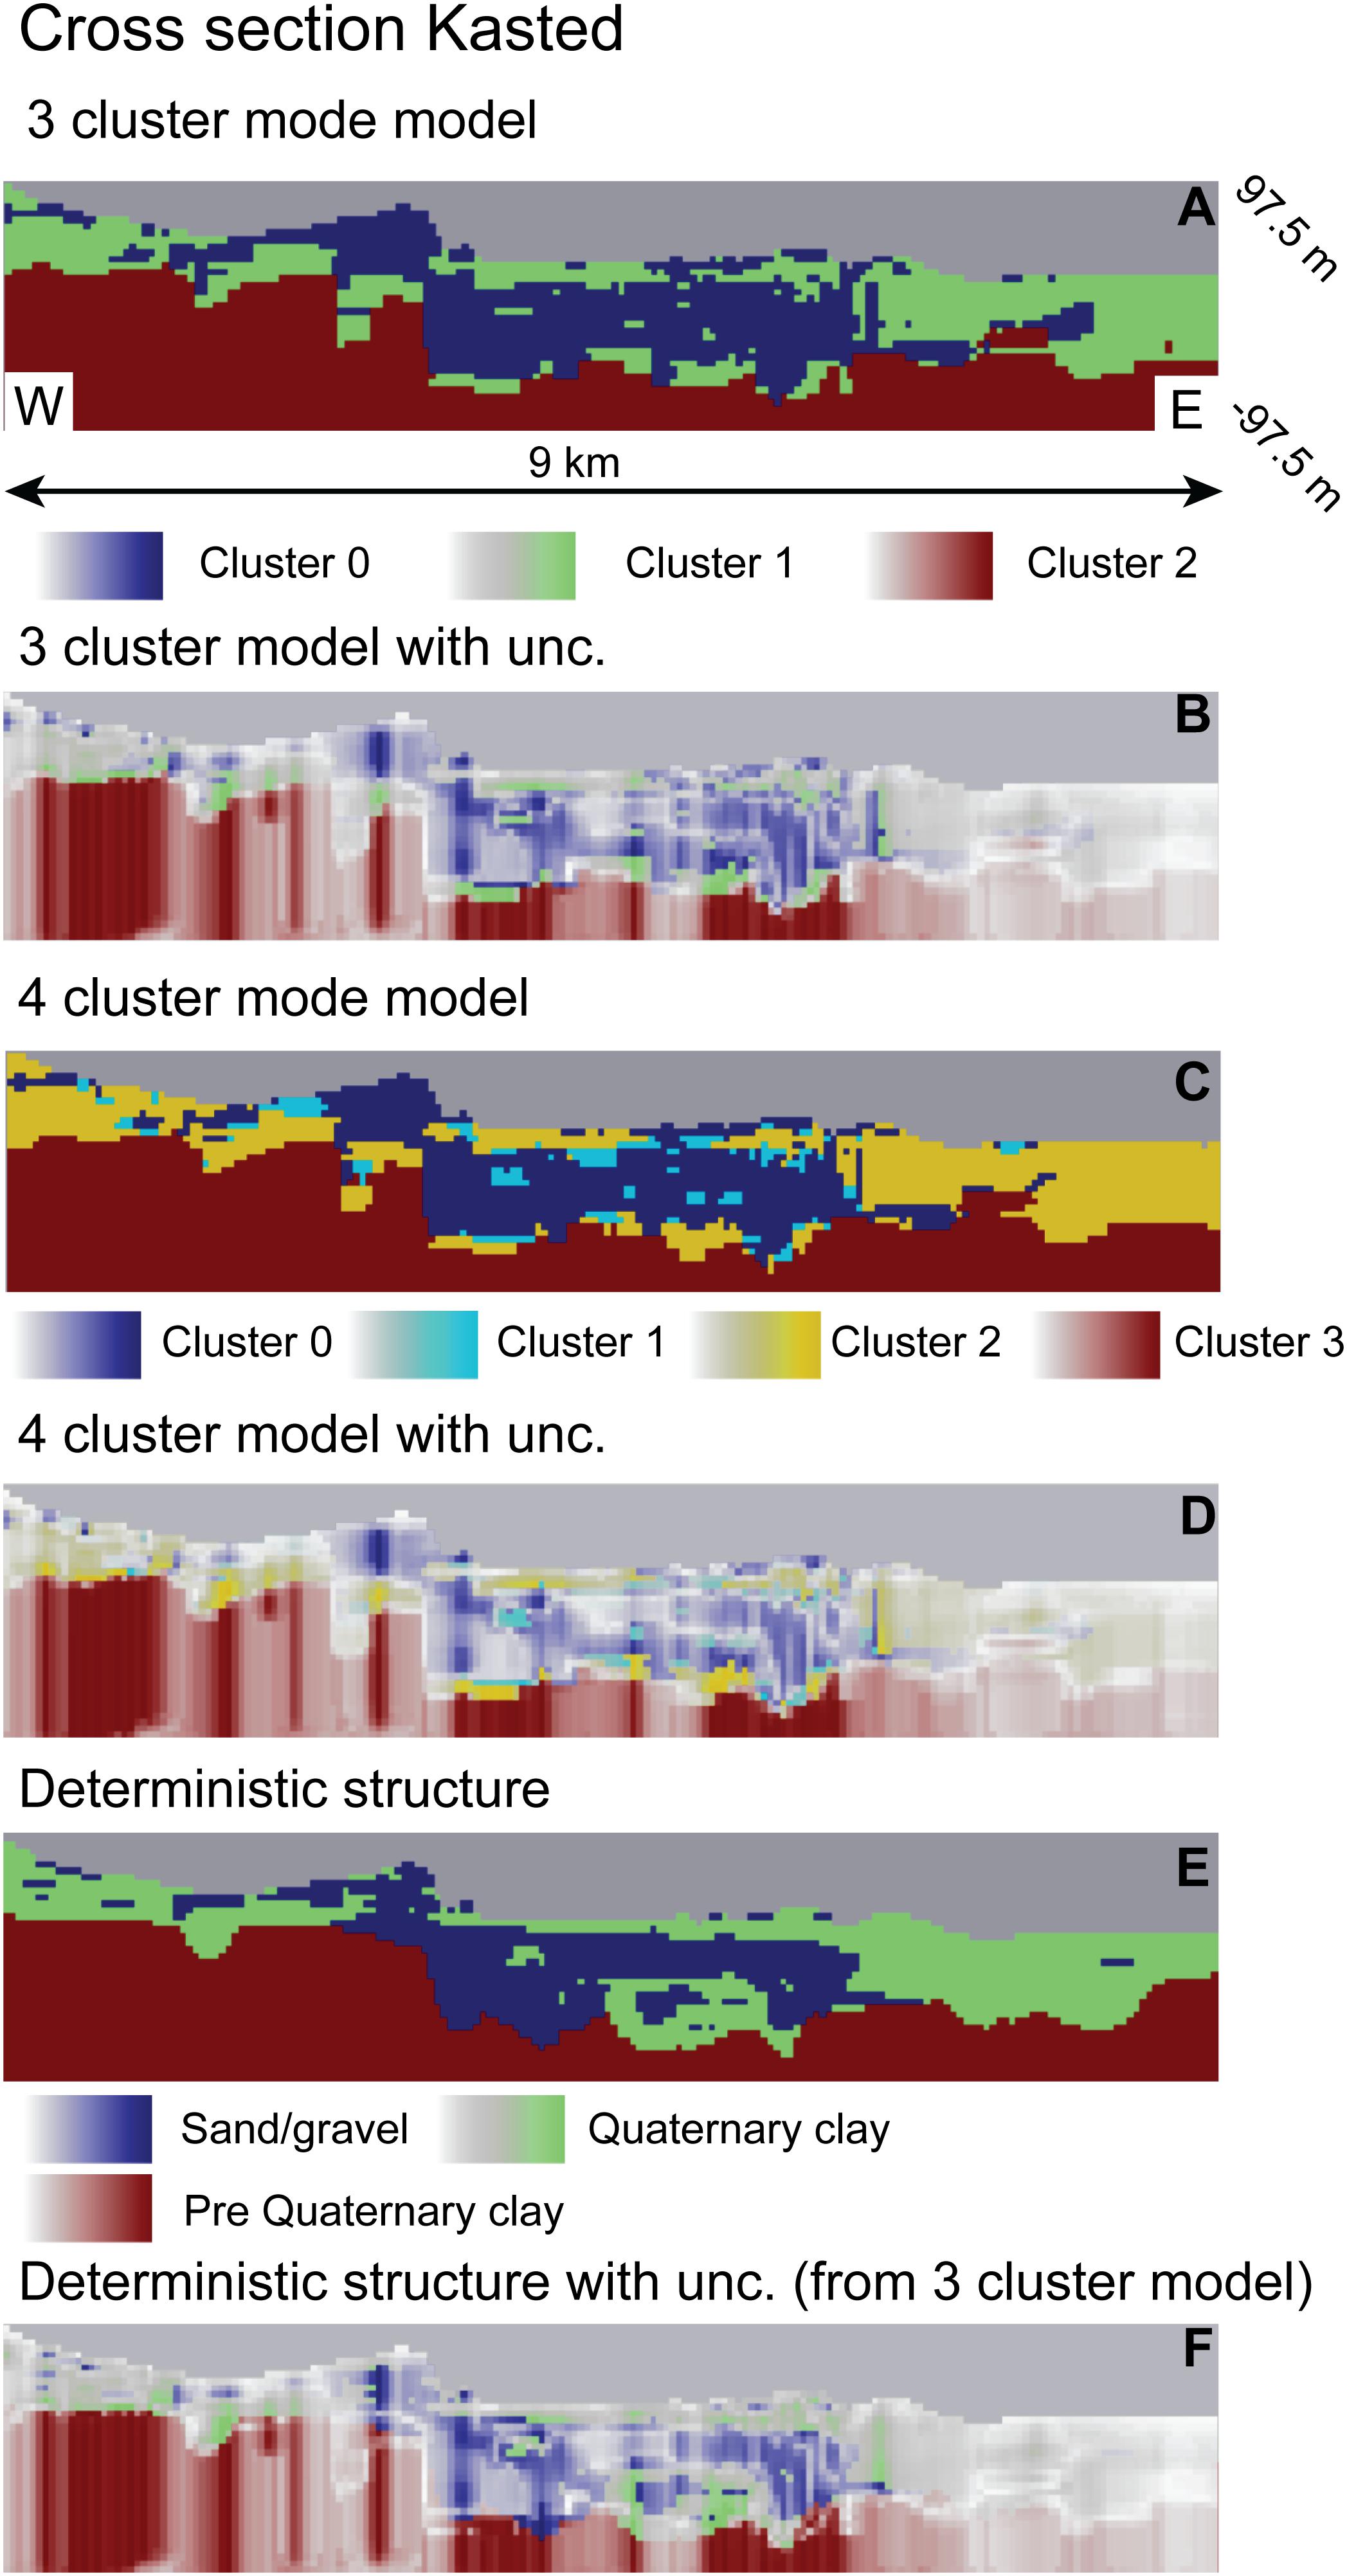
Figure 6. Cross section through the Kasted model (see Figure 1 for location). (A) 3 cluster TI, (B) 3 cluster TI blanked with uncertainty, (C) 4 cluster TI, (D) 4 cluster TI blanked with uncertainty, (E) Deterministic structure, (F) Deterministic structure blanked with uncertainty from 3 cluster analysis.
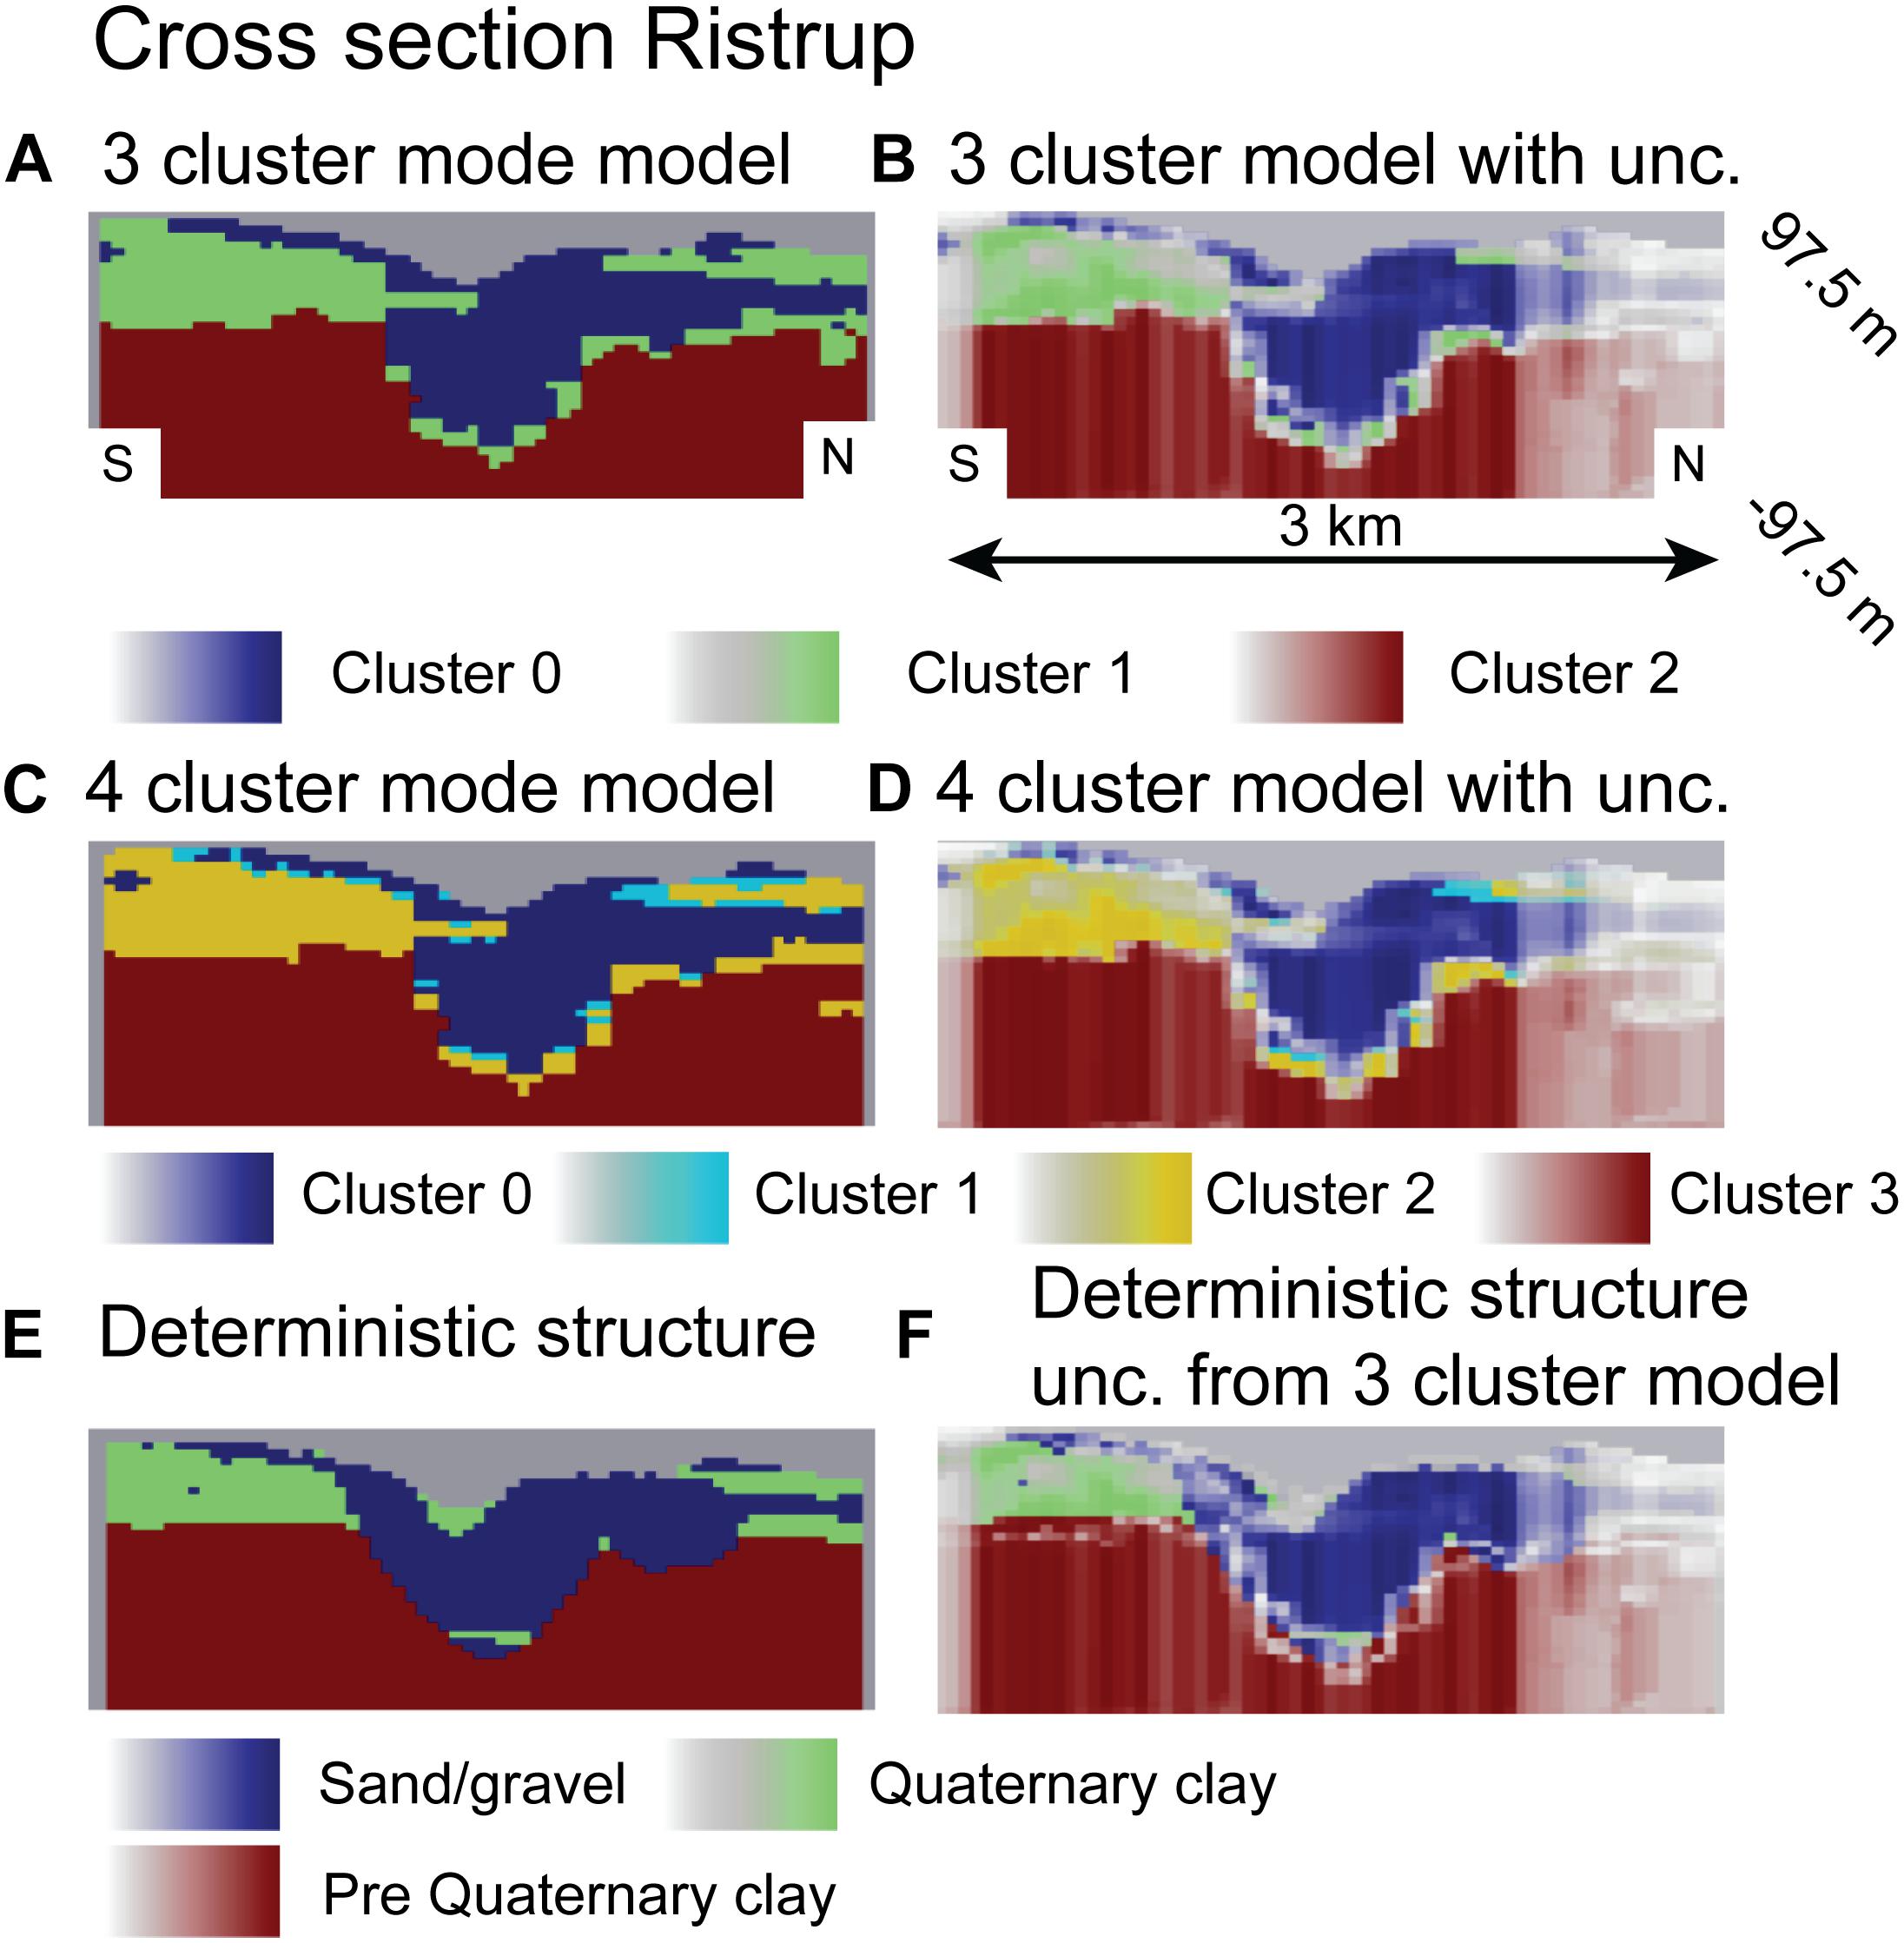
Figure 7. Cross-section through the Ristrup model (see Figure 1 for location). (A) 3 cluster TI, (B) 3 cluster TI blanked with uncertainty, (C) 4 cluster TI, (D) 4 cluster TI blanked with uncertainty, (E) Deterministic structure, (F) Deterministic structure blanked with uncertainty from 3 cluster analysis.
Figure 8 shows a horizontal cross-section through the same depth interval of the deterministic model, the TI, three out of the 100 generated model realizations generated using SNESIM, and three model realizations generated using SISIM. The model realizations generated with SNESIM have much more resemblance with both the manual interpretation and the TI. Also, the realizations generated with SISIM, show patterns with limited correlation to either of the remaining models presented on the figure. It should also be noted, that the three realizations generated with SISIM are quite similar. This is a feature caused by using the geophysical data as hard data in the simulations.
The generated model realizations from SNESIM were all incorporated into the groundwater model, and calibrated to hydraulic heads and stream flows. The result of this calibration with respect to simulated and observed hydraulic heads can be seen from Figure 9. By comparing the three plots, the performance of the models is similar. There is a slight scatter about the identity line, but it appears similar for the three setups, both with respect to distance and outliers. Taking the structural uncertainty into account, most simulations estimated using the deterministic modeling approach fall within the simulated uncertainties of the structural realizations.
Analyzing the estimated parameter values, the log transformed hydraulic conductivity for the three-cluster model is −4.97 m/s for cluster 0 with a standard deviation of 0.14 and −5.21 m/s for cluster 1 with a standard deviation of 0.27. Cluster 2 was fixed in the inversion, due to the very low hydraulic conductivity of this unit. The value for cluster 1 may be a bit high compared to the expected value, but it is not unreasonable, taking the uncertainty into account. It is also in line with the expected result, that the uncertainty of the more clay dominated cluster 1 is larger than the sand dominated cluster 0. For the four-cluster model the parameters are (uncertainty in brackets) −5.00 m/s (0.14) for cluster 0, −5.02 m/s (0.75) for cluster 1, and −5.82 m/s (0.59) for cluster 2. Cluster 3 was fixed for the same reasons as outlined above. These parameter values are also in line with the expected, except maybe for cluster 1, which is a bit high, but its pertaining uncertainty is also high due to its limited presence in the model. This can also be seen from the cross sections on Figures 6C, 7C. The data fits obtained in this study are very similar to those obtained by Marker et al. (2017).
All the calibrated models were subsequently used to forecast the location of the catchment zones for the wells at the two different well fields. The result for the Kasted well using the three cluster models can be seen from Figure 10. The figure has been subdivided into two plots, one containing the estimated probability using the structural realizations (subplot A), and one containing the catchment probability overlaid with the particle endpoints obtained from the deterministic structure. Based on the model realizations, the majority of the deterministic catchment is contained within the uncertainty of the stochastic simulations. The only discrimination between the two is in the tail stretching toward the west. The tail of the stochastic realizations is offset toward the north. Subplot B also shows the outline of the catchment estimated by Marker et al. (2017). The general trends in the estimated catchments using the SISIM and the SNESIM approach are similar. However, the SNESIM approach is closer to the catchment of the model based on the deterministic structure.
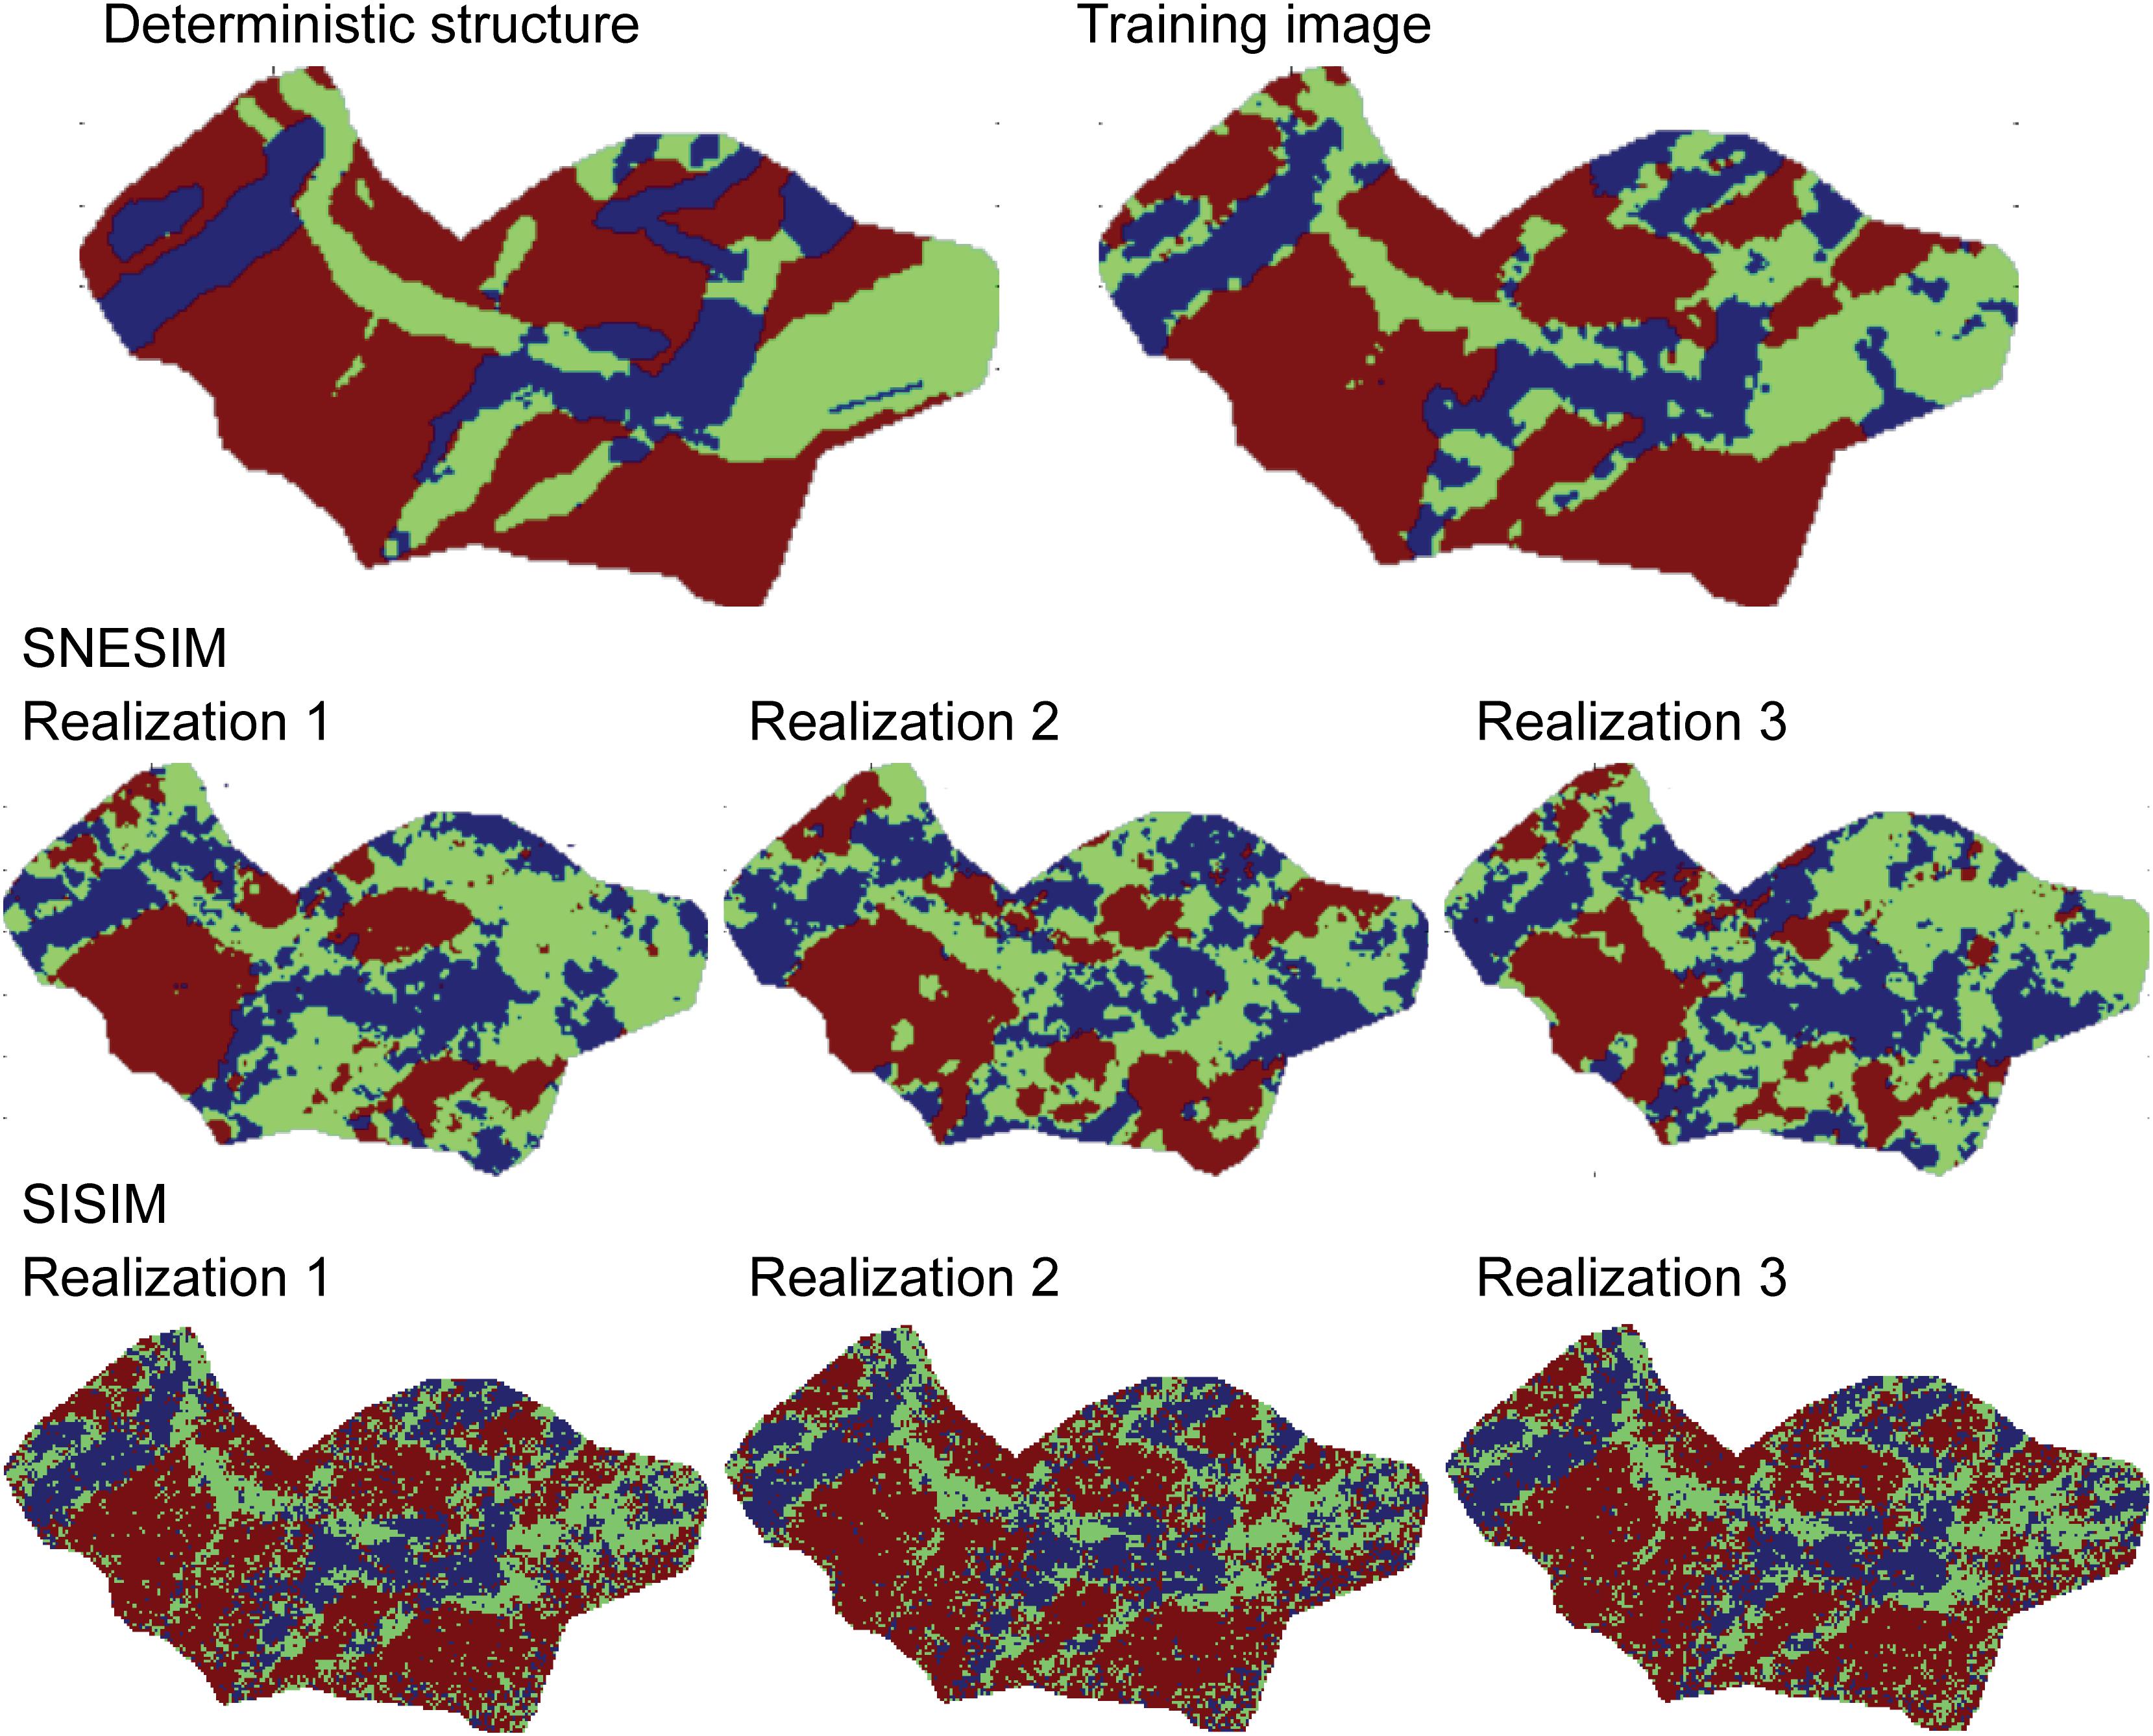
Figure 8. Deterministic structure and TI together with three structural representations generated using SNESIM and SISIM, respectively.
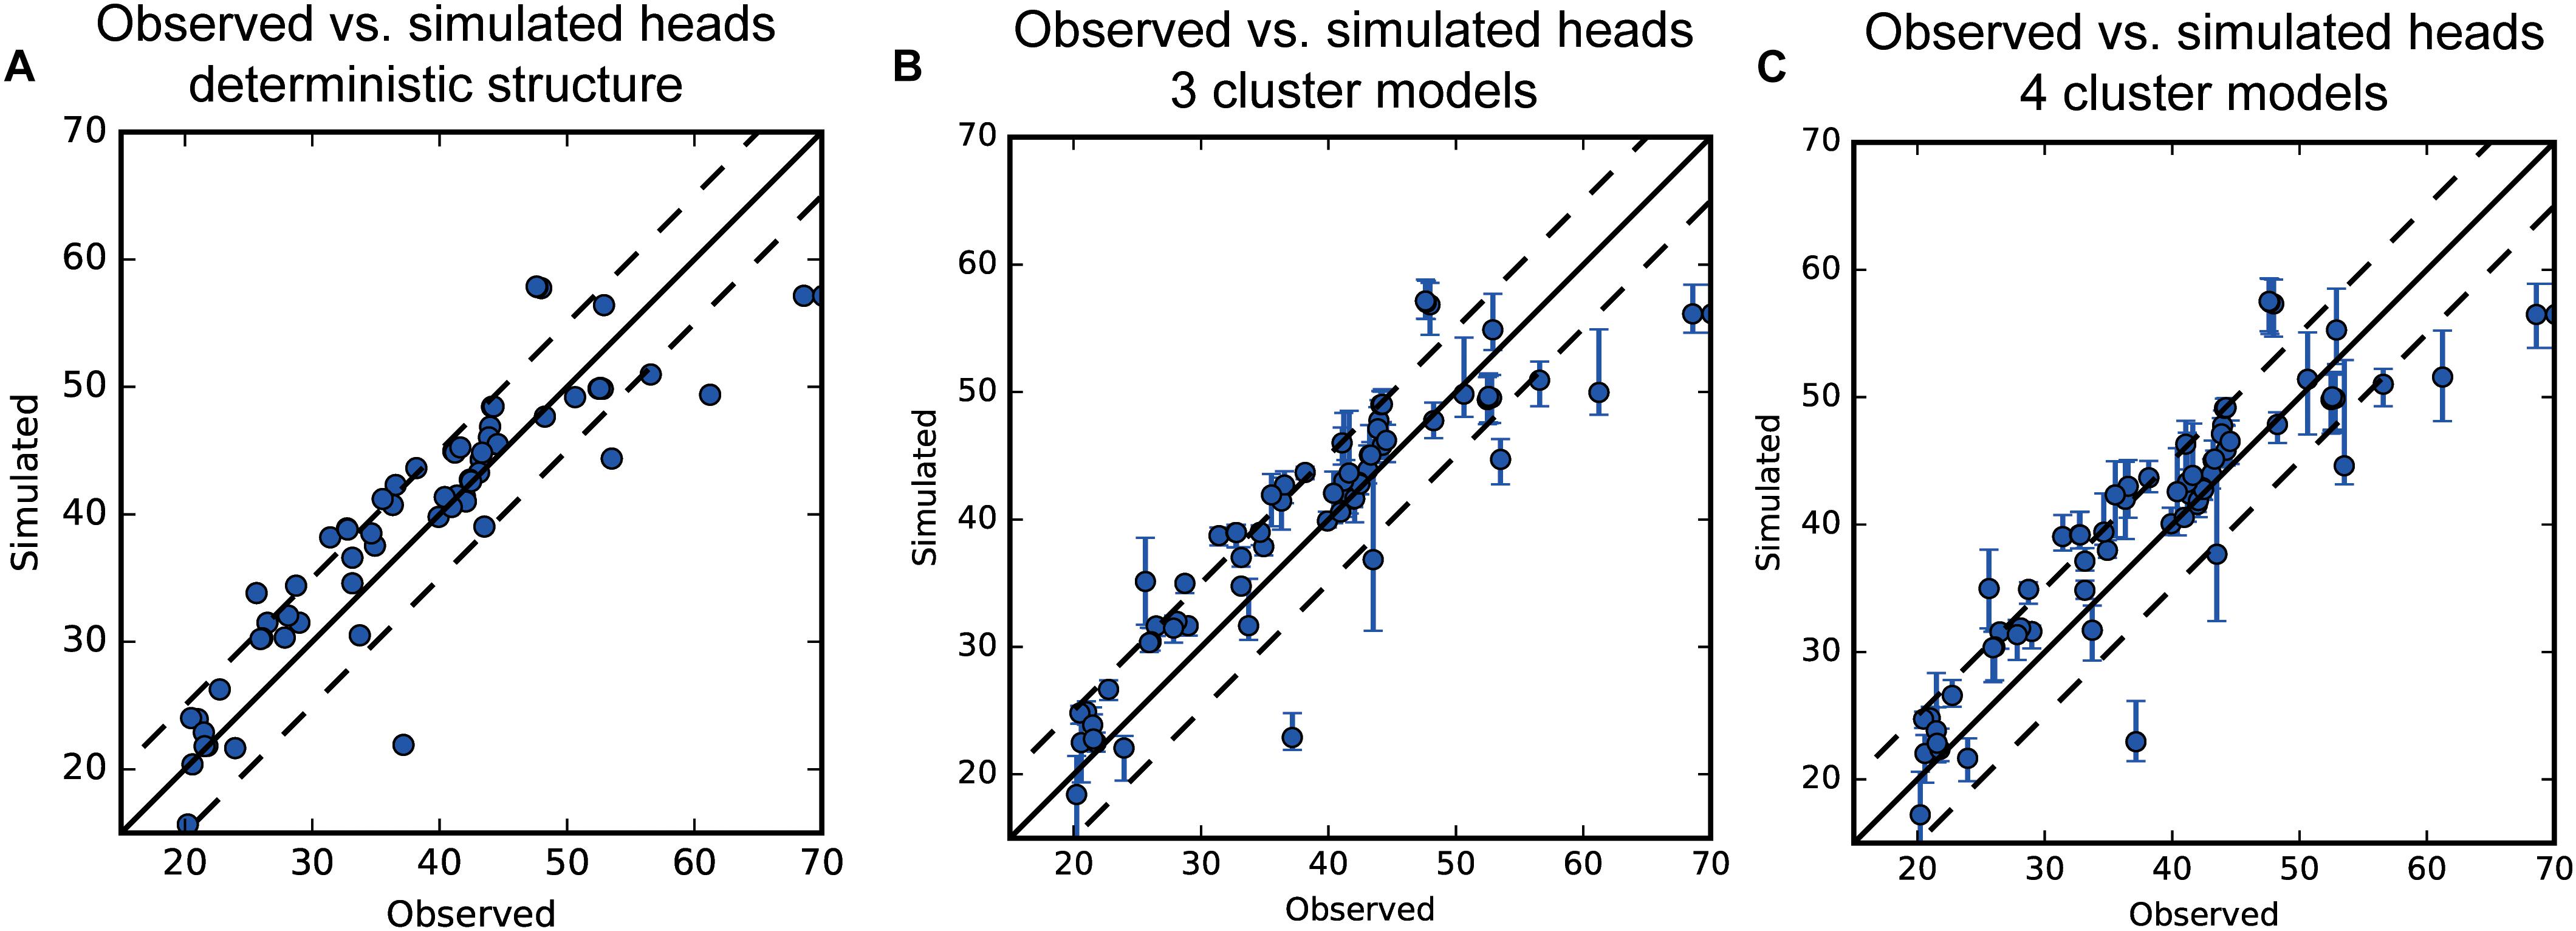
Figure 9. Observed vs. simulated steady state heads. (A) Deterministic model structure, (B) 3 Cluster models, (C) 4 cluster models. Dotted lines show the plus and minus 5 m offsets from the identity line.
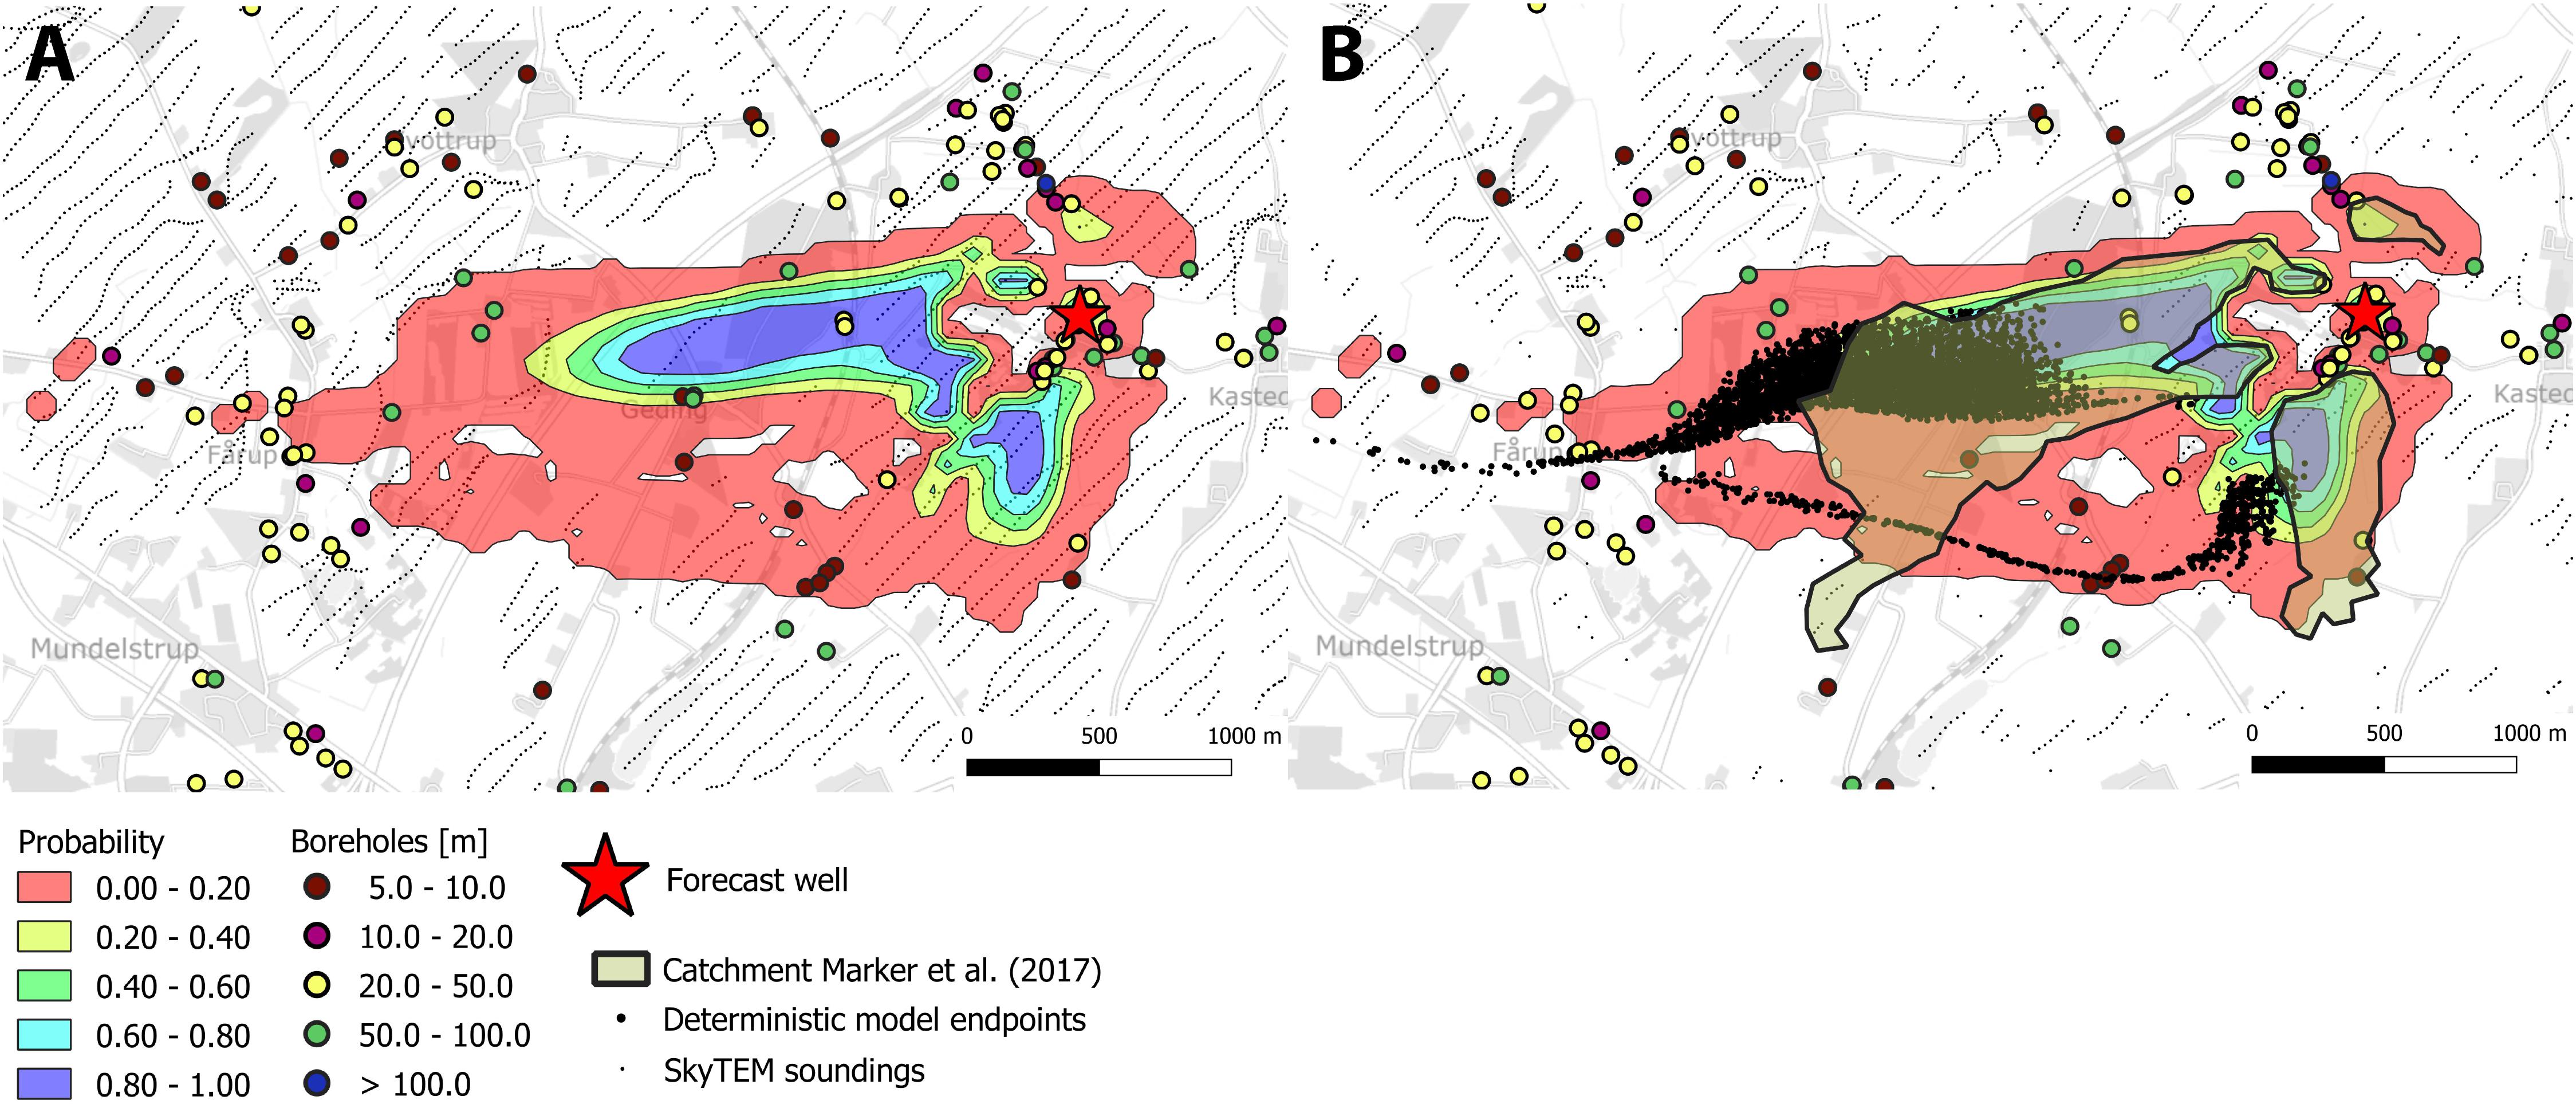
Figure 10. Probability plots of well catchment zones for the Kasted well estimated from the three cluster model realizations. (A) Catchment probability (B) Probability map overlaid with catchment from deterministic model and outline from Marker et al. (2017).
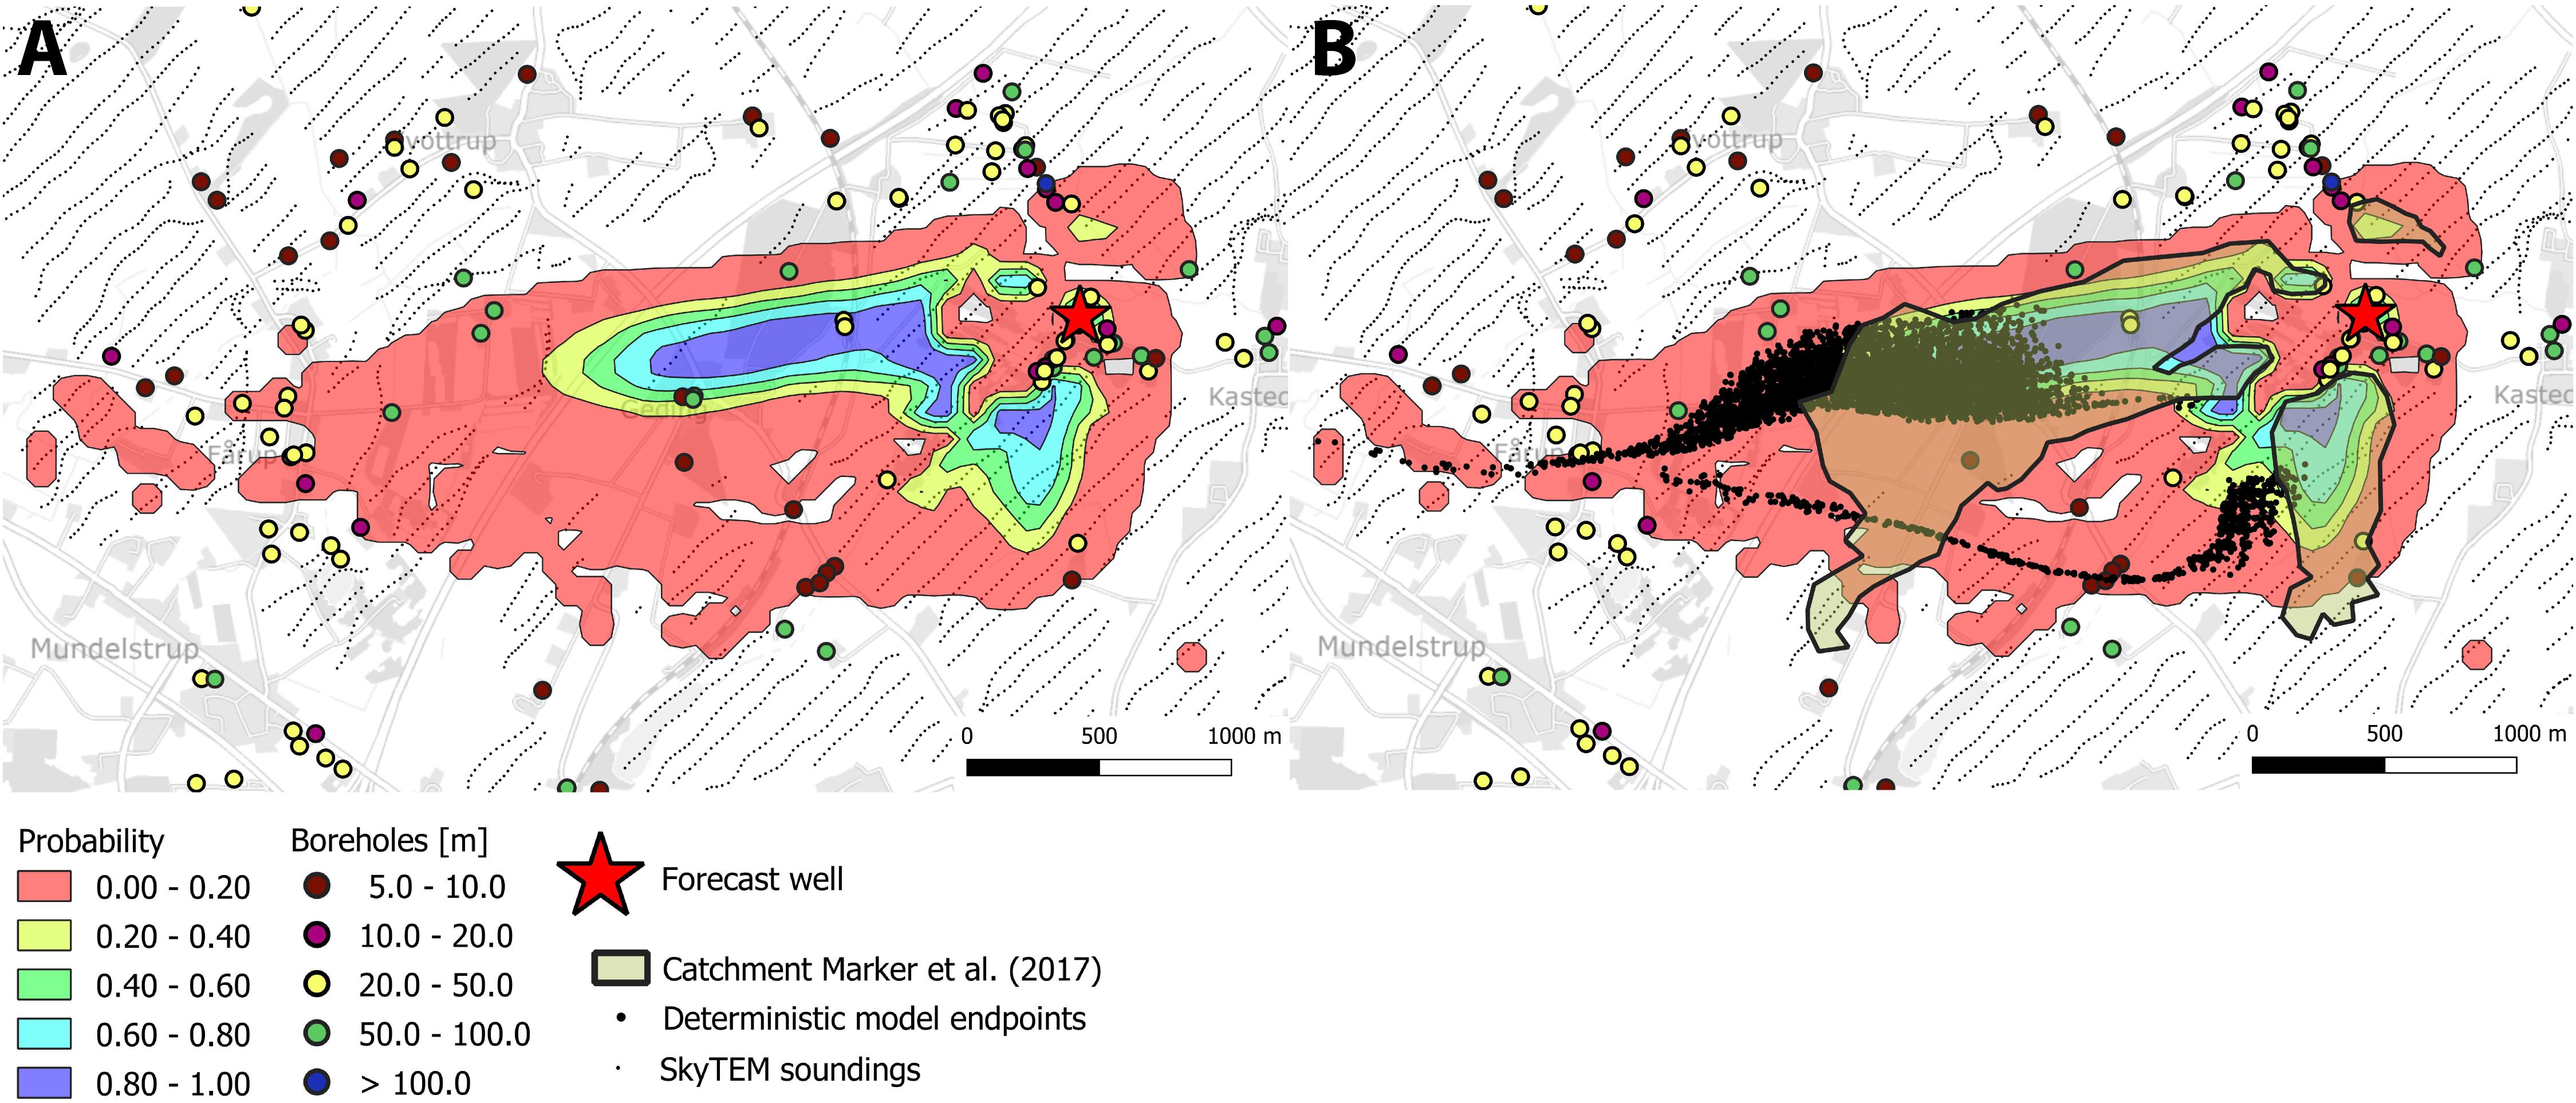
Figure 11. Probability plots of well catchment zones for the Kasted well estimated from the 4-cluster model realizations. (A) Catchment probability (B) Probability map overlaid with catchment from deterministic model and outline from Marker et al. (2017).
The catchment probability for the Kasted well estimated using the four-cluster model is presented in Figure 11. Only small differences can be observed between the catchments estimated with the three and the four cluster models. These are all observed in the low probability region, but almost the entire catchment estimated by the deterministic model structure is contained by the stochastic models.
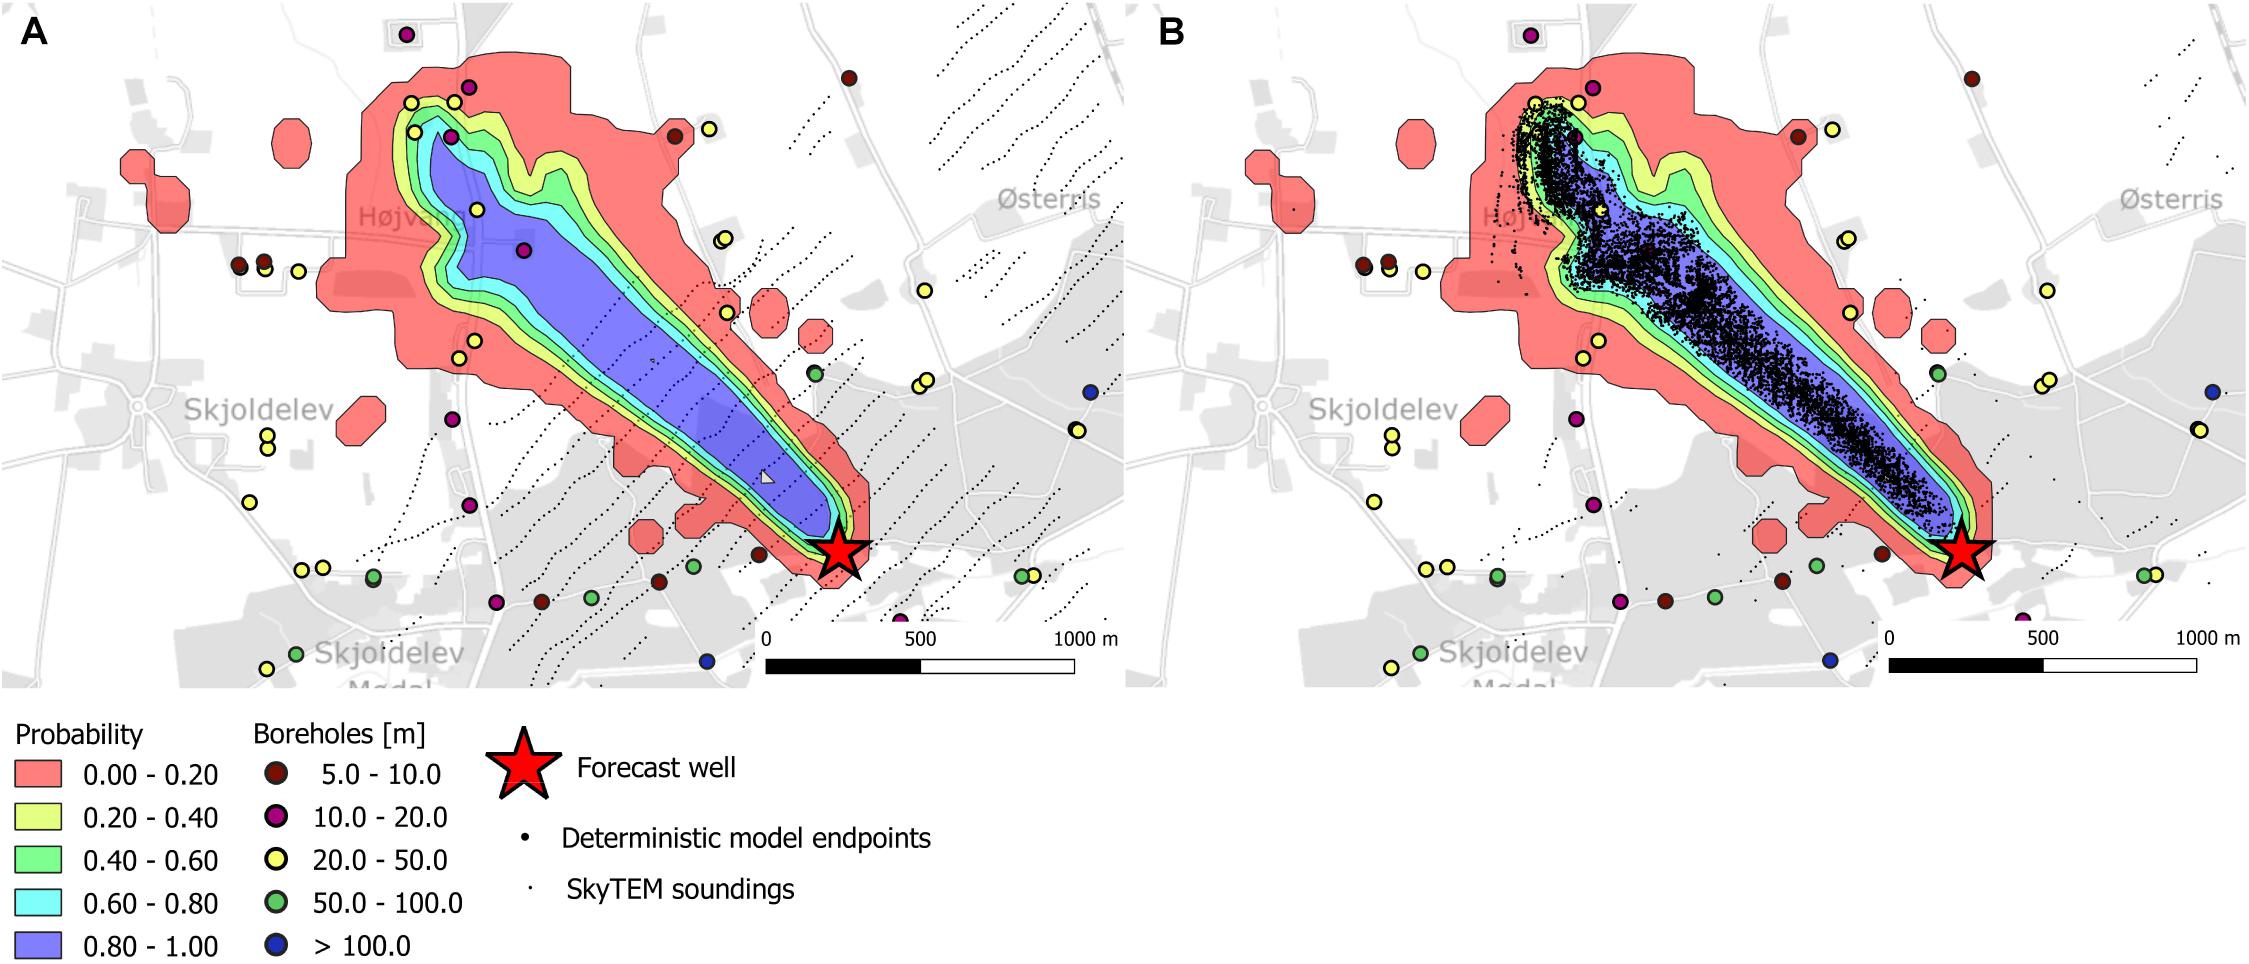
Figure 12. Probability plots of well catchment zones for the Ristrup well estimated from the 4-cluster model realizations. (A) Catchment probability, (B) Probability map overlaid with catchment from deterministic model.
For the Ristrup well, we have only presented the well catchment using the four-cluster model. These results can be seen from Figure 12. Here, the solution is dominated by the effect of the better resolved geology. This is caused by a full coverage with geophysics and the higher resistivity contrasts. Combined, this results in an overall decrease in uncertainty which can be overed by comparing observed in Figures 7B,D compared to Figures 6B,D. In the plot this is also apparent from the estimated catchment probabilities, especially when these are compared to the catchments estimated using the deterministic structure. These are much better aligned compared to the Kasted Well (Figure 11).
Discussion
In this study we have documented a methodology to automatically generate subsurface structures directly from geophysical data and borehole descriptions. The methodology is fast and reproducible, meaning that realistic subsurface structures for hydrological models can be generated in a few days, once the input data have been prepared. For the geophysical data this includes processing and inversion, and for the lithological data this includes a quality control. In the study, we have extended the CF-resistivity clustering method (Foged et al., 2014; Marker et al., 2015, 2017) to include MPS. This has a major benefit with respect to reproducing the structural patterns observed in the TI, which cannot be resolved using the two-point statistics contained in a variogram model. In the present study this is evident by comparing structural realizations generated using SISIM and SNESIM (Figure 8). Here, the SISIM realization have limited resemblance with both the TI and the manual interpretations of the subsurface structures. Moreover, we also argue, that similarities between the SIS generated models are much larger than the models generated with MPS. This is an artifact of applying the geophysical data as hard constraints, and applying 2-point statistics that cannot preserve to expected connectivity of the subsurface structures. To avoid over conditioning the MPS simulations we have updated the framework such that CF estimates and resistivity data are not considered as hard data in the analysis. This is an important contribution, since the uncertainty of the pertaining cluster is highly dependent on the estimated resistivity. This can easily be acknowledged from the conditional probabilities in Figure 3B. A resistivity value of approximately 40 Ωm would result in cluster 1, but the probability that this is actually cluster 0 is approximately 30%. In the present study we have utilized the SNESIM algorithm, but the proposed methodology could be utilized with other MPS methods such as e.g., direct sampling Mariethoz et al. (2010) or image quilting Hoffimann et al. (2017).
One of the challenges faced when including geophysical data in automated structural modeling is that the smoothness constraints often imposed as regularization in the geophysical inversion lead to smooth transitions between different subsurface units. Most often, these results are not directly related to changes in lithology, since the smoothing effect caused by the regularization results in a smearing of layer boundaries (Jørgensen et al., 2013). To avoid this unwanted effect, we have adopted the sharp inversion formulation in the present study (Vignoli et al., 2015). This regularization imposes a penalty on gradients in resistivity, thus producing fewer, but sharper transitions between layers in the geophysical model. This methodology has already proven advantageous in groundwater modeling studies (Christensen et al., 2017a) and structural interpretations (Barfod et al., 2018). Despite having sharp layer boundaries in individual 1D resistivity models, these have to be interpolated if a full 3D representation of the subsurface resistivity is required. Traditionally this is done using kriging, thus resulting in smooth transmissions in-between the sharp resistivity models. Similar to the limitations outlined above, these smooth transitions are not representations of the subsurface lithology, but an effect of the interpolation methodology (Jørgensen et al., 2013; Høyer et al., 2015). Utilizing such resistivity grids in automated structural modeling will unavoidably lead to unwanted artifacts that cannot be related to structures. Such effects can be seen in Foged et al. (2014), Marker et al. (2015), and Jørgensen et al. (2013). Similar to Marker et al. (2017), we therefore choose to manage the geophysical data interpretations at the sounding sites instead of at the interpolated grids. This was done by transforming resistivity values into clusters directly at the resistivity and borehole data locations. Using this methodology, we have minimized the smoothing effects to the extent that was present in the resistivity models, while at the same time acknowledging the uncertainty of the underlying structure at the sounding sites.
Based on the results we argue, that the use of MPS methods compared to SIS as applied by Marker et al. (2017) has several advantages. First, we have not treated the geophysical data as hard data in the simulation. Second, we can easily incorporate supplementary information into the framework, such as the vertical proportions or other auxiliary variables, and third, we are not limited to the information that can be carried in the variogram model. The latter being particular important in areas where the data density is low. In a more general context, similar methodologies could be applied using SIS (Hadavand and Deutsch, 2017), however, this methodology would still be limited to the information content that can be carried in the variogram model.
Compared to previous studies employing CF resistivity clustering, the proposed methodology is not as limited by ability of the EM methods to resolve the major lithological units. This could be areas where clay units have high resistivities or where salinity reduces the resistivity of aquifers. In such areas this would result in none uniqueness visualized as overlapping probability density functions, thereby increasing the conditional uncertainties. The result would be a relatively increase in the uncertainty of the derived structural realizations. In studies, where the majority of the structural modeling is performed based on EM data, this could potentially be an important supplement to the derived model or models. To make the modeler aware of such potential issues, it is recommended to perform an analysis of the EM resolution capabilities. This could either be done using a probability density function as the ones shown in this study, by utilizing a resistivity atlas (Barfod et al., 2016), or based on background geological knowledge of the area. The proposed method could also be restricted to a subdomain of the field site, where the assumption is valid, and other modeling strategies could be utilized elsewhere, similar to Høyer et al. (2016) or He et al. (2015).
The suggested methodology is different from most applied methods to perform MPS modeling, where the TI is derived from important expert knowledge (Linde et al., 2015). This study is not meant to neglect such background or process specific information. We do, however, argue, that the strength of the methodology is limited to the time it takes from data to model development, and it does not exclude incorporation of expert knowledge into the TI in cases where this is deemed necessary to obtain a satisfactory modeling result.
In the present study, we limited our analysis to three and four categorical units. This is a simplification of the true complexity in large scale aquifer systems. However, it is still common practice to parameterize subsurface structures in groundwater models with only a few distinct units. In the present study we set this limit based on two criteria, namely the comparison to the deterministic structure and the comparison to the study by Marker et al. (2017). However, the optimal number of clusters is also limited by the input data. Here these consists of clay fractions, which to a large extent is a binary input. 13% of the clay fractions have values below 0.05 and 73% of the clay fractions have values above 0.95. The geophysical data applied in the present case will have the highest sensitivity to subsurface units with high electrical conductance. In this area this will mainly be Paleogene clays and clay tills. The method will also be able to distinguish between sand and clays, but due to the limited sensitivity to units with low electrical conductivity, it is more difficult to separate e.g., units of sand and gravel, which both have low electrical conductance in the present field site.
Non-stationarity in the TI is a challenge normally faced when performing MPS. In the present case we accounted for non-stationarity by conditioning structural simulations to a probability distribution of the different units. In some areas, this may not be sufficient to address non-stationarity. Under such circumstances the proposed methodology may not be applicable, and other methodologies may have to be applied. Alternatively if the area can be subdivided into more stationary subparts, a TI can be estimated for each subdomain. These subareas can then either by managed individually using the proposed methodology, or the can be simulated using multiple TI. Such capabilities are not available in the implementation of SNESIM applied here, but they are available in the Direct Sampling algorithm (Mariethoz et al., 2010).
Finally, the present study is limited to an analysis of a method to quantify contribution from structural uncertainty to forecast of a well catchment zone. Several other sources of uncertainty exists in groundwater models, including, hydraulic conductivities, heterogeneity in the distinct units, boundary conditions, forcing data etc. We did not include these sources, as we wanted to single out the contribution from the uncertain structures. The proposed methodology could, however, easily be combined with these other contributions to encapsulate a more complete estimate of the forecast uncertainty.
Conclusion and Perspectives
This study documents a methodology, where the recently developed CF-resistivity clustering method is combined with MPS to estimate the contribution from large scale subsurface structural uncertainty. The derived structures were used to estimate the contribution to groundwater model forecasts uncertainty of two different well catchment zones; one screened in a highly resolved and simpler geological setting and one in a noisy EM environment with a more complex geology.
Compared to the previous studies using the CF-resistivity clustering method, the present combination with MPS methods allows for an improved framework for handling uncertainties, and it addresses the limitations by the two-point variogram models.
Similar to previous uses, the main advantage of the methodology lies in the fact that it is fast, data driven, reproducible, and transparent. We therefore believe that the potential for the method is large with respect to model screening and analysis, either as a direct input to groundwater flow models, or as a support tool for structural modeling tasks.
The methodology is limited by the direct resolution capabilities of the EM methods. Effectively this restricts the resolution to a few distinct units. In the present study, this resulted in modeling of three and four categorical variables. We found limited differences in the performance of the respective groups of models, both with respect to their ability to fit the hydraulic data and their forecast uncertainty. It is therefore not expected that the proposed methodology can provide higher meaningful resolutions than this, except if the model domain is subdivided into separate regimes, which have distinct different geophysical responses or hydrogeological structures. To introduce more units or variability in the models, this must be done in subsequent steps, e.g., by using MPS methods to simulate small scale heterogeneity in the large scale structures (Strebelle, 2002) or using pilot points in the groundwater model calibration (Doherty, 2003). The SkyTEM dataset and the borehole descriptions used in the study can be downloaded from the national Danish databases (Møller et al., 2009a). Borehole and lithological information is stored in the Jupiter database, and the geophysical data is stored in the Gerda database.
Author Contributions
TV: main contributor to the manuscript and primary developer of the presented content. EA: expert on airborne geophysical methods, leader in the interpretations of geophysical data, and codeveloper of the methods. AC: developer of the clay fraction inversion technique. AB: introduced TV to MPS methods, and assisted in the development of the structural models. PM: assisted in the development of the groundwater flow model. PB-G: original supervisor in the development of the clustering methods used to derive the structures.
Funding
This manuscript was supported by the HyGEM, Integrating geophysics, geology, hydrology for improved groundwater and environmental management, Project No. 11-116763 and rOPEN, Open landscape nitrate retention mapping, Project No. 6150-00006B. Both project are funded by Innovation Fund Denmark.
Conflict of Interest Statement
The authors declare that the research was conducted in the absence of any commercial or financial relationships that could be construed as a potential conflict of interest.
References
Almasri, M., and Kaluarachchi, J. (2007). Modeling nitrate contamination of groundwater in agricultural watersheds. J. Hydrol. 343, 211–229. doi: 10.1016/j.jhydrol.2007.06.016
Arnold, J., and Allen, P. (1999). Automated methods for estimating baseflow and ground water recharge from streamflow records. J. Am. Water Resour. Assoc. 35, 411–424. doi: 10.1111/j.1752-1688.1999.tb03599.x
Arnold, J. G., Allen, P. M., Muttiah, R., and Bernhardt, G. (1995). Automated base-flow separation and recession analysis techniques. Ground Water 33, 1010–1018. doi: 10.1111/j.1745-6584.1995.tb00046.x
Auken, E., Christiansen, A. V., Fiandaca, G., Schamper, C., Behroozmand, A. A., Binley, A., et al. (2015). An overview of a highly versatile forward and stable inverse algorithm for airborne, ground-based and borehole electromagnetic and electric data. Exploration Geophys. 2015, 223–235. doi: 10.1071/eg13097
Auken, E., Christiansen, A. V., Westergaard, J. H., Kirkegaard, C., Foged, N., and Viezzoli, A.. (2009). An integrated processing scheme for high-resolution airborne electromagnetic surveys, the SkyTEM system. Explor. Geophys. 40, 184–192. doi: 10.1071/EG08128
Barfod, A., Vilhelmsen, T., Jorgensen, F., Christiansen, A., Hoyer, A., Straubhaar, J., et al. (2018). Contributions to uncertainty related to hydrostratigraphic modeling using multiple-point statistics. Hydrol. Earth Syst. Sci. 22, 5485–5508. doi: 10.5194/hess-22-5485-2018
Barfod, A. A. S., Moller, I., and Christiansen, A. V. (2016). Compiling a national resistivity atlas of Denmark based on airborne and ground-based transient electromagnetic data. J. Appl. Geophys. 134, 199–209. doi: 10.1016/j.jappgeo.2016.09.017
Bastante, F., Ordonez, C., Taboada, J., and Matias, J. (2008). Comparison of indicator kriging, conditional indicator simulation and multiple-point statistics used to model slate deposits. Eng. Geol. 98, 50–59. doi: 10.1016/j.enggeo.2008.01.006
Boronina, A., Renard, P., Balderer, W., and Christodoulides, A. (2003). Groundwater resources in the Kouris catchment (Cyprus): data analysis and numerical modelling. J. Hydrol. 271, 130–149. doi: 10.1016/s0022-1694(02)00322-0
Caers, J. (2001). Geostatistical reservoir modelling using statistical pattern recognition. J. Pet. Sci. Eng. 29, 177–188. doi: 10.1016/s0920-4105(01)00088-2
Christensen, N. K., Ferre, T. P. A., Fiandaca, G., and Christensen, S. (2017a). Voxel inversion of airborne electromagnetic data for improved groundwater model construction and prediction accuracy. Hydrol. Earth Syst. Sci. 21, 1321–1337. doi: 10.5194/hess-21-1321-2017
Christensen, N. K., Minsley, B. J., and Christensen, S. (2017b). Generation of 3-D hydrostratigraphic zones from dense airborne electromagnetic data to assess groundwater model prediction error. Water Resour. Res. 53, 1019–1038. doi: 10.1002/2016wr019141
Christiansen, A. V., and Auken, E. (2012). A global measure for depth of investigation. Geophysics 77, WB171–WB177. doi: 10.1190/geo2011-0393.1
Christiansen, A. V., Foged, N., and Auken, E. (2014). A concept for calculating accumulated clay thickness from borehole lithological logs and resistivity models for nitrate vulnerability assessment. J. Appl. Geophys. 108, 69–77. doi: 10.1016/j.jappgeo.2014.06.010
Danielsen, J. E., Auken, E., Jørgensen, F., Søndergaard, V. H., and Sørensen, K. I. (2003). The application of the transient electromagnetic method in hydrogeophysical surveys. J. Appl. Geophys. 53, 181–198. doi: 10.1016/j.jappgeo.2003.08.004
dell’Arciprete, D., Bersezio, R., Felletti, F., Giudici, M., Comunian, A., and Renard, P. (2012). Comparison of three geostatistical methods for hydrofacies simulation: a test on alluvial sediments. Hydrogeol. J. 20, 299–311. doi: 10.1007/s10040-011-0808-0
Delottier, H., Pryet, A., and Dupuy, A. (2017). Why should practitioners be concerned about predictive uncertainty of groundwater management models? Water Resour. Manag. 31, 61–73. doi: 10.1007/s11269-016-1508-2
Deutsch, C. V., and Journel, A. G. (1998). GSLIB: Geostatistical Software Library and User’s Guide. Second Edition. Oxford: Oxford University Press.
Doherty, J. (2003). Ground water model calibration using pilot points and regularization. Ground Water 41, 170–177. doi: 10.1111/j.1745-6584.2003.tb02580.x
Doherty, J. (2016). PEST, Model-Independent Parameter Estimation, User Manual Part I: PEST, SENSAN and Global Optimisers. Brisbane, QLD: Watermark Numerical Computing.
Enzenhoefer, R., Bunk, T., and Nowak, W. (2014). Nine steps to risk-informed wellhead protection and management: a case study. Groundwater 52, 161–174. doi: 10.1111/gwat.12161
Foged, N., Marker, P. A., Christiansen, A. V., Bauer-Gottwein, P., Jørgensen, F., Høyer, A.-S., et al. (2014). Large scale 3D-modeling by integration of resistivity models and borehole data through inversion. Hydrol. Earth Syst. Sci. 18, 4349–4362. doi: 10.5194/hess-18-4349-2014
Freeze, R. (2004). The role of stochastic hydrogeological modeling in real-world engineering applications. Stoch. Environ. Res. Risk Assess. 18, 286–289.
Goovaerts, P. (1997). Geostatistics for Natural Resources Evaluation. Applied Geostatistics Series. New York, NY: Oxford University Press, 483.
Hadavand, M., and Deutsch, C. (2017). Facies proportion uncertainty in presence of a trend. J. Pet. Sci. Eng. 153, 59–69. doi: 10.1016/j.petrol.2017.03.036
Harbaugh, A., Banta, E. R., Hill, M. C., and McDonald, M. G. (2000). MODFLOW-2000, the U.S. Geological Survey Modular Ground-Water Model – User Guide to Modularization Concepts and the Ground-Water Flow Process: U.S. Geological Survey Open-File Report 00–92. Reston: U.S. Geological Survey.
Harbaugh, A. W. (2005). MODFLOW-2005 - The U.S. Geological Survey Modular Ground-Water Model - the Ground-Water Flow Process. Reston: U.S. Geological Survey.
He, X., Hojberg, A. L., Jorgensen, F., and Refsgaard, J. C. (2015). Assessing hydrological model predictive uncertainty using stochastically generated geological models. Hydrol. Process. 29, 4293–4311. doi: 10.1002/hyp.10488
He, X. L., Sonnenborg, T. O., Jorgensen, F., and Jensen, K. H. (2014). The effect of training image and secondary data integration with multiple-point geostatistics in groundwater modelling. Hydrol. Earth Syst. Sci. 18, 2943–2954. doi: 10.5194/hess-18-2943-2014
Henriksen, H., Troldborg, L., Nyegaard, P., Sonnenborg, T., Refsgaard, J., and Madsen, B. (2003). Methodology for construction, calibration and validation of a national hydrological model for Denmark. J. Hydrol. 280, 52–71. doi: 10.1016/s0022-1694(03)00186-0
Hermans, T., Nguyen, F., and Caers, J. (2015). Uncertainty in training image-based inversion of hydraulic head data constrained to ERT data: workflow and case study. Water Resour. Res. 51, 5332–5352. doi: 10.1002/2014wr016460
Hoffimann, J., Scheidt, C., Barfod, A., and Caers, J. (2017). Stochastic simulation by image quilting of process-based geological models. Comput. Geosci. 106, 18–32. doi: 10.1016/j.cageo.2017.05.012
Hoyer, A., Vignoli, G., Hansen, T., Vu, L., Keefer, D., and Jorgensen, F. (2017). Multiple-point statistical simulation for hydrogeological models: 3-D training image development and conditioning strategies. Hydrol. Earth Syst. Sci. 21, 6069–6089. doi: 10.5194/hess-21-6069-2017
Høyer, A.-S., Jørgensen, F., Sandersen, P. B. E., Viezzoli, A., and Møller, I. (2015). 3D geological modelling of a complex buried-valley network delineated from Borehole and AEM Data. J. Appl. Geophys. 2015, 94–102. doi: 10.1016/j.jappgeo.2015.09.004
Høyer, A.-S., Vignoli, G., Hansen, T. M., Vu, L. T., Keefer, D. A., and Jørgensen, F. (2016). Multiple-point statistical simulation for hydrogeological models: 3D training image development and conditioning strategies. Hydrol. Earth Syst. Sci. Discuss 21, 1–29. doi: 10.5194/hess-2016-567
Hu, L. Y., and Chugunova, T. (2008). Multiple-point geostatistics for modeling subsurface heterogeneity: a comprehensive review. Water Resour. Res. 44, W11413. doi: 10.1029/2008WR006993
Huysmans, M., Peeters, L., Moermans, G., and Dassargues, A. (2008). Relating small-scale sedimentary structures and permeability in a cross-bedded aquifer. J. Hydrol. 361, 41–51. doi: 10.1016/j.jhydrol.2008.07.047
Jørgensen, F., Møller, R. R., Nebel, L., Jensen, N., Christiansen, A. V., and Sandersen, P. (2013). A method for cognitive 3D geological voxel modelling of AEM data. Bull. Eng. Geol. Environ. 72, 421–432. doi: 10.1007/s10064-013-0487-2
Jørgensen, F., and Sandersen, P. B. E. (2006). Buried and open tunnel valleys in Denmark-erosion beneath multiple ice sheets. Q. Sci. Rev. 25, 1339–1363. doi: 10.1016/j.quascirev.2005.11.006
Journel, A., and Zhang, T. F. (2006). The necessity of a multiple-point prior model. Math. Geol. 38, 591–610. doi: 10.1007/s11004-006-9031-2
Journel, A. G. (2002). Combining knowledge from diverse sources: an alternative to traditional data independence hypotheses. Math. Geol. 34, 573–596.
Journel, A. G. (2005). “Beyond covariance: the advent of multiple-point geostatistics,” in Proceedings of the Seventh International Geostatistics Congress, eds O. Leuangthon and C. V. Deutsch (Banff, AB: Springer), 225–233. doi: 10.1007/978-1-4020-3610-1_23
Knight, R., Smith, R., Asch, T., Abraham, J., Cannia, J., Viezzoli, A., et al. (2018). Mapping aquifer systems with airborne electromagnetics in the central valley of California. Groundwater 56, 893–908. doi: 10.1111/gwat.12656
Korus, J., Joeckel, R., Divine, D., and Abraham, J. (2017). Three-dimensional architecture and hydrostratigraphy of cross-cutting buried valleys using airborne electromagnetics, glaciated Central Lowlands, Nebraska, USA. Sedimentology 64, 553–581. doi: 10.1111/sed.12314
Kronborg, C., Bender, H., Bjerre, R., Friborg, R., Jacobsen, H., Kristiansen, L., et al. (1990). Glacial stratigraphy of east and central Jutland. Boreas 19, 273–287. doi: 10.1111/j.1502-3885.1990.tb00451.x
Linde, N., Renard, P., Mukerji, T., and Caers, J. K. (2015). Geological realism in hydrogeological and geophysical inverse modeling: a review. Adv. Water Resour. 86, 86–101. doi: 10.1016/j.advwatres.2015.09.019
Liu, Y. H. (2006). Using the Snesim program for multiple-point statistical simulation. Comput. Geosci. 32, 1544–1563. doi: 10.1016/j.cageo.2006.02.008
Maharaja, A. (2008). TiGenerator: object-based training image generator. Comput. Geosci. 34, 1753–1761. doi: 10.1016/j.cageo.2007.08.012
Manghi, F., Williams, D., Safely, J., and Hamdi, M. R. (2012). Groundwater flow modeling of the arlington basin to evaluate management strategies for expansion of the Arlington desalter water production. Water Resour. Manag. 26, 21–41. doi: 10.1007/s11269-011-9899-6
Mariethoz, G., and Caers, J. (2015). Multiple-Point Geostatistics : Stochastic Modeling with Training Images. Chichester: John Wiley & Sons Inc, 364.
Mariethoz, G., Renard, P., and Straubhaar, J. (2010). The direct sampling method to perform multiple-point geostatistical simulations. Water Resour. Res. 46, W11536. doi: 10.1029/2008WR007621
Marker, P. A., Foged, N., He, X., Christiansen, A. V., Refsgaard, A., Auken, E., et al. (2015). Performance evaluation of groundwater model hydrostratigraphy from airborne electromagnetic data and lithological borehole logs. Hydrol. Earth Syst. Sci. 19, 3875–3890. doi: 10.5194/hess-19-3875-2015
Marker, P. M., Vilhelmsen, T. N., Foged, N., Wernberg, T., Auken, E., and Bauer-Gottwein, P. (2017). Probabilistic predictions using a groundwater model informed with airborne EM data. Adv. Water Resour. 2017:13.
Møller, I., Søndergaard, V. H., and Jørgensen, F. (2009a). Geophysical methods and data administration in Danish groundwater mapping. Geological Survey of Denmark and Greenland Bulletin 17, 41–44.
Møller, I., Verner, H., Søndergaard, V. H., Flemming, J., Auken, E., and Christiansen, A. V. (2009b). Integrated management and utilization of hydrogeophysical data on a national scale. Near Surface Geophys. 7, 647–659. doi: 10.3997/1873-0604.2009031
Muffels, C., Wang, X., Tonkin, M., and Neville, C. (2014). User’s Guide for mod-PATH3DU A groundwater path and travel-time simulator. Bethesda, MD: S.S. Papadopulos & Associates, Inc.
Mylopoulos, N., Mylopoulos, Y., Veranis, N., and Tolikas, D. (2007). Groundwater modeling and management in a complex lake-aquifer system. Water Resour. Manag. 21, 469–494. doi: 10.1007/s11269-006-9025-3
Panday, S., Langevine, C. D., Niswonger, R. G., Ibaraki, M., and Hughes, J. D. (2015). MODFLOW-USG version 1.3.00: An Unstructured Grid Version of MODFLOW for Simulating Groundwater Flow and Tightly Coupled Processes Using a Control Volume Finite-Difference Formulation: U.S. Geological Survey Software Release. Reston: U.S. Geological Survey.
Pappenberger, F., and Beven, K. (2006). Ignorance is bliss: or seven reasons not to use uncertainty analysis. Water Resour. Res. 42, W05302. doi: 10.1029/2005WR004820
Pedregosa, F., Varoquaux, G., Gramfort, A., Michel, V., Thirion, B., Grisel, O., et al. (2011). Scikit-learn: machine learning in Python. J. Mach. Learn. Res. 12, 2825–2830.
Pryet, A., d’Ozouville, N., Violette, S., Deffontaines, B., and Auken, E. (2012). Hydrogeological settings of a volcanic island (San Cristóbal, Galapagos) from joint interpretation of airborne electromagnetics and geomorphological observations. Hydrol. Earth Syst. Sci. Discuss 16, 4571–4579. doi: 10.5194/hess-16-4571-2012
Remy, N., Boucher, A., and Wu, J. (2009). Applied Geostatistics with SGeMS : A User’s Guide. Cambridge: Cambridge University Press, 264.
Renard, P. (2007). Stochastic hydrogeology: what professionals really need? Ground Water 45, 531–541. doi: 10.1111/j.1745-6584.2007.00340.x
Sanchez-Vila, X., and Fernandez-Garcia, D. (2016). Debates-Stochastic subsurface hydrology from theory to practice: why stochastic modeling has not yet permeated into practitioners? Water Res. Res. 52, 9246–9258. doi: 10.1002/2016wr019302
Sandersen, P., and Jørgensen, F. (2003). Buried Quaternary valleys in western Denmark–occurrence and inferred implications for groundwater resources and vulnerability. J. Appl. Geophys. 53, 229–248. doi: 10.1016/j.jappgeo.2003.08.006
Saravanan, R., Balamurugan, R., Karthikeyan, M. S., Rajkumar, R., Anuthaman, N. G., and Gopalakrishnan, A. N. (2011). Groundwater modeling and demarcation of groundwater protection zones for Tirupur Basin - A case study. J. Hydro Environ. Res. 5, 197–212. doi: 10.1016/j.jher.2011.02.003
Sedki, A., and Ouazar, D. (2011). Simulation-optimization modeling for sustainable groundwater development: a Moroccan coastal aquifer case study. Water Resour. Manag. 25, 2855–2875. doi: 10.1007/s11269-011-9843-9
Silva, D., and Deutsch, C. (2014). A multiple training image approach for spatial modeling of geologic domains. Math. Geosci. 46, 815–840. doi: 10.1007/s11004-014-9543-0
Sonnenborg, T., Christensen, B., Nyegaard, P., Henriksen, H., and Refsgaard, J. (2003). Transient modeling of regional groundwater flow using parameter estimates from steady-state automatic calibration. J. Hydrol. 273, 188–204. doi: 10.1016/s0022-1694(02)00389-x
Sørensen, K. I., and Auken, E. (2004). SkyTEM - A new high-resolution helicopter transient electromagnetic system. Exploration Geophys. 35, 191–199.
Strebelle, S. (2002). Conditional simulation of complex geological structures using multiple-point statistics. Math. Geol. 34, 1–21.
Tartakovsky, D., Nowak, W., and Bolster, D. (2012). Introduction to the special issue on uncertainty quantification and risk assessment. Adv. Water Resour. 36, 1–2. doi: 10.1016/j.advwatres.2011.12.010
Viezzoli, A., Christiansen, A. V., Auken, E., and Sørensen, K. I. (2008). Quasi-3D modeling of airborne TEM data by Spatially constrained inversion. Geophysics 73, F105–F113.
Vignoli, G., Fiandaca, G., Christiansen, A. V., Kirkegaard, C., and Auken, E. (2015). Sharp spatially constrained inversion with applications to transient electromagnetic data. Geophys. Prospecting 63, 243–255. doi: 10.1111/1365-2478.12185
Vilhelmsen, T. N., Marker, P. A., Foged, N., Wernberg, T., Auken, E., Christiansen, A. V., et al. (2018). A regional scale hydrostratigraphy generated from geophysical data of varying age, type and quality. Water Resour. Manag. 33, 539–553. doi: 10.1007/s11269-018-2115-1
Keywords: groundwater modeling, uncertainty analysis, multiple point statistics, structural uncertainty, SkyTEM, SNESIM, MODFLOW
Citation: Vilhelmsen TN, Auken E, Christiansen AV, Barfod AS, Marker PA and Bauer-Gottwein P (2019) Combining Clustering Methods With MPS to Estimate Structural Uncertainty for Hydrological Models. Front. Earth Sci. 7:181. doi: 10.3389/feart.2019.00181
Received: 16 December 2018; Accepted: 24 June 2019;
Published: 10 July 2019.
Edited by:
Philippe Renard, Université de Neuchâtel, SwitzerlandReviewed by:
Liangping Li, South Dakota School of Mines and Technology, United StatesFrederic Nguyen, University of Liège, Belgium
Ryan Martin, University of Alberta, Canada
Copyright © 2019 Vilhelmsen, Auken, Christiansen, Barfod, Marker and Bauer-Gottwein. This is an open-access article distributed under the terms of the Creative Commons Attribution License (CC BY). The use, distribution or reproduction in other forums is permitted, provided the original author(s) and the copyright owner(s) are credited and that the original publication in this journal is cited, in accordance with accepted academic practice. No use, distribution or reproduction is permitted which does not comply with these terms.
*Correspondence: Troels Norvin Vilhelmsen, dHJvZWxzLm5vcnZpbkBnZW8uYXUuZGs=
 Troels Norvin Vilhelmsen
 Esben Auken
 Anders Vest Christiansen1