 Emilia Guisado-Pintado
 Derek W. T. Jackson
- 1Department of Physical Geography and Regional Geographic Analysis, University of Seville, Seville, Spain
- 2School of Geography and Environmental Sciences, Ulster University, Coleraine, United Kingdom
Infrequent but high energy storm events can radically modify coastlines, at times displacing significant sediment volumes and changing shoreline configuration. More frequent and stronger Atlantic storms over the last 40 years have heightened the potential risk to coastal environments, population and infrastructure. Understanding local environmental forcing conditions and associated variables involved in coastal impact and response, can better inform future coastal management planning. This study examines the coastal impacts of two separate storms that occurred at Five Finger Strand, on the northwest Irish coast, in late 2017 (Storm Ophelia) and mid-2018 (Storm Hector). Using forcing parameters (wind speed and direction, wave heights and wave run up) along with 3D topographic surveys, impacts are examined for both storm events. For Storm Ophelia, shore-oblique to shore-parallel waves (2 m in height) coincident with low tide (∼0.8 m) were recorded. This resulted in minimal erosional impact which was corroborated by a new proxy storm impact index, “Storm Dune Trimming” (value of >0.03) as well as a sediment displacement volume of 8,300 m3, largely confined to the intertidal area with only limited foredune edge erosion. Storm Hector, on the other hand, a lower energy event than Storm Ophelia, resulted in much more pronounced sediment displacement (13,400 m3 in the intertidal area) and significantly more dune scarping (Storm Dune Trimming >0.09) due to better synchronicity of forcing factors such as high tide level, high wave heights and onshore wind direction. We conclude that storm energy is not always a direct indicator of coastal impact and that synchronicity of local forcing factors and antecedent beach conditions appears to be the most relevant in actual coastal response on sandy beaches. This study, therefore shows the importance of particular environmental parameters and their simultaneous timing in forcing change and is an important insight into which parameters may be more risk-relevant in producing erosion along many sandy, dune-fringed coasts of NW Europe.
Introduction
Storm impact along sandy coasts globally is driven by various local factors, including accommodation space and physical forcing parameters which help drive coastal dynamics (Cooper and Orford, 1998). The extent and range of impact variability can be high, even over small coastal stretches and minor morphologic alterations to beaches as result of dune vegetation, soil development and slope changes can influence beach response (Carter and Stone, 1989). Other characteristics of the subaerial beach, such as the elevation of the dune toe, foredune height, and the presence of nearshore subaqueous sandbars help determine the response of local morphology alongshore (Splinter et al., 2018). Changes in frequency and occurrence of storm-groups (Ferreira, 2006), as well as storm clusters (Dissanayake et al., 2015) can also intensify coastal morphological impacts.
The majority of storms impacting the Atlantic coastline of Europe form in the western mid-latitude wind belts as extratropical storms (Lozano et al., 2004). This movement of cyclones aligns along track corridors (Hayden, 1981) and displays an inter-annual variability (Schmith et al., 1998). Winter climate and storm occurrence and its corresponding relationship with large-scale patterns of atmospheric variability, such as the North Atlantic Oscillation (NAO), have been widely studied (Hurrell, 1995; Dawson et al., 2002). Indeed, a strong relationship was found between wave climate variability in the North Atlantic region and the NAO index (Dawson et al., 2002, 2004; Dodet et al., 2010). Studies from Lambert (1996) and Schinke (1993) have shown that more intense storm events have occurred since 1970 in the northern hemisphere. The Global Tropical and Extratropical Cyclone Climatic Atlas data (GTECCA, 1996) was used to show that storms normally originate from the west, with most focussing SW of Iceland (Lozano et al., 2004). In a comparative study, Feser et al. (2015) also found that from early 70s until the mid-1990s, there has been increased storm activity over the North Atlantic area (north of 55–60°) in agreement with the variability long-term proxies including the NAO.
Strong coastal storms particularly affect the western/north-western coasts of Ireland (Cooper et al., 2004; Backstrom et al., 2015). Historically, both its hard coasts (Scheffers et al., 2009, 2010; Erdmann et al., 2017) and sandy coasts (Cooper et al., 2004; Kandrot et al., 2016) are influenced by remnants of Atlantic Hurricanes reaching Ireland. Events such as the 1839 ‘Night of the big wind’ (Shields and Fitzgerald, 1989) a Category 3 Hurricane and 1961’s Hurricane Debbie (Hickey and Connolly-Johnston, 2012), demonstrate the potential impacts of receiving these events. More recently, Loureiro and Cooper (2019) show that in Ireland there is a strong relationship between positive phases of the NAO and highly energetic winters, with a greater number of storms per winter over the past 67 winters. For this period, they conclude that winters in the northwest coast of Ireland are becoming stormier.
The western coast of Ireland has therefore become attuned to generally high-energy wave settings, with localised sediments adjusted to this elevated energy forcing. In this regard, these beaches therefore usually require an amalgamation of forcing events to provoke substantial impact (Cooper and Jackson, 2003) with extreme storms resulting in dramatic shoreline erosional responses. These impacts manifest as rapid erosion of foredunes but are typically followed by shoreline readjustment (Cooper et al., 2007) and sediment recirculation within coastal cells with sand being returned to the coast in post-storm recovery periods (e.g., Backstrom et al., 2015).
In this study, we focus on two recent storm events that reached the coast of Ireland in the 2017–2018 period. Storm Ophelia arrived to the western coast of Ireland on the 16th October 2017 which at landfall was a “post-tropical storm” but was earlier labelled as a Category 3 hurricane (NOAA, 2017), the most eastern Category 3 Atlantic hurricane recorded (NOAA, 2017; United Kingdom Meteorological Office, 2017). This high-energy storm produced sustained winds of more than 34 knots and induced significant wave heights of 26.1 m at the Kinsale gas platform located at −100 m depth (Met EIREANN, 2017). Secondly, we examine Storm Hector, an unusually energetic summertime storm generated from a deep low-pressure system that was deflected toward the northeast to Ireland by a strong jet stream. It made landfall early on the 14th June 2018 with mean wind speeds between 65 and 80 km/h, with the highest recorded gusts reaching 111 km/h at Mace Head, Co. Galway (around 3:00 am) (Met EIREANN, 2017).
Coastal response to events like these, as well as post-storm recovery behaviour, have been shown to be spatially highly variable, even between adjacent coastal sites (Guisado-Pintado et al., 2014) and can be attributed to differences in local hydrodynamic regimes (Burvingt et al., 2017). Beach morphology (Haerens et al., 2012), regional and local geology (Jackson et al., 2005; Jackson and Cooper, 2009) all dictate site-specific response. Some studies (e.g., Karunarathna et al., 2014) have shown that beach and dune erosion from a clustering of storms could be more impactful than an isolated, single event with similar overall energy. However, the final impact could be strongly influenced by the chronology and sequence of storms in a cluster (Dissanayake et al., 2015). Further, the complex interplay between variables such as offshore wave height and pre-existing bathymetry often controls the coastal response (Coco et al., 2014). Forcing factors such as wave heights coinciding with higher water levels during storms, has been shown to dictate actual coastal damage-response (Masselink et al., 2016a,b) and further changes in dune morphology, based on the relative tidal range reached (Costas et al., 2005). Additionally, the orientation of a coastline compared to the storm direction and average winds, can also influence the incoming wave angle approach, inducing shelter effects and helping force the beach/dune into transporting sediment into the cross-shore and alongshore dimension (Castelle et al., 2015). Finally, the physical characteristics of beach-dune systems such as their dune toe elevation and overall dune height (Houser, 2013), the presence of subtidal sandbars and beach-slope’s angle, can in combination, induce a physical response (Splinter et al., 2018).
The objective of this study is to investigate the associated coastal impacts from two storm events with different energy levels such as Storm Ophelia (October 2017) and Storm Hector (June 2018). We focus on morphological changes within an intertidal zone and dune edge that occurred on the north-western sandy beach of Five Finger Strand during the storm peaks of both events. The direction of the storm, its intensity (significant wave height, wave period and speed of winds), storm duration locally, tidal stage and water level surge, as well as the intertidal morphology under pre- and post-storm conditions are examined. To better understand the forcing and response of dune coasts under particular conditions, we propose and test a new impact index “Storm Dune Trimming” which examines the potential dune trimming of specific storm events. We compare the actual local impact induced by both storm events to demonstrate the importance of synchronicity of forcing parameters in determining coastal impact response.
Study Area
Western Irish coastlines are defined by hard geology with a cover of glacial materials, providing important sedimentary sources for its beaches (Burningham and Cooper, 2004). Basaltic headlands and cliffs punctuate the coast, while sandy beaches and large coastal dunes are present in coastline re-entrants (Jackson et al., 2005). Only 44% of its coastline can be classified under a high energy category (Devoy, 2008).
Five Finger Strand is situated on the Inishowen penninsula in County Donegal, western Ireland (Figure 1A). The beach, 1.7 km long and 350 m wide, is backed by a vegetated sand dune system that can reach heights of around 25 m with an average dune toe height that ranges from 2.0 to 3.0 m relative to mean sea level (Figure 2B). Its beach is classed as dissipative (Wright and Short, 1984) and runs north to south between Five Fingers rocks and Lagg Point at Trawbreaga Bay (Figure 1A). In the south, a tidal inlet presents a large ebb tide delta system with a concomitant, ebb channel. Sand shifts between the ebb tidal delta, estuary and the beach/dune system, driven through tidal inlet changes (Cooper et al., 2007; O’Connor et al., 2011). Nearshore intertidal bars are also present at Five Fingers Strand and their dynamics show clear seasonal and inter-annual variability (Jackson et al., 2016). Typically, during winter time (Oct-Feb) the site’s northern beach and dune profiles (P1-3 in Figure 1B) displays quite flat topography with little to no bar formation, thereby rendering the beach and dune toe edge more exposed to higher energy storms and surges during the region’s storm season. Conversely, in spring and summer, bars start to reform (and migrate toward the nearshore) along the northern profiles, as there is enough accommodation for them after the beach flattens earlier in the year. Conversely, the southern part of the Strand (P4-P5 in Figure 1B) are devoid of nearshore bars for most seasons and only in late summer does an infrequent nearshore bar form which is preceded by an intertidal channel. The beach sediment is carbonate-rich terrigenous sand (mean grain size 0.3 mm and largely homogenous across this zone) with a subordinate gravel component overlying a cobble/gravel base of glacial sediments.
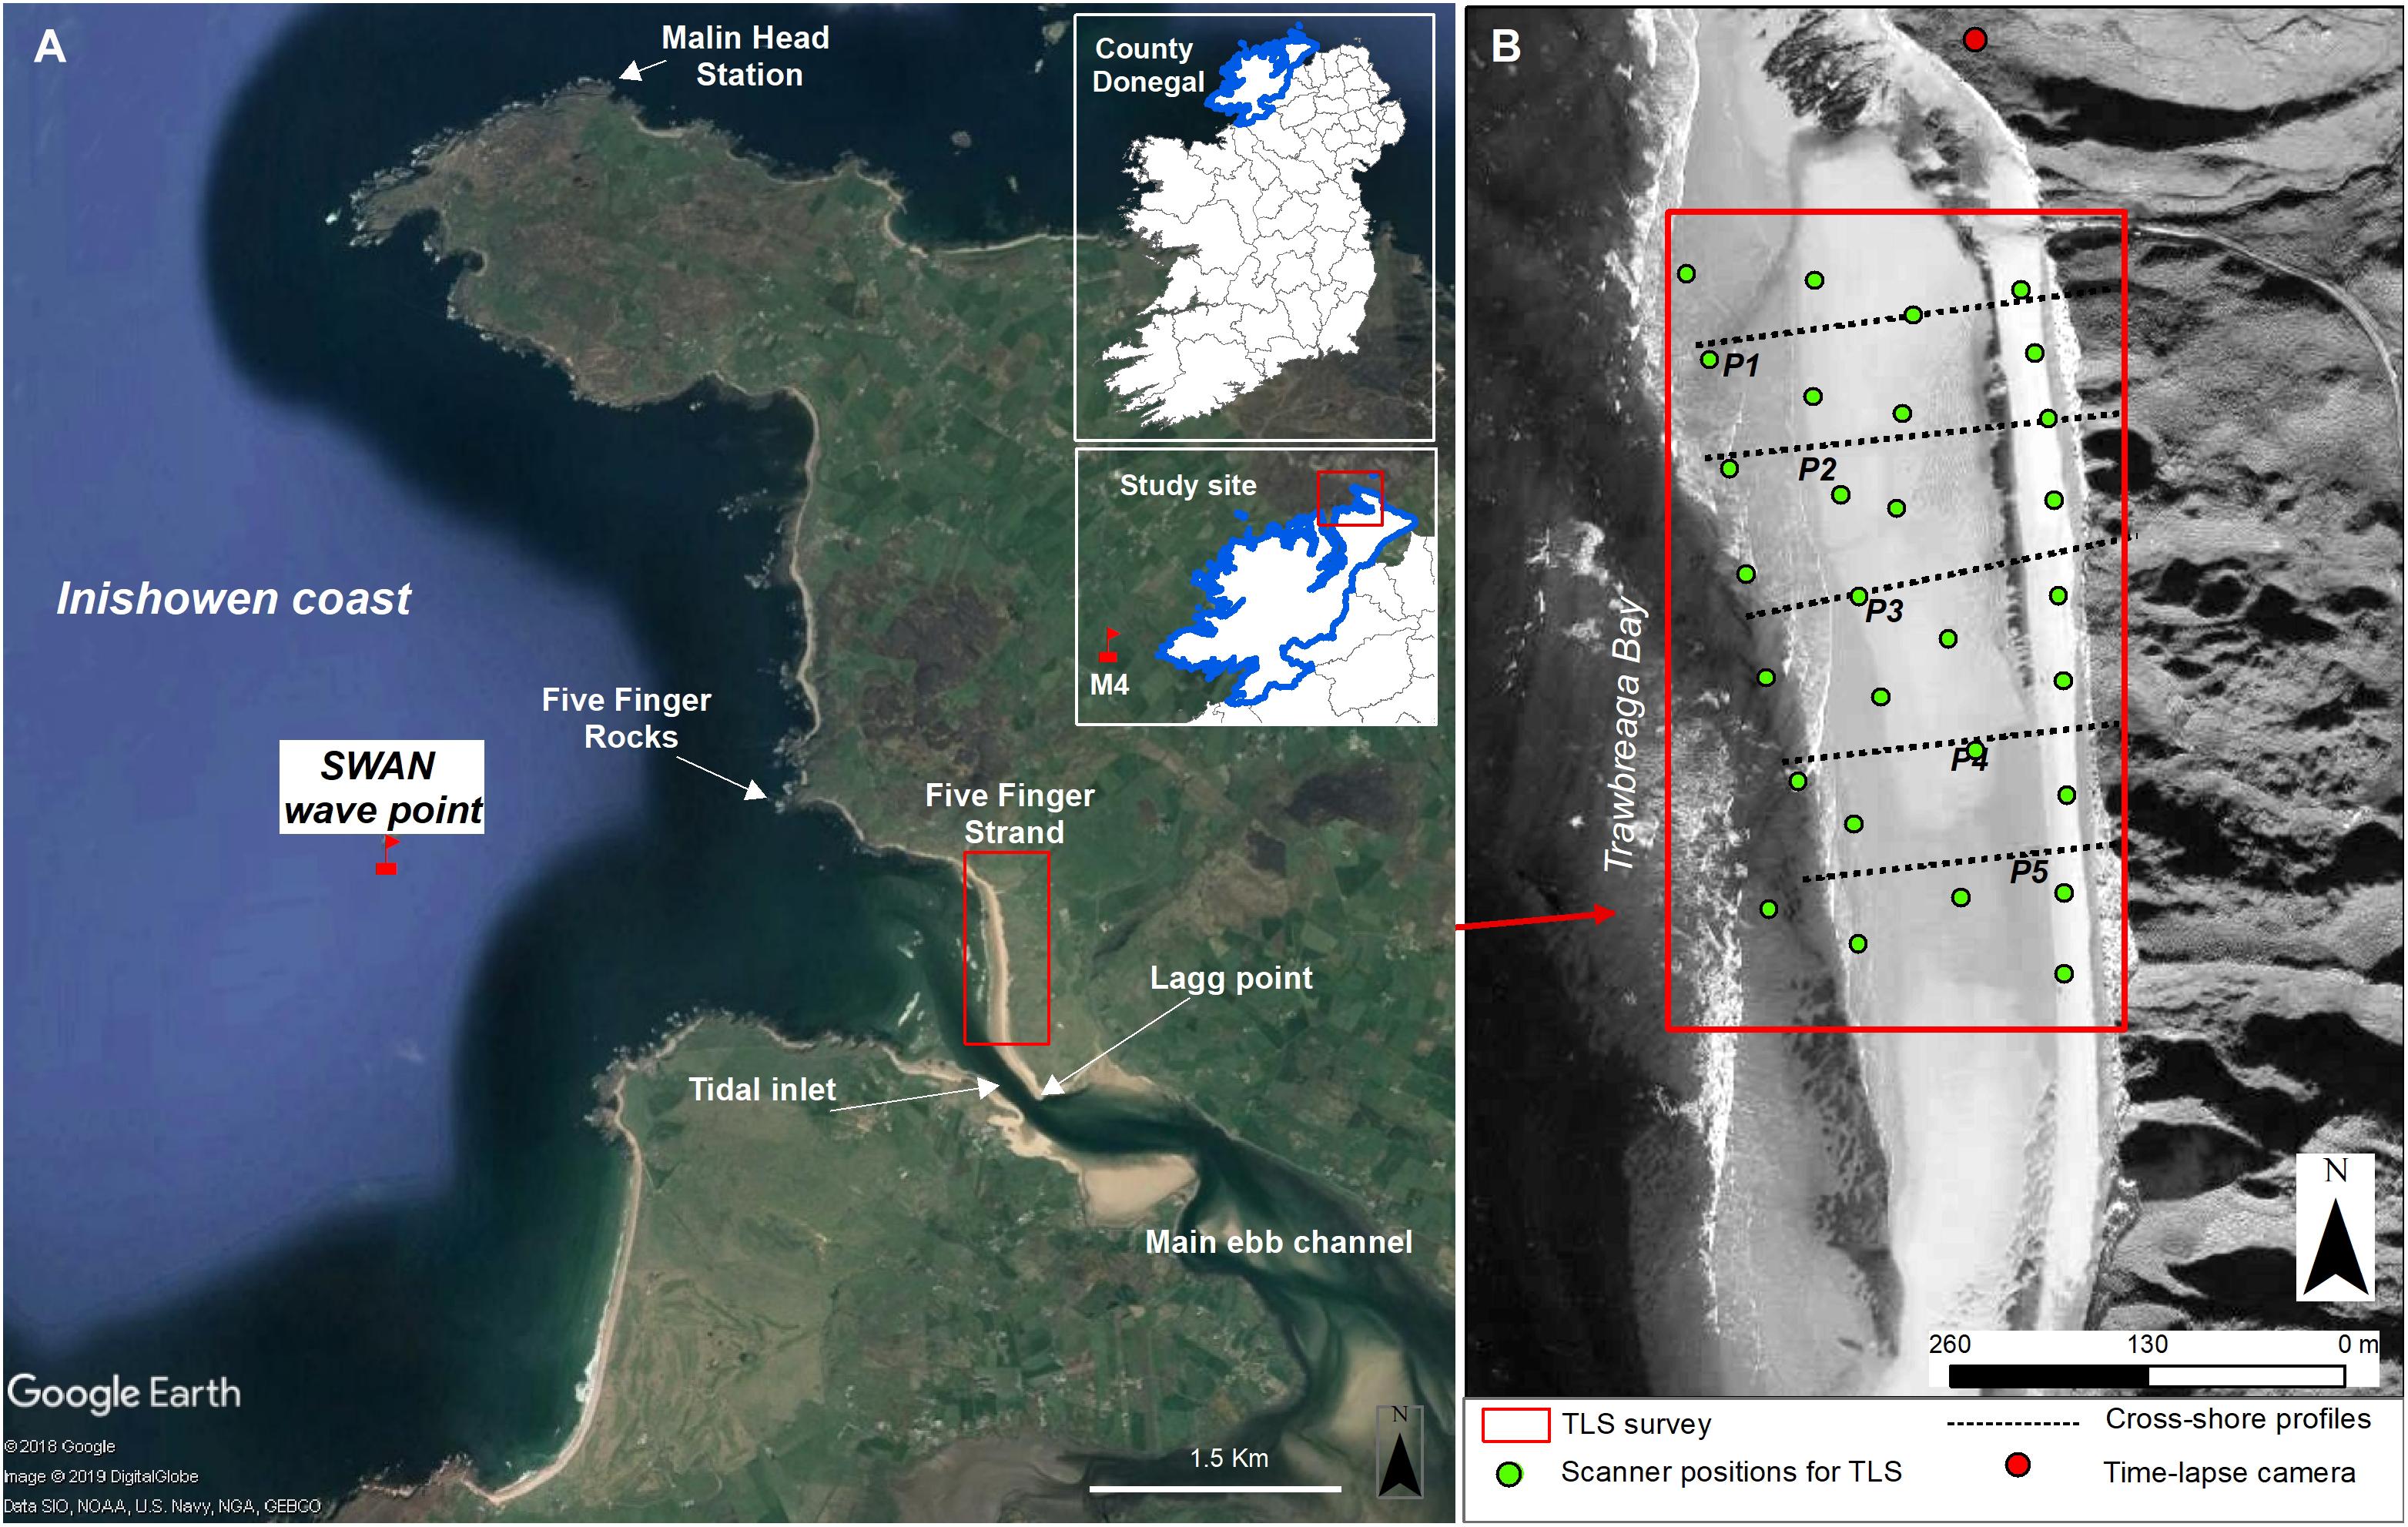
Figure 1. (A) Generallocation of the western coast of Ireland and the Five Finger site showing the M4 wave buoy position and SWAN grid point location. (B) Map of study area in north-western Ireland showing location of the TLS survey, time lapse camera and cross-shore profiles.
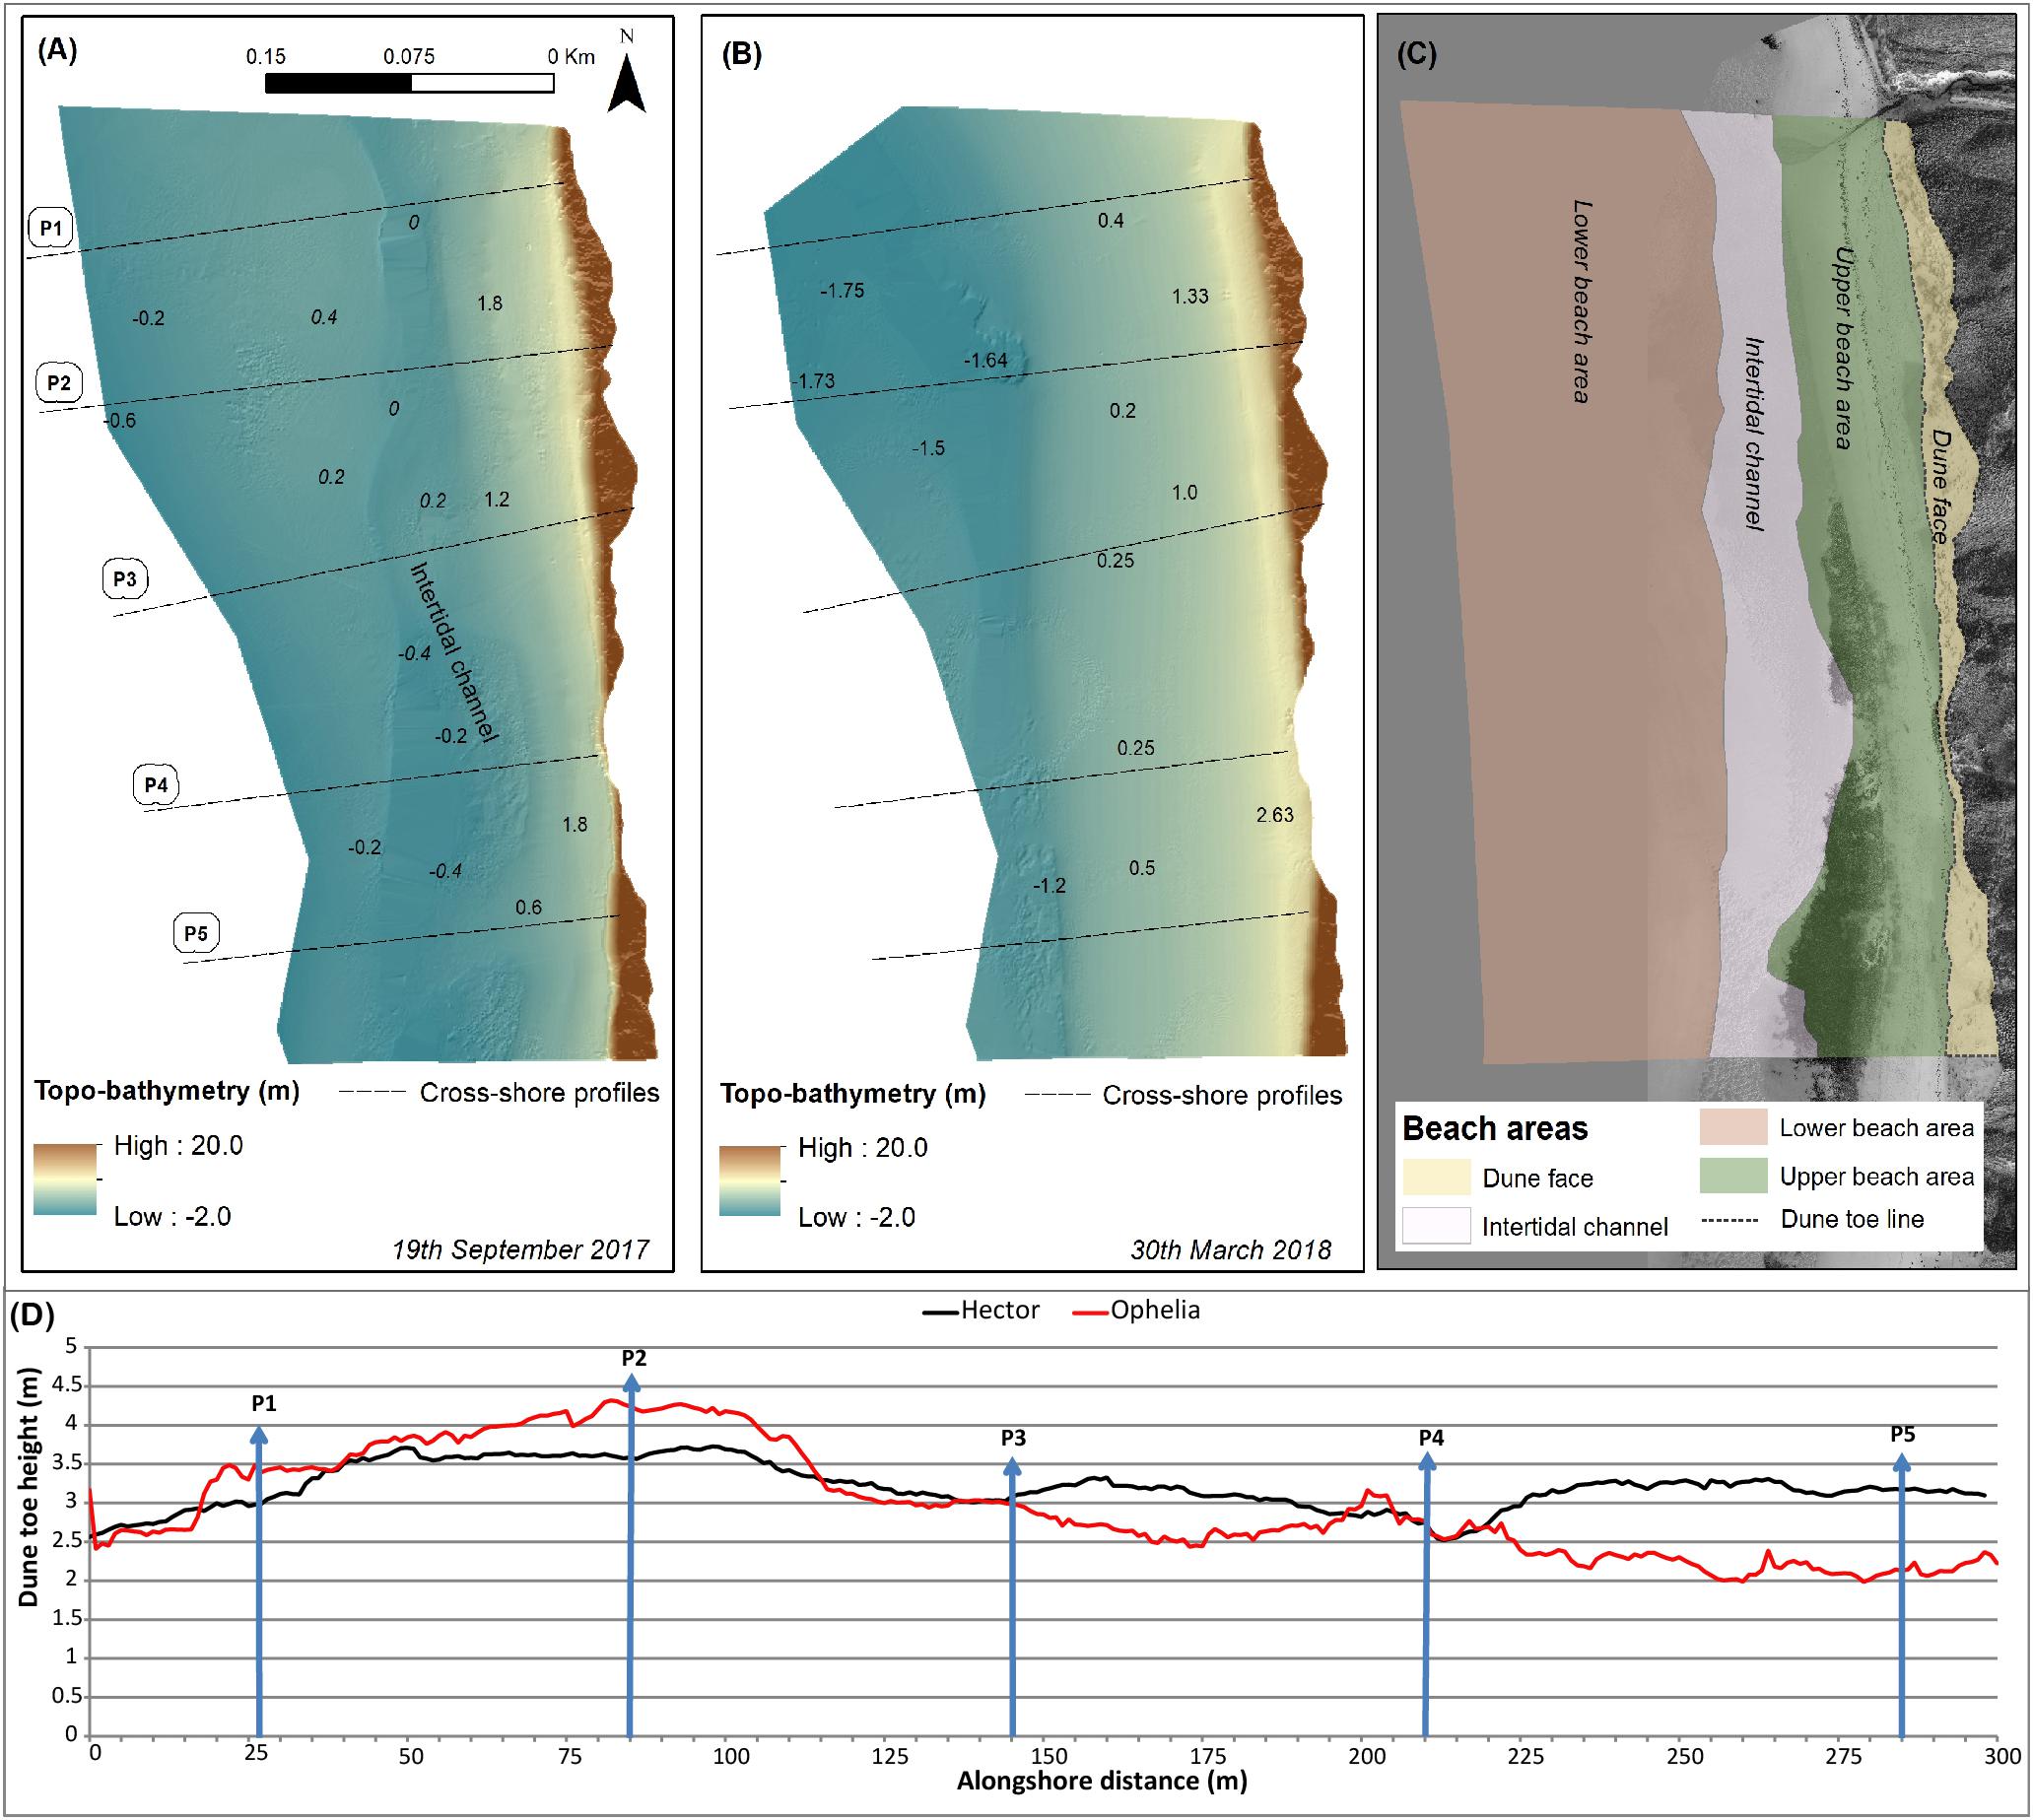
Figure 2. Pre-Storm Ophelia (A) and Storm Hector (B) topo-bathymetries extracted from TLS surveys with numbers representing depths. Note differences in antecedent conditions of the submerged and subaerial beach at Five Finger Strand. (C) shows the subzones used for comparisons in the DoD analysis. (D) shows an alongshore section of dune toe height before Storm Ophelia (partially adapted from Guisado-Pintado and Jackson, 2018) and Storm Hector where the blue arrows represent the cross-shore profiles.
Ireland’s west coast beaches are largely meso-tidal (2–4 m) environments. Five Finger strand has a spring tidal-range of 3.5 m with average significant wave heights around 2.2 m and wave periods of 9 s, with predominant winds from the southwest (Jackson et al., 2005, 2016). Dominant swell wave approach is from the west and southwest and fully refracted within the headland-embayment system (Jackson et al., 2016; Guisado-Pintado and Jackson, 2018). Five Finger strand is therefore a high energy Atlantic beach system that has been modally adjusted to a large swell wave environment that undergoes important morphological changes over various spatial and temporal scales (Cooper et al., 2007; Guisado-Pintado et al., 2017).
Storm Ophelia and Storm Hector Characteristics
Storm Ophelia
The remnants of Hurricane Ophelia struck the British Isles in mid-October 2017 under the status of an extra-tropical storm. The Hurricane developed originally southwest of the Azores from a persistent low-pressure system, allowing it to travel to north-eastern Europe (NOAA, 2017). Storm Ophelia reached Ireland on the 16th October and was re-classified as a “post-tropical” cyclone (Guisado-Pintado and Jackson, 2018) but still retained gusts of up to 130 km/h were recorded. Storm Ophelia made landfall at 10am (1100 UTC) October 16th.
Storm Ophelia’s highest gust was 156 km/h with a SSE direction, which was recorded in Roche’s Point (Co. Cork) at 10:59 am, further north at Malin Head (Co. Donegal), a maximum wind gust of 106 km/h was reached at 19:30 h on the 16th of October with an overall direction of SSW. Storm Ophelia, despite initial expectations, lost its energy as it travelled north toward the study site. Around Malin Head (Figure 3A) significant wave heights ranged from 1.78 m on the 16th October at 9:00 am to 1.28 m when the storm had passed the study site (18th October) as shown in Figure 3C, with associated 4–5 s wave periods. The maximum wave height, 2.22 m, was reached at 6:00 pm (17th October, Figure 3B). Wave direction varied from 170 (S) to 220 (SW) during the storm event, which is parallel to main beach orientation of the study site.
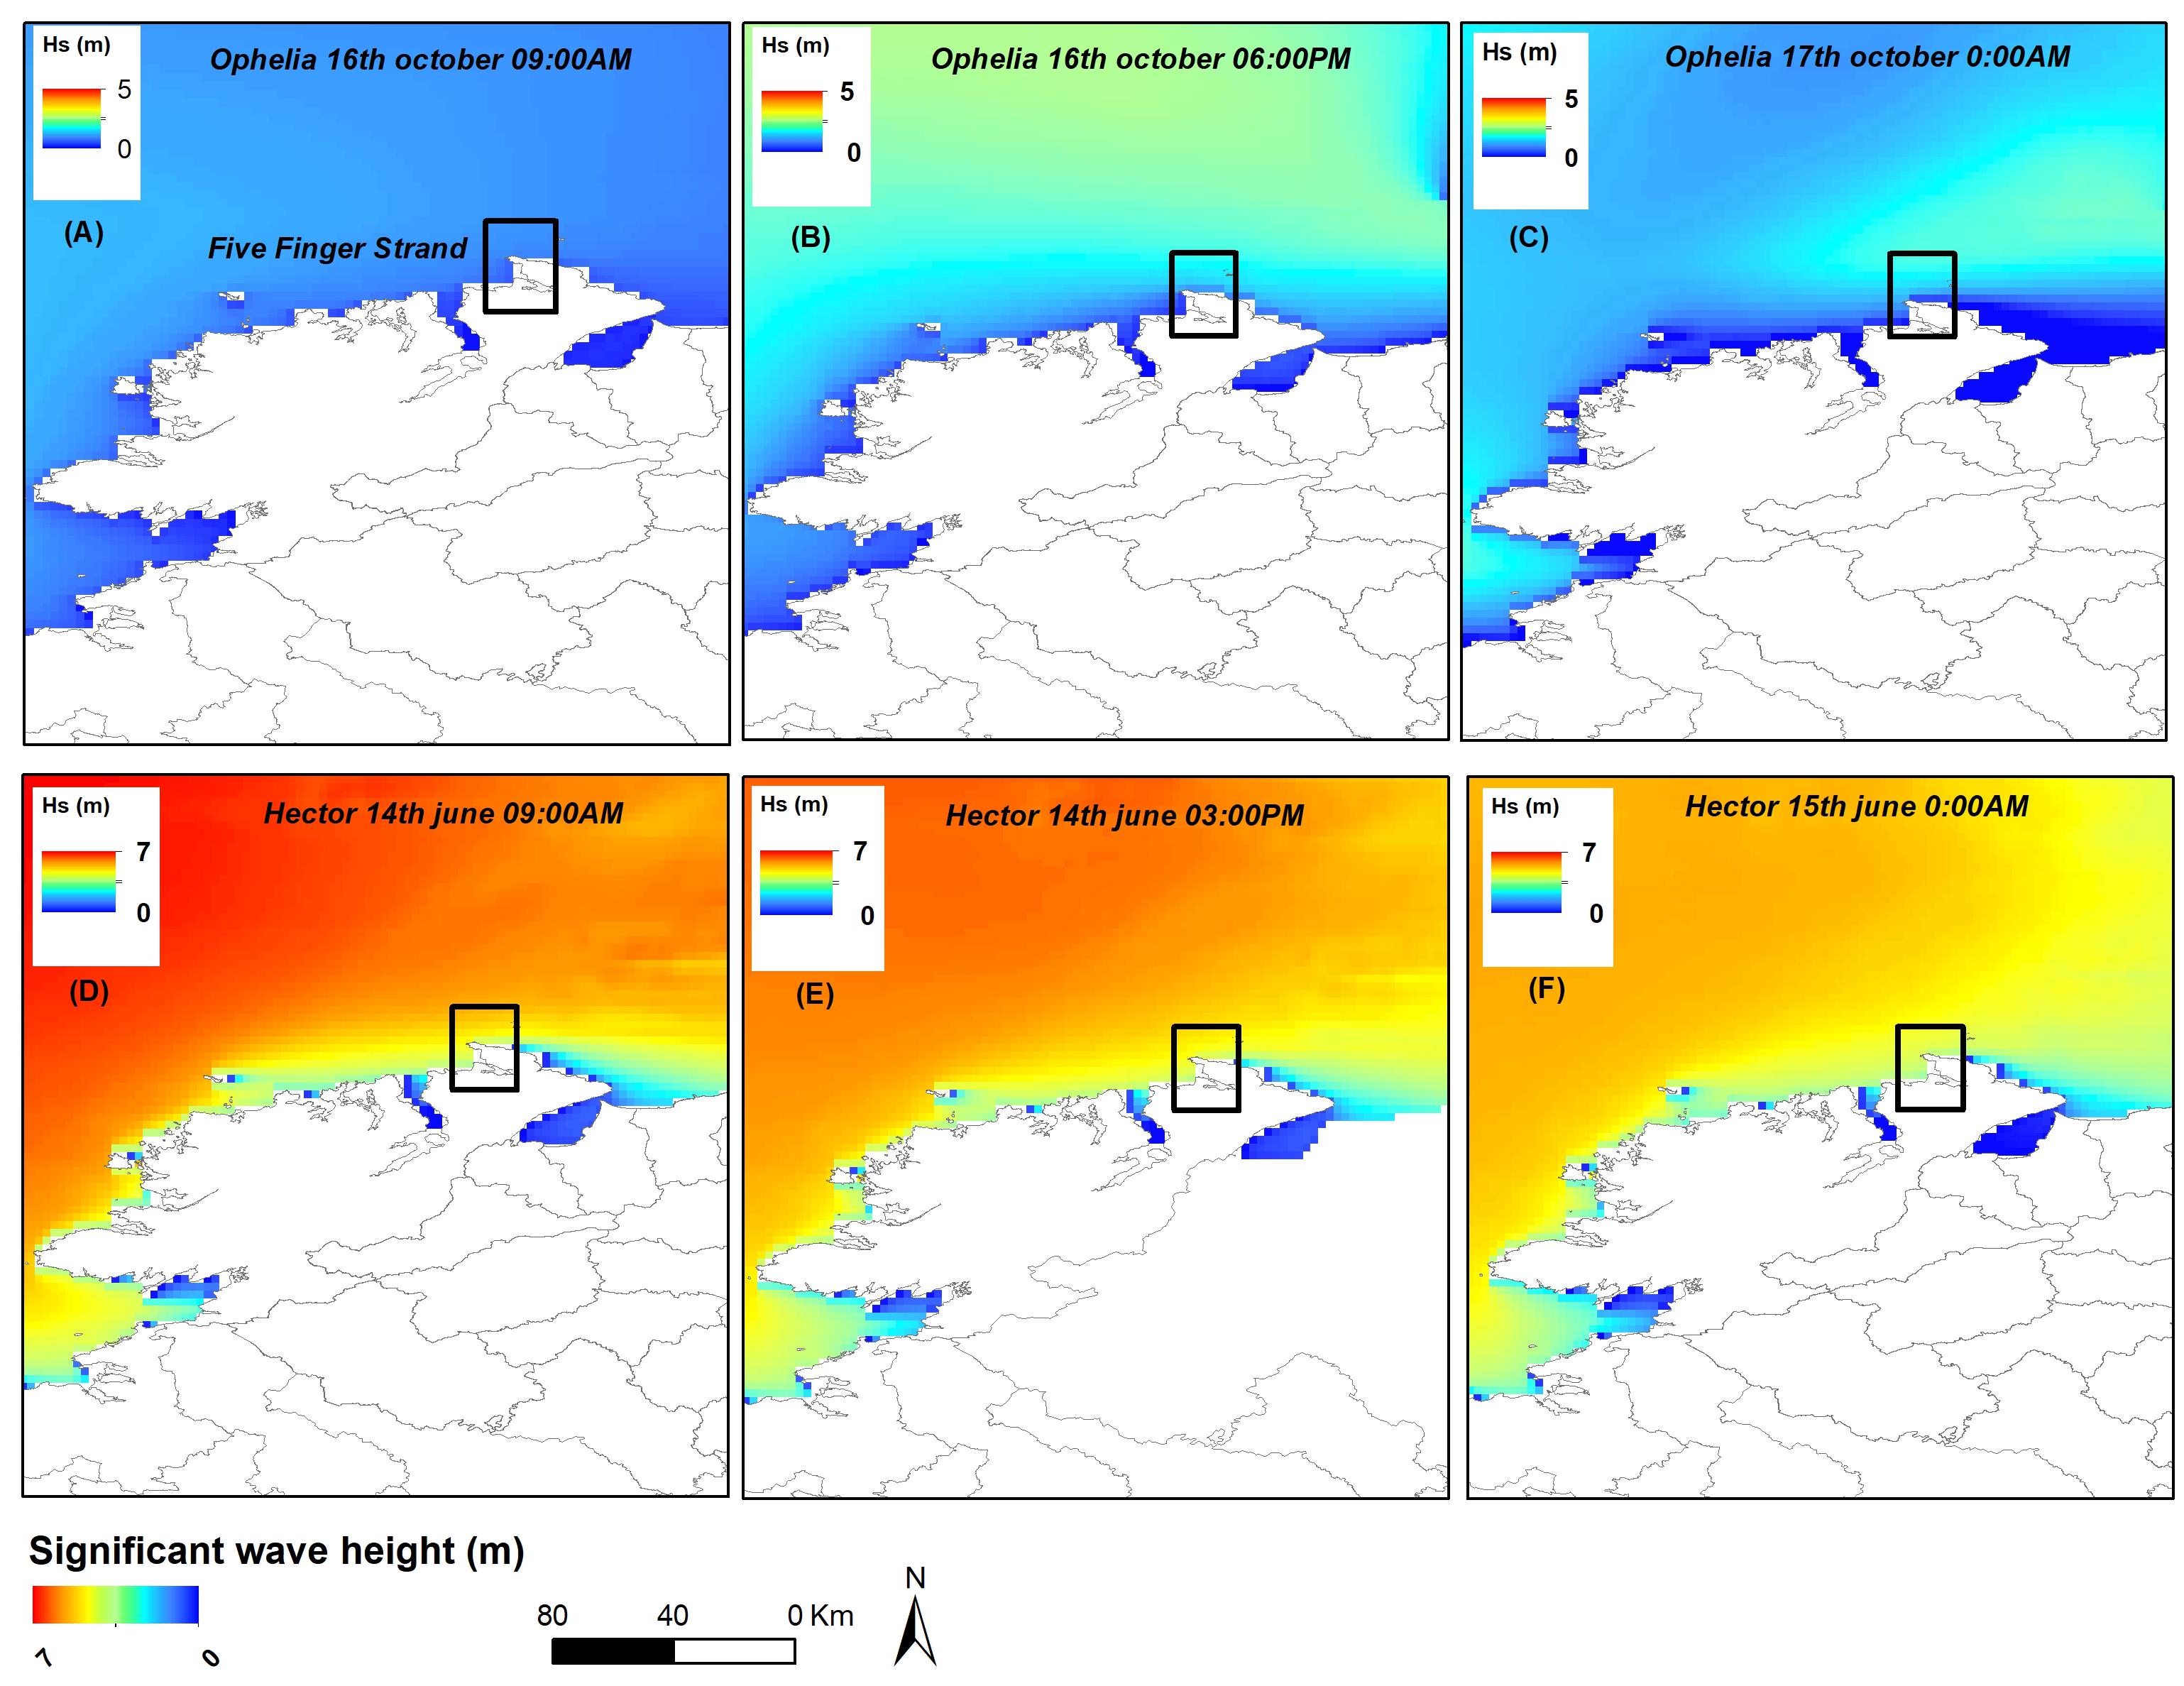
Figure 3. Spatial and temporal evolution of Storm Ophelia (A–C) and Storm Hector (D–F) as they moved across the northwest coast of Ireland. Location map highlights the study site (black square) and hydrodynamic conditions (Significant wave heights) from the Marine Institute East Atlantic SWAN wave model.
Storm Hector
Storm Hector occurred in the second half of June 2018 and was formed by an unusually strong jet stream forced by a cold air mass from Polar Regions meeting a warm air mass from the tropics. The storm reached the western Ireland coast on Wednesday the 14th June around midnight, producing 2 days of gales on the 13th and 14th, followed by frontal systems crossing toward Scotland on the 20th June.
Storm Hector’s highest gust was 61 knots (113 km/h), the highest June gust since 2005. The month’s highest 10-minute mean wind speed was 48 knots (89 km/h), and its highest June 10-min wind speed since 2005.1 In Northern Ireland, gusts of 64 knots (119 km/h) and 60 knots (111 km/h) were recorded.2
The strongest winds from Storm Hector over the northern coast of Ireland were coincident with high spring tides, leading to coastal flooding and wave overtopping in many coastal areas of Co. Donegal and Co. Galway. Storm Hector arrived at the study site around 3:00 am on the 14th of June (Hs = 2.5 m) and lasted until the 15th June 6:00 am were significant wave heights dropped below 2.5 m (Figures 3E,F). The storm had reached a maximum significant wave height of 4.0 m south of Malin Head (14th June 9:00 am) (Figure 3D). Mean wave period of 6 s were recorded closest to the study site. While offshore, the Marine Institute M4 buoy (54.99°N 9.9°W), recorded a wave height of 6.53 m (T = 8.9 s) at 9:00 am on the 14th of June. The storm showed a mean wave direction of 220–270° (W and WSW), perpendicular to the main coast orientation.
Methods
Wave and wind data have been analysed as Storm Ophelia and Storm Hector moved over Ireland’s western coastline, with particular reference to Five Finger Strand, using hourly data from various meteorological stations over a 24-h period encompassing both storms. To investigate the response at Five Finger Strand beach and dune system detailed before and after topographic data were acquired using a Terrestrial Laser Scanner (TLS) to quantify changes in the intertidal and subaerial beach areas as well as across the beach/dune topography (Table 1). Continuous monitoring of derived wave run-up and further storm-dune interactions during the occurrence of both events was carried out using a fixed, time-lapse camera over-looking the site.
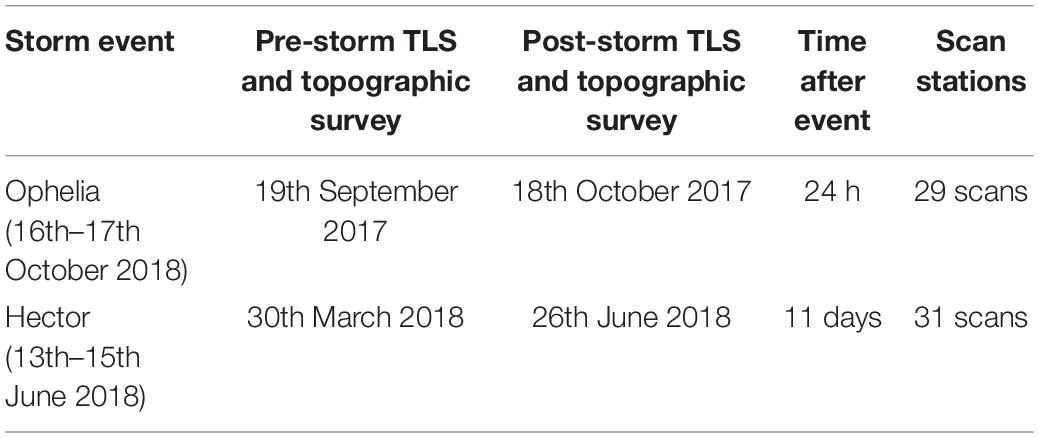
Table 1. Main characteristics of the storm events studied and the topographic surveys performed to monitor geomorphological impact.
Hydrodynamic Conditions During the Events
Offshore and Nearshore Modelled Wave Conditions
Modelled wave conditions at intermediate depths (−20 m) for analysing wave forcing close to the site was performed using the East Atlantic SWAN Wave Model output from Ireland’s Marine Institute. The model uses the nearshore wave model SWAN (Booij et al., 1999; Ris et al., 1999) at a 0.025 degrees resolution (1.5 km) for a domain covering the Irish waters. The Global Forecast System (GFS) by the National Center for Environmental Prediction (NCEP) and the Fleet Numerical Meteorology and Oceanography Center (FNMOC) through Wave Watch 3 data model, provide boundary conditions. The model provides 3-hourly significant wave height (Hs), wave period (T) and wave direction (D). The nearest grid point to the site (55.332°N, 7.40°W; −20 m depth and located 2.7 km offshore) was used for extracting wave forcing (see Figure 1A). Wave analysis covered periods from pre-storm TLS surveys of the beach, from the 19th September 2017 until Storm Ophelia and from the 30th of March 2018 until the occurrence of Storm Hector respectively.
Water Levels and Wind Forcing
Tide levels were extracted every 6 min from the Malin Head tide gauge at 55.37°N, −7.33°W (see Figure 1A). The tidal dataset was combined with the height of the dune toe, taken previously from the TLS and GPS data along the back-beach (Figure 2D), and used to assess potential erosion of dune toe areas. Total water levels were calculated as the combination of the tide level and run up heights (Ruggiero et al., 2001; Young et al., 2016; Castelle et al., 2017). Stockdon et al. (2006)’s formula for dissipative beaches discerned that the level was exceeded by 2% of waves (R2%).
Real-time wave run-up and dune toe encroachment monitoring was supplemented by a fixed, time-lapse camera system (Brinno TLC200) set to capture images twice an hour. As a result, images spanning the whole monitoring period and particularly during the occurrence of the storm events (see Tables 1, 2) helped (qualitatively) to image features such as sand lags/deposits and actual run-up encroachments.
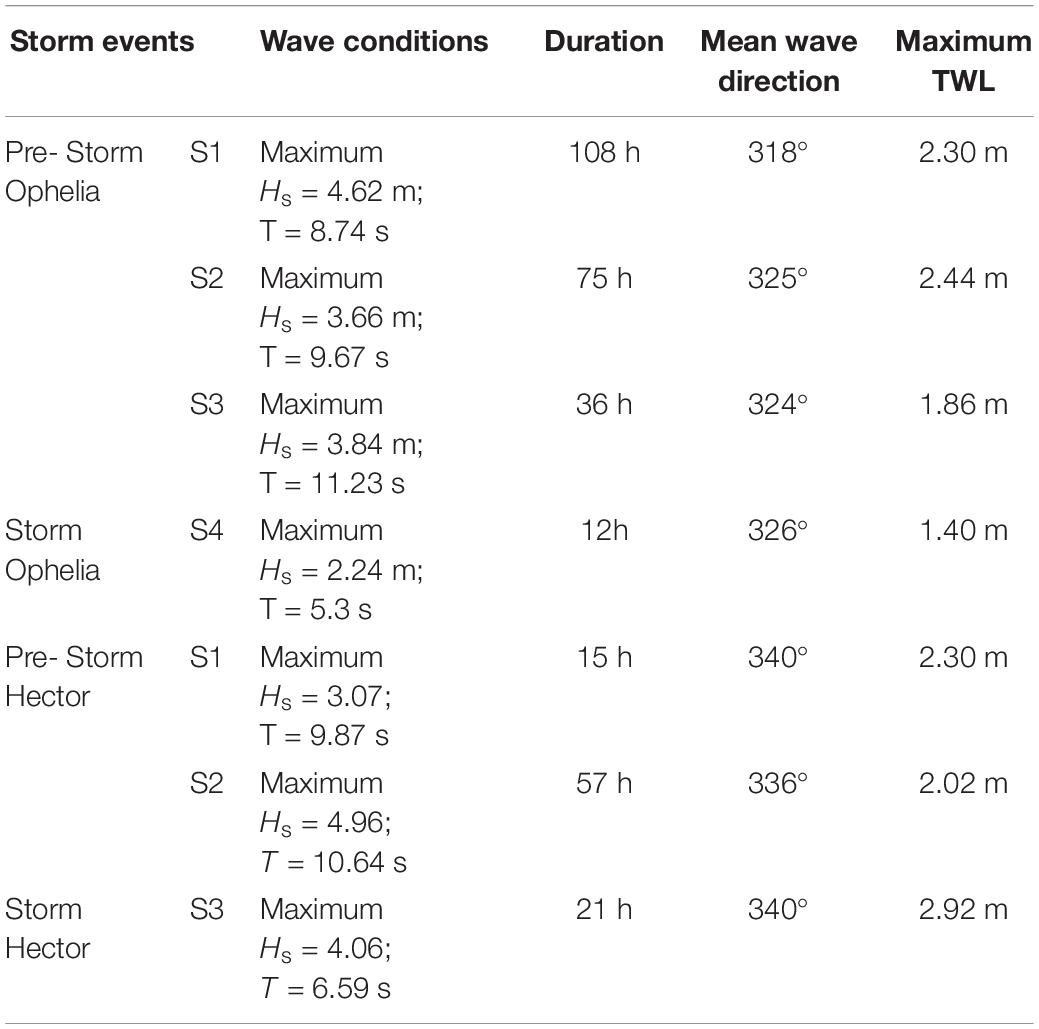
Table 2. Storm characteristics for each surveyed period pre- and post-Ophelia and Hector storms.
Additionally, the wind regime was assessed during the passage of both storm events using the Malin Head meteorological station (shown in Figure 1A) operated by Met Eireann: The Irish Meteorological Service. Ten-minute average wind speeds (knots), wind direction (degrees) and Mean Sea Level Pressure (hPa) were extracted to examine wind forcing (speed and direction) during storms Ophelia and Hector.
Characterisation of Storm Events
Storm thresholds are usually site specific, with wind speed-based values ranging from 7.6 to 15.3 m/s in Atlantic coastal areas (Lozano et al., 2004). Here, we define storm events as those with a peak significant wave heights (Hs) above 10% exceedance of wave height, previously determined as being Hs > 3 m (Guisado-Pintado and Jackson, 2018). To determine the storm duration we used the 5% of exceedance meaning that a wave induced storm is noted only when Hs exceeds the 5% exceedance wave height (Masselink et al., 2016a,b) and ends with it falls below this limit. For the study site, the 5% exceedance wave height was set at Hs = 2 m. A minimum threshold for storm duration of 12 h was considered (to guarantee the events extend over high tide).
Given that storm events can differ significantly in terms of duration, wave power and morphological impact, the use of environmental proxies help to classify and compare storm events for a specific site. Proxies allow analysis of the variation in storms and their geomorphological impact, based on variables such as the frequency, duration, wave power and category (e.g., Dolan and Davies, 1992; Rangel-Buitrago and Anfuso, 2011). Two proxies were used to characterise storm climate during the study period: the Storm Severity Index (SSI) and the Storm Impact Potential (SIP) both developed by Zãinescu et al. (2017). In addition, a new index called Storm Dune Trimming (SDT) is proposed here to account for the potential dune trimming of a specific storm event.
The SSI quantifies the total energetic strength of an individual storm, based on the wind speed and its duration, and is based on work by Lamb and Frydendahl (1991):
Where: V = wind speed and T = total duration of a given speed (h).
In order to measure the potential coastal impact of a storm, the morphologic index (SIP) was used as it accounts for the angle of wind direction (α) and the shoreline orientation (θ) itself, which in the case of Five Finger is mostly N-S. Maximum impact is therefore assumed for storms from the NW to SW (i.e., for angles between 200° and 300°) for this site. Lower impacts correspond to storms that approach the coast with a longshore or slightly oblique strike to the shore direction (N–NNW; S–SSW). For this proxy, offshore wind directions are not taken into consideration.
Where: V = wind speed and T = total duration of a given speed (h).
Finally, the Storm Dune Trimming (SDT) proxy is designed to estimate the total water level (water level and run up) reached by a storm and thus the potential dune impact. The proxy is a measure of the number of hours for which total water levels of a specific onshore storm event is above the average and lower dune toe height.
Where: TWL = total water level, Th = total duration of wave height above dune toe (h) and α = wave direction.
Topographical Change Analysis
Topographic changes, driven by the storm events, both in the intertidal area and subaerial beach, were quantified using a FARO Focus 3D × 330 TLS. The TLS survey produced a dense point cloud, extending from the dune toe toward the intertidal environment. Surveys were undertaken during low tide conditions, revealing a large part of the intertidal area to around −1.5 m (see Figures 2A,B) and ranging landward over front sections of the dunes (up to +20 m).
Topographic surveys were performed along the northern section of Five Finger Strand (Figure 1B), selecting a 420 m × 250 m area of interest (≈105,000 m2). For Storm Ophelia pre- and post-storm surveys were 6 weeks apart (Guisado-Pintado and Jackson, 2018), whereas for Storm Hector a pre-storm survey was carried out 13 weeks before the event and the post-storm took place 8 days after the event (Table 1). A total of 29 scan station locations were established across the site for each event, ensuring good coverage. We used 6 target spheres as reference Ground Control Points (G) (Figure 1B) georeferenced into the Irish National Grid coordinate system using a RTK dGPS (Trimble 5800) with an accuracy of 0.03 m in x, y and z.
TLS-generated Point Clouds were post-processed to create Digital Surface Models (DSMs) from pre- and post- conditions of the storm events. The Geomorphic change detection (GCD) add-in in ArcGIS (Wheaton et al., 2010) allowed surface volume variations (DEM of Difference, DoD) and topographical comparisons (vertical changes) of each pair of surveys. The total volumetric change (dQtotal in m3) relates to the difference in volume of the post- and pre-storm surface utilising the DEM, and areal change (dAtotal m2) is the amount of area undergoing erosion/deposition after each event and over subsequent TLS surveys during the recovery process. To guarantee the quantification of morphological changes at different beach sections as well as the comparison of driven impacts of both events (storms Ophelia and Hector), four zones were delimited following Guisado-Pintado and Jackson (2018). These relate to (1) lower areas from mean sea level (MSL) to lowest level surveyed by TLS, (2) an intertidal channel, (3) between MSL and the shoreline (dune toe) and; (4) the upper area from the shoreline to the top of the dune edge (Figure 2C). Finally, five cross-shore profiles (Figures 1, 2) extracted from DTM surveys where analysed to assess alongshore and cross-shore morphological changes between the two storm events.
Results
Wind Forcing
Wind is one of the main environmental variables that dictates the characteristics of locally generated waves at the coast, with speed and direction of wind critical in driving potential beach impacts from a storm. Wind patterns and resulting wave climates during storms Ophelia and Hector were significantly different, with storm events that occurred between the pre- and post TLS surveys also being dissimilar in power, orientation and duration.
During Storm Ophelia, winds reached a maximum of 38 knots (70 km/h) at Malin Head station which were sustained for around 3 h (Figure 4A). However, as shown in Figure 4B, the wind direction was mostly shore-parallel and varied from a predominantly southern direction (about 180°) to SSW (220°) as the storm passed through the site (17th October 2017 at around 18:00 h). At Malin Head during the passage of the Storm Ophelia, sea level pressure reached a minimum of 979 hPa (Figure 4C). Storm Hector’s pattern was somewhat different. A maximum wind speed of 37 knots was recorded during the storm but lasted for only 1 h (see Figure 4A), although sustained winds over 18 knots were recorded for the remainder of the storm. Predominantly onshore winds with an average direction of 220–270° (WSW) were recorded over the site during the passage of Storm Hector. Minimum pressure at sea level never fell below 985 hPa (Figure 4C). In both cases, mean wind speeds during the storms were around 27 knots at Malin Head station (Figure 4A) and changes in wind orientation conditions produced a 5–10 knots decrease in wind speeds (Figures 4A,B).
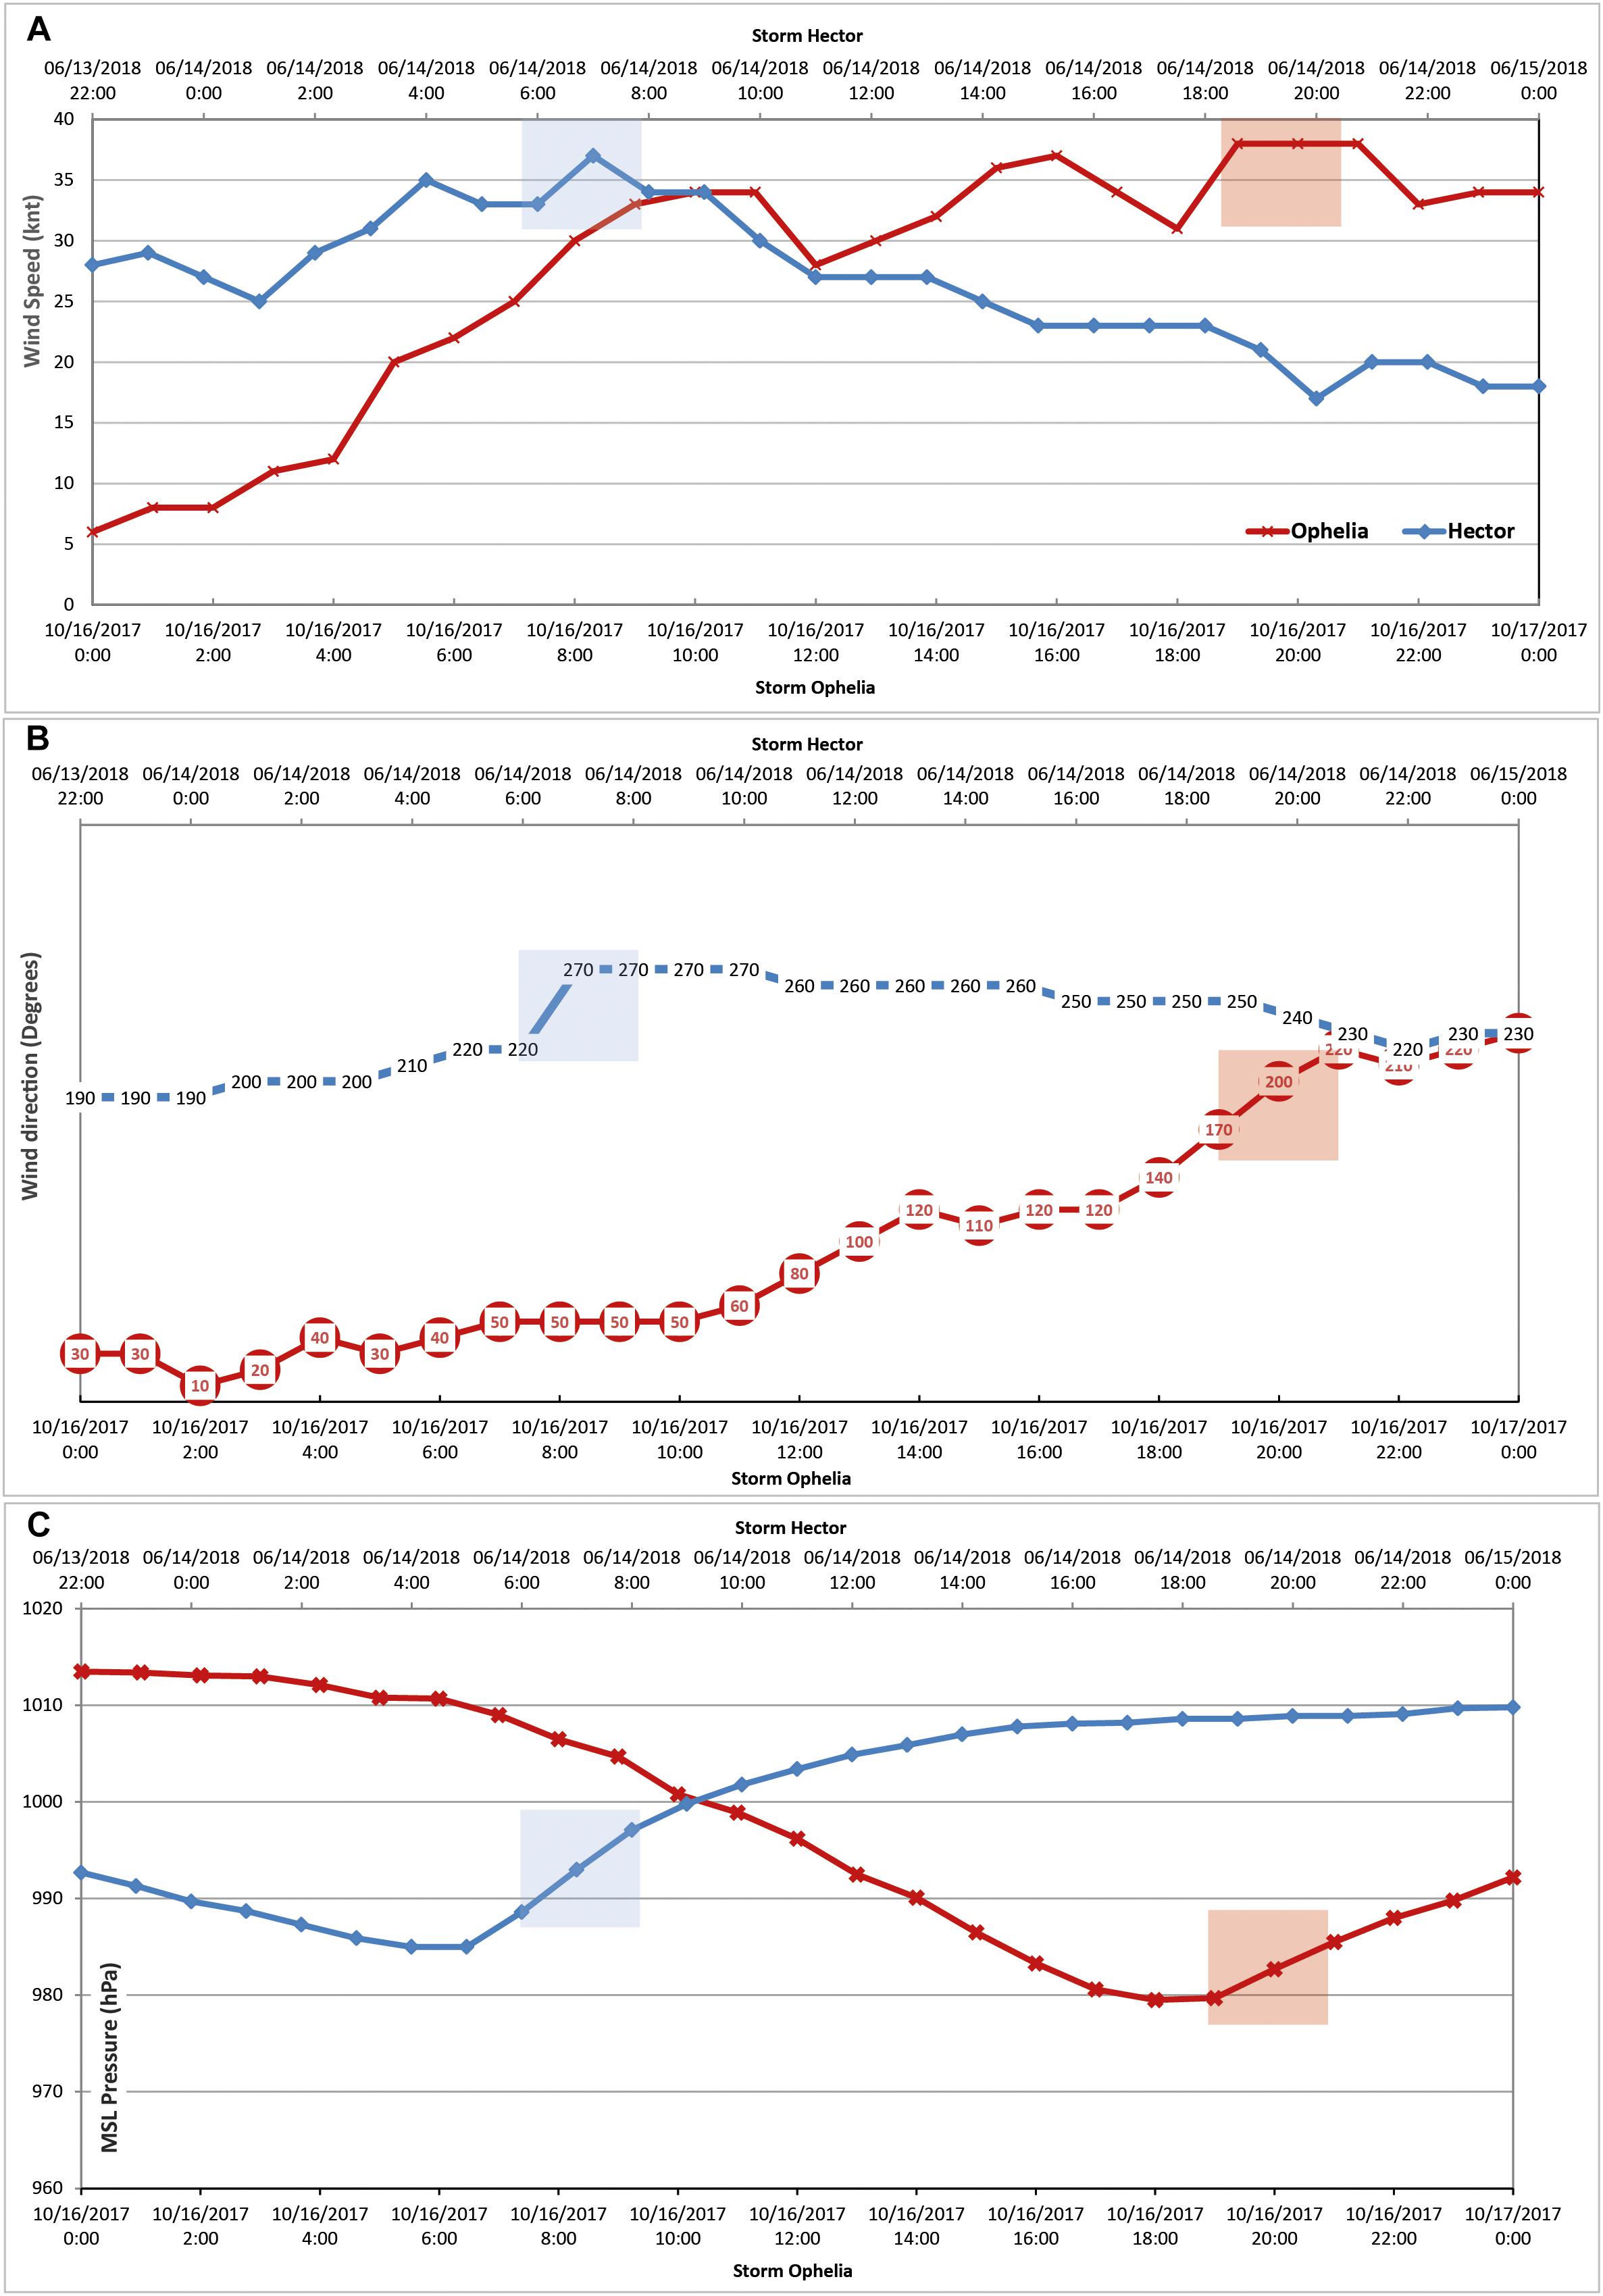
Figure 4. Time-series of wind conditions during both storm events at Malin Head Station. From above (A) 10-min wind speed (knots), (B) wind direction (degrees) and (C) Mean sea level pressure (hPa). Red and blue boxes represent Storm Ophelia and Storm Hector coincidence at Five Finger Strand respectively.
Wave Climate and Storm Occurrence: Evolution and Characterisation
The hourly evolution of Storm Ophelia along the western seaboard of Ireland (Figures 3A–C) reveals that the storm’s intensity gradually dissipated as it travelled north, whereas during Storm Hector energy conditions reached their maximum level at northern Irish latitudes as the storm moved toward the western seaboard (Figures 3D–F. In the case of Storm Ophelia, and according to Guisado-Pintado and Jackson (2018), three storm wave events (onshore directed with orientation varying from 318° to 324°) were recorded in between topographic and TLS surveys and before the occurrence of Storm Ophelia (see Table 2 and Figure 5A). The peak of the first storm (S1) occurred on the 2nd Oct at 03:00 am during high tide (1.21 m), producing a total water level (TWL) of 2.13 m. A second highest synchronisation between wave height and water levels took place on the 4th October between 16:30 and 18:00 h, where TWL peaked to 2.2 m (see Figure 5C). The second storm (S2: 10th Oct 18:00 h) began 5 days later and over its duration was coincident with several cycles of high tide (1.47 m) resulting in a maximum TWL of 2.5 m and thus above average dune toe height (2 m height as shown in Figure 2D). S2 peaked during the night of 10th October at 9:00 pm and couldn’t be recorded by the TLC but hours later (11th October between 09:00 and 10:00 am) a second peak resulted in TWL of 2.07 m as evidenced in Figure 5D, affecting the dune toe line in the most southern sections. Six hours after the end of S2, a third storm occurred (S3: 13th Oct 15:00 h). S3 presented two peaks, one on the 14th at midnight with a maximum TWL of 1.86 m and a second the 14th at midday where TWLs were around 1.8 m, in both cases below mean dune toe height (Figure 5E). Twenty-four hours after the end of S3, at 3:00 am, Storm Ophelia struck south western Ireland. At the Five Finger site, on the 16th October at around 6:00 pm, the storm was coincident with a low tide, producing TWLs up to 1.4 m and hence below the average height of the dune toe at the time as shown in Figure 5F. Given the fast tracking speed of Storm Ophelia, sustained high wave energy conditions were limited and the average significant wave height was <2.5 m at Five Fingers Strand. Interestingly, using the standard storm analysis, which includes a certain threshold criteria (duration and 10% of exceedance of significant wave height), Storm Ophelia may not actually be characterised as a storm ‘event’. On the other hand, two of the three storm events (S1 and S2) that impacted Five Finger before Storm Ophelia, had the potential to produce dune trimming and shoreline retreat with the calculated TWLs (Figure 5B) and observed time-lapse images (Figures 5C,D). Neither Storm Ophelia nor the preceding storm (S3), however, had synchronised conditions (coincident with high tide and sustained onshore winds) with which to impact the dunes.
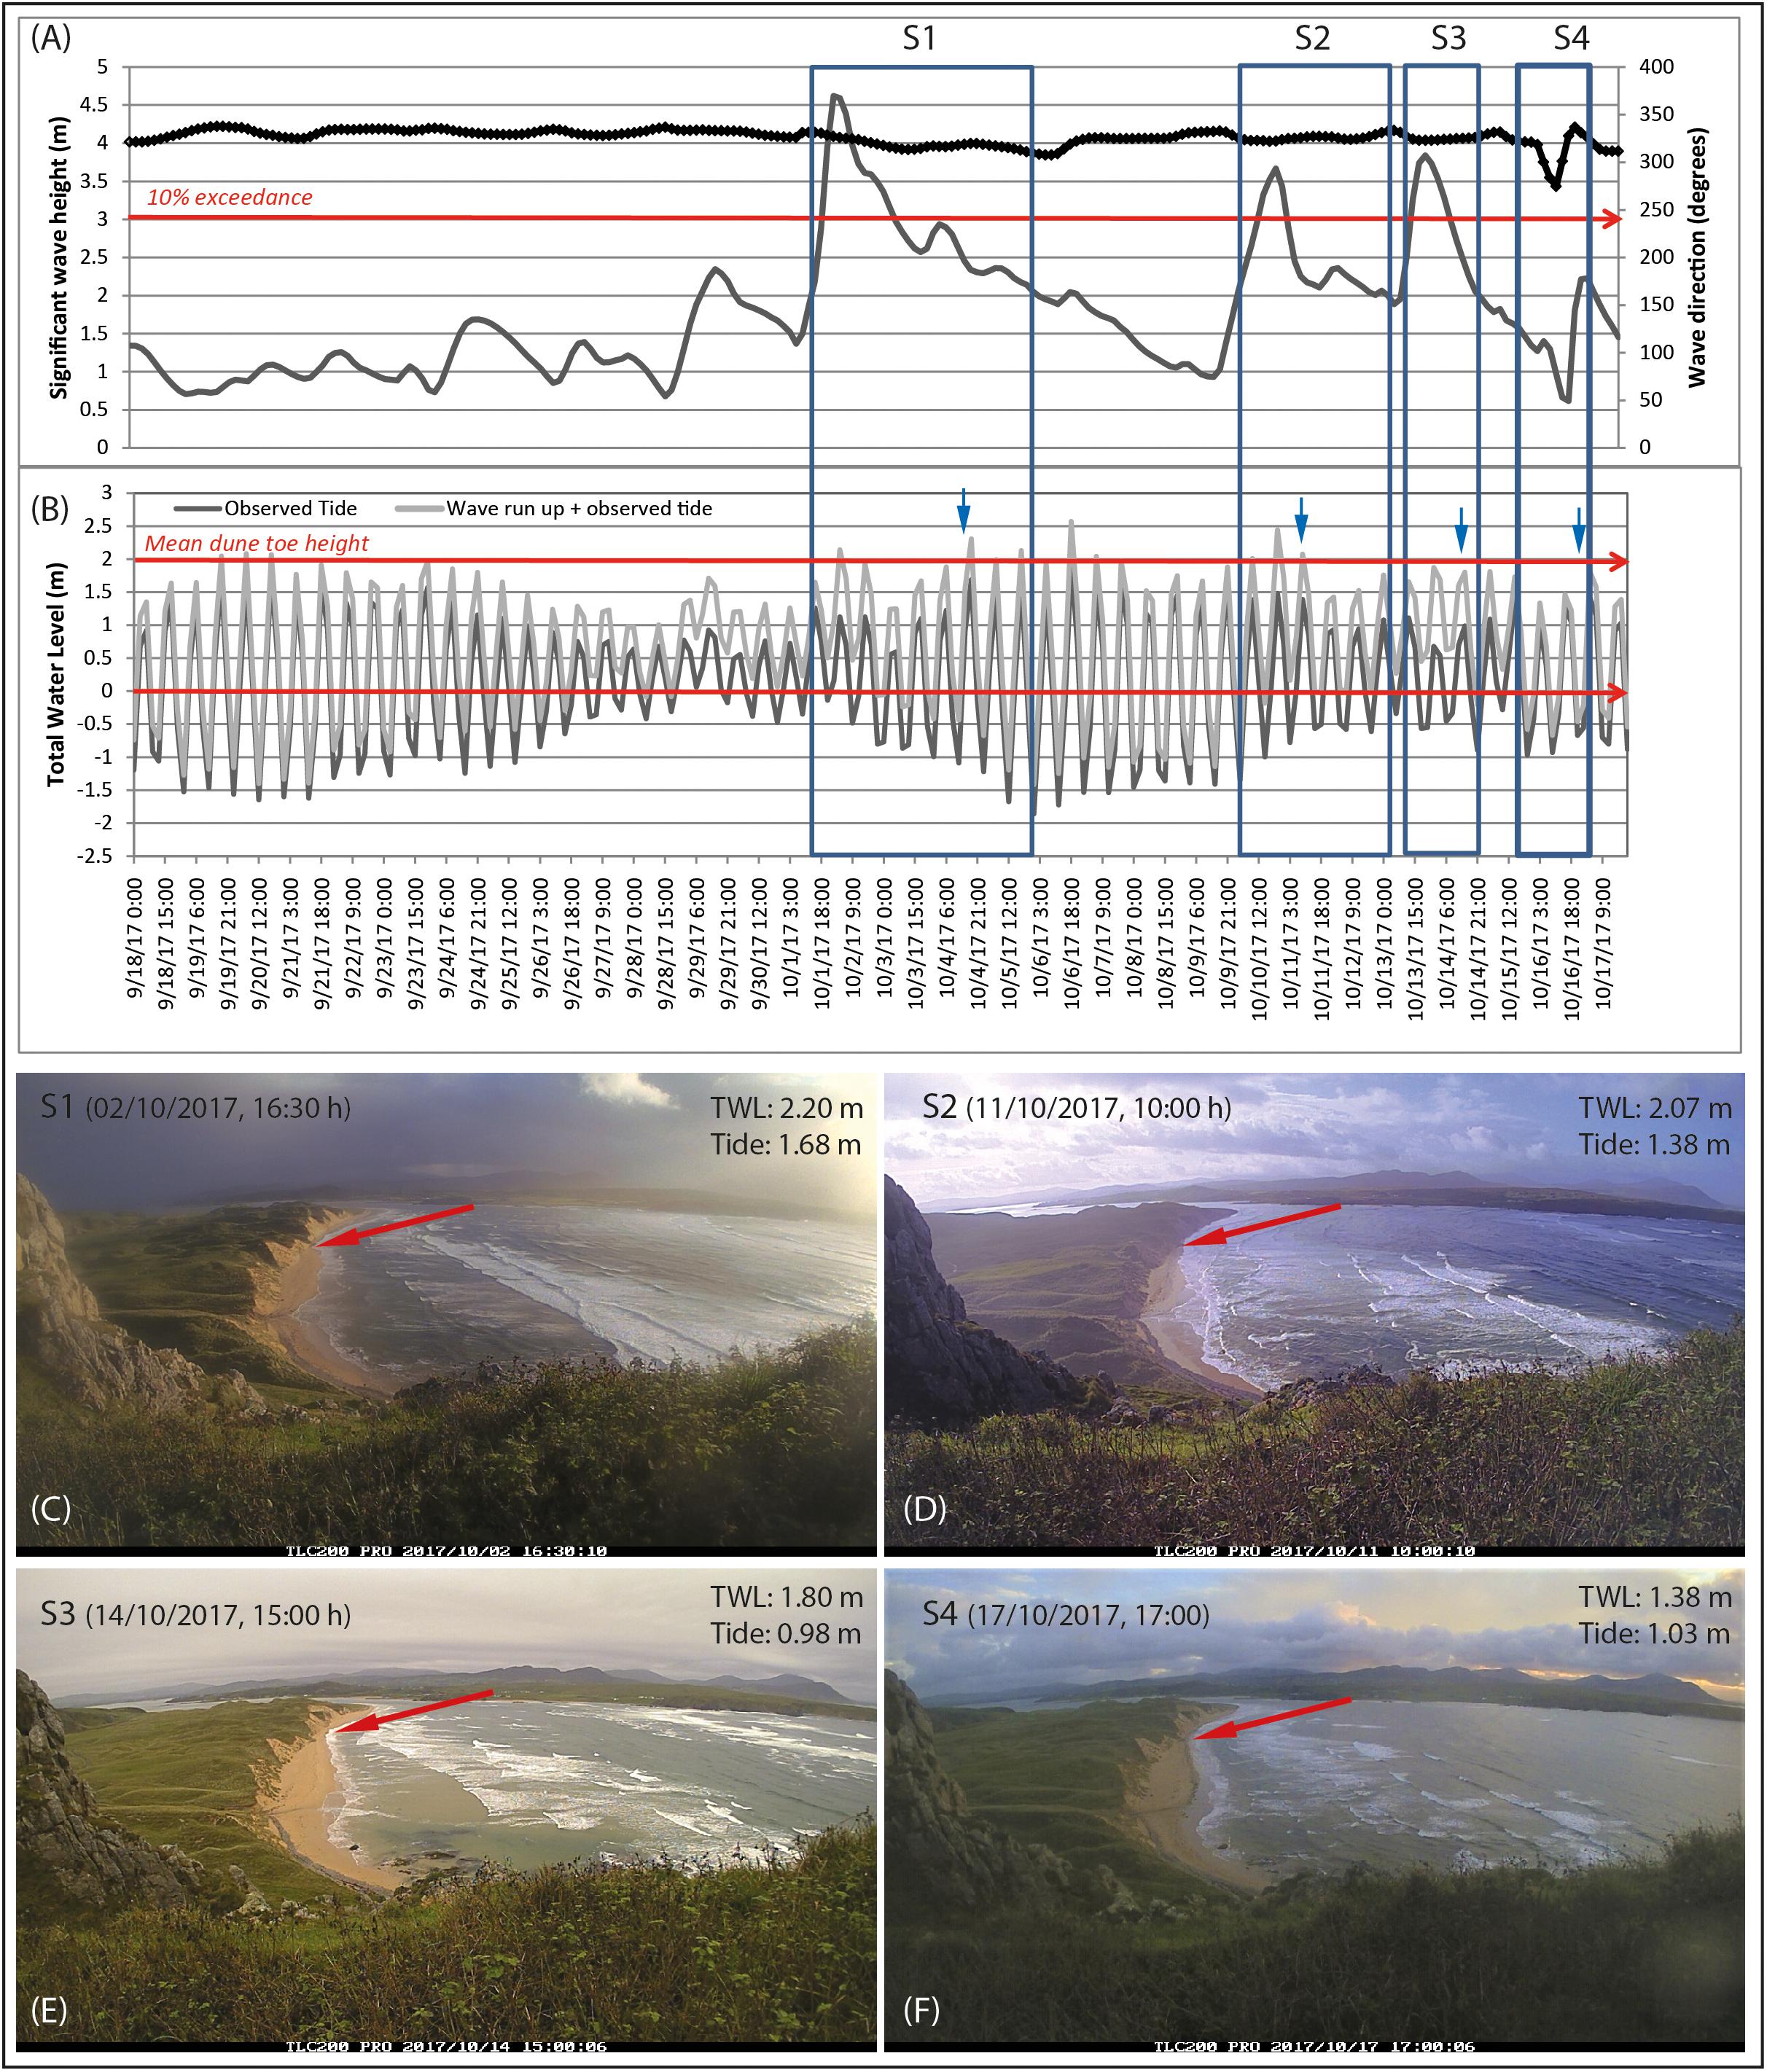
Figure 5. (A) Shows the wave climate time-series spanning Storm Ophelia where the left Y-axis accounts for Hs (grey line) and right Y-axis represents wave direction in degrees (top black line). Graph (B) represents the Total Water Level (TWL) based on wave run-up for each storm event (from Guisado-Pintado and Jackson, 2018) where blue arrows show the water level position from the time-lapse camera pictures. Squares highlight storm events that occurred between TLS/topographic surveys with S4 corresponding to Storm Ophelia. Pictures (C–F) show corresponding time-lapse images where peak storm wave height and/or the highest synchronisation of both wave height and water level during each storm analysed (S1–S4). Note that red arrows point to the maximum wave run up.
Storm Hector hit the western coast of Ireland during the 14th of June 2018. As the storm travelled north it increased in strength and the strongest winds were recorded across Northern Ireland before spreading eastwards across Scotland, northern England and north Wales. The storm lasted for 21 h and a maximum wave height of 4.06 m was recorded for the site. At the peak of the storm (14th June at 06:00 am), maximum water levels of 2.92 m were reached, given its coincidence with spring tide (2.21 m) and provoking the storm surge surpassing the average dune toe height for the site (Figure 2D). Wave run-up, as recorded by the time-lapse camera (see Figure 6D), reached the dune toe across the beach. However, in the spring of 2018, two other storms preceded Storm Hector at the site (Figure 6A and Table 2). The first storm (S1) began on the 17th April with its peak coincident with high tide (1.37 m) although TWLs achieved (2.3 m) were slightly below average dune toe height for north sectors but could have affected the dune toe in southern areas (see Figure 6B). One month later, S2 began on the 9th of May and lasted for 57 h. Despite its duration, the storm was coincident with neap tides and although morphological changes in the intertidal and supratidal occurred, wave run-up did not effectively reach the dune base. The peak of S2 occurred at 3:00 am on the 10th of May with a TWL of 2.02 m. A second peak took place 12 h later, resulting in maximum water levels below dune toe (TWL = 1.59 m) as can be seen in the time-lapse image (Figure 6C).
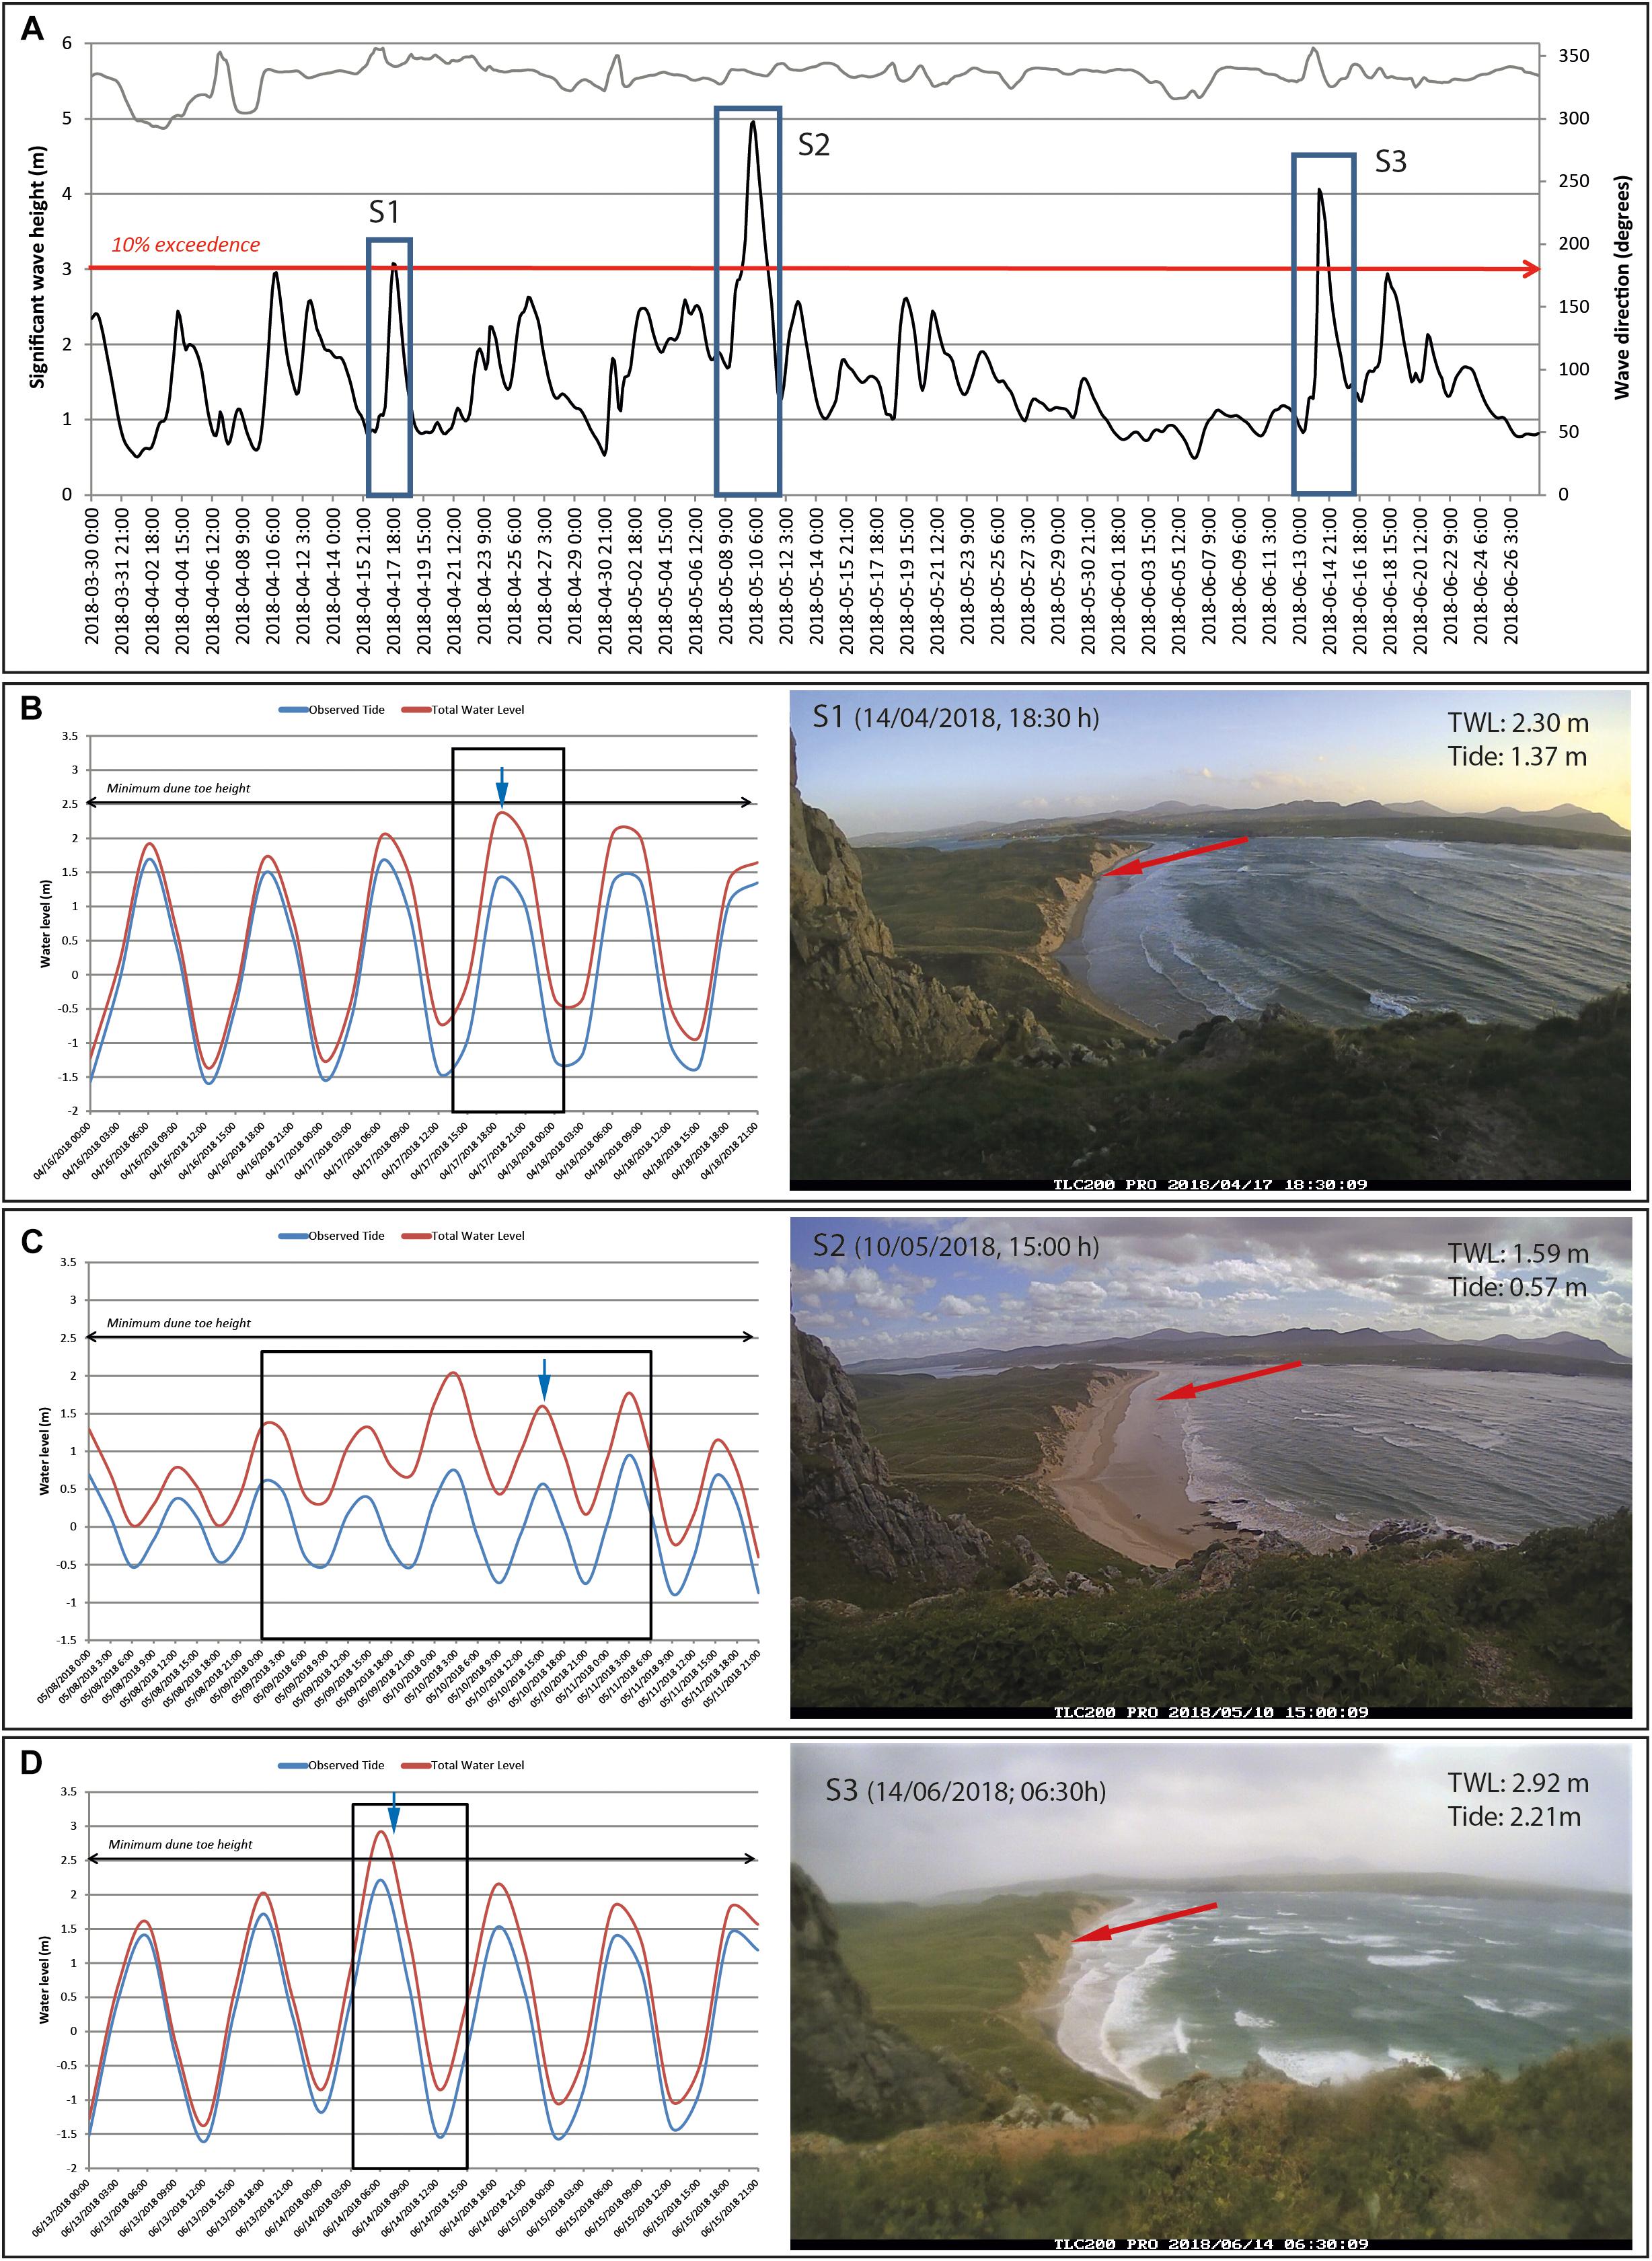
Figure 6. Wave climate time series spanning Storm Hector (A), where the left Y-axis accounts for Hs (black line) and right Y-axis represents wave direction in degrees (top grey line). Note that in this panel black empty squares highlight storm events occurring between TLS/ topographic surveys (S3 corresponds to Storm Hector). (B–D) represent measured water levels and calculated Total Water Level (TWL) based on wave run-up for each storm event considered (left hand). On the right, time-lapse images representing either the storm’s wave height peak or the highest synchronisation of both wave height and water level during each storm analysed (S1–S3). Note that red arrows point to the maximum wave run up reached.
A key aspect of our study is the use of storm proxies to examine individual storm events in terms of intensity, duration and potential morphological impact. Resulting proxies were calculated for the seven events: three preceding events before Storm Ophelia, Ophelia itself, two storms preceding Storm Hector and for Storm Hector. Table 3 shows calculated proxies and some significant differences between storm events. Previous to Storm Ophelia, S1 displayed the greater SSI and SIP values, inducing significant dune trimming (SDT = 0.11) due to both its duration (more 100 h) and its coincidence with several cycles of high tides. Similarly, S2, which occurred 10 days before Storm Ophelia, had a Storm Severity Index of 721 with a strong potential morphological impact (SIP = 566.12) and impacted the dunes as confirmed with the SDT value and TLC images (Figure 5D). On the other hand, S3 and Storm Ophelia resulted in lower values of SSI and SIP. In both cases, storm duration was too short to cause morphological impact in the intertidal and dune field (SDT < 0.05), although Storm Ophelia with shore-parallel winds could have had an important role in sediment transport across the base of the frontal dune line and supratidal areas.
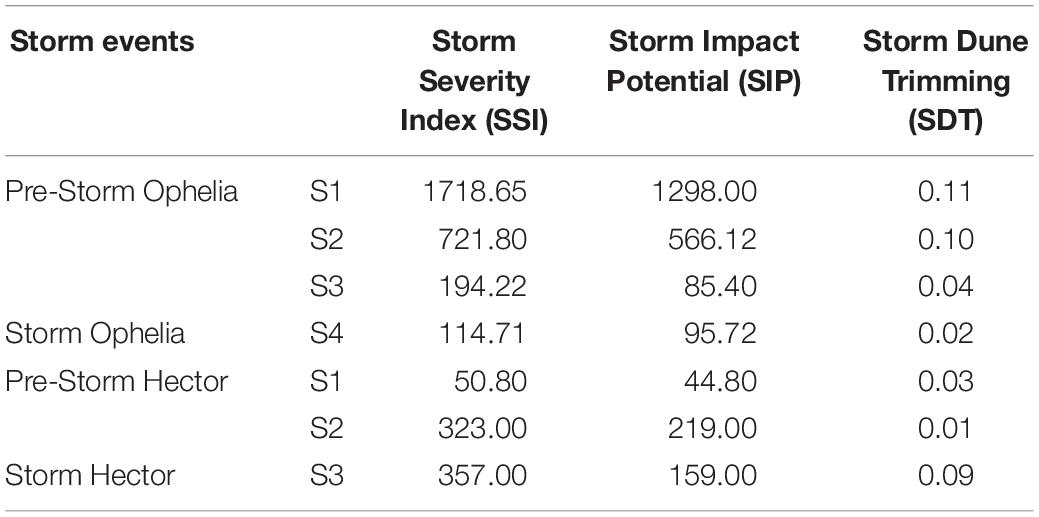
Table 3. Calculated proxies for each storm recorded at the study site.
Storm proxies for the events preceding Storm Hector as well as Storm Hector itself, show that despite S2 (May 2018) presenting similar and greater values of SSI and SIP respectively than Storm Hector, the effective morphological impact on the dunes and subaerial beach was minor (SDT = 0.01). The S2 had an overall duration of 60 h but it coincided with neap tides resulting in lower TWLs. On the contrary, Storm Hector despite it only lasting a third of S2 duration, was synchronised with Spring tides resulting in a SDT of 0.9 and thus giving dune toe erosion (Table 3 and Figure 6C).
Morphological Changes and Beach/Dune Response Patterns
The analysis of the morphological response from both events was carried out using two pairs of DTMs from TLS point clouds at 0.5 m resolution. As described by Guisado-Pintado et al. (2019), this method helps compare topographic and volumetric changes between surveys across a beach/dune continuum. Total volumetric change (dQtotal in m3) relates to a difference in volume between the post- and pre-storm periods using the DEM, whereas areal change (dAtotal m2) is the area with erosion/deposition.
The morphological response after Storm Ophelia shows that volumetric differences are significantly focussed in the alongshore, with a distinct North-South picture revealed (Figure 7A). The blue colour scale shows areas where deposition (gains) is prevalent, with a deposition volume of +9,464 m3 covering 0.39 km2 (around 38% of the surface) and located around the intertidal channel with a net gains in volume of +7,309 m3 (Figure 9B) for the whole area (Guisado-Pintado and Jackson, 2018). This deposition is particular evident across profiles P1 and P2 and P4 where the differences in elevation are around +0.5 m. Red areas represent erosion/sediment loss and is represented by 62% of the total surface area. A total volume of 15,481 m3, representing 0.66 km2, is ubiquitous over the lower (−7,140 m3) and upper beach area (−6,040 m3; Figure 9B) and represents −0.8 m in elevation change around profiles P3 and P5, as shown in Figures 8C,E. Finally, the southern dune face (at P4 and P5), where the minimum dune toe heights are found, accounts for a loss of −1,860 m3 due to dune trimming during the previous storms (around 0.5 m change in elevation) as shown in Figures 7A, 8D,E.
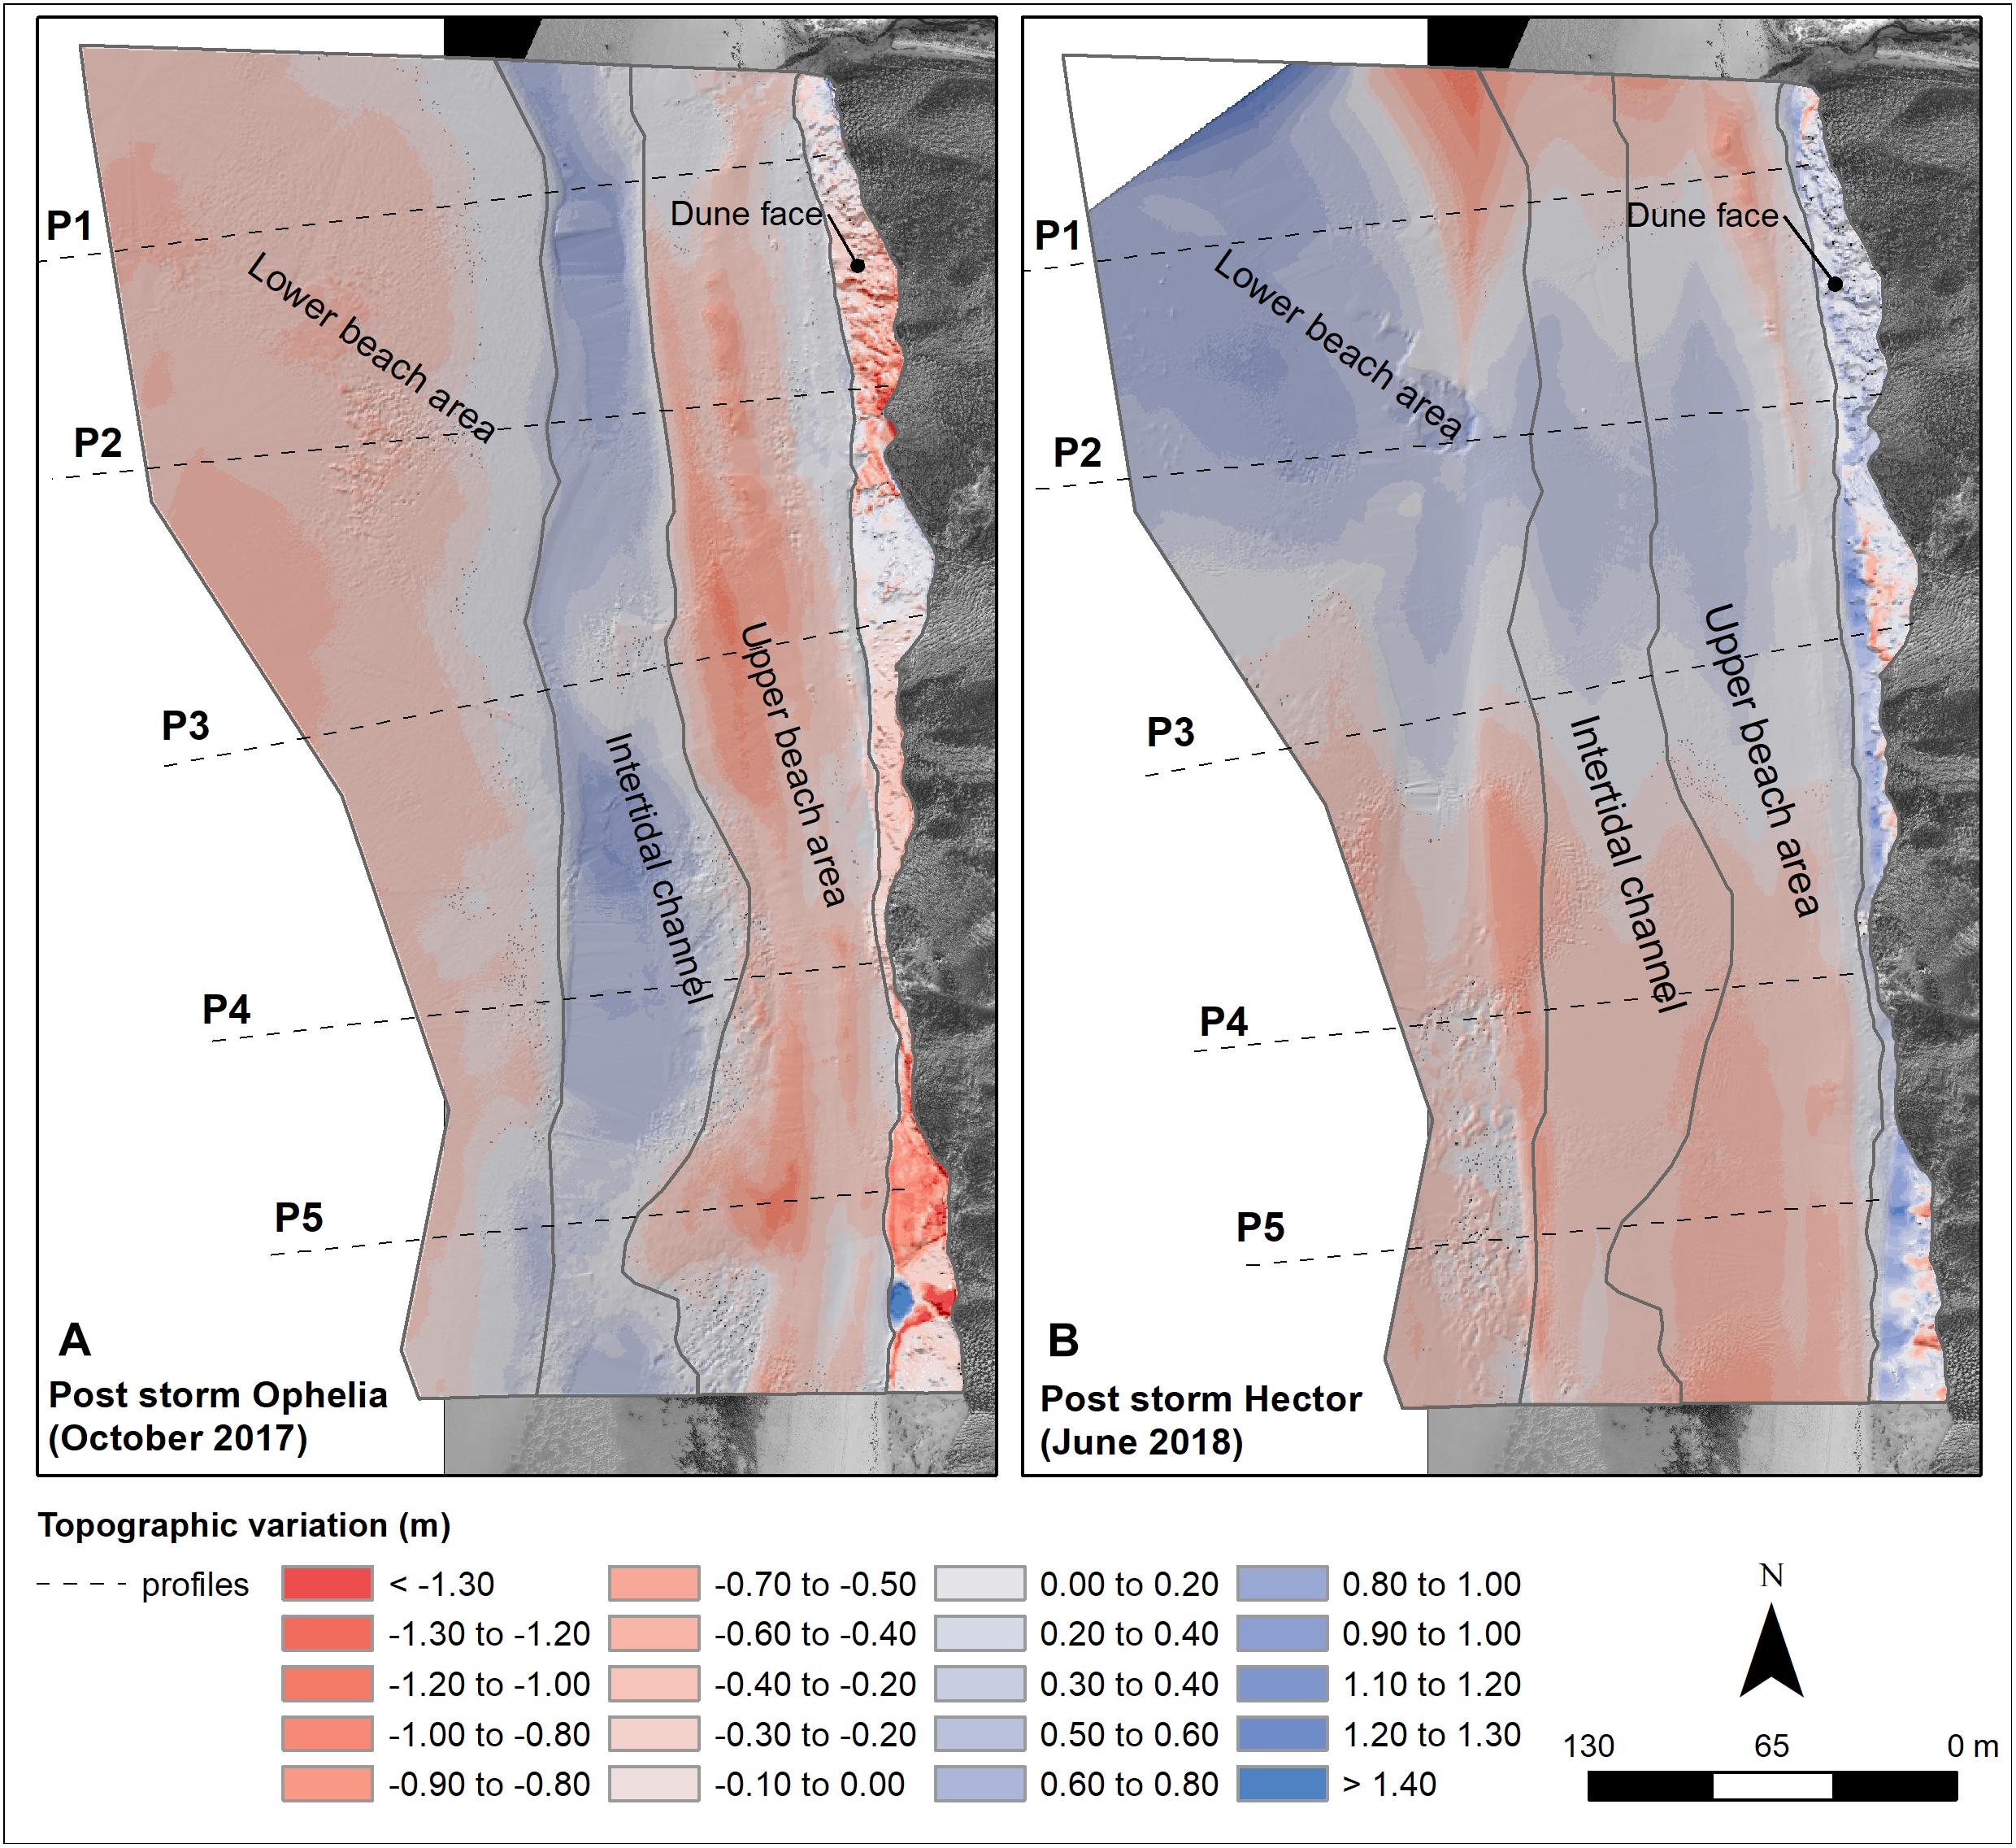
Figure 7. Spatial representation of topographic changes measured pre- and post-Storm Ophelia (A) and Storm Hector (B) at the study site. Four zones (dune face, upper beach, intertidal channel and lower beach area) are defined where topographic changes are evident. Note that cross-shore profiles are represented with black dashed lines.
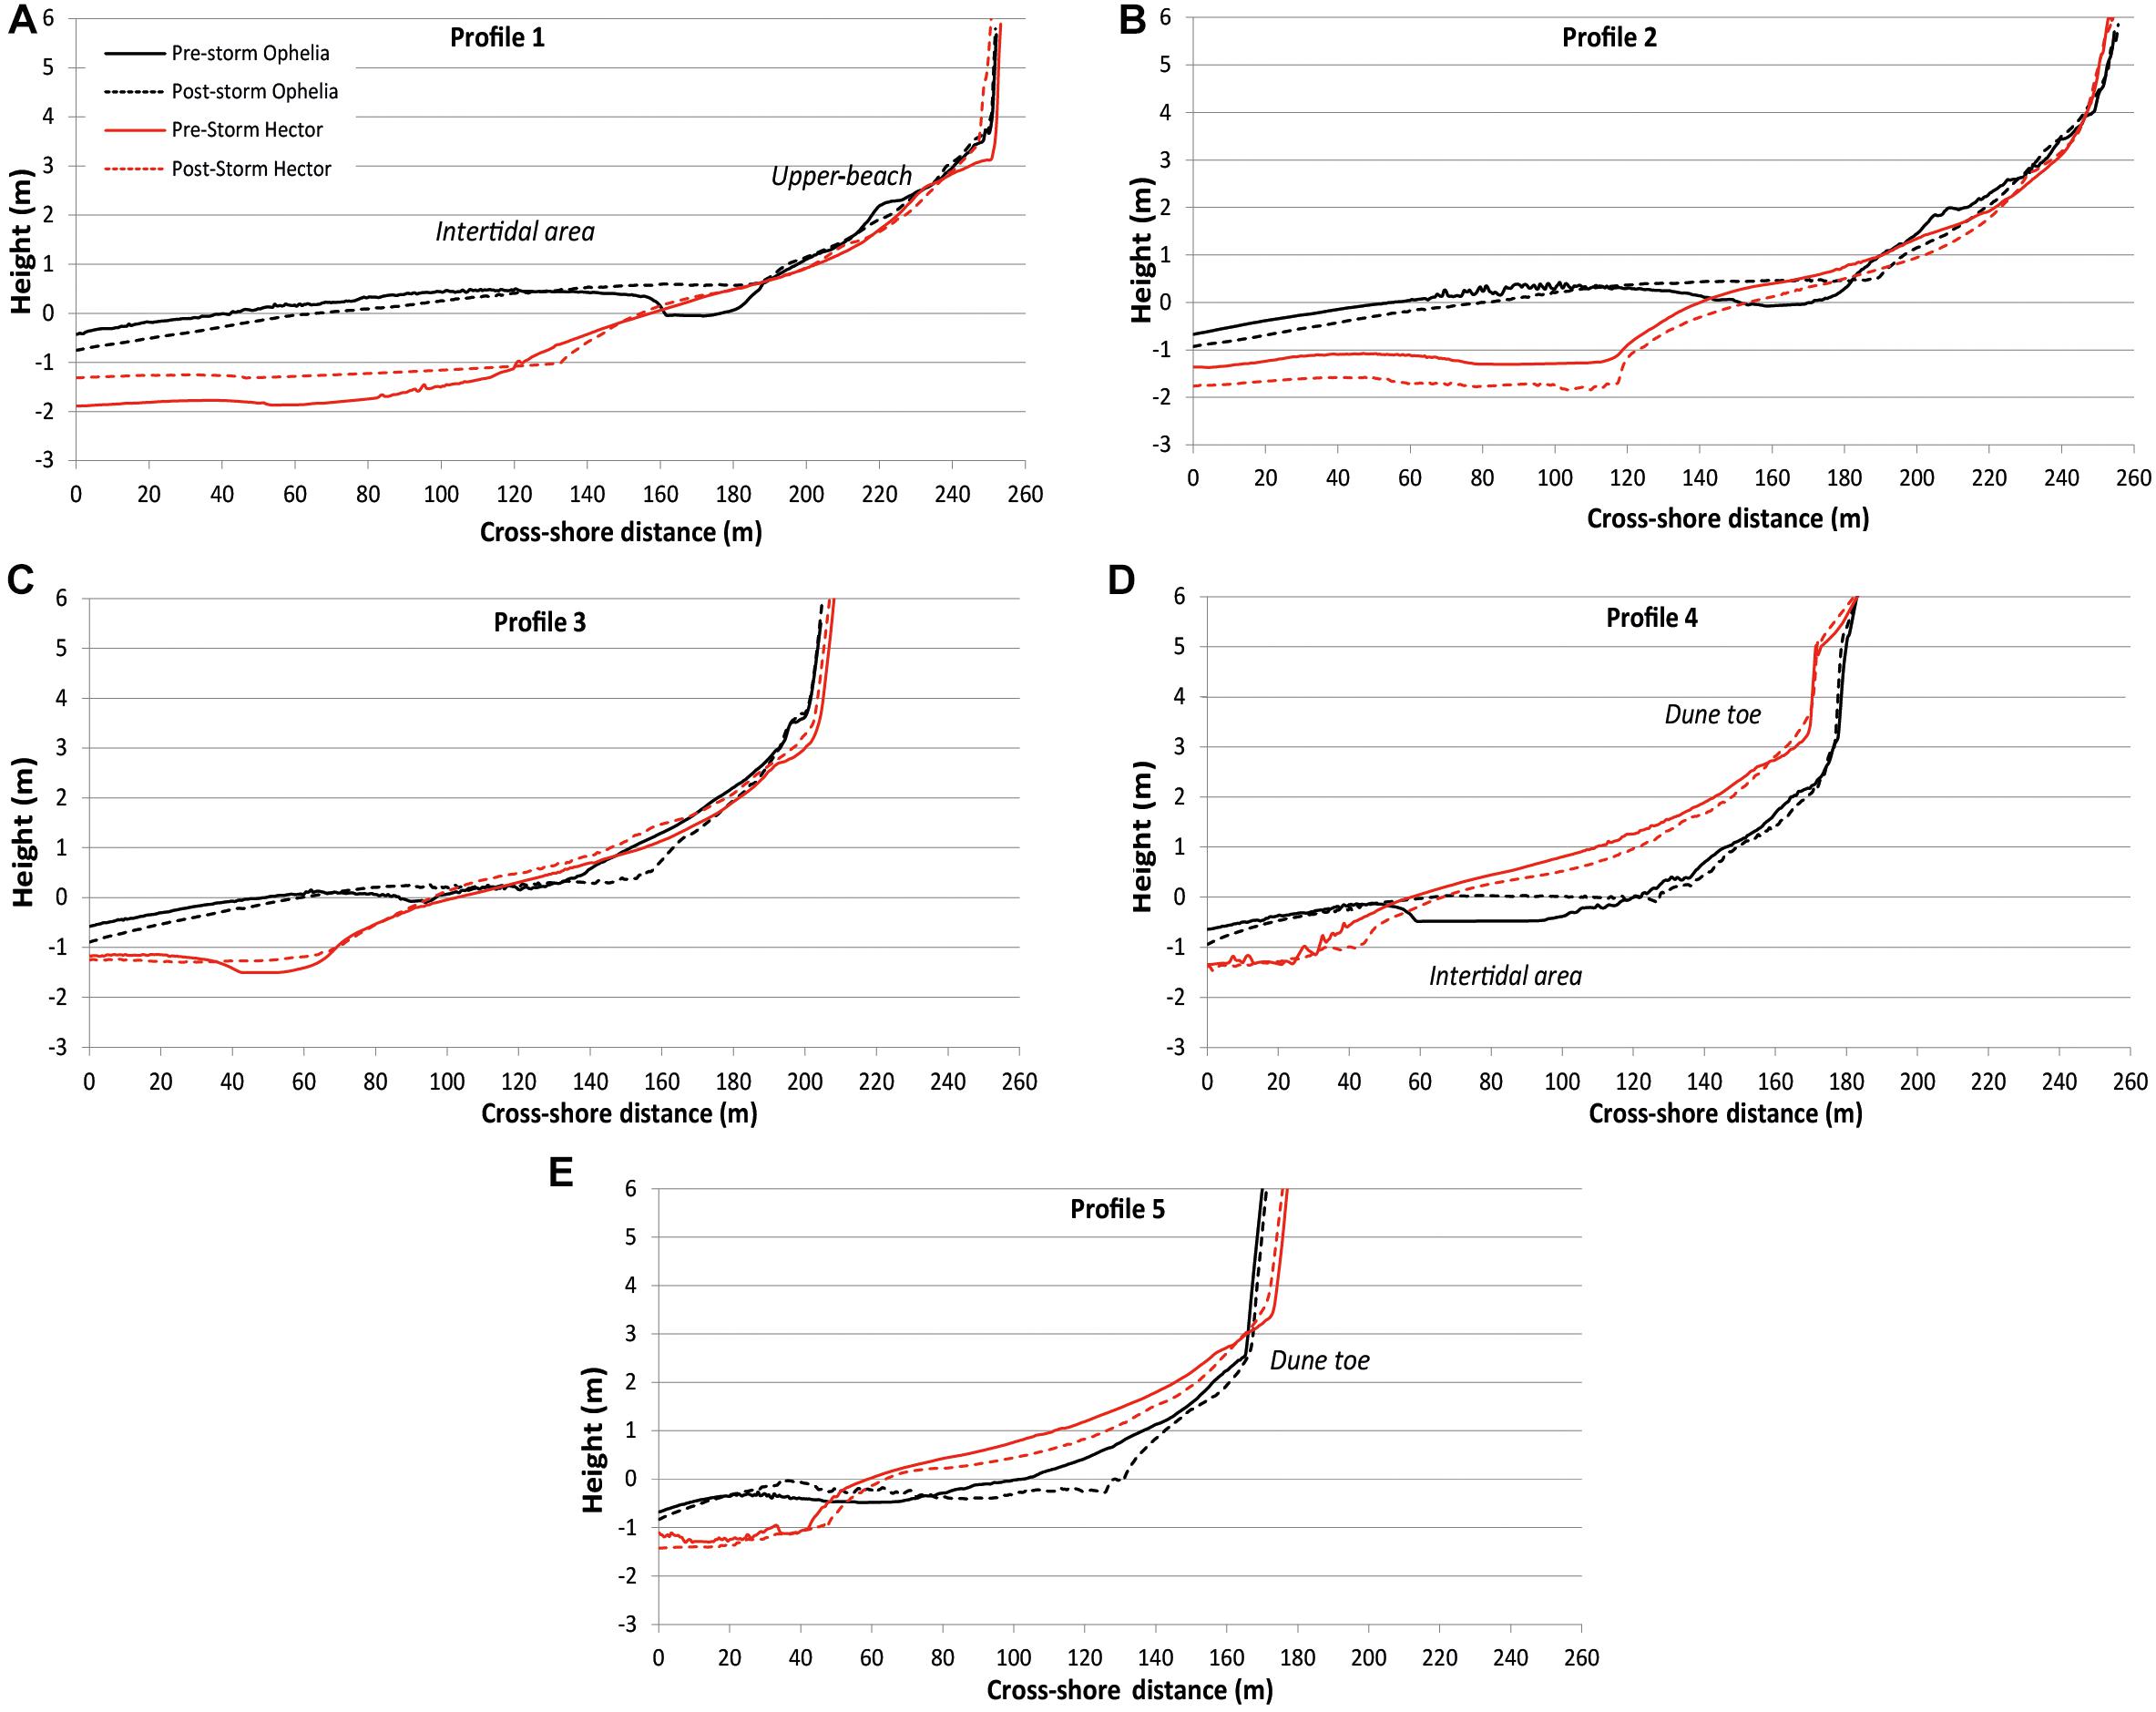
Figure 8. Diagrams (A–E) correspond to five cross-shore profiles used to compare topographic changes (see Figure 1B). Pre-Storm Ophelia is represented by the black line and post-Storm with a black dashed line. Red line corresponds to pre-Storm Hector and the post-Storms profile is shown with a dashed red line.
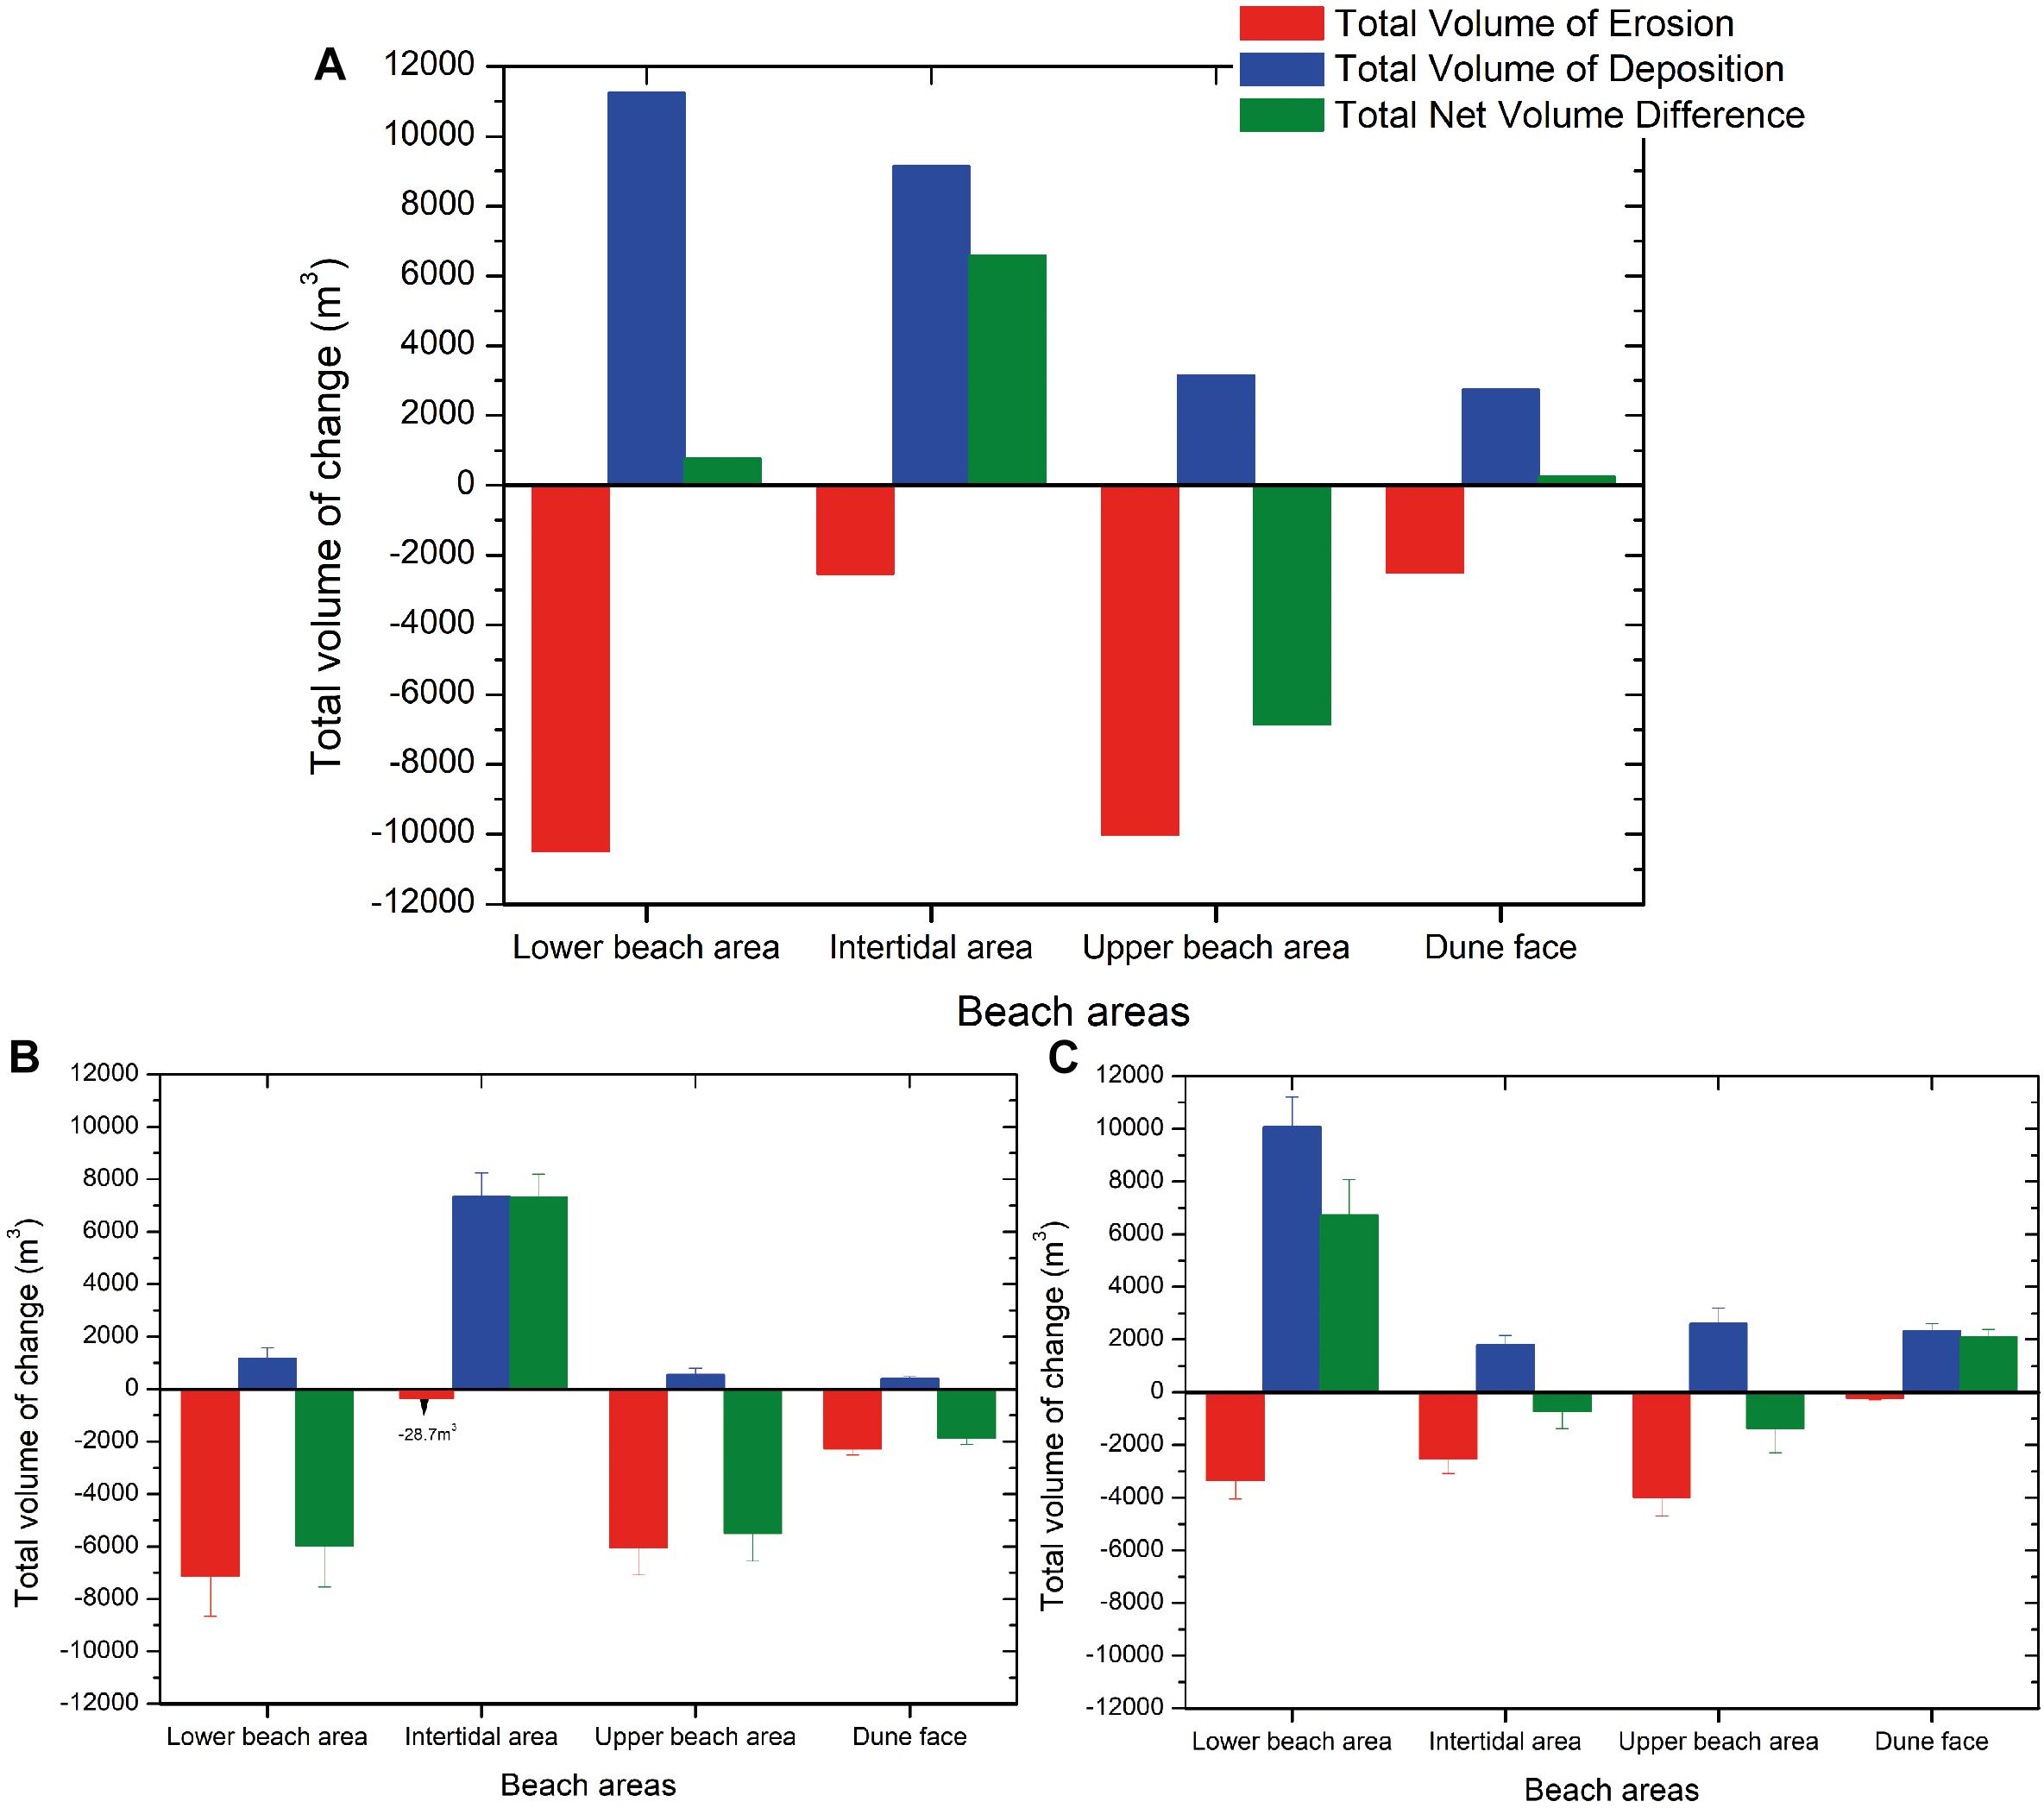
Figure 9. Total volumetric changes (m3) detected from DoD analysis corresponding to the combined effect of both main storms (A). The bars show the budget segregation at defined beach areas for comparative purposes. Graphs (B,C) represent the volumetric changes induced by Storm Ophelia (from Guisado-Pintado and Jackson, 2018) and (C) Storm Hector respectively with errors bars.
For Storm Hector, the spatial topographic changes detected in the DoD analysis suggest that a northern lobe of sand was stripped and relocated to the middle-north of the study area (Figure 7B), whereas southern profiles underwent erosion (Figures 8D,E). A general lowering of the southern area (≈−0.20 m of elevation change) and across all zones is found (with a net loss of −7,400 m3, Figure 9C) and 97% of area experiencing erosion. Further north (P1-P2), the blue colour scale indicate areas of deposition (gains) which dominates 86.5% of the northern part of the study site, with a total volume of deposition of +14,300 m3. Across this area, changes in elevation reach up to +0.45 m, particularly across P1 as shown in Figure 8A. The area comprising the dunes shows a pattern of the higher portions of dune with erosion (red) suggesting that sediment had slumped to the base of dune (blue) with an exception at P3 (Figure 8C). This result is in line with previous results that showed that a maximum TWL of 3 m was above dune toe height in the majority of the coastal stretch (except around P1 and P2), invoking dune trimming during the storm. Finally, it is clear that sediment gains occurred in the lower beach (75% deposition with an average volume of 10,000 m3, Figure 9C) and in the dune area (91% deposition at P1 and P5 as in Figures 8A,E) whereas losses are evident in the upper beach around the southern part of the study site (P3–P5), where it accounts for −3,900 m3 (60% of the zone experienced lowering), and in the intertidal area (Figure 9B), except at P3 which small changes are detected.
Overall morphological changes induced by the seven storms analysed represent a positive net volume difference of 772 m3 in the lower beach area and 6,596 m3 in the intertidal as shown in Figure 9A. Negative net volume differences are found in the upper beach area, where after the balance of the erosion and deposition induced by the storms, represents a net volume of –6,859 m3. Finally, the dune facing area shows the smallest net volume difference accounting for the comparison of the two DoD with a value of +244 m3.
Discussion
Understanding the response of sandy coastlines to high-energy storm events is important for effective coastal management. Many studies have deliberated on their actual impact, defining a whole suite of outcomes from a range of forcing factors available from site to site and event type (Coco et al., 2014; Guisado-Pintado et al., 2014, Loureiro et al., 2014; Backstrom et al., 2015; Burvingt et al., 2017). Storm duration and intensity are now established as key variables in dictating the degree of change that may occur along sandy beach and dune coastlines (Dolan and Davies, 1992; Masselink et al., 2016a,b) but to date, these are largely generalisations with only a limited number of studies comparing storm response and effective combinations of driving factors for beach/dune response (Castelle et al., 2015; Phillips et al., 2017, Guisado-Pintado and Jackson, 2018; Splinter et al., 2018). The examination of antecedent surface changes and the definition of storm thresholds is extremely relevant to anticipate subsequent responses (Gervais et al., 2012) as storm buffering and shoreline response are a direct result of intertidal configuration. A paucity of studies on these dynamic systems is caused by the requirement for regular pre- and post-storm environmental monitoring to gather an appropriate range of information required at sufficient spatial and temporal levels. Poor temporal data on beach and dune topography, hydrodynamic and atmospheric variables at most coastal sites means that insufficient time-series’ are available for adequate analysis of process-responses mechanisms driving changes.
Here, using two high-energy storm events, we show that the occurrence of what are deemed automatically as impact storms may not always play out as predicted. We isolated a number of key environmental variables under pre-storm and post-storm periods from both Storm Ophelia (October 2017) and Storm Hector (June 2018) to provide a range of conditions and responses to better examine which parameters may prove more effective at inducing (or not) changes on the sandy intertidal and back-beach areas of a beach/dune site in NW Ireland along a high-energy coastline.
The work highlights the importance of having a set of synchronised environmental variables that, when combined, can have a highly significant impact in driving actual morphological changes on sandy beaches and dunes. The use of two separate and quite different storm events provides a range of forcing parameters to better examine those more effective parameters at play.
Storm Duration
The duration of a storm (effectively the speed of the storm track) largely commands how long the high magnitude event will retain those energy levels at a particular site and thereby enhances the coincidence with high-tide. Storm Ophelia for example, was a rapidly tracking event, albeit of very high energy levels, which passed over the site relatively quickly, reducing its impact compared to Storm Hector which pushed its energy into a more temporally concentrated period to create more sustained conditions. Storms that are ‘held’ in place longer will naturally coincide with the regular high tide level cycles at sites and therefore impact, particularly dune toe erosion from wave run-up processes, will be magnified (e.g., Cooper et al., 2004). This ‘held’ erosive phase unfolded during Storm Hector, where we saw much more dune toe erosion than with Storm Ophelia (see Figure 7). The Storm Dune Trimming index (SDT) value for Storm Hector for example, was over four times greater than during Storm Ophelia, indicating that the storm was coincident with high tide levels (Figure 6D). Similarly, Storm Hector had a Storm Severity Index (SSI) over three times that of Storm Ophelia (Table 3) which suggests that overall, this induced a more severe morphological impact on the beach/dune which is in line with Figure 7B, where substantial changes in topography are more evident. In this sense, the proposed proxy seems to represent quite well the potential dune trimming from a storm event. Furthermore, storm events that occurred before Storm Ophelia (i.e., S1 and S2) showed high values of SSI, SIP and STD, suggesting that some of the intertidal changes observed in the post-storm survey could be associated with the passages of these two high-energy events as suggested by Guisado-Pintado and Jackson (2018).
Sediment and Spatial Surface Changes
The Storm Impact Potential (SIP) of Storm Hector was 1.67 times that of Storm Ophelia’s suggesting a much more effective sediment movement and displacement of intertidal and supratidal beach sand under Storm Hector conditions. This again is likely due to Storm Hector being effectively held over the site longer and forming a more effective direction (onshore winds with W to SW orientation) than Storm Ophelia, which gave time for waves to modify topography.
Comparison of pre- and post-Storms Ophelia and Hector surface topographies and their cross-shore profiles, the two major storms (Figures 7, 8), show localised displacement patterns that illustrate interesting responses of the beach surface. This finding indicates where waves have preferentially stripped and deposited sand as result of forcing in pre-storm and during storm conditions. For Storm Ophelia, the upper and lower sections of the beach show strong erosional patterns, with a central band of deposition running along North to South as previously discussed by Guisado-Pintado and Jackson (2018). For Storm Hector, sediment has been removed primarily from the northern and southern sections (upper and lower beach as seen in P2, P4 and P5) and then relocated further to the middle of the beach (around P3), depositing and building up the beach surface local to the erosion (Figures 7B, 8C). Further erosional lowering of the intertidal beach is then evident, again in the southern sections of the site (Figures 8D,E). Storm Hector’s ‘held’ position may have allowed more focussing of wave energy with a more onshore component of the storm compared to Storm Ophelia given that storm duration was coincident with onshore winds that were highly synchronised with high tide levels at the site. This resulted in a significant change on the front dunes, undergoing sediment loss due to dune toe trimming and resultant collapse that can be seen as depositional areas (91% of deposition) in the DoD (Figures 7B, 9C). In the case of Storm Ophelia, cross-shore sediment transport processes seem to be responsible for sediment lost in the upper beach and in the intertidal channel whereas morphological changes observed along the dune face are indicative of alongshore processes and exchanges. This finding shows that alongshore dune retreat is heterogeneous and driven by particular dune morphology present, antecedent beach volumes and likely nearshore bathymetric configurations.
Further, the observed vertical dune face differences in P4 (Figure 8D) between Storm Ophelia and Storm Hector seems to be the result of large-scale slumping and sediment cascading down the front dune face. Sediment is then re-worked and trimmed vertically to create the new profile found around the time of the Storm Hector event. In Profile 5 (Figure 8E), the lateral retreat of the dune face is due to wave erosion of the dune toe and sediment being moved offshore onto the back beach profile (vertical accretion pattern compared to Storm Ophelia cross-shore profiles). However, the changes found in the same profile, for instance the offset of P5, is likely the result of all intervening (smaller) storm and lower energy events occurring in the time period between the field campaigns (September 2017 to June 2018) and not just the product of the two storms, particularly Hector.
Differences in the alongshore response to high-energy events have been widely discussed. Several authors have argued that this range of responses can play out at different scales, from meters up to 1 km, depending on a combination of physical and dynamic variables (Harley et al., 2009, Gervais et al., 2012; Haerens et al., 2012; Houser, 2013; Loureiro et al., 2014; Splinter et al., 2018). A myriad of physical static factors such as coastline orientation and exposure to predominant wave direction, existence of emerged landforms (capes and rocky headlands), submerged morphological features (nearshore bars), underlying geological control (Jackson et al., 2005; Jackson and Cooper, 2009) as well as antecedent morphology conditions (e.g., beach slope, intertidal channels), and dynamic environmental variables such as wave height and tidal levels, wind speed, direction and duration and the synchronicity of all of them can lessen or enhance actual beach response. In terms of quantification of areal and volumetric changes (Figure 9), a noticeable variability alongshore (Figure 7) and in the cross-shore (Figure 8) exists. In Storms Ophelia and Hector, post-storm topography, an alongshore variability pattern is evident whereas the spatial configuration of sediment exchanges and actual distribution are dissimilar. This result suggests the important role of environmental variables (particularly wave energy and run up) not only in the generation of morphological changes but in the reorganising of sediment into different available spaces (Coco et al., 2014) along and across the beach/dune system. This is particularly the case for pre-Storm Hector intertidal beach configuration where summer conditions may have accentuated morphology by the presence of nearshore bars (qualitative TLC imagery reinforces the presence of bars).
Pre-event “Storms” and Adjustment of Antecedent Topography
Pre-storm events (S1-S2 for Storm Ophelia) may also have played a very important role in sculpting the intertidal topography so they cannot be ignored in the analysis. As a result, their cumulative effect may have added significantly to the actual Storm Ophelia event. Two of the three pre-Ophelia events have significantly higher SSI and SIPs and resulting SDTs than Storm Ophelia, sometimes by a huge margin. In addition, two of these events coincided with high tide and thus TWLs reached were above mean dune toe heights (Figures 5C,D and Table 2), particularly along the southern part of the site. Likewise, the two preceding storms of Storm Hector were (combined) at or exceeding the values of its SSI and SIP, albeit resulting in half of the SDT of the Storm Hector event itself, potentially due to neither of them accounting for TWL above the mean dune toe height or neither of them lasted beyond a high tide cycle whereas Storm Hector did (Figure 6D and Table 2). This highlights the importance of any pre-events that help adjust the antecedent surface beach conditions and possibly dictating future beach response, depending on pre-established surface heterogeneity.
It must also be recognised that any post-storm recovery of the intertidal and dune toe area may restore the beach topography into somewhat different configurations than its previous form and therefore subsequent hydrodynamics may undergo a different set of behavioural patterns than that of previous events.
Conclusion
Using two, quite different high-energy storm events, a range of conditions and responses has enabled examination of the relative importance of forcing factors on shoreline change dynamics on sandy beach and dune systems. In order to fully assess beach response several key parameters, deemed significant in driving coastal changes, including storm duration and orientation, storm track line speed, local wave height and tidal water levels were isolated and analysed. Field observations and modelling results show that synchronicity of variables is crucial in driving the effectiveness of those storm-induced changes along sandy, dune-fringed coastlines.
Antecedent intertidal beach configuration, as well as pre-storm clustering events, appears to play important roles in dictating coastal response. Using a Storm Severity Index (SSI) and Storm Impact Potential (SIP) to characterise what the site was subjected to, does not necessarily always result in actual dune retreat, with field observations showing that effective storm dune trimming might not materialise if other factors such as high tide and storm duration are not synchronised. However, the new proxy Storm Dune Trimming index resulted in an accurate proxy for potential and effective wave run-up and subsequent dune trimming, as qualitatively demonstrated by time-lapse camera images collected during the storms.
The study shows that for a more complete understanding of coastal response we need to have a myriad of forcing and response data captured over sufficient time periods, before, during and after high-energy events. Despite having an intensively monitored site such as in this study, understanding detailed relationships between forcing dynamics and actual coastal response is fraught with difficulties, with various feedbacks active in the system, which ultimately complicates the final storm-response of the beach/dune zone. Even with very high-energy events such as Storm Ophelia, anticipated to cause significant coastal impact, a much smaller event such as Storm Hector proved to be much more effective at causing morphological (SIP and SDT) change due to having better synchronicity of forcing factors.
Ultimately, the study confirms that having higher frequency monitoring at sites goes some way toward bridging the gaps in our understanding of coastal response to storm activity. This will help improve how such systems need to be managed in the future. The coastal-dune response observed in this research provides regional and local coastal managers with an estimation of the degree of impact that can be expected with the passage of these types of high-energy storms and should inform coastal risk actions and plans along sandy, dune-fringed coastlines.
Data Availability
The datasets generated for this study are available on request to the corresponding author.
Author Contributions
EG-P and DJ designed the experiments and contributed meaningfully to the manuscript writing. EG-P was in charge of data analysis and results description, and production of figures. DJ carried out the fieldwork as well as significantly contributed to the results, analysis, and discussion.
Funding
This work is a contribution to the Natural Environment Research Council grant NE/F019483/1 and to the UNESCO IGCP Project 639 “Sea Level Change from Minutes to Millennia.”
Conflict of Interest Statement
The authors declare that the research was conducted in the absence of any commercial or financial relationships that could be construed as a potential conflict of interest.
Acknowledgments
We wish to thank the Irish Marine Institute for providing access to hydrodynamic data (measured water levels and modelled parameters including significant wave height, mean wave direction and mean wave period) for the study site location. We would also like to acknowledge the Met Éireann (The Irish Meteorological Service) for the meteorological data at the Malin Head station. Thanks are also extended to David Rogers for his invaluable help in fieldwork and in the post-processing of topographic field data and to the Ulster University for supporting the research and providing the fieldwork equipment. We also thank the two reviewers whose suggestions and comments helped to improve the manuscript enormously.
Footnotes
References
Backstrom, J., Jackson, D. W. T., Cooper, J. A. G., and Loureiro, C. (2015). Contrasting geomorphological storm response from two adjacent shorefaces. Earth Surf. Process. Landf. 40, 2112–2120. doi: 10.1002/esp.3788
Booij, N., Ris, R. C., and Holthuijsen, L. H. (1999). A third-generation wave model for coastal regions. Model description and validation. J. Geophys. Res. 104, 7649–7666. doi: 10.1029/98jc02622
Burningham, H., and Cooper, J. A. G. (2004). “Morphology and historical evolution of north-east Atlantic coastal deposits: the west Donegal estuaries, north-west Ireland,” in Proceedings of the STRAEE Workshop (WINTER 2004), Vol. 41. (Ferrara), 148–159.
Burvingt, O., Masselink, G., Russell, P., and Scott, T. (2017). Classification of beach response to extreme storms. Geomorphology 295, 722–737. doi: 10.1016/j.geomorph.2017.07.022
Carter, R. W. G., and Stone, G. W. (1989). Mechanisms associated with the erosion of sand dune cliffs, Magilligan, Northern Ireland. Earth Surf. Process. Landf. 14, 1–10. doi: 10.1002/esp.3290140102
Castelle, B., Bujan, S., Ferreira, S., and Dodet, G. (2017). Foredune morphological changes and beach recovery from the extreme 2013/2014 winter at a high-energy sandy coast. Mar. Geol. 385, 41–55. doi: 10.1016/j.margeo.2016.12.006
Castelle, B., Marieu, V., Bujan, S., Splinter, K. D., Robinet, A., Sénéchal, N., et al. (2015). Impact of the winter 2013–2014 series of severe Western Europe storms on a double-barred sandy coast. Beach and dune erosion and megacusp embayments. Geomorphology 238, 135–148. doi: 10.1016/j.geomorph.2015.03.006
Coco, G., Senechal, N., Rejas, A., Bryan, K. R., Capo, S., Parisot, J. P., et al. (2014). Beach response to a sequence of extreme storms. Geomorphology 204, 493–501. doi: 10.1016/j.geomorph.2013.08.028
Cooper, J. A. G., and Jackson, D. W. T. (2003). “Geomorphological and dynamic constraints on mesoscale coastal response to storms, Western Ireland,” in Proceedings 6th International Symposium on Coastal Engineering and Science of Coastal Sediment Processes, (Florida: American Society of Civil Engineers), 1–13.
Cooper, J. A. G., and Orford, J. D. (1998). Hurricanes as agents of mesoscale coastal change in western Britain and Ireland. J. Coast. Res. 26, 123–128.
Cooper, J. A. G., Jackson, D. W. T., Navas, F., McKenna, J., and Malvarez, G. (2004). Identifying storm impacts on an embayed, high-energy coastline: examples from western Ireland. Mar. Geol. 210, 261–280. doi: 10.1016/j.margeo.2004.05.012
Cooper, J. A. G., McKenna, J., Jackson, D. W. T., and O’Connor, M. (2007). Mesoscale coastal behavior related to morphological self-adjustment. Geology 35, 187–190.
Costas, S., Alejo, I., Vila-Concejo, A., and Nombela, M. A. (2005). Persistence of storm-induced morphology on a modal low-energy beach: a case study from NW-Iberian Peninsula. Mar. Geol. 224, 43–56. doi: 10.1016/j.margeo.2005.08.003
Dawson, A., Elliott, L., Noone, S., Hickey, K., Holt, T., Wadhams, P., et al. (2004). Historical storminess and climate ‘see-saws’ in the North Atlantic region. Mar. Geol. 210, 247–259. doi: 10.1016/j.margeo.2004.05.011
Dawson, A. G., Hickey, K., Holt, T., Elliott, L., Dawson, S., Foster, I. D. L., et al. (2002). Complex North Atlantic Oscillation (NAO) index signal of historic North Atlantic storm-track changes. Holocene 12, 363–369. doi: 10.1191/0959683602hl552rr
Devoy, R. J. N. (2008). Coastal vulnerability and the implications of sea-level rise for Ireland. J. Coast. Res. 24, 325–341. doi: 10.2112/07a-0007.1
Dissanayake, P., Brown, J., Wisse, P., and Karunarathna, H. (2015). Effects of storm clustering on beach/dune evolution. Mar. Geol. 370, 63–75. doi: 10.1016/j.margeo.2015.10.010
Dodet, G., Bertin, X., and Taborda, R. (2010). Wave climate variability in the North-East Atlantic Ocean over the last six decades. Ocean Model. 31, 120–131. doi: 10.1016/j.ocemod.2009.10.010
Dolan, R., and Davies, R. E. (1992). An intensity scale for Atlantic Coast Northeast Storms. J. Coast. Res. 8, 840–853.
Erdmann, W., Kelletat, D., and Kuckuck, M. (2017). Boulder ridges and washover features in Galway Bay, Western Ireland. J. Coast. Res. 33, 997–1021. doi: 10.2112/jcoastres-d-16-00184.1
Ferreira, Ó (2006). The role of storm groups in the erosion of sandy coasts. Earth Surf. Process. Landf. 31, 1058–1060. doi: 10.1002/esp.1378
Feser, F., Barcikowska, M., Krueger, O., Schenk, F., Weisse, R., and Xia, L. (2015). Storminess over the North Atlantic and northwestern Europe—A review. Quart. J. R. Meteorol. Soc. 141, 350–382. doi: 10.1002/qj.2364
Gervais, M., Balouin, Y., and Belon, R. (2012). morphological response and coastal dynamics associated with major storm events along the gulf of lions coastline. France. Geomorphology 14, 69–80. doi: 10.1016/j.geomorph.2011.07.035
Guisado-Pintado, E., Jackson, D. W. T., Cooper, J. A. G., and O’Connor, M. (2017). Storm impacts on a high energy sandy beach system, northwest Ireland: short (event) to long term (decadal) behaviour. Geophys. Res. Abstr. 19:10267.
Guisado-Pintado, E., and Jackson, D. W. T. (2018). Multi-scale variability of storm Ophelia 2017: the importance of synchronised environmental variables in coastal impact. Sci. Total Environ. 630, 287–301. doi: 10.1016/j.scitotenv.2018.02.188
Guisado-Pintado, E., Jackson, D. W. T., and Rogers, D. (2019). 3D mapping efficacy of a drone and terrestrial laser scanner over a temperate beach-dune zone. Geomorphology 328, 157–172. doi: 10.1016/j.geomorph.2018.12.013
Guisado-Pintado, E., Malvárez, G., Navas, F., and Carrero, R. (2014). “Spatial distribution of storm wave energy dissipation for the assessment of beach morphodynamics,” in Proceedings of the 13th International Coastal Symposium, Durban, 259–265. doi: 10.2112/si70-044.1
Haerens, P., Bolle, A., Trouw, K., and Houthuys, R. (2012). Definition of storm thresholds for significant morphological change of the sandy beaches along the Belgian coastline. Geomorphology 143-144(Suppl. C), 104–117. doi: 10.1016/j.geomorph.2011.09.015
Harley, M. D., Turner, I. L., Short, A. D., and Ranasinghe, R. (2009). “An empirical model of beach response to storms - Se Australia,” in Proceedings of the 19th Conference Coasts and Ports 2009 in a Dynamic Environment, Engineers, Wellington.
Hayden, B. (1981). Secular variation in atlantic coast extratropical cyclones. Mon. Weather Rev. 109, 159–167. doi: 10.1175/1520-0493(1981)109<0159:sviace>2.0.co;2
Hickey, K. R., and Connolly-Johnston, C. (2012). “The impact of hurricane debbie (1961) and Hurricane Charley (1986) on Ireland,” in Advances in Hurricane Research - Modelling, Meteorology, Preparedness and Impacts, ed. K. Hickey (Rijeka: InTech).
Houser, C. (2013). Alongshore variation in the morphology of coastal dunes: Implications for storm response. Geomorphology 199, 48–61. doi: 10.1016/j.geomorph.2012.10.035
Hurrell, J. W. (1995). Decadal trends in the north atlantic oscillation: regional temperatures and precipitation. Science 269, 676–679. doi: 10.1126/science.269.5224.676
Jackson, D. W. T., and Cooper, J. A. G. (2009). Geological control on beach form: accommodation space and contemporary dynamics. J. Coast. Res. 56, 69–72.
Jackson, D. W. T., Cooper, J. A. G., and del Rio, L. (2005). Geological control of beach morphodynamic state. Mar. Geol. 216, 297–314. doi: 10.1016/j.margeo.2005.02.021
Jackson, D. W. T., Cooper, J. A. G., O’Connor, M., Guisado-Pintado, E., Loureiro, C., and Anfuso, G. (2016). Field measurements of intertidal bar evolution on a high-energy beach system. Earth Surf. Process. Landf. 41, 1107–1114. doi: 10.1002/esp.3920
Kandrot, S., Farrell, E., and Devoy, R. (2016). The morphological response of foredunes at a breached barrier system to winter 2013/2014 storms on the southwest coast of Ireland. Earth Surf. Process. Landf. 41, 2123–2136. doi: 10.1002/esp.4003
Karunarathna, H., Pender, D., Ranasinghe, R., Short, A. D., and Reeve, D. E. (2014). The effects of storm clustering on beach profile variability. Mar. Geol. 348, 103–112. doi: 10.1016/j.margeo.2013.12.007
Lamb, H., and Frydendahl, K. (1991). Historic Storms of the North Sea, British Isles and Northwest Europe. Cambridge: Cambridge University Press.
Lambert, S. J. (1996). Intense extratropical northern hemisphere winter cyclone events: 1899–1991. J. Geophys. Res. 101, 21319–21325. doi: 10.1029/96jd01653
Loureiro, C., and Cooper, J. A. G. (2019). Temporal variability in winter wave conditions and storminess in the northwest of Ireland. Ir. Geogr. 51, 1–16. doi: 10.2014/igj.v51i2.1369
Loureiro, C., Ferreira, O., and Cooper, J. A. G. (2014). Non-uniformity of storm impacts on three high-energy embayed beaches. J. Coast. Res. 70, 326–331. doi: 10.2112/si70-055.1
Lozano, I., Devoy, R. J. N., May, W., and Andersen, U. (2004). Storminess and vulnerability along the Atlantic coastlines of Europe: analysis of storm records and of a greenhouse gases induced climate scenario. Mar. Geol. 210, 205–225. doi: 10.1016/j.margeo.2004.05.026
Masselink, G., Castelle, B., Scott, T., Dodet, G., Suanez, S., Jackson, D. W. T., et al. (2016a). Extreme wave activity during 2013/2014 winter and morphological impacts along the Atlantic coast of Europe. Geophys. Res. Lett. 43, 2135–2143. doi: 10.1002/2015GL067492
Masselink, G., Scott, T., Poate, T., Russell, P., Davidson, M., and Conley, D. (2016b). The extreme 2013/2014 winter storms: hydrodynamic forcing and coastal response along the southwest coast of England. Earth Surf. Process. Landf. 41, 378–391. doi: 10.1002/esp.3836
Met EIREANN (2017). Observational Records: Provisional Quick Observational Facts of Land and Marine Observations on STORM OPHELIA, 2017. Available at: https://www.met.ie/news/display.asp?ID=463 (accessed November 20, 2018).
NOAA (2017). National Hurricane Center: Post-Tropical Cyclone Ophelia Discussion Number 28 NWS. Silver Spring, MA: NOAA.
O’Connor, M. C., Cooper, J. A. G., and Jackson, D. W. T. (2011). Decadal behavior of tidal inlet–associated beach systems, Northwest Ireland, in relation to climate forcing. J. Sediment. Res. 81, 38–51. doi: 10.2110/jsr.2011.3
Phillips, M. S., Harley, M. D., Turner, I. L., Splinter, K. D., and Cox, R. J. (2017). Shoreline recovery on wave-dominated sandy coastlines: the role of sandbar morphodynamics and nearshore wave parameters. Mar. Geol. 385, 146–159. doi: 10.1016/j.margeo.2017.01.005
Rangel-Buitrago, N., and Anfuso, G. (2011). An application of dolan and davis (1992) classification to coastal storms in SW spanish littoral. J. Coast. Res. 64, 1891–1895.
Ris, R. C., Holthuijsen, L. H., and Booij, N. (1999). A third-generation wave model for coastal regions: 2. Verification. J. Geophys. Res. 104, 7667–7681. doi: 10.1029/1998jc900123
Ruggiero, P., Komar, D., McDougal, W. G., Marra, J. J., and Beach, R. A. (2001). Wave runup, extreme water levels and the erosion of properties backing beaches. J. Coast. Res. 17, 407–419.
Scheffers, A., Kelletat, D., Haslett, S., Scheffers, S., and Browne, T. (2010). Coastal boulder deposits in Galway Bay and the Aran Islands, western Ireland. Zeitschrift for Geomorphologie 54, 247–279. doi: 10.1127/0372-8854/2010/0054s3-0027
Scheffers, A., Scheffers, A., Kelletat, D., and Browne, T. (2009). Wave-emplaced coarse debris and megaclasts in Ireland and Scotland: boulder transport in a high-energy littoral environment. J. Geol. 117, 553–573. doi: 10.1086/600865
Schinke, H. (1993). On the occurrence of deep cyclones over Europe and the North Atlantic in the period 1930-1991. Beitr. Phys. Atmos. 66, 223–237.
Schmith, T., Kaas, E., and Li, T. S. (1998). Northeast Atlantic winter storminess 1875–1995 re-analysed. Clim. Dyn. 14, 529–536. doi: 10.1007/s003820050239
Shields, L., and Fitzgerald, D. (1989). The ‘Night of the Big Wind’ in Ireland, 6–7 January 1839. Ir. Geogr. 22, 31–43. doi: 10.1080/00750778909478784
Splinter, K. D., Kearney, E. T., and Turner, I. L. (2018). Drivers of alongshore variable dune erosion during a storm event: observations and modelling. Coast. Eng. 131, 31–41. doi: 10.1016/j.coastaleng.2017.10.011
Stockdon, H. F., Holman, R. A., Howd, A., and Sallenger, A. H. Jr. (2006). Empirical parameterization of setup, swash, and runup. Coast. Eng. 53, 573–588. doi: 10.1016/j.coastaleng.2005.12.005
United Kingdom Meteorological Office (2017). Ex-Hurricane Ophelia Report. Available at: https://www.metoffice.gov.uk/climate/uk/interesting/2017-ophelia (accessed November 20, 2018).
Wheaton, J. M., Brasington, J., Darby, S. E., and Sear, D. A. (2010). Accounting for uncertainty in DEMs from repeat topographic surveys: improved sediment budgets. Earth Surf. Process. Landf. 35, 136–156.
Wright, L. D., and Short, A. D. (1984). Morphodynamic variability of surf zones and beaches. Mar. Geol. 56, 93–118. doi: 10.1016/0025-3227(84)90008-2
Young, A. P., Guza, R. T., O’Reilly, W. C., Burvingt, O., and Flick, R. E. (2016). Observations of coastal cliff base waves, sand levels, and cliff top shaking. Earth Surf. Process. Landf. 41, 1564–1573. doi: 10.1002/esp.3928
Keywords: Five Finger Strand, dune scarp, synchronicity, forcing factors, run up, storm impact, erosion
Citation: Guisado-Pintado E and Jackson DWT (2019) Coastal Impact From High-Energy Events and the Importance of Concurrent Forcing Parameters: The Cases of Storm Ophelia (2017) and Storm Hector (2018) in NW Ireland. Front. Earth Sci. 7:190. doi: 10.3389/feart.2019.00190
Received: 15 February 2019; Accepted: 05 July 2019;
Published: 06 August 2019.
Edited by:
Christina Robyn Magill, Macquarie University, AustraliaReviewed by:
Linlin Li, National University of Singapore, SingaporePushpa Dissanayake, University of Kiel, Germany
Copyright © 2019 Guisado-Pintado and Jackson. This is an open-access article distributed under the terms of the Creative Commons Attribution License (CC BY). The use, distribution or reproduction in other forums is permitted, provided the original author(s) and the copyright owner(s) are credited and that the original publication in this journal is cited, in accordance with accepted academic practice. No use, distribution or reproduction is permitted which does not comply with these terms.
*Correspondence: Emilia Guisado-Pintado, ZWd1aXNhZG9AdXMuZXM=