 Dalia Kirschbaum1*
 C. Scott Watson2
 David R. Rounce3
 Dan H. Shugar4
 Jeffrey S. Kargel5
 Umesh K. Haritashya6
 Pukar Amatya1,7
 David Shean8
 Eric R. Anderson9
 Minjeong Jo7,10
- 1Hydrological Sciences Laboratory, NASA Goddard Space Flight Center, Greenbelt, MD, United States
- 2Department of Hydrology & Atmospheric Sciences, University of Arizona, Tucson, AZ, United States
- 3Geophysical Institute, University of Alaska Fairbanks, Fairbanks, AK, United States
- 4Water, Sediment, Hazards, and Earth-Surface Dynamics Lab, Department of Geoscience, University of Calgary, Calgary, AB, Canada
- 5The Planetary Science Institute, Tucson, AZ, United States
- 6Department of Geology, University of Dayton, Dayton, OH, United States
- 7Goddard Earth Sciences Technology and Research, Universities Space Research Association, Columbia, MD, United States
- 8Civil and Environmental Engineering, University of Washington, Seattle, WA, United States
- 9Earth System Science Center, University of Alabama in Huntsville, Huntsville, AL, United States
- 10Biospheric Sciences Laboratory, NASA Goddard Space Flight Center, Greenbelt, MD, United States
Cascading hazard processes refer to a primary trigger such as heavy rainfall, seismic activity, or snow melt, followed by a chain or web of consequences that can cause subsequent hazards influenced by a complex array of preconditions and vulnerabilities. These interact in multiple ways and can have tremendous impacts on populations proximate to or downstream of these initial triggers. High Mountain Asia (HMA) is extremely vulnerable to cascading hazard processes given the tectonic, geomorphologic, and climatic setting of the region, particularly as it relates to glacial lakes. Given the limitations of in situ surveys in steep and often inaccessible terrain, remote sensing data are a valuable resource for better understanding and quantifying these processes. The present work provides a survey of cascading hazard processes impacting HMA and how these can be characterized using remote sensing sources. We discuss how remote sensing products can be used to address these process chains, citing several examples of cascading hazard scenarios across HMA. This work also provides a perspective on the current gaps and challenges, community needs, and view forward toward improved characterization of evolving hazards and risk across HMA.
Introduction
Natural hazard-induced disasters exploit the vulnerabilities in society created by political, historical, and cultural processes (Kelman, 2019). Disasters are sometimes considered as a single process or one homogeneous event. Therefore, much scientific emphasis has been placed on understanding the individual hazards, triggers or preconditions that may result in a single outcome, such as a snow avalanche killing mountaineers, or an earthquake shaking down houses. However, these disasters are frequently non-linear hazard process cascades. The ensemble of preconditioning factors, triggering, and process cascades can entail greater human, infrastructure, or ecosystem exposure and higher risks than when singular isolated processes are considered. The latter point was emphasized by Gill and Malamud (2016), who considered accurate risk assessment to be dependent on consideration of multi-hazards and process cascades. Lacking such consideration, disaster impacts can exceed the expectations of hazard mappers and disaster response planners. We use the definitions of hazard, exposure, vulnerability and risk from Schneiderbauer and Ehrlich (2004) and the U.N. Framework for Disaster Risk Reduction (UNISDR, 2015) where: hazard refers to a physical event or phenomenon that can be “single, sequential or combined in their origin and effects”; exposure is the population, infrastructure or other assets within the geographic region affected by the hazard; and vulnerability is the characteristics of an organization (person, group) to “cope with, resist and recover from the impact of a natural or manmade disaster.” Risk is then defined as Hazard ∗ Exposure ∗ Vulnerability.
A cascading process can be defined as sequences of events (not necessarily sequential) governed by cause and effect relationships. The importance and relevance of cascading process chains in the context of natural and man-made hazards has been defined and examined in several ways. Kappes et al. (2012) summarize the approaches to multi-hazards within the context of risk assessment, emphasizing the challenges and importance of considering amplified risk stemming from cascading processes. Gill and Malamud (2016) emphasize the differences between multi-layer single-hazard approaches and multi-hazard approaches, suggesting that “ignoring interactions between important environmental and anthropogenic processes could distort management priorities, increase vulnerability to other spatially relevant hazards or underestimate disaster risk.” Recently a view and methodology has emerged of more complex weblike systems of natural process causes and effects and impacts on humans, infrastructure, and ecosystems. Pescaroli and Alexander (2016) contest the simplified “toppling dominoes” perspective of cause-effect. They argue that cascades happen non-linearly and include many amplifying and subsidiary events, where the compounding effects of natural hazard processes can be phenomenologically distinct from the cause, and the impacts also can be diverse and far ranging. In this sense, what is commonly termed a process chain is often more of a process web. The key is that one process cascades into one or more other processes, some of which are hazards in their own right and can create multiple disasters within a disaster.
Many recent disasters have contributed to scientific and public understanding of multi-process linkages. For example, the 2011 M9.0 Tohoku earthquake and tsunami propagated and compounded the disaster at the Fukushima Daiichi nuclear reactors, causing broad economic impacts that included hundreds of billions of USD in direct losses and billions (USD) more in losses in supply chain disruptions and continuing agricultural losses (Lekkas et al., 2011; Kazama and Noda, 2012; IAEA, 2015). Complex process cause-and-effect webs are documented within mountain areas, such as the Attabad landslide and damming of the Hunza River in northern Pakistan (Kargel et al., 2010). The dammed lake grew over 5 months and caused deep, cascading social and economic impacts of almost $4 billion USD (Cook and Butz, 2016). This was largely due to a 90% severance of overland trade between China and Pakistan until restoration of the Karakoram Highway 5 years later (Haider, 2012). The disaster also had political (Sökefeld, 2012) and geopolitical (Haider, 2012; Butz and Cook, 2015) impacts on a strategic border.
The potential for such immense losses make it incumbent on the scientific community, policy makers, and those developing Decision Support Systems (DSS) to consider and evaluate physical cascading process chains and webs to better integrate physical models with economic and social models of cascading impacts. A common feature of the examples from Japan and Pakistan is that the process sequences can have compounding interactions that quickly multiply in space and time, resulting in substantial risks to society, infrastructure, and the environment (Cardona et al., 2012). One challenge in characterizing these complex interactions and connecting the processes to community vulnerability and risk is limitations in data availability, particularly in remote regions.
Satellite-based remote sensing offers a valuable and rapidly developing set of tools that can improve hazard detection and mitigation and disaster warning, response, and recovery. This paper highlights the utility of remote sensing data for studies of cascading hazard processes that are observable or informed from the vantage point of space. We present case studies from the HMA region to illustrate how remote sensing data is used to monitor and model elements of these cascading process chains and provide context for future opportunities. We build on previous works (e.g., Kääb et al., 2005) to summarize and reflect on the vast increase in data from new remote sensing missions and the development of platforms that enable rapid analysis to support hazard assessment and disaster response. While much of the current research is focused on understanding specific processes, we show how the processes can connect and outline opportunities and challenges in characterizing the full continuum from hazard to risk in a dynamic and coupled way to support risk-mitigation and disaster response efforts. The ultimate goal of this work is to provide an accessible and applicable reference of remote sensing capabilities that is of relevance to both scientists and in-country decision makers. It is also intended to provide insight into how remote sensing information can help governments advance the Sendai Framework Priorities of understanding disaster risk, strengthening disaster risk governance, and enhancing disaster preparedness (UNISDR, 2015).
Background
Thematic Scope
From a disaster management perspective, hazard assessments that are stove-piped to consider the impacts of a singular hazard can offer some tractable ways to map hazards but tend to miss the broader assessment, such as economic and social disruptions. Even in many “multi-hazard assessments” a set of individually-derived hazard zones are overlain spatially, without considering how each may interact. Moving from understanding the hazard to an accurate characterization of the risk requires quantification of the end-to-end connections, interdependencies, and consequences resulting from a chain of cascading events. This study focuses more on how remote sensing products can inform elements within the chain and provides examples of how the connections between processes can be characterized. This work also provides observations on the existing limitations and gaps in taking a systems approach to incorporate multiple conditioning, triggering, and cascading elements to better represent disaster risk and societal impacts in support of risk reduction strategies. We do not consider in detail the specific impacts of disasters on people and infrastructure; however, those human impacts also commonly occur in cascading chains and webs that are complexly linked to the physical process chains and webs.
Geographic Scope
Our HMA study region extends from the Hindu Kush Mountains in Pakistan and Afghanistan to the eastern Himalaya covering India and Bhutan, and north to Tien Shan, which is also known as the extended Hindu Kush-Himalaya (Bolch et al., 2019) (Figure 1). The region is seismically active, with the Indian Plate subducting beneath the Eurasian Plate, resulting in catastrophic earthquakes such as the April 2015 Gorkha Mw 7.8 event. In the southeast, the climate is defined by heavy rainfall during the summer monsoon, while the western region receives significant rain and snow from winter westerlies. HMA has the largest concentration of glaciers outside of the poles and Alaska and serves as a freshwater reservoir for over a billion people (Immerzeel et al., 2010; Quincey et al., 2018). Global Land Ice Measurements from Space (GLIMS) and the Randolph Glacier Inventory (RGI) v6.0 have identified 95,536 glaciers across HMA (Zhao et al., 2014). As of 2010, these glaciers were accompanied by 7,368 glacial lakes covering an area of 779 km2 (Wang et al., 2013; Zhang et al., 2015). Rapid glacial melting along with other Earth surface processes pose significant downstream hazards such as glacier outburst floods and landslides, which can have major societal impacts. This is particularly important in HMA, since a global study found that Nepal and Bhutan have the greatest socioeconomic consequences from glacier outburst floods (Carrivick and Tweed, 2016). Some common hazards and cascading processes within HMA are outlined in Figure 2.
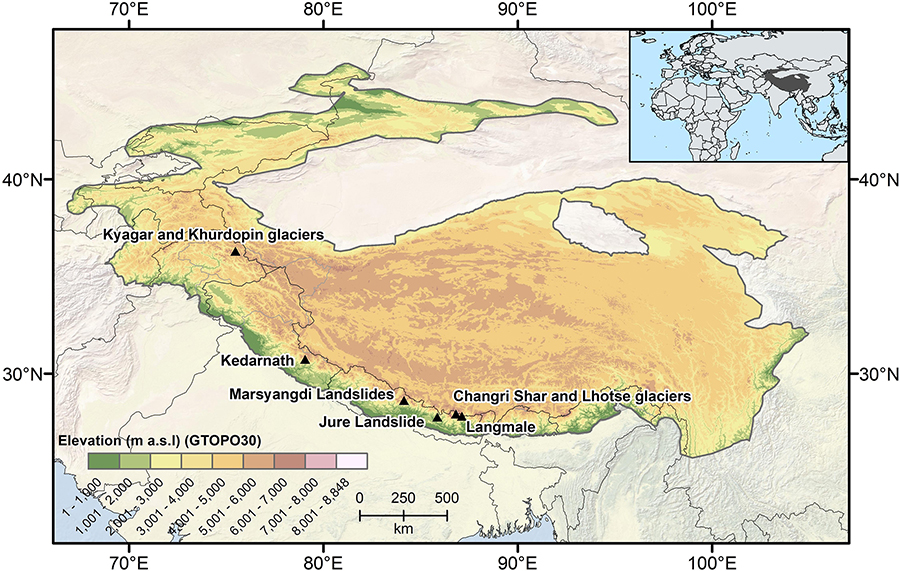
Figure 1. Extent of the HMA Study area (Bolch et al., 2019). The location of case studies from Section “Case Studies of Cascading Hazards Over HMA” are highlighted in the black triangles.
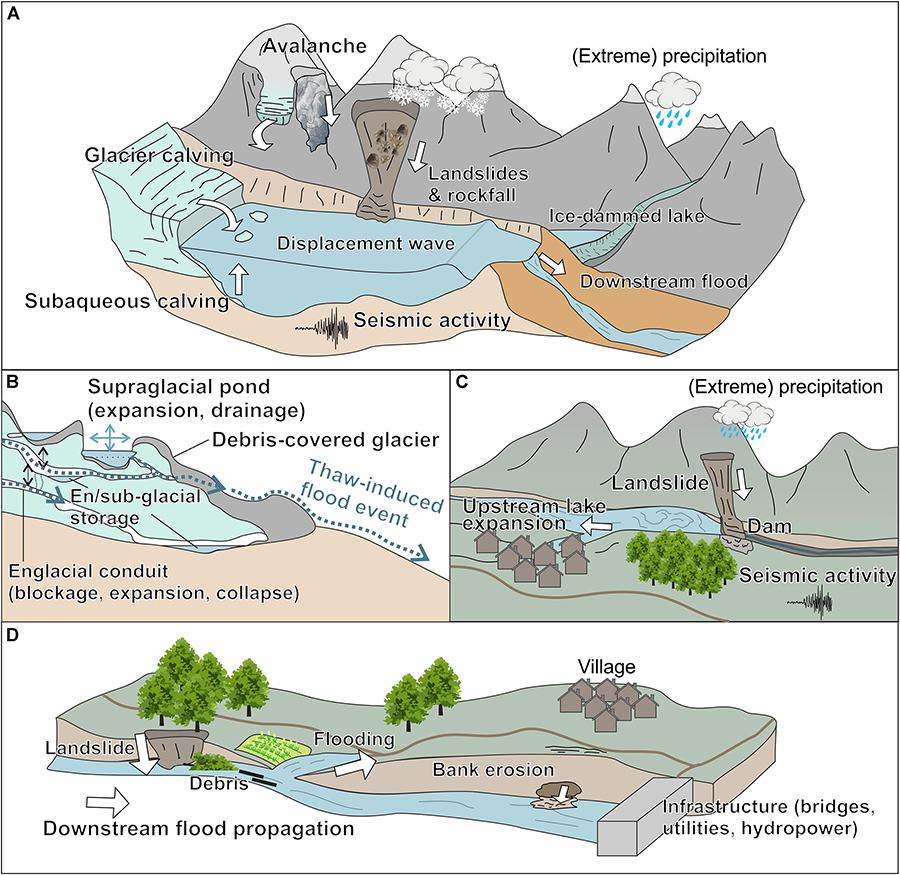
Figure 2. Conceptual diagram highlighting cascading hazard process. (A) Illustrates an outburst flood triggered at proglacial lakes, which can be further exacerbated by additional elements such as landslides, avalanches and rockfalls and avalanches triggered by precipitation or seismic activity. (B) Shows a supra- or englacial-flood event emanating from debris-covered glaciers. (C) Illustrates how a landslide triggered by seismic activity or precipitation can dam a river and cause upstream lake expansion. (D) Shows how a landslide-dammed river could fail catastrophically, causing downstream propagation of flood waters and debris that could cause potential societal impacts to populations and infrastructure.
Remote Sensing Data for Hazards Research and Disaster Response
A dearth of ground data has hampered the timely study of individual hazards and disasters, and limits the collective and systematic regional assessment of hazard processes. This remains a challenge, especially in countries where hydrological, geological, and other needed data are not acquired or classified (GAPHAZ, 2017). Remote sensing allows the development of tools for classifying, routine monitoring and modeling of cascading hazard processes. Spatio-temporal data resolution has been a major limitation in the application of remote sensing to high mountain hazards (Kääb et al., 2015). However, a revolution in mountain hazards assessment has been made possible in recent years by several new developments in Earth remote sensing: global coverage by many civil satellites at high spatial resolution (a few meters down to a few decimeters), reduced repeat times, improved spectral resolution, expanded data availability and lowered cost (much of the data being free), and vastly improved computing capability and resources (e.g., cloud computing, Google Earth Engine) that allow analysis of regional and global datasets as never before. These developments have been key in overcoming issues of widespread cloudiness, providing high temporal and spatial resolution of long continuing process cascades and their conditioning and impacts, processing of thousands of images by scientists around the world, and enabling more relevant applications that are more responsive to DSS and public awareness of events – often in near real-time. Free data access has expanded and enhanced the research community to include scientists who could not otherwise participate in hazards and disaster research, and has enabled global studies.
There are a variety of platforms (public and commercial), observational strategies, and models based on remote sensing data that are valuable for improving our understanding of how to relate elements within the cascading hazard chain (Table 1). A more in-depth description and link to all sources referenced within this article are provided in Supplementary Table S1. Publicly-available moderate resolution optical observations from Landsat, ASTER and Sentinel-2 are valuable for mapping and monitoring changes in glacial lakes, areas of landslide-dammed lakes, or large landslides. Commercial imagery from companies such as DigitalGlobe and Planet, among others, offer submeter to meter-scale imagery and on-demand tasking for mapping these features and collecting data during event response. These images are also being used to generate time series of high-resolution (2–8 m) Digital Elevation Models (DEMs) that can be used to quantify elevation and volume change of landforms and glaciers. Composite mosaics of these high-resolution DEMs are also fundamental for modeling landslides or outburst flood runouts and producing accurate landslide inventories. Active sensors, such as Synthetic Aperture Radar (SAR) from platforms like Sentinel-1 and commercial SAR data from COSMO-SkyMed and TerraSAR-X can highlight surface deformation from earthquakes, hillslope movement for large, slow moving landslides, and has been used to characterize freeze/thaw processes and glacier volumes within the HMA region. Satellite rainfall products such as the Global Precipitation Measurement (GPM) mission can provide near real-time rainfall estimates at 0.1-degree coverage every 30 min. In addition to the remote sensing platforms, models such as Land Data Assimilation Systems (LDAS) and Global Climate Models (GCM) like the GFDL Forecast-oriented Low Ocean Resolution (FLOR) model assimilate remote sensing and in situ observations to provide estimates of water supply, glacier modeling, and forecasted hydrologic states across HMA that are valuable for understanding the preconditioning, initiation and future outlook of cascading hazard processes within this region.
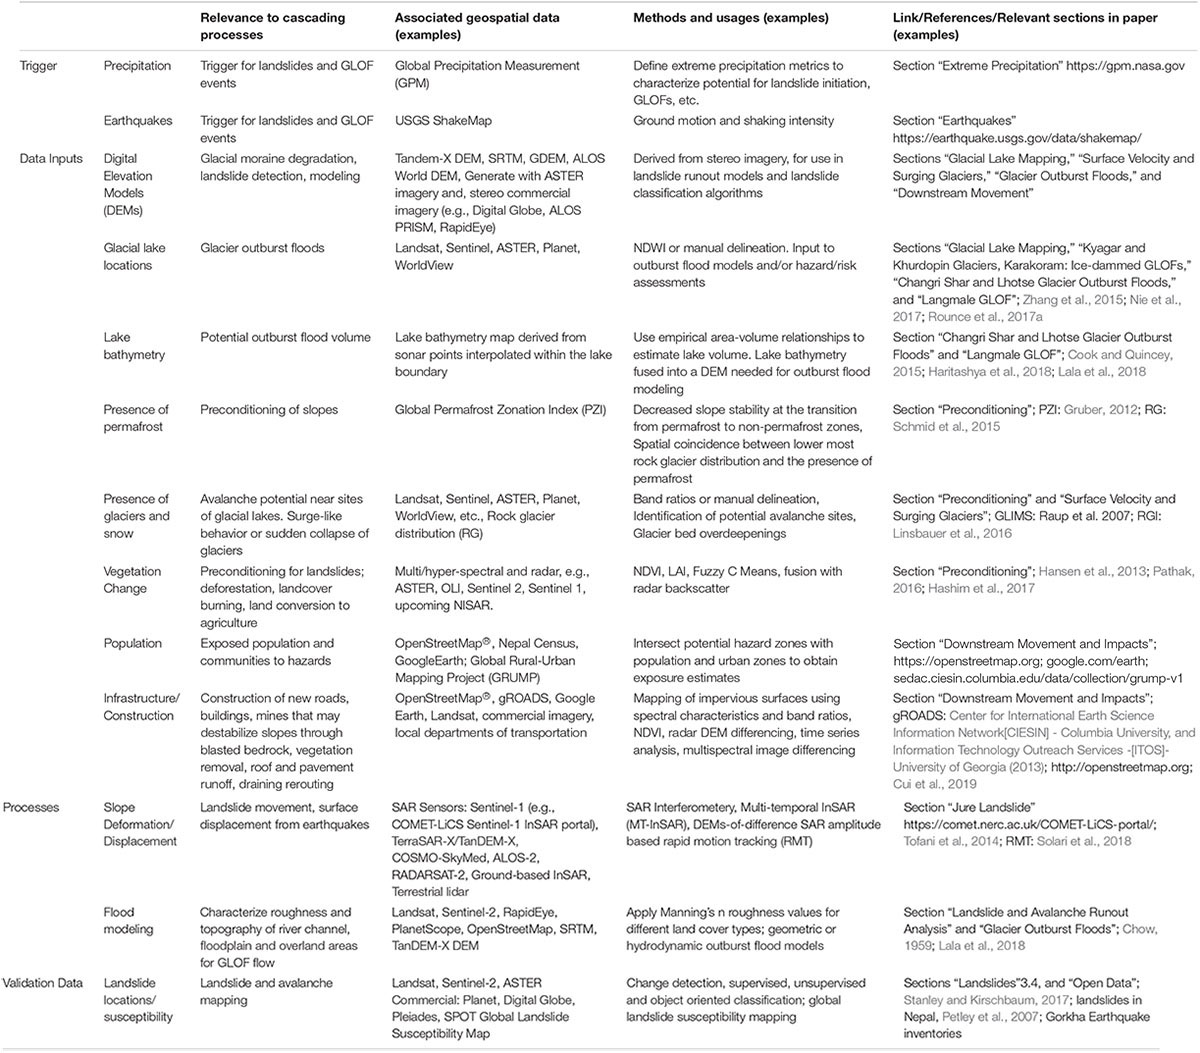
Table 1. Description of relevant processes and elements involved in cascading hazards.
Remote Sensing of Cascading Hazard Processes
This section provides a survey of many of the remote sensing data sources and methodologies relevant to the hazard processes outlined in Figure 2. The goal here is to highlight the ways in which the cascading hazard elements can be uniquely observed, then Section “Case Studies of Cascading Hazards Over HMA” will cite examples across HMA that show how these processes can connect. Section “Synthesis of Gaps, View Forward and Discussion” highlights opportunities and limitations for monitoring and modeling these cascading processes in the future.
Preconditioning
Preconditioning involves changes to the land surface that increase the probability of having a triggering event and ensuing hazard process chain or web. Conditioning processes include: (1) freeze-thaw, which can cause frost shattering of bedrock (Dredge, 1992) and generation of talus, or weakening or creep of unconsolidated sediment (Daanen et al., 2012; Zhou et al., 2018); (2) sustained rainfall or snowmelt, which can destabilize soils (Cui et al., 2019); (3) chemical weathering, which can weaken bedrock and generate talus (Avtar et al., 2011); (4) thinning of glaciers and debuttressing (removal of the physical support) of moraines or weakened bedrock or tributary glaciers (Kääb et al., 2006); (5) thawing of permafrost or ice-cored moraines; (6) gully erosion by surface streams or subsurface piping, which can undermine glaciers, debris, or bedrock; (7) prior earthquakes or joint fracturing of bedrock (Pour and Hashim, 2017); (8) deforestation and other vegetation changes (Pathak, 2016; Hashim et al., 2017); (9) construction (Pathak, 2016); and commonly a combination, e.g., bedrock weathering, deforestation, land use conversion and construction, and sustained precipitation (Cui et al., 2019), or bedrock fracturing, vegetation change, and sustained precipitation (Pour and Hashim, 2017). Commonly, minor landsliding itself can destabilize slopes and condition them for larger subsequent failures triggered by earthquakes or rainfall (Pathak, 2016).
The first six categories listed above are related to climate or extreme weather directly or by exposure of bedrock by retreat/thinning of glaciers. Thawing of permafrost can take ice-cemented and mechanically strong bedrock or debris to a state of unconsolidation, thus creating a potential for new groundwater drainage routes, surface erosion, slope creep (gelifluction or solifluction) or other dynamics that locally did not previously occur (Gruber and Haeberli, 2007; Stoffel and Huggel, 2012; Haeberli et al., 2017). Conditioning processes related to anthropogenic activities including deforestation, road and building construction, and mining can also have a significant impact on destabilizing slopes and causing landslides and other erosion processes.
Each listed process may either generate weakened or unconsolidated debris, weaken the support of the already weak rock or ice masses, or re-route water flow. Penetration of rainwater beneath hanging glaciers may decrease basal shear stress on steeply sloping beds, leading to serac falls (toppling blocks of ice). Road building and deforestation for agriculture or urban expansion commonly contribute to hillslope destabilization (Petley et al., 2007; Cui et al., 2018). Preconditioning may happen hours to decades before a trigger initiates a landslide or flood.
Preconditioning may result in new hazard processes arising where previously they were rare. The formation and growth of new glacial lakes similarly introduces new hazard processes. The thawing of permafrost and transition of “polar” or cold-based glaciers (completely frozen) to polythermal, and polythermal to temperate glaciers (temperatures at or above the melting point at the bed) is a logical consequence of increased warming in HMA (Miles K. E. et al., 2018) and may contribute to a new propensity for glacier surges or ice avalanches— some of immense scales (Kääb et al., 2018).
Earthquakes
The Himalaya plate boundary is characterized by episodic large earthquakes followed by periods of strain accumulation (Khattri, 1987; Bilham, 2019). Mapping and defining how quickly strain is accumulating across the plate boundary zone is critical to improving seismic hazard assessment and, together with other types of geomorphic mapping, will improve characterization of active fault structures (Elliott et al., 2016). The availability of satellite-based geodetic measurements has increased significantly over the last 20 years, enabling more routine observations of active tectonic processes. However, a challenge with robustly characterizing earthquake hazard is the short length of time for which good observations exist relative to the often long repeat times for large earthquakes. Modeling the spatiotemporal distribution of deformation around individual fault zones or across plate boundaries can be used to assess earthquake cycles; however, this is predicated on sufficient in situ or remote sensing observations to validate these estimates (e.g., Dal Zilio et al., 2019).
Synthetic Aperture Radar (SAR) provides a powerful capability to assess coseismic activity and surface displacements with centimeter to millimeter precision over large areas. Interferometric SAR (InSAR) is designed to measure phase changes between images along the satellite’s line-of-sight (LOS) and can identify surface displacement using publicly-available satellites such as Sentinel-1 and commercial platforms (e.g., ERS-1/2 SAR, ENVISAT ASAR, ALOS PALSAR, TerraSAR-X, RADARSAT-2, COSMO-SkyMed, see Supplementary Table S1 for more details). The timescales at which these platforms are relevant for characterizing displacement vary based on their orbit, frequencies and revisit time but research is focusing on how these types of measurements can be used to inform crustal deformation. Global Navigation Satellite System (GNSS) data provides high accuracy and temporal resolution surface displacement information vital for providing a comprehensive view of the rupture zone. The Gravity Recovery and Climate Experiment (GRACE) has been used to understand temporal variation in gravity due to great earthquakes such the 2011 Tohoku-Oki earthquake (Han et al., 2011, 2014). These observations are coupled with in situ networks of geodetic observations (e.g., UNAVCO) to improve rapid characterization of earthquake hazards (e.g., Crowell et al., 2012; Melgar et al., 2012). In addition to existing capabilities, new opportunities are on the horizon to advance earthquake hazard assessment through the synthesis of multiple satellite and in situ measurement constellations, enabling rapid characterization and dissemination of earthquake information.
Extreme Precipitation
Extreme precipitation events across HMA frequently occur during the summer monsoon season in Nepal, northern India and eastern Pakistan and during the winter westerlies within the Karakoram region to the west. There are few consistent and publicly available in situ estimates of precipitation across this region so satellite products can provide insight into the extreme precipitation patterns (storm intensity, duration, and accumulation) that may impact cascading hazards, such as landslides, glacier outburst floods, and flooding. NASA satellite products such as the Tropical Rainfall Measuring Mission (TRMM) Multi-satellite Precipitation Analysis (TMPA) (Huffman et al., 2010) and the Integrated Multi-satellitE Retrievals for GPM (IMERG; Huffman et al., 2018) provide spatiotemporal coverage over the region at 0.25 degree, 3-hourly and 0.1 degree 30-min resolution, respectively with approximately 4 h latency. Other satellite products such as Climate Hazards group Infrared Precipitation with Stations (CHIRPS; Funk et al., 2015) provides 0.05 degree products with a 2 day to 3 weeks latency. While these gridded products are of high value for continuity and coverage, one challenge with satellite derived estimates is the strong orographic controls that modulate precipitation over HMA’s complex topography. The local variability in precipitation, particularly related to orographic enhancement, can lead to errors in characterizing extreme rainfall within the transition zone from the Indian to Tibetan plateau (e.g., Barros et al., 2004; Anders et al., 2006; Andermann et al., 2011). Recent work has focused on downscaling the satellite estimates by leveraging other observations of topography and temperature to better characterize the constraints on extreme precipitation (e.g., Mei et al., 2018); however, the availability of in situ gauge data to validate these estimates remains a pressing need within this region for improving satellite precipitation retrievals over this area.
Landslides
Landslide Mapping
Landslides are pervasive events in mountainous environments, causing billions of dollars in damages to infrastructure and thousands of deaths annually (Kirschbaum et al., 2015; Froude and Petley, 2018). Remote sensing of landslides with optical imagery can be categorized into two groups: pixel based and object-oriented analysis (OOA). With the availability of high resolution satellite imagery, traditional pixel-based methods that use the spectral characteristics of single pixels and ignore spatial information have become inadequate for characterizing geomorphic process such as landslides (Dou et al., 2015). In OOA, pixels are transformed into objects based on spectral homogeneity using image segmentation (Blaschke et al., 2004). Spectral, textural, contextual, morphological and topographical characteristics of the objects are used for landslide detection (Sun et al., 2017). Comparative studies between the two methods highlight superior performance of OOA compared to pixel-based methods (Moosavi et al., 2014; Keyport et al., 2018). SAR sensors have the advantage that they can “see” the land surface during all weather conditions, which is particularly valuable when trying to observe landslide changes during the monsoon season. InSAR techniques have been used to study slow moving landslides (<1–2 cm/year) (Liu et al., 2013; Tofani et al., 2014; Ambrosi et al., 2018). Time series observation techniques also known as Multi-Temporal InSAR (MT-InSAR) have been developed (Ferretti et al., 2001, 2011; Berardino et al., 2002; Hooper et al., 2004; Hooper, 2008) to mitigate unwanted phase contributions by several different sources such as electronic properties of the ground, atmospheric delay, inaccurate orbit, and combined noises (Colesanti and Wasowski, 2006). In case of rapid movement, the interferometric phase can be affected by high phase gradients between neighboring pixels, leading to difficulties in calculating precise displacements, or severe coherence loss (decorrelation) when surface movement exceeds the detectable displacement (Casu et al., 2011; Raspini et al., 2015). For such cases, pixel offset tracking can be used as an alternative method to infer two dimensional displacements using SAR amplitude (Manconi et al., 2014; Bhattacharya et al., 2015; Sun and Muller, 2016; Madson et al., 2019).
Landslides can also be mapped by the backscattered energy difference using SAR imagery before and after a landslide (Yamada et al., 2013; Konishi and Suga, 2018) or with polarimetry-based approaches (Rodriguez et al., 2002; Czuchlewski et al., 2003; Shimada et al., 2014; Shibayama et al., 2015; Plank et al., 2016). Several polarimetric decomposition methods have been developed for classifying land cover based on scattering mechanisms (Cloude and Pottier, 1996, 1997; Freeman and Durden, 1998). The launch of SAR sensors with frequent revisit times such as TerraSAR-X, COSMO-SkyMed, and Sentinel-1 significantly improve our ability to study landslides using SAR. However, in mountainous environments such as HMA, geometric distortions such as foreshortening, shadow, and layover can be a severe limitation (Sun et al., 2016), making landslide detection and monitoring difficult.
Digital Elevation Models generated from sources such as aerial photographs (Casson et al., 2003; van Westen and Lulie Getahun, 2003), high-resolution stereo imagery (Martha et al., 2010; Lacroix, 2016; Nagai et al., 2017) and drone surveys (Watson et al., 2019) have been successfully used for landslide mapping and monitoring. Use of DEMs also enable additional parameters to be calculated, such as depth and volume, which is advantageous for all phases of landslide hazard assessment (Tsutsui et al., 2007).
Landslide and Avalanche Runout Analysis
Landslides and avalanches in high mountain regions may run into glacial lakes or rivers, triggering secondary and tertiary hazards such as outburst floods, the creation of landslide-dammed lakes, or direct inundation of populated areas. Remote sensing-derived landslide inventories help build an understanding of volume-runout relationships and are reviewed and demonstrated in Iverson et al. (1998), Metternicht et al. (2005), Noetzli et al. (2006), Griswold and Iverson (2008), and Rounce et al. (2017a).
Both empirical and numerical approaches are used to simulate landslide runout (McDougall, 2017). Salzmann et al. (2004) integrated optical remote sensing with GIS-based analysis of a DEM to assess ice avalanche hazard potential. Noetzli et al. (2006) also modeled rock-ice avalanches with a DEM. Iverson et al. (1998) and Griswold and Iverson (2008) used volume-runout relationships disaggregated by landslide type (i.e., rockfalls, shallow debris flows, and volcanic lahars) to develop the empirical LaharZ model. These approaches do not resolve many small-scale physical processes nor do they allow for bifurcations, but they are readily scalable. Prior knowledge of the general environment helps bound simulated limits of potential runout. For instance, rock-ice avalanche runout length has been found to increase roughly 25% in glacial environments, compared to non-glacial environments (Evans and Clague, 1994; Deline, 2001).
Recently, numerical modeling approaches such as r.avaflow (Mergili et al., 2017) resolve finer scale physical process chains involved in slope failure and deposition. DEM characteristics are very influential in runout simulations. In general, elevation data with high surface roughness – whether introduced by noise or true roughness in very high resolution data – results in an underestimation of runout lengths, likely due to simulated momentum losses. McDougall (2017) therefore treat surface roughness as a parameter in their DAN-W and DAN3D models. Coarser DEMs generally result in shorter and wider runout simulations when compared to observations (e.g., Muñoz-Salinas et al., 2009; Anderson et al., 2016). Relative vertical accuracy of DEMs mostly comes into play when delineating the distal extent, even more so in flatter areas (Iverson et al., 1998). In highly dynamic, glacial environments, reference DEMs quickly become outdated for runout modeling applications. ASTER-derived DEMs have been used to capture crude changes in topography left by deposits, given they are large enough (e.g., larger than 20–30 m, Huggel et al., 2007). High resolution DEMs generated from commercial stereo pairs (e.g., Shean et al., 2016; Shean, 2017) addresses this challenge, and time series of DEMs allow for volumetric analysis of debris flow runout (van Westen and Lulie Getahun, 2003). Recently, D-Claw has coupled landslide and tsunami models in Alaska (George et al., 2017), which could soon be applied to HMA with necessary inputs and parameters. To address the uncertainty in runout modeling estimates, it is often standard to consider a range of runout volumes and other sensitivity analyses. These ranges of deposition hazard zones assist decision makers and scientists in considering areas more likely to be affected by landslides under a range of scenarios.
Glacial Lakes
Glacial Lake Mapping
As glaciers melt and retreat, they become prone to develop supra- and proglacial lakes, which can become glacier outburst flood hazards (Benn et al., 2012). In HMA, both the number of glacial lakes and their area have been rapidly increasing in recent decades (Gardelle et al., 2011; Nie et al., 2017). The mapping of these lakes is typically done using optical or SAR satellite imagery.
Optical imagery typically uses the normalized difference water index (NDWI), which relies on the contrast between reflectance in green or blue bands and absorption in the near-infrared bands to map surface water (McFeeters, 1996). Corona, Hexagon, and Landsat optical satellite imagery enabled mapping of select glacial lakes since the early 1960s (e.g., Watanabe et al., 2009), although it was not until the 1990s that Landsat, and now Sentinel, provided the temporal and spatial coverage to enable regional mapping (e.g., Gardelle et al., 2011). Repeat mapping of these glacial lakes also aids in the detection of glacier outburst floods on the regional level (Veh et al., 2019). Given the plethora of imagery being generated, new innovative methods such as algorithms using Google Earth Engine (e.g., Kraaijenbrink et al., 2017) are being developed to automatically analyze these large datasets. For more detailed studies, higher resolution (0.3–3 m) satellite imagery with improved temporal resolution (e.g., PlanetScope, WorldView) enable near real-time monitoring of the filling and potentially catastrophic drainage of supraglacial (e.g., Miles E. S. et al., 2018), moraine-dammed (e.g., Byers et al., 2018), ice-dammed (e.g., Steiner et al., 2018), and landslide-dammed lakes (e.g., Kargel et al., 2016). Additionally, SAR images, which rely on the backscattering intensity to delineate glacial lakes (e.g., Strozzi et al., 2012), provide reliable, repeat images of glacial lakes that are unobstructed by clouds. However, these images are often manually delineated to avoid errors associated with surface waves and saturated sediments (e.g., Strozzi et al., 2012; Round et al., 2017), so they are often only used over limited spatial extents.
Surface Velocity and Surging Glaciers
Studies have measured surface gradients and velocities to better understand the development of glacial lakes and the link between lake expansion and glacier mass loss (e.g., Quincey et al., 2007; King et al., 2018). Major advances in feature tracking have enabled surface velocities to be estimated for all glaciers in HMA using optical imagery (Dehecq et al., 2019). New products such as the Global Land Ice Velocity Extraction from Landsat 8 (GoLIVE) provide velocity estimates for any Landsat 8 image pair. High-resolution optical imagery with short revisit times such as PlanetScope (e.g., Steiner et al., 2018) or reliable SAR images (e.g., Round et al., 2017) are also enabling detailed investigation of seasonal surface velocities.
Surface velocities can be used to identify surging glaciers, which are common in the Karakoram (Hewitt, 2007). A glacier surge refers to the sudden movement of ice over a relatively short period of time, causing notable mass redistribution and potentially rapid glacier advance (Richardson and Reynolds, 2000). In the Karakoram, it is unclear whether surges are controlled by warming thermal conditions or changes in the hydrologic conditions (Quincey et al., 2015). Nonetheless, surging glaciers are important to monitor as they may damage property or infrastructure, and/or may block a valley and cause an ice-dammed lake that is a potential outburst flood hazard (Hewitt and Liu, 2010).
Glacier Outburst Floods
Glacier outburst floods refer to the sudden discharge of water from a glacier (Carrivick and Tweed, 2013), which can have runout distances of tens to hundreds of kilometers (Gunn, 1930; Hewitt, 1982; Vuichard and Zimmermann, 1987; Richardson and Reynolds, 2000; Reynolds, 2014; Gurung et al., 2017) and cause extensive geomorphic and socioeconomic damages. The flood water may be stored in a proglacial lake [often referred to as a glacial lake outburst flood (GLOF), e.g., Vuichard and Zimmermann, 1987], within the glaciers’ subsurface (e.g., Rounce et al., 2017a), or behind an ice dam (e.g., Round et al., 2017).
The triggering mechanism that initiates these floods is typically a dynamic event (e.g., an avalanche entering the lake, extreme precipitation) or the destabilization of the damming material (e.g., increase in hydrostatic pressure, piping). In HMA, the main triggering mechanism for proglacial lakes is a mass movement (avalanche or rockfall) entering the glacial lake, which causes a displacement wave that can destabilize the terminal moraine and cause a flood (Richardson and Reynolds, 2000; Falátková, 2016). For the other types of outburst floods, the triggering mechanism is typically caused by the destabilization of the damming material, which may be linked to the ice dam thawing, hydrostatic pressure exceeding the strength of the dam, or hydrostatic pressure enabling the impounded water to find more efficient drainage pathways. Given the unpredictable nature of glacier outburst floods, remote sensing has primarily been used to analyze floods following the events (e.g., Rounce et al., 2017a; Byers et al., 2018) or to conduct a first-pass hazard assessment for proglacial lakes (e.g., Worni et al., 2014; Rounce et al., 2017b). The latter typically utilize optical imagery and DEMs to identify potentially dangerous glacial lakes that require further investigation, which may include fieldwork and detailed flood modeling with a high-resolution DEM (e.g., Lala et al., 2018).
Downstream Movement and Impacts
Downstream Movement
Outburst floods mobilize large boulders that armor the channel bed (Cook et al., 2018), leading to bank erosion, landslides, and channel damming (Kattelmann, 2003). Large volumes of sediment and woody debris are often mobilized and redeposited in response to variations in channel morphology and stream power (Costa and Schuster, 1988; Watanabe and Rothacher, 1996; Clague and Evans, 2000; Cenderelli and Wohl, 2003), which leave distinctive marks on the landscape. Remote sensing data, primarily optical imagery and DEMs, are used to quantify the extent and magnitude of downstream impacts. Change detection techniques applied to optical imagery (e.g., PlanetScope) and band ratios, such as the normalized difference vegetation index (NDVI) and NDWI, can reveal areas of bank erosion and river channel migration, respectively (Miles E. S. et al., 2018). However, river channels are likely to be poorly resolved in topographically confined reaches. Very high resolution satellite imagery (e.g., WorldView) in some cases allows discrimination of flow paths, river channel damming, and secondary hazards, and is often made available for disaster response (Kargel et al., 2016; Rounce et al., 2017a). Alternatively, SAR can penetrate cloud cover, but exhibit data voids from layover and shadow effects in steep topography (Robson et al., 2015). Satellites such as Sentinel-1A and 1B have a 12-day revisit cycle and provide 6-day frequency when imagery from both satellites are used.
DEMs are fundamental inputs when modeling downstream flood propagation, either in first-pass GIS-based assessments (e.g., Huggel et al., 2004; Mergili and Schneider, 2011; Watson et al., 2015; Rounce et al., 2017b) or in physically-based hydrodynamic models (e.g., Westoby et al., 2014a, 2015; Worni et al., 2014; Lala et al., 2018). Spatial and temporal resolution is a limitation in the HMA region where only 30 m resolution global products are widely available, such as the Shuttle Radar Topography Mission (SRTM) or ALOS World 3D (AW3D30) DEMs. These global products are less suited to the application of higher-order (e.g., 2D and 3D) hydrodynamic models that can account for sediment entrainment and deposition (Westoby et al., 2014a, b), and rapidly varying topography that constricts flow to produce hydraulic ponding and attenuation of peak discharge (Clague and Evans, 2000; Carrivick, 2006; Carrivick et al., 2013). The production of the HMA DEM products (Shean, 2017) and access to high-resolution stereo imagery for DEM generation (e.g., Kougkoulos et al., 2018; Miles E. S. et al., 2018), presents new opportunities for retrospective or predictive modeling of high-magnitude flows (e.g., Watson et al., 2019), and to conduct analyses relevant to disaster response timescales such as modeling landslide-dammed lake formation. DEM generation with high temporal and spatial resolution could one day be achieved using satellite constellations with daily revisit capabilities and favorable stereo geometry. DEMs can also be used to quantify topographic change associated with the cascading hazard floods through multi-temporal differencing. Consideration of multiple data sources and assessment methods (Table 1) is essential to produce analyses relevant at disaster response timescales, but also for subsequent analyses aimed at an improved process-based understanding of the event.
Human Impacts: Impacts on Populations and Infrastructure
The risks of physical hazards to populations and infrastructure can also be cascading, referred to here as cascading socioeconomic impacts. In addition to a glacier outburst flood or landslide directly causing fatalities and/or damage to roads, bridges or buildings, shocks from these hazards can trigger breakdowns in supply chains. A flooded field can cause direct losses to farmers, while a blocked road can result in substantial economic losses for farmers unable to get their goods to market, thereby impacting supplies in nearby towns. Floods can also instigate water quality issues, such as contamination, which may result in health impacts to populations affected by the disaster. Social issues related to disasters including gender-based violence, mental health issues, unemployment, alcoholism and loss of educational facilities have also been documented (e.g., Tierney, 2006; World Bank, 2011; Deloitte Access Economics, 2016). Broader or more diffuse but potentially serious cascading socioeconomic impacts may also occur. For instance, an event that destroys a hydroelectric project or school or prevents employees from reaching their work site may propagate through the economy over time by limiting the supply of electrical energy or skilled workers. The resilience of populations to respond and reduce risk to disasters is highly linked to societal income, educational attainment, and the strength of financial sectors across local to regional governments (Toya and Skidmore, 2007).
Many mountain valleys, especially in HMA, are dotted with villages, hydropower plants, and other infrastructure, which are often connected by winding and precariously positioned transportation networks. Where settlements are in the path of any hazard in the cascading process, the results can be catastrophic. However, not all people in a flood route, for example, are equally at risk (Carey, 2005).
Allen et al. (2016a) used Census India data to quantify social vulnerability to GLOFs in Himachal Pradesh. They find that certain districts have relatively low risk due to low levels of social vulnerability, even though potentially threatening glacial lakes are located upstream. Their remote sensing and GIS modeling analysis forecasted dramatically increased GLOF hazard across most districts in the coming decades, which will likely alter community risk. In the Karakoram, Hewitt and Liu (2010) describe hundreds of villages, as well as highways, bridges, and tourist facilities at risk from GLOFs. They report 1.8 million people, 38 million hectares of irrigated land, and six hydroelectric plants as being at risk, most of which are in China’s Tarim Basin, downstream of the glaciated Yarkand River valley in the Karakoram (Hewitt, 2014).
Remote sensing data can play a pivotal role in rapidly assessing the impacts following an event or series of cascading processes, providing insight into vulnerabilities prior to the triggering event and tracking recovery. Following the 2015 Gorkha Earthquake in Nepal, data from the Visible Infrared Imaging Radiometer Suite (VIIRS) “Day-Night Band” sensor aboard the NASA/NOAA Suomi National Polar-Orbiting Partnership satellite, was able to identify the reduced light emissions in the affected area based on pre- and post-event imagery (Schultz and Molthan, 2015). This product has also been used during other disasters to monitor power outages and recovery, such as following Hurricanes Maria and Sandy (Cole et al., 2017; Wang et al., 2018). SAR data can also provide rapid information on estimated building damage to response communities following major events (e.g., Yun et al., 2015; Karimzadeh et al., 2017; Sharma et al., 2017). The same types of optical data relevant to landslide mapping are also valuable for inundation mapping following flooding events (e.g., Uddin and Shrestha, 2011), assessment of agricultural impacts (e.g., Sivakumar, 2005), and socioeconomic impact assessments looking at building and road damages. Harnessing the power of remote sensing data can provide a physical baseline to identify the vulnerability of critical economic and demographic sectors, which may then be used along with regional economic information to establish strategies and policies for adaptation investments to promote economic growth while increasing resilience (Hill et al., 2012).
Case Studies of Cascading Hazards Over HMA
To provide context for how remote sensing data may inform the interactions between elements in the cascading hazard chains or webs, we provide six case studies across HMA that represent a range of conditions under which cascading hazard processes have occurred. Here we explore the observational or monitoring strategies before or after these events, the data relevant to address the cascading hazard elements, and opportunities for improved integration of modeling and observational data for characterizing potential future hazards.
Gorkha Earthquake
On April 25, 2015, Nepal was rocked by a M7.8 earthquake, followed by five aftershocks >M6.0 in the following 6 weeks, including a M7.3 event. Together, these events killed >9,000 people, and triggered thousands of landslides (e.g., Kargel et al., 2016; Zekkos et al., 2017; Roback et al., 2018). While tens of thousands of landslides were triggered coseismically, many others occurred in the weeks following the main quake. In the steep Himalayan topography where most of the mapped landslides occurred, some traversed the valley and blocked rivers, causing temporary lakes to form (Figure 3). These lakes constituted significant secondary (to the landslides) or tertiary (to the earthquake) hazards, since a burst of their dams could cause flooding weeks or months after the earthquake while valley inhabitants were working to recover from the earthquake itself.
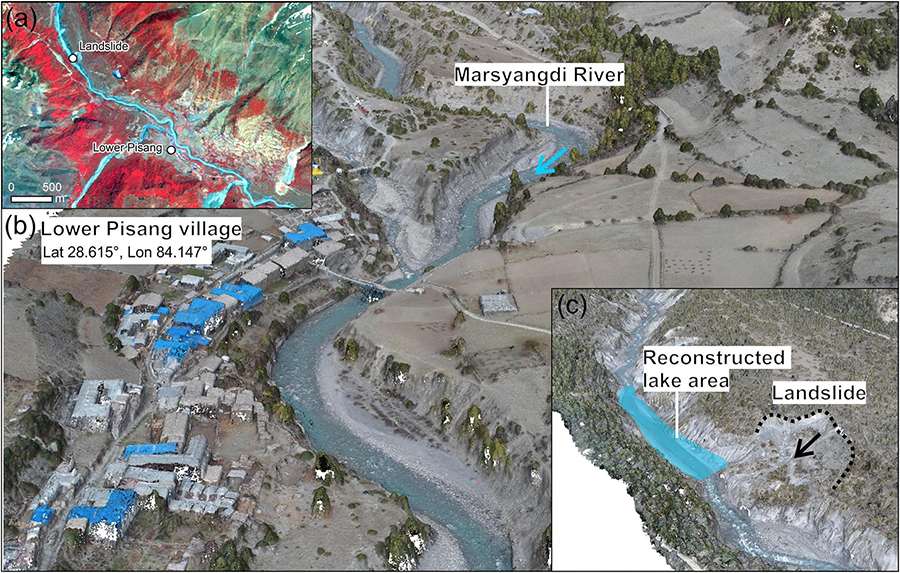
Figure 3. (a) Location of a landslide-dammed lake upstream of Lower Pisang village from a 11 May 2015 RapidEye composite of bands NIR, red, and blue (Planet Team, 2018). (b) Shows a point cloud of the Marsyangdi River (April 2018) from Watson et al. (2019), derived from UAV imagery processed following a structure from motion with multi-view stereo workflow. (c) Shows the landslide dammed lake that formed following the Gorkha earthquake and was monitored by Kargel et al. (2016).
Remote sensing data played a key role in responding to, and understanding the hazards posed by these landslides (e.g., Lacroix, 2016). For example, Kargel et al. (2016) overlaid landslide distributions (mapped from optical imagery) on a map of surface deformation from a JAXA ALOS-2 interferogram to better understand the relationships between mass movement occurrence and ground motion. They also described how an international group of volunteers analyzed imagery in near real-time to identify potential risks. One site in particular, on the upper Marsyangdi River, illustrated the role remote sensing served in this disaster. At least 20 landslides occurred in the relatively low-gradient alluvial sediments in the valley bottom (as opposed to the ridgetop failures that characterized most of the mass movements), more than half of which occurred in the days to weeks following the main earthquake. The chronology of their failures was only determined due to the frequency with which high-resolution satellite imagery (primarily by DigitalGlobe) were acquired. The largest landslide, about 2 km upstream of the village of Lower Pisang, dammed the Marsyangdi River, impounding a lake 2.5 × 10⁴ m2 in area (Figure 3). Unfortunately, the monsoon prevented further useful acquisitions of optical data to continue monitoring the site; however, the lake later drained naturally and did not cause downstream flooding.
Jure Landslide
On August 2, 2014, a huge landslide occurred in Jure village of Sindupalchowk district, Nepal after 2 days of torrential rainfall (van der Geest and Schindler, 2016). The mass movement resulted in 156 deaths and destroyed a 1 km section of the Arniko highway. The landslide also dammed the Sun Koshi river, forming a 3 km long lake that inundated many houses, farms and infrastructure upstream (IFRC, 2014) (Figure 4). Ultimately, the Nepalese Army reduced the lake volume by blasting off part of the landslide blockade to facilitate water release (Acharya et al., 2016).
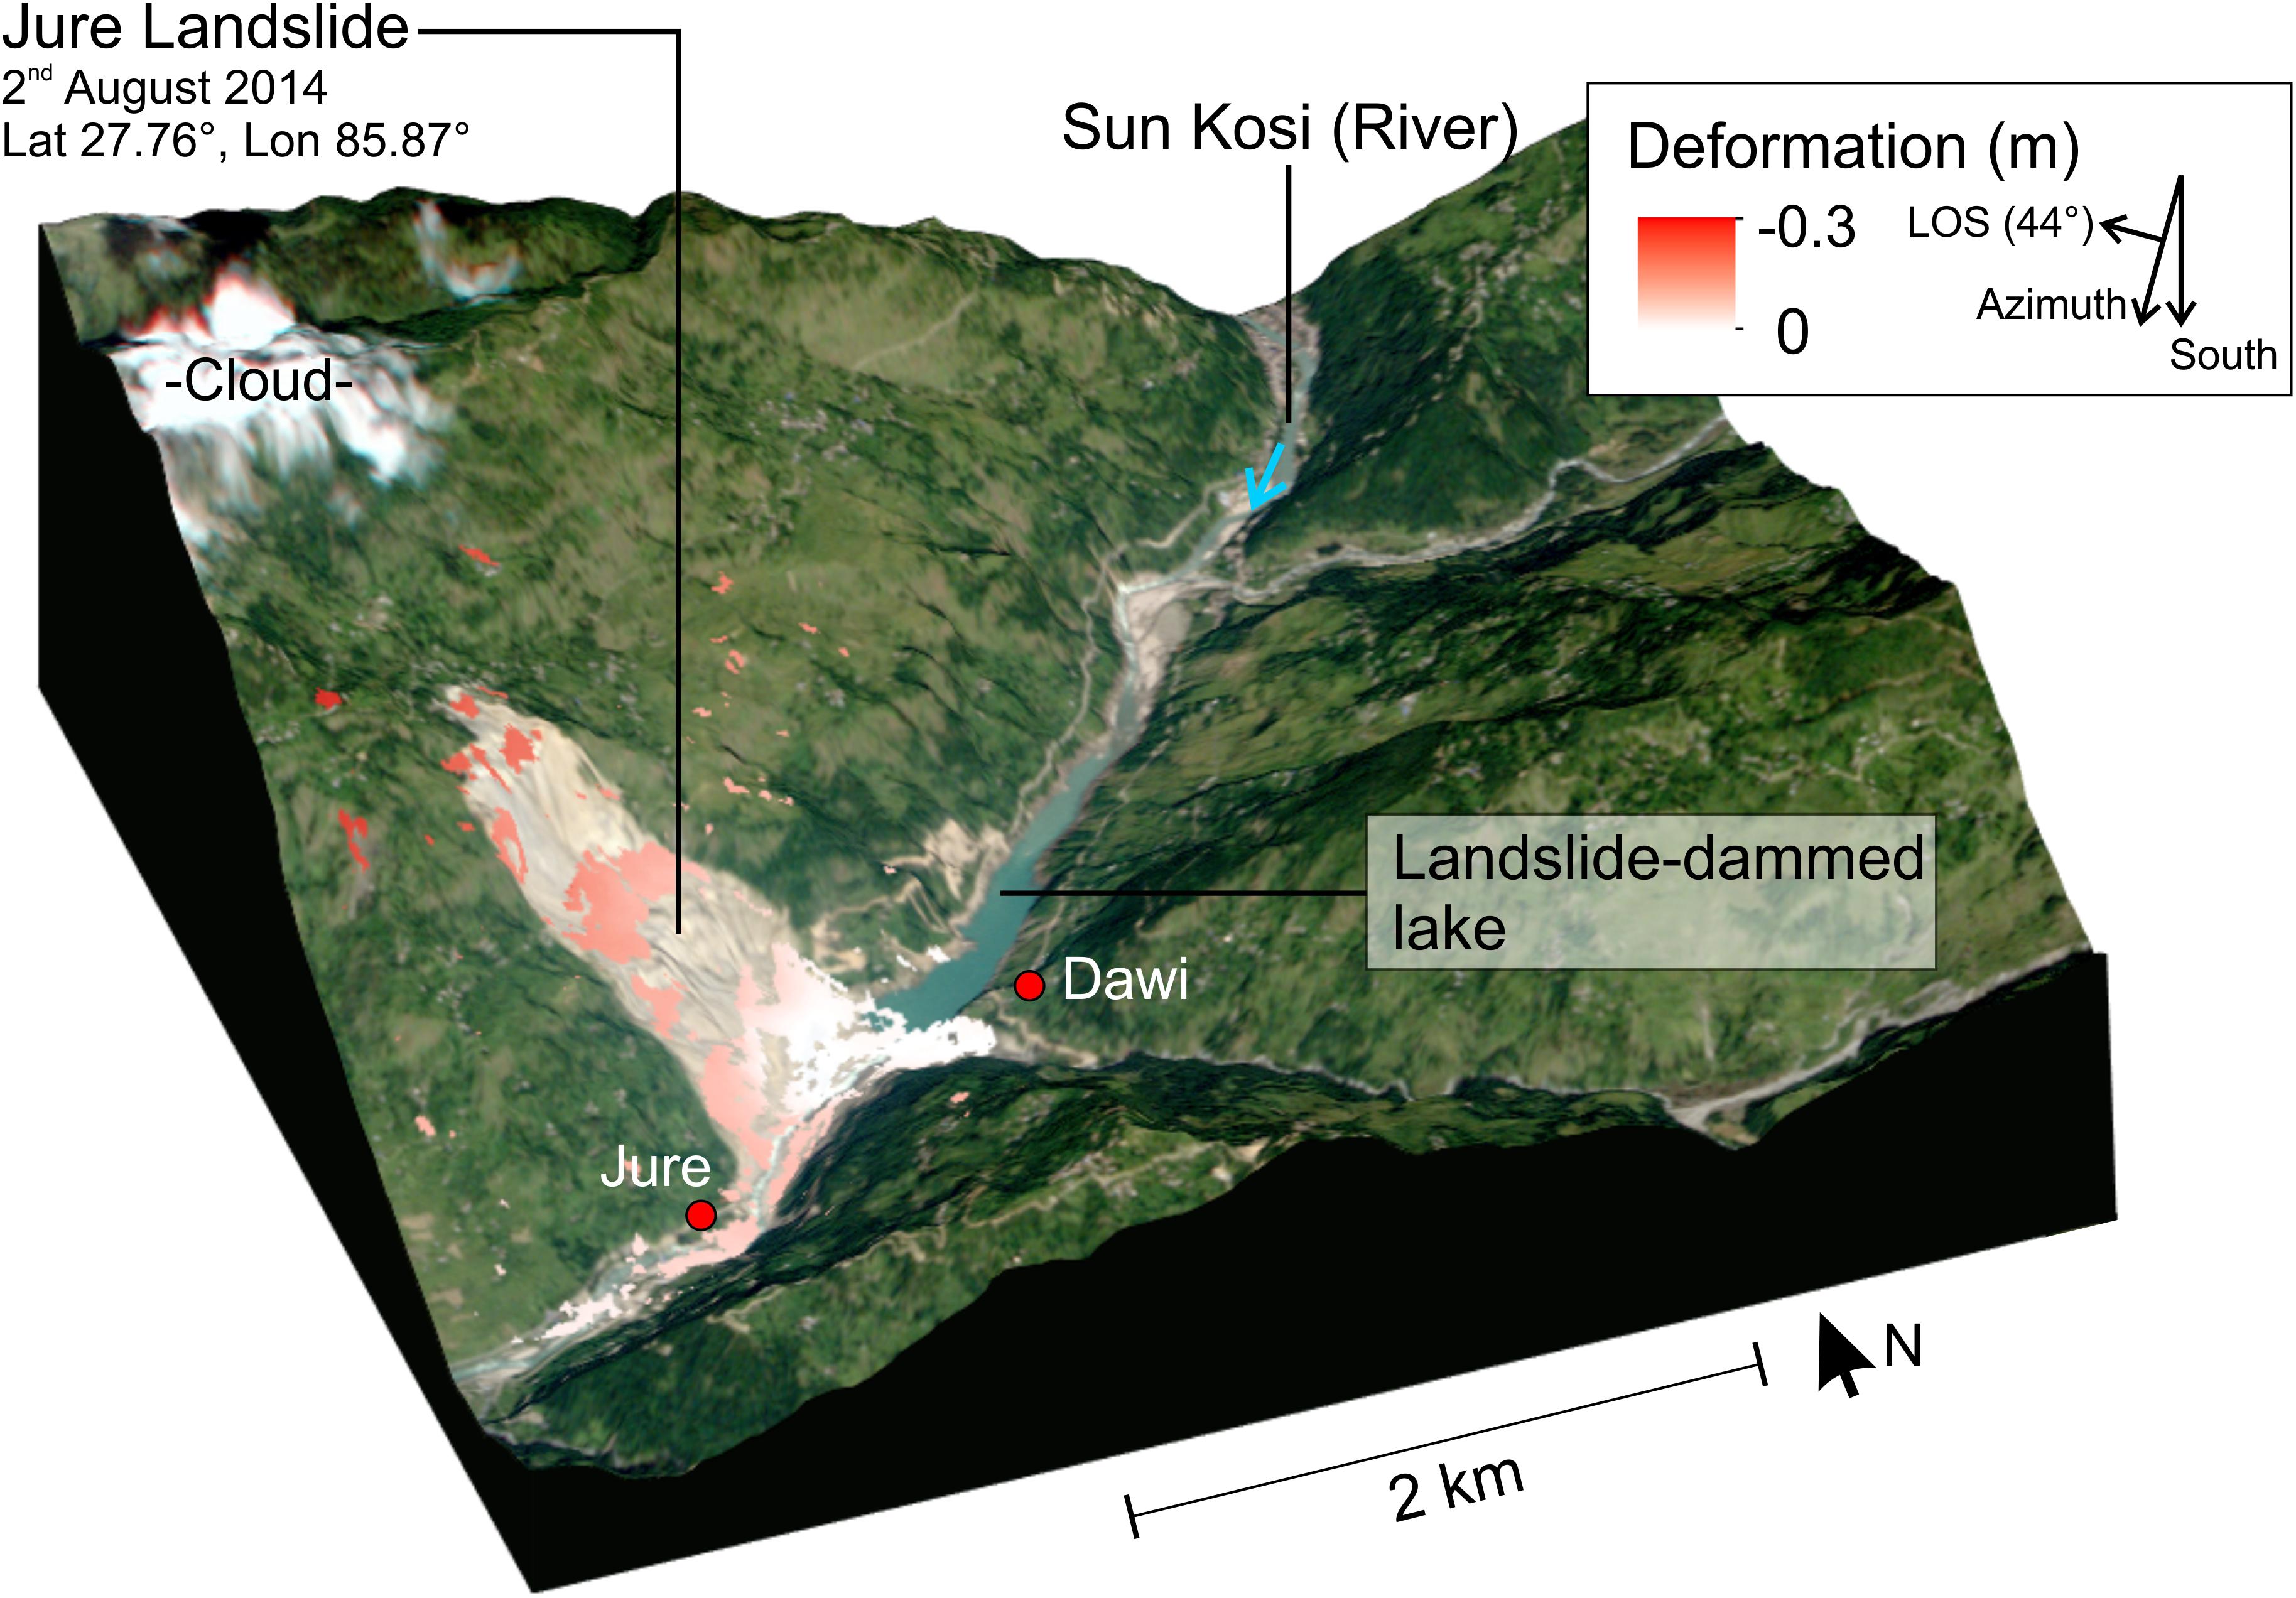
Figure 4. Earthquake triggered landslide deformation measured from COSMO-SkyMed SAR imagery for the period between May 5–29, 2015. Background is a true color RapidEye image from October 11, 2014 (Planet Team, 2018). SAR Imagery is provided by the Italian Space Agency via the CEOS Working Group on Disasters Landslide Pilot.
Khanal and Gurung (2014) mapped the landslide, dam, and lake using a post-event IRS-P6 LISS-IV Mx image of August 5, 2014. The landslide had a maximum width of 0.81 km at the bottom, total length of 1.26 km, and area of 0.71 km2. Roy et al. (2014) analyzed high-resolution images from WorldView (2.4 m) from 2001 to 2014, which clearly indicated the slope section on which the landslide occurred was unstable, since multiple smaller landslides were apparent prior to the larger failure.
The Jure landslide site was reactivated following the 2015 Gorkha earthquake. As part of this study, five COSMO-SkyMed X-band SAR images collected after the earthquake between May 5–29, 2015 were used to measure the earthquake triggered deformation applying the InSAR technique. On the outcrop of the Jure landslide scarp, surface deformation of about 0.3 m in line-of-sight (LOS) direction, was measured by stacking three post-seismic InSAR pairs using small baseline subset (SBAS) analysis (Berardino et al., 2002). As shown in Figure 4, most scarps with very steep slopes were masked out in the analysis due to their low interferometric coherence. From these observations, we confirm that deformation rates are reduced from the head scarp to the main body, and also that deformation at the toe of the landslide is not significant. This result demonstrates how InSAR measurement can be used to identify slow-moving landslide processes prior to the main failure, especially using X-band SAR images.
Kyagar and Khurdopin Glaciers, Karakoram: Ice-Dammed GLOFs
In the last two centuries, Kyagar Glacier has caused more than 30 GLOFs due to its surging behavior (Hewitt and Liu, 2010; Yin et al., 2018). In response to these frequent GLOFs, an early warning system was installed between 2011 and 2013 based on remote sensing and terrestrial observation stations that monitor glacier surges, development of an ice-dammed lake, and downstream water levels (Haemmig et al., 2014). Two of its recent GLOFs in 2015 and 2016 were assessed using high-resolution DEMs along with optical and SAR imagery to understand Kyagar’s surge cycle and its role in the GLOFs (Round et al., 2017). They used Landsat, Sentinel-1, TanDEM-X and TerraSAR-X to estimate 80 glacier surface velocity fields, which were able to capture both the interannual and seasonal surge cycle. These images were also used to monitor changes in the extent of the ice-dammed lake, which showed repeated filling and drainage. The lake’s volume was estimated to be >70 million m3 based on the lake extent and a high-resolution DEM, which is much smaller than the flood volumes from previous years (Qinghua, 1991).
A similar study on Khurdopin Glacier used a high-resolution DEM with optical imagery from Planet and Landsat, which provided enough clear-sky images to monitor the speed-up of the glacier and the subsequent growth and drainage of an ice-dammed glacial lake (Steiner et al., 2018) (Figure 5). Khurdopin Glacier also has a long history of GLOFs, which led local villages to develop an early warning system that uses bonfires at night or gunfire during the day to alert subsequent posts down valley of the flood (Iturrizaga, 2005). Given the frequent and repetitive nature of these events in the Karakoram, recent advances in remote sensing provide opportunities to improve existing early warning systems and could enable monitoring at the regional level. The examples of Kyagar and Khurdopin Glaciers highlight the importance of routine production and release of high-resolution DEMs (e.g., Shean, 2017), and the need to further develop automated methods for integrating optical and SAR imagery to provide improved spatial and temporal coverage over targeted areas.
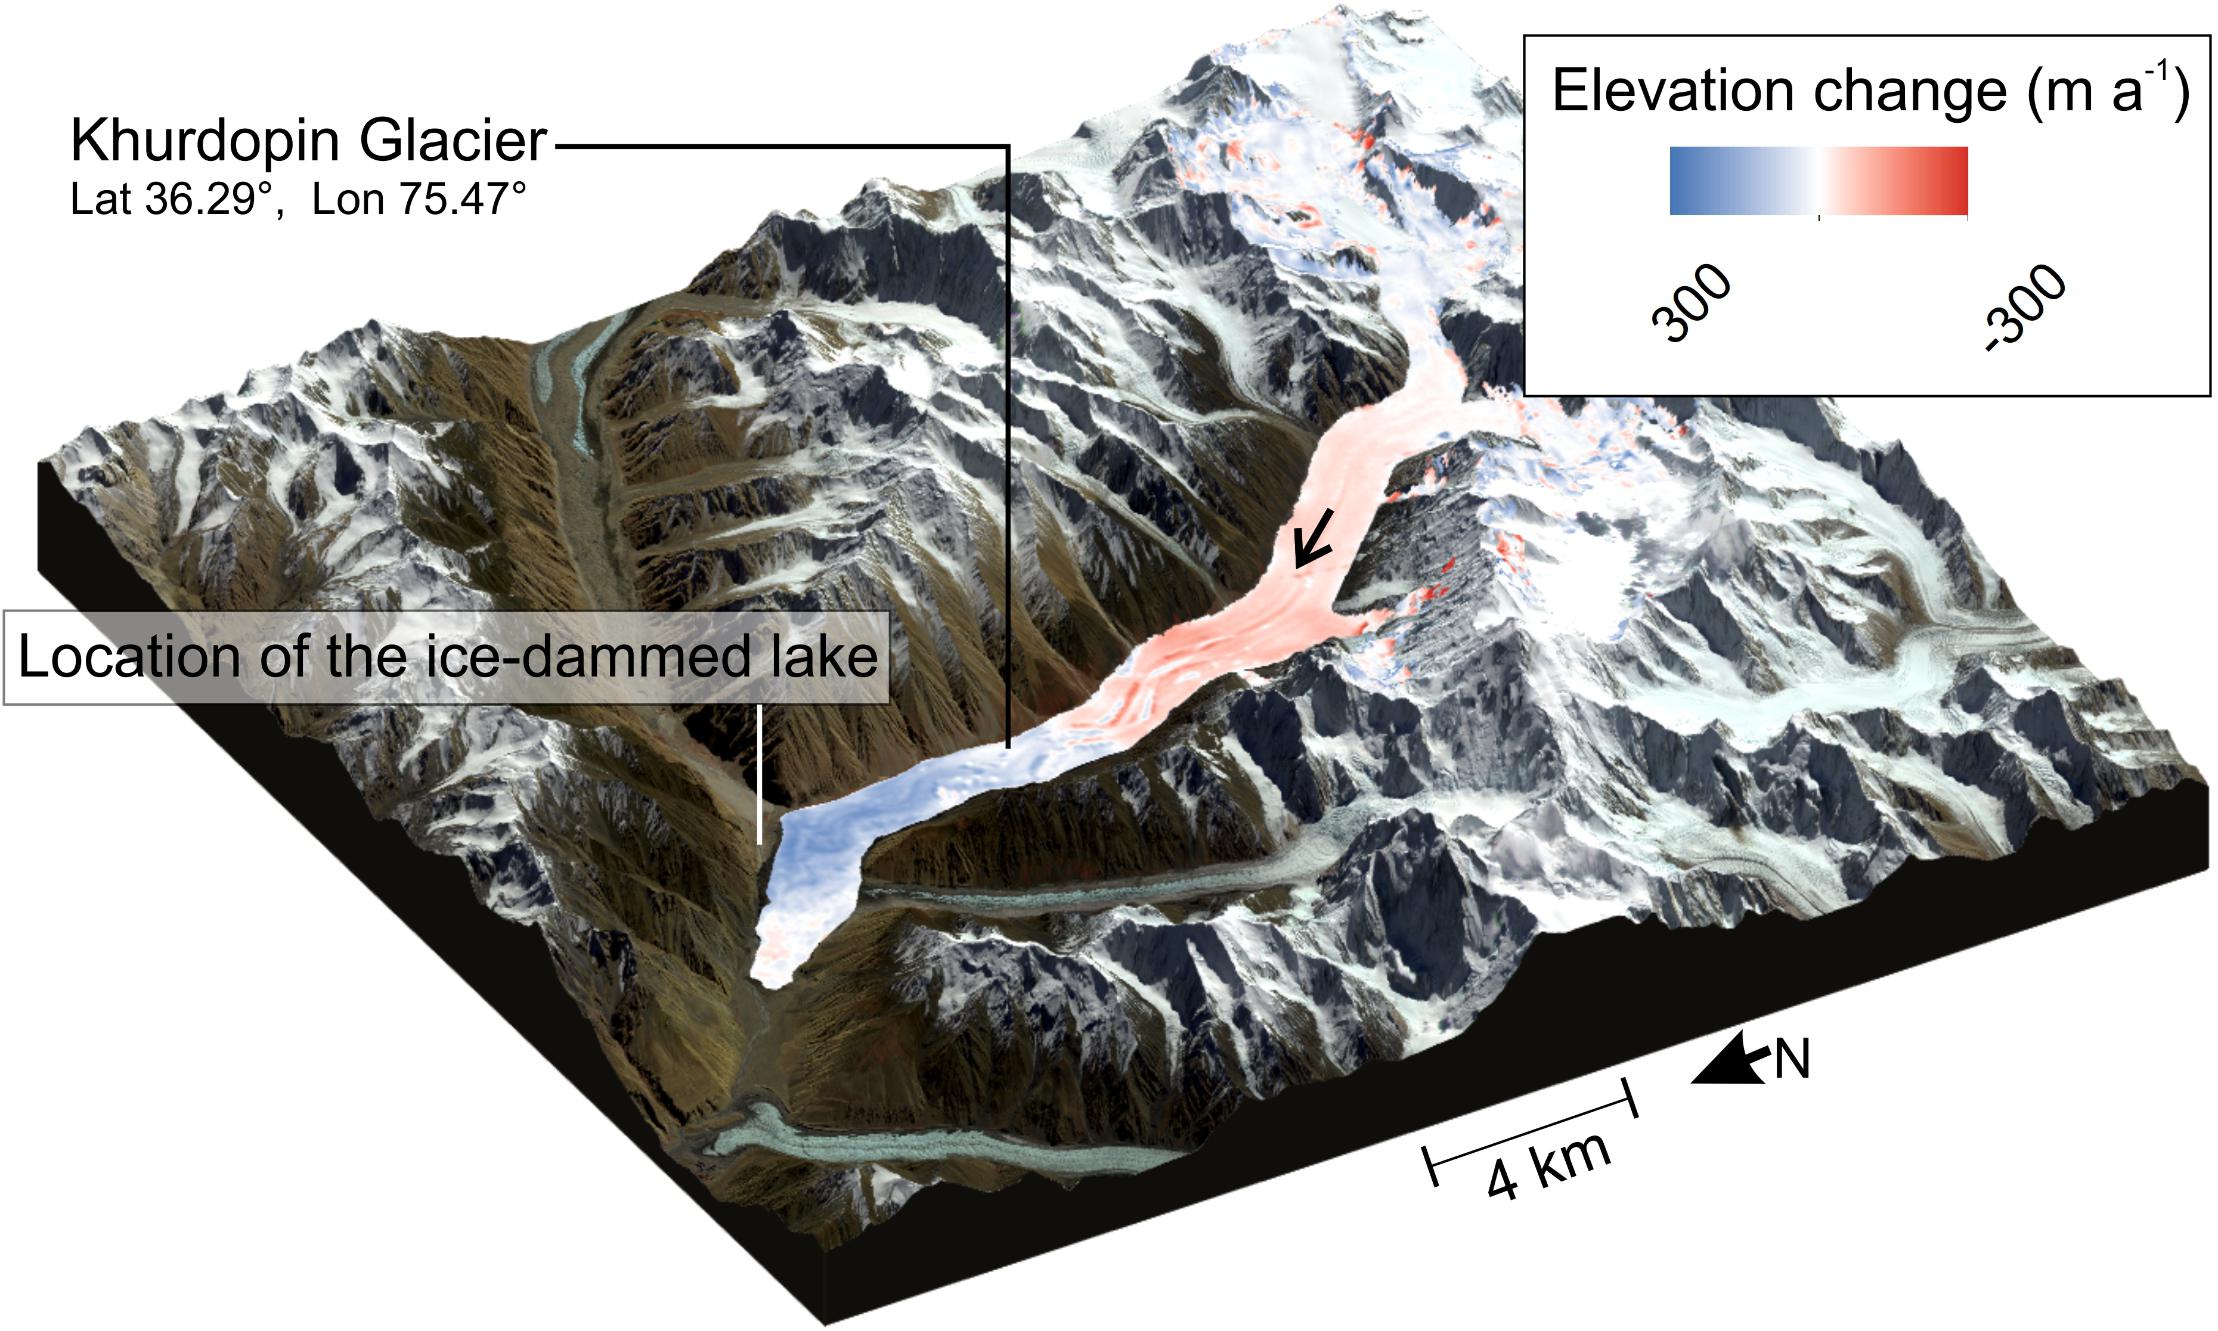
Figure 5. Elevation change on the Khurdopin Glacier during the build-up (2015–2016) and surge phase (2017) from Steiner et al. (2018). Background is a Sentinel-2 composite of bands NIR, red, blue (20 September 2017).
Changri Shar and Lhotse Glacier Outburst Floods
Meltwater storage on debris-covered glaciers varies seasonally and inter-annually. Some ponds coalesce and persist, whereas others drain seasonally upon interception with englacial conduits (Benn et al., 2012; Miles et al., 2017; Watson et al., 2017). Inhibited meltwater drainage leads to supra- and en-glacial water accumulation, and an increased likelihood of sporadic drainage. Three high magnitude drainage events were reported in the Everest region of Nepal in 2015–2017, one from a supraglacial lake that formed over 4 months in 2017 on Changri Shar Glacier (Miles E. S. et al., 2018), and two from supra- and en-glacial water stored on Lhotse Glacier in 2015 and 2016 (Rounce et al., 2017b) (Figure 6). Both events had minor socioeconomic impacts relating to bridge and trail destruction.
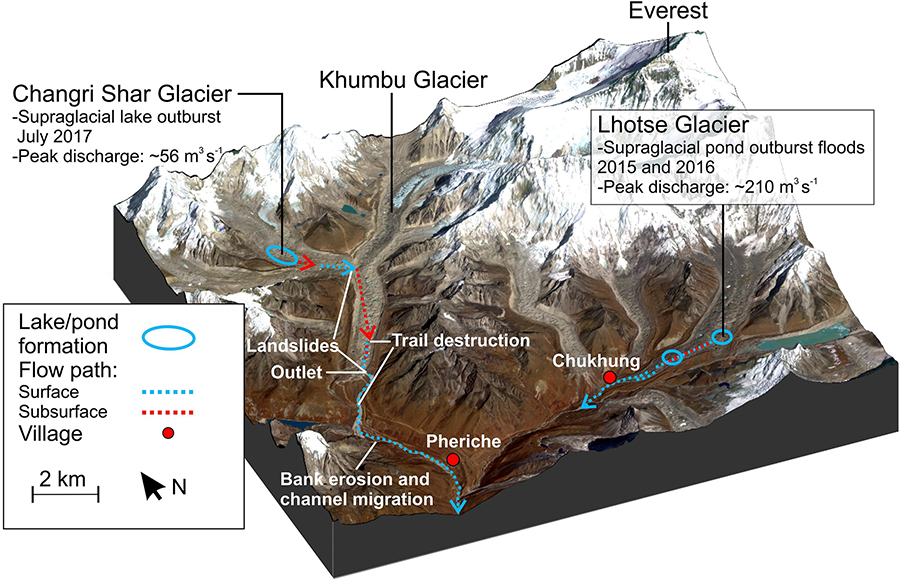
Figure 6. Location of debris-covered glacier outburst flood events 2015–2017 in the Everest region of Nepal. Background is a RapidEye composite of bands NIR, red, blue (13 November 2017) (Planet Team, 2018).
Optical satellite imagery was essential to reconstruct the events. The lake evolution on Changri Shar Glacier was observed using 25 PlanetScope satellite images from March to October 2017. Detailed spatiotemporal lake observations would not have been possible using Landsat or Sentinel-2 due to cloud cover and longer revisit times (Miles E. S. et al., 2018). Surface and englacial flow paths were interpreted with the aid of DEM differencing using Pléiades imagery, which revealed surface elevation changes associated with the flood, including englacial conduit collapse, channel incision, and landslide initiation (Figure 6). A pre-event Pléiades DEM was also used to estimate the volumetric growth of the lake by filling the surface depressions. Bank erosion and channel migration associated with the downstream movement of the flood was quantified using multi-temporal NDVI and NDWIs, and revealed changes up to 11 km downstream before the narrow river channel topography precluded further observations.
Optical satellite imagery was also critical in the reconstruction of the Lhotse Glacier outburst floods. WorldView-1, 2 and GeoEye-1 were used to assess the draining and filling of supraglacial ponds before and after the 2015 and 2016 outburst floods. These high-resolution images enabled the water stored in supraglacial ponds to be estimated, which ultimately revealed that most of the water was sourced in the glacier’s subsurface.
Both studies reveal the rapid accumulation and drainage of water is likely to be prevalent across debris-covered glaciers, but observations have previously been limited or unreported. Trends of increased supraglacial water storage and a predicted increase in GLOF events with climatic warming, perhaps with an associated time lag (Harrison et al., 2018), will make monitoring these ephemeral lakes and larger proglacial lakes more important. The formation of the Changri Shar Lake was reported on social media several days prior to the drainage event, highlighting that monitoring methodologies developed using remote sensing data could be used to issue information relating to hazards and potential cascading interactions. In the case of the Lhotse outbursts, which involved englacial water storage, such observations are more difficult, although changes in supraglacial water storage likely reflect the accumulation of water stored englacially as well.
Langmale GLOF
On April 20, 2017, a massive rockfall from Saldim Peak (6388 m) entered Langmale glacial lake, which generated a displacement wave that breached its moraine dam (Byers et al., 2018). The resulting flood carved new canyons, scoured Barun River’s floodplain, and deposited copious volumes of sediment in the village of Yangle Kharka about 6.5 km downstream (Figure 7). The floodwaters were temporarily dammed immediately above the village of Barun Bazaar at the confluence of the Barun and Arun Rivers. The impounded lake was 2–3 km long and 500 m wide. This displaced 10 families and threatened to impact 80 others (Shakya and Sabha, 2017). Fortunately, the lake drained naturally within 24 h of its formation.
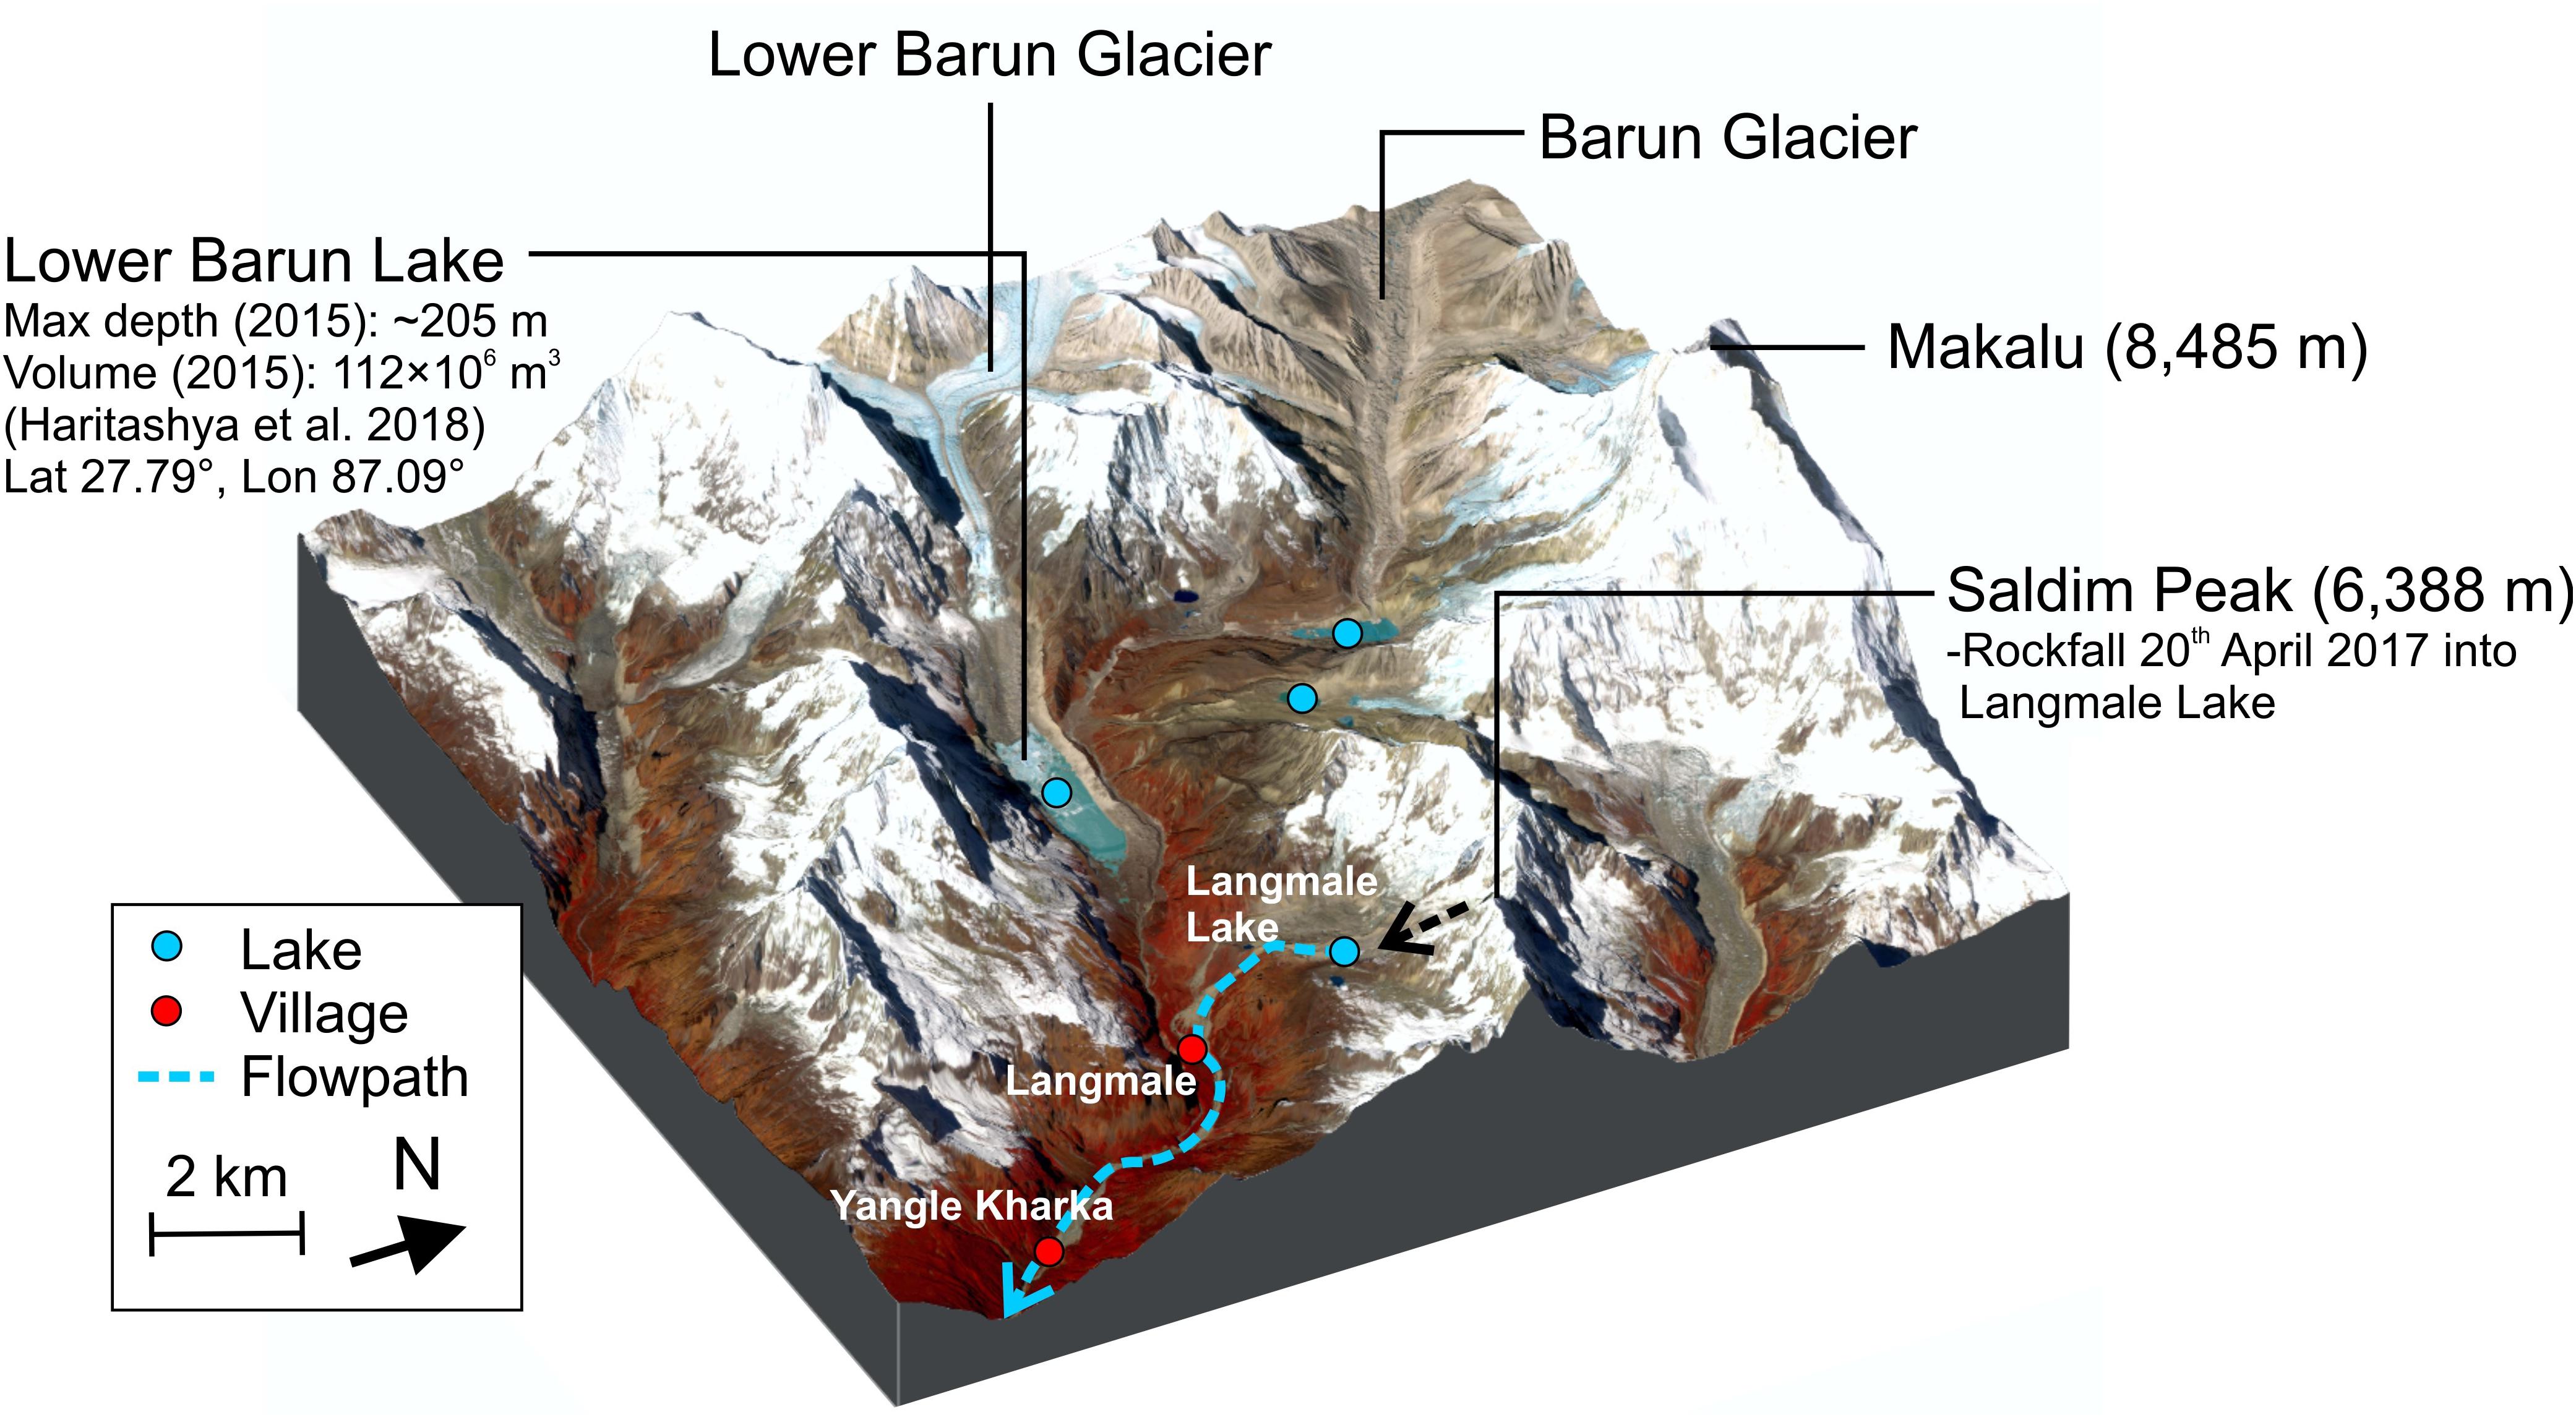
Figure 7. Location of the Langmale outburst flood. Background is a Sentinel-2 image composite of bands NIR, red, blue (19 November 2017).
On the day of the flood, several villagers in upper Langmale valley reported hearing a large avalanche, but nobody witnessed the mass wasting due to thick fog (Byers et al., 2018). These observations were supported by a fresh scar on Saldim Peak and newly deposited debris on the Langmale Glacier, which was apparent in optical imagery. The poor weather also hampered efforts by the Nepalese Army to visit the upper Barun valley to determine the source of the flood. Reconstruction of the event was based on eyewitness accounts, field surveying, helicopter overflights, remote sensing, and detailed modeling of the GLOF process chain. Specifically, WorldView-2 and PlanetScope imagery showed the catastrophic drainage of the lake, and a numerical GLOF model with a high-resolution DEM was used to reconstruct the entire GLOF process chain (Byers et al., 2018).
The GLOF from Langmale glacial lake showed that the rockwalls surrounding these glacial lakes are unstable, and even an outburst flood from a relatively small glacial lake can have significant downstream impacts. In the Makalu-Barun Valley, this event raised concern amongst the local communities about a potential GLOF from the much larger Lower Barun glacial lake (Haritashya et al., 2018), which has an area of ∼1.8 km2 compared to the pre-flood area of Langmale Lake (0.083 km2). A first-pass, remote sensing hazard and risk assessment classified Lower Barun glacial lake as high risk due to its large size, ice-cored moraine, potential for an avalanche, rockfall and/or upstream GLOF to enter the lake, and potential for severe downstream impacts (Rounce et al., 2017a). Given the high risk, more detailed modeling of potential GLOF process chains is needed and these results should be disseminated to the local community members.
Kedarnath Flood and Debris Flow
From June 15 to 17, 2013, an unprecedented hydrometeorological event occurred, which filled Chorabari Lake and induced a snow avalanche and debris slide that triggered an outburst flood from the lake (Das et al., 2015; Allen et al., 2016b; Bhambri et al., 2016). The outburst flood paired with the extreme rainfall caused severe flooding that devastated the downstream region, which included multiple mass wasting events along the Mandakini and Saraswati rivers and associated tributaries (Figure 8). Farther downstream, several other landslides blocked the river at various points, forming temporary lakes that subsequently outburst and caused a massive flood and debris flow (Sati and Gahalaut, 2013; Ziegler et al., 2014). The Kedarnath disaster killed more than 6,000 people and also affected 30 hydropower plants (Allen et al., 2016b), causing a total economic loss >$3.8 billion (World Bank, 2014). It also damaged countless roads and bridges, which stranded 100,000 individuals who were taking part in an annual Hindu pilgrimage to Kedarnath Temple.
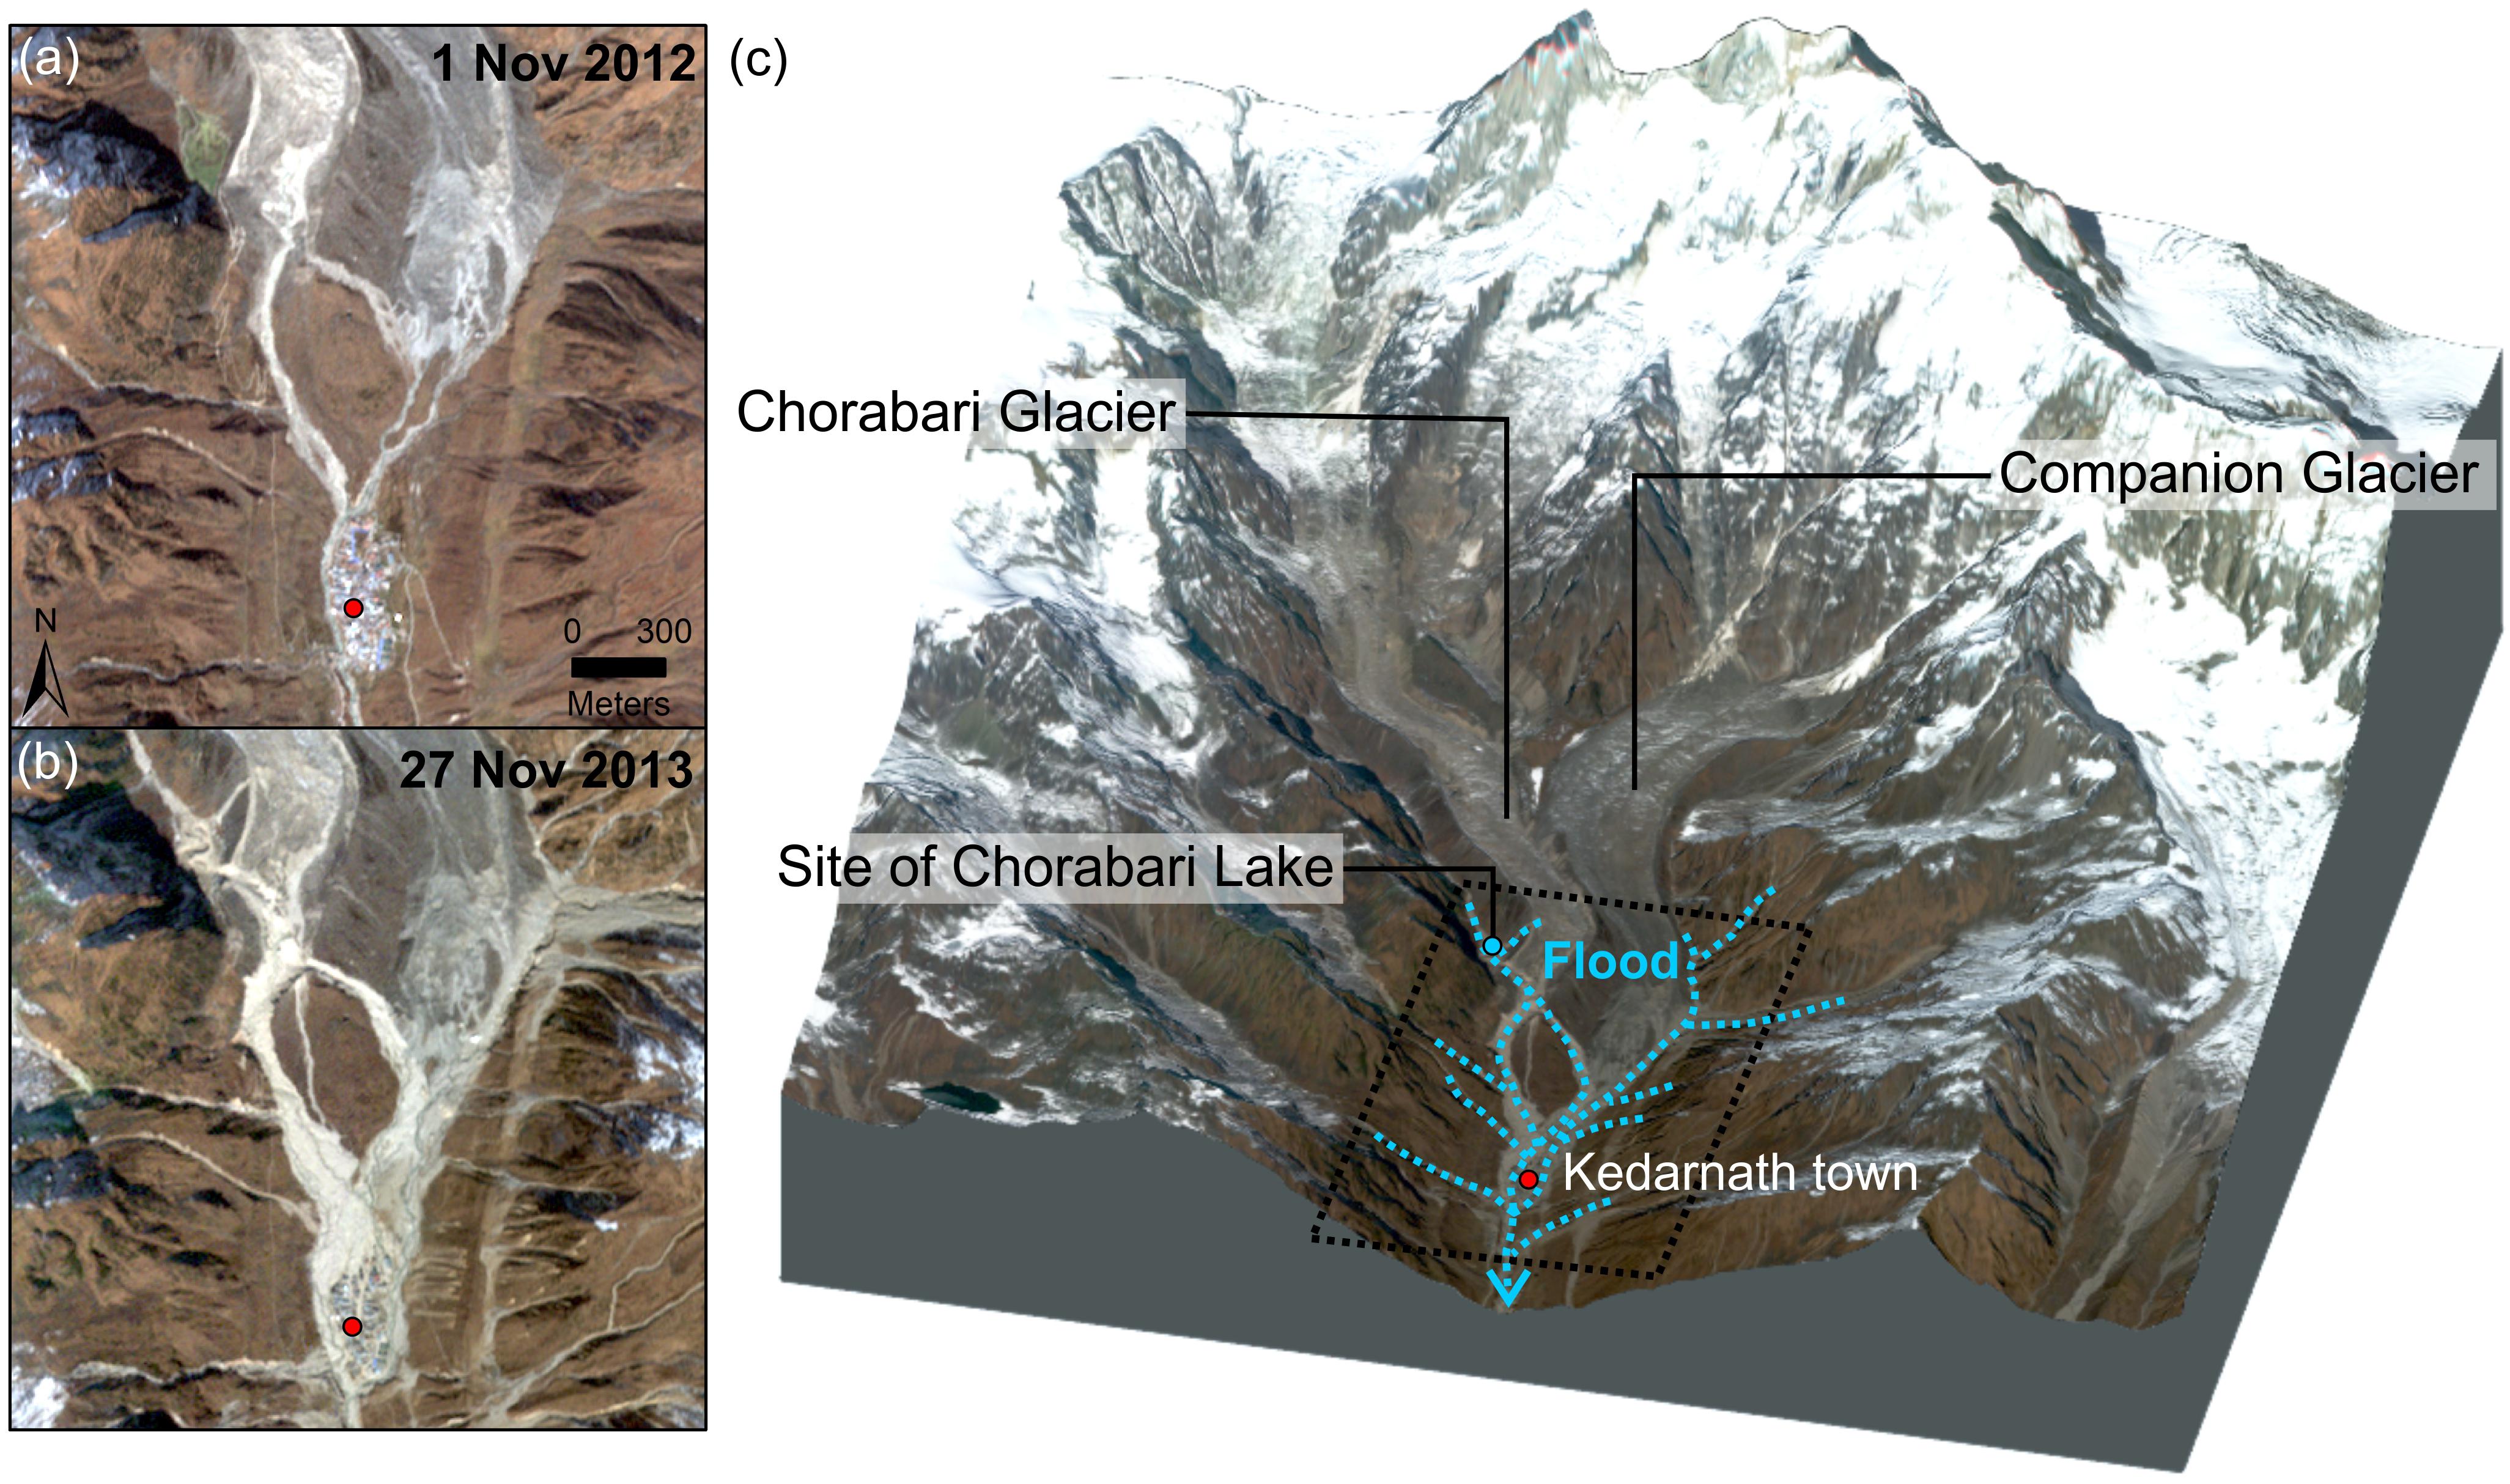
Figure 8. Aerial view of Kedarnath town with (a) pre and (b) post-event RapidEye imagery from November 1, 2012 and November 13, 2013 (Planet Team, 2018). (c) Shows provides a broader view of the source areas, location of the Chorabari Lake, and direction of flooding associated with the Kedarnath debris flow (right).
A high altitude meteorological station at the base camp of Chorabari Glacier recorded 325 mm of rainfall in 24 h (Bhambri et al., 2016), while a downstream location observed as much as 680 mm in 2 days (Rautela, 2018). According to the Indian Meteorological Department and Geological Survey of India, this rain was ∼375% more than the daily mean during the monsoon period (Dube et al., 2014). While Chorabari Lake is not connected to the glacier and not always brimful, its lack of outlet and the surrounding topography cause it to be uncharacteristically predisposed to infilling during an extreme snowmelt or rain event (Allen et al., 2016b). An analysis of Corona and Cartosat-1 satellite images paired with the SRTM DEM suggested that the high-intensity rainfall that occurred in the valley filled the lake with an estimated maximum volume of 0.43 m3 × 106 before its breach (Das et al., 2015).
Reconstruction of the hydrometeorology conditions prior to the event using climate data from automatic weather stations, TRMM precipitation, and MODIS snow cover data, revealed the Kedarnath disaster was exacerbated by previous monsoon-driven precipitation, especially heavy rainfall on June 10 and 11 and summer snowmelt from the end of May that led to slope saturation (Durga Rao et al., 2014; Allen et al., 2016b). Bhambri et al. (2016) used a combination of multispectral satellite data including Resourcesat Linear Imaging Self-Scanning sensor (LISS) IV images, panchromatic Cartosat-2 (1 m), and WorldView-2 (2 m), to identify 137 flash flood-induced debris flow events. They also observed a ∼500% increase in flood-affected area by the Mandakini River along with a change in the course of the Mandakini and Saraswati rivers. Martha et al. (2015) used Resourcesat-2 LISS-IV, GeoEye-1, and Cartosat-2a to map 3,472 new and 1,401 reactivated landslides due to this event.
Synthesis of Gaps, View Forward and Discussion
The case studies highlighted in Section “Case Studies of Cascading Hazards Over HMA” provide insight into how satellite remote sensing data can be used to investigate the complexities of cascading effects in HMA. These case studies also demonstrate the need for better integrated methods for monitoring and predicting cascading hazard process chains and webs to determine at risk populations and infrastructure and to build resilience for current and future hazards. This section offers a perspective on future opportunities to address gaps and challenges in our current capabilities to more systematically understand cascading hazards and risks over HMA.
Challenges and Gaps
The case studies from Section “Case Studies of Cascading Hazards Over HMA” show that remote sensing is a valuable resource for monitoring and modeling cascading hazards; however, with the exception of sites that are prone to repeat events (e.g., GLOFs from Kyagar and Khurdophin Glacier surges), most studies in HMA are still performed retroactively. These case studies showcase the tremendous opportunities that exist in both present-day and future missions that may be used to limit the risks associated with these cascading hazards. At present, some of the major limitations result from the complex terrain in HMA that cause issues for the generation of DEMs in steep topography or geometric distortions in SAR data, and from the difficulty of obtaining optical or stereo imagery during the monsoon. Furthermore, while the individual elements associated with these cascading hazards are well known (e.g., extreme rainfall, landslides, outburst floods), we still have relatively few observations that can be used to develop our understanding and improve our ability to model these cascading hazards. As a result, the state of science in effectively characterizing or modeling the linkages between cascading hazard elements remains limited within this region and should be an area of concentrated research going forward.
Given that DEMs are fundamental for our ability to observe and model these cascading hazards, the recent advances in generating multi-temporal high-resolution DEMs (see Opportunities: Missions, Modeling, Technologies) provides unique opportunities to advance our understanding of specific elements of the triggering mechanisms. For example, few observations exist of landslide and avalanche volumes and runout lengths in HMA, which is a critical input for any GLOF assessment. New and planned missions that will produce additional ground control points (e.g., ICESat-2) provide opportunities to minimize the errors/uncertainty associated with steep topography and thereby more accurately quantify the volume change in steep topography.
Additionally, given the reactionary nature of most existing studies, efforts should be made in HMA to continue to collect baseline data that is essential for effective hazard assessments, modeling, and relief efforts. For example, high-resolution optical imagery and the VIIRS “Day-Night Band” sensor provide unique opportunities to characterize land, buildings, and transportation networks that could supplement OpenStreetMap and other existing datasets. While the improved spatiotemporal resolution of commercial optical imagery (e.g., Planet and DigitalGlobe) is starting to provide fairly regular images of HMA, even during the monsoon season, monitoring efforts should seek to integrate SAR data that can provide earth observations through cloud cover. The integration of these various datasets, the new observations that may help constrain models of individual elements of the cascading hazards, and improved modeling of the various cascading hazard branches will greatly advance our ability to monitor these hazards and assist risk-mitigation efforts.
Open Data
The availability and openness of satellite data have improved in recent years but still remains both the most fundamental gap and largest opportunity to advance our understanding of cascading hazard and risk processes. Table 1 highlights some of the existing Earth Observation data products and tools that may be valuable to address elements within different cascading hazard settings. Supplementary Table S1 provides an expanded list of remote sensing assets.
Open science is also critical to advancing our understanding of cascading hazards over this region. Inventories of previous events, such as landslides or glacial lakes, are key for calibrating and validating hazard assessment models. One tremendous set of event-based catalogs over HMA are landslide inventories mapped following the 2015 Nepal Earthquakes. Many of these are publicly available, including Kargel et al. (2016) (4,312 landslides), Williams et al. (2018) (5,578 landslides), Martha et al. (2017) (15,551 landslides), Roback et al. (2018) (24,915 landslides), and Tiwari et al. (2017) (14,670 landslides). Other basin-specific inventories are freely accessible over the transboundary Koshi basin (5,653 landslides) (Zhang et al., 2016). There are also global landslide inventories with reasonable coverage over HMA such as NASA’s Global Landslide Catalog, which has been used to identify spatiotemporal trends in landslide patterns (Kirschbaum et al., 2015). Regional and global landslide maps (Kirschbaum, 2015; Stanley and Kirschbaum, 2017) can also provide context for the distribution of this particular hazard over HMA. The GLIMS Glacier Database1, and glacial lake databases (e.g., Rounce et al., 2017a) also provide open access data points to construct hazard maps and ultimately link elements together for better identification of potential cascading hazard areas.
In addition to having historical inventories for calibration and validation of hazards models, remote sensing data and model products, including socioeconomic data, are openly available through NASA’s Distributed Active Archive Centers (DAACs) and other open data efforts such as OpenStreetMap®. However, the availability of ground-based physical data on hydrology and geology of HMA lags satellite data availability and is another need within this region. Through NASA’s High Mountain Asia Program, teams of scientists are contributing to a Glacial Melt Toolbox (GMELT) that includes in situ, remotely sensed, and modeled products that are geared toward improving understanding of regional changes to water resources, and induced impacts through the analysis of HMA’s glaciers, lakes, snow, permafrost, precipitation, and land surface2.
Opportunities: Missions, Modeling, Technologies
New remote sensing products, models, and technologies either in operation or on the horizon are contributing to an advanced, systems-focused understanding of cascading hazard processes. New NASA and ESA missions highlight improved capabilities for characterizing the atmosphere, surface and subsurface in support of disaster response, monitoring, and recovery (see Supplementary Material Section 1 and Supplementary Table S1). Additionally, there are many publicly available platforms that provide open data and visualization capabilities to support disaster response. These include, but are not limited to the Hazard Data Distribution System (HDDS), NASA Disaster Portal, Sentinel-Asia Disaster Management Support System, the European Commission Copernicus Emergency Management Service (Copernicus EMS), the Sentinel-Hub Playground and EO browser, and ESA’s geohazards exploitation platform (GEP). More information on these capabilities are outlined in the Supplementary Material Section 2.
Technologies leveraging a combination of sensors from daily optical imagery (Planet, Sentinel-2) and SAR (Sentinel-1) are being developed to monitor lake expansion, with the goal of transitioning from retrospective analysis to near real-time monitoring. Through open source platforms such as Google Earth Engine or using open source algorithms that can be implemented in the cloud, many of these monitoring technologies may provide a feasible path toward more routine monitoring of cascading hazard elements, a key component of providing rapid response and improved planning for future hazard and risk. Continuous monitoring platforms are also being developed to automate ground deformation workflows on regional (e.g., Raspini et al., 2018) or global scales (e.g., González et al., 2016). The COMET-LiCS platform3 automates the processing of Sentinel-1 data to generate interferograms, coherence maps, and ground displacement data for active tectonic regions globally.
Improved long-term, high-resolution DEM datasets from past, present, and future satellite missions will enable regional quantitative analysis of cascading hazards. Continued tasking of existing submeter satellite imagery constellations (e.g., DigitalGlobe WorldView/GeoEye, AIRBUS/CNES Pléiades) have the potential to offer sub-weekly monitoring of priority sites (e.g., proglacial lakes, landslide-prone corridors) and fill critical gaps in existing regional coverage, providing a continuous DEM basemap with timestamps for future change detection studies. Integrating additional commercial submeter constellations (e.g., Planet SkySat-C satellites with 0.9 m ground sample distance stereo imagery, Earth-i satellites) will further improve regional coverage and response capabilities. Ongoing processing of freely available ASTER imagery will continue the existing 2000-2019 DEM record that can be used for decadal-scale analyses of glacier mass balance. Other high-resolution swath-mapping missions (e.g., Cartosat-2, off-nadir campaigns with Planet Dove constellation) can provide repeat, regional DEM coverage, with slightly lower resolution and accuracy.
Perhaps one of the most exciting opportunities in the coming years will involve mass production and release of orthoimagery and stereo DEMs derived from the declassified Corona, Gambit, and Hexagon missions of the 1960s–1980s (Maurer and Rupper, 2015), which offer extensive coverage over Asia. Recent efforts focused on production workflows for Hexagon Mapping Camera imagery with ∼5–10 m GSD (Maurer and Rupper, 2015; Dehecq et al., 2019; Maurer et al., 2019), providing lower-resolution DEMs with regional coverage, but often containing data gaps over snow or exposed ice, which in some cases can be resolved in higher resolution (<5 m) Corona imagery.
With improved scanning capabilities and modern, automated, open-source photogrammetry tools such as the Ames Stereo Pipeline (Beyer et al., 2018), MicMac (Rupnik et al., 2017), SETSM (Noh et al., 2015) in high-performance computing environments, large archives of high-resolution DEMs can also be generated from these image sources. When combined with data from modern sensors, these historical archives potentially provide a near ∼60-year high-resolution DEM time series from the early 1960s to present. Stereo pairs from commercial imagery such as from DigitalGlobe have been used to create DEMs over HMA with unprecedented accuracy and resolution (Shean et al., 2016). These multi-temporal DEMs have been used to estimate ice flow and changes on glaciers in HMA (Kutuzov et al., 2018; Shean et al., 2018) as well as landslide distributions (Watson et al., 2019). The interferometric SAR constellation TanDEM-X/TerraSAR-X also provides a global, high-resolution DEM at 12 m posting, with unprecedented accuracy, though at present this product is only publically available at a resolution of 90 m4.
In addition to satellite data that will be provided through new and upcoming satellite missions, there are a suite of modeling and data assimilation systems that may help to better characterize the cascading hazard process chains. LDAS modeling platforms, such as the Land Information System (LIS), and GCMs can provide important hydrologic and atmospheric inputs for characterizing the triggering factors that may exacerbate or modulate elements in the cascading hazard chain. GMELT provides many of these modeling outputs and forecasted products to help quantify potential changes over HMA on scales that could inform hazard processes, such as how glacier changes may influence glacial lake distributions, areas, and potential glacial outburst floods or how changes in permafrost may affect landslide distributions. Other efforts such as flood routing models can provide a framework for exploring the connectivity among elements in the cascading hazard chains and webs such as the behavior for how a GLOF may impact downstream populations (Westoby et al., 2015; Schwanghart et al., 2016; Rounce et al., 2017a).
Risk Assessment and Future Change
Inherent to addressing societal impacts and risk from cascading hazards is to better quantify the assets and socioeconomic indicators that make populations at risk. There are many globally-available datasets that can inform exposed elements, including population (GPW v4; Table 1), roads and buildings (OpenStreetMap; Table 1), and other transportation corridors (national-level data). While valuable for quantifying exposure, to ultimately get to risk calculations, loss and damage or vulnerability relationships need to be established (Huggel et al., 2018). Modeling frameworks such as RiskScape5 have successfully been implemented to estimate the impact of natural hazards in New Zealand (RiskScape, 2019; King and Bell, 2006). Such open source frameworks could provide future opportunities to derive cost, impact, and risk estimates for cascading hazards within HMA; however, they are still largely limited by a dearth of vulnerability data (including socioeconomic and financial information) that is needed to accurately parameterize loss and damage curves to derive risk.
National and regional heterogeneity in hazard assessment techniques is inevitable due to differences in Data Availability, technological capabilities, and management authorities, which translate hazard assessments into a risk management strategy. International guiding documents such as the Global Assessment Report (GAR15) put out by the United Nations Office for Disaster Risk Reduction (UNISDR, 2015) is the fourth in the series prepared by the UNISDR based on the recommendations and agreements of the 168 member states participating in the Hyogo Framework for Action. The 2015 GAR’s theme is Making Development Sustainable: The Future of Disaster Risk Management and provides context and guidance on the multi-faceted umbrella of disaster risk management in both current and future environments. The UNISDR is also preparing the Global Risk Assessment Framework (GRAF; UNISDR, 2019), which seeks to improve understanding and management of current and future risks by providing actionable tools, data, and examples at different spatiotemporal scales to decision makers. At a regional level, technical guidance documents from scientific working groups such as Glacier and Permafrost Hazards in Mountains (GAPHAZ) provide guidelines and standards for hazard assessments that collate the current state of knowledge, modeling tools, and remote sensing data (GAPHAZ, 2017). Multi-temporal standardized valuations for the same geographic areas are essential to monitor and mitigate against the changing hazard environment.
In addition to quantifying the risk, understanding how hazard and risk may change over time due to climate change is critical. Climate change, including shifts in precipitation and the ability of surface water to reach the bed of glaciers, is thought to have already resulted in dramatically changing behavior in some regions (e.g., Gilbert et al., 2018). Climate change may herald new glacier dynamical behaviors in permafrost regions of HMA and worldwide, including sudden or gradual shifts in the locations of hazard dynamics such as GLOFs (e.g., Allen et al., 2016a). Data from GCMs offer a window into future behavior of HMA as the climate warms, including decreasing glacial volume (Brun et al., 2017; Farinotti et al., 2019), glacier stagnation (Dehecq et al., 2019), role of black carbon in glacial melting (Kopacz et al., 2011; Warren, 2013), and improved conditions for glacial lake development (Quincey et al., 2007; Linsbauer et al., 2016). However, more work needs to be done to improve the resolution of climate models in order to better resolve precipitation extremes, preconditioning factors and other meteorological forcing data that will have a direct impact on the changing nature of cascading hazard processes in the future. New data on precipitation extremes over HMA is available within the GMELT toolbox, including satellite precipitation metrics and GCM projections of precipitation (NSIDC, 2019). Further research is also needed to quantify how climate change may exacerbate or alter elements and connections within cascading hazards chains over HMA. In addition to improving our understanding of these impacts, it is vital to also work with national and local governments and local communities to communicate the science being developed (e.g., Frey et al., 2018). Improved knowledge of these processes will support creation of actionable DSSs and development plans that ultimately will help to build resilience of cascading hazard impacts at the local level.
Conclusion
This work provides a survey of how remote sensing data may inform characterization, mapping, and modeling efforts for cascading hazard processes, chains, and webs across HMA. At present, the cascading process chain is broken down into specific elements in order to highlight opportunities and challenges in our ability to observe and model each element using remote sensing. As these fields advance and more observations become available to constrain models, research on connecting these individual elements as interconnected systems will become more feasible. Through illustrating how cascading hazard elements can be evaluated individually as well as in a sequence through example case studies, this work highlights the opportunities for using remote sensing data and derived products to inform hazard evolution within this region under changing climatic and socioeconomic conditions. Given the availability of new and open data sources, model products and technologies as well as team efforts to compile databases such as GMELT, there are a wealth of opportunities on the horizon for more systematic considerations of cascading hazard processes and their impacts. These data and tools can also enable the community to move from retrospective analysis to near real-time routine monitoring and forecasting. We emphasize here the potential for using remote sensing data and modeled products to consider cascading hazards as an integrated system. However, along with the availability and development of new data products for this region, it is vital to advance the processing systems that are best suited to handle these large volumes of data, including cloud computing and open source platforms. We encourage future studies to consider the propagation of triggers all the way through to societal impacts so that this information may be both scientifically accurate as well as societally relevant and provide actionable information to increase societal resilience to these hazards.
Data Availability
The datasets provided by the High Mountain Asia project can be found in the NASA Distributed Active Archive Center (DAAC) at the National Snow & Ice Data Center, https://nsidc.org/data/highmountainasia/data-summaries.
Author Contributions
DK, CW, DR, DS, JK, UH, PA, DS, EA, and MJ conferred on the content of this manuscript. CW primarily developed the figures. All authors contributed to writing of this manuscript.
Funding
This work was supported by the NASA’s High Mountain Asia Program (NNH15ZDA001N) under the following grants NNX16AT79G (DK and PA), NNX16AQ62G and its third-year continuation (JK, UH, CW, and DS), NNX17AB27G (DR), NNX16AQ88G (DS), NNX16AT79G (EA), and 15-HMA15-0037 (MJ). This work was also partly supported by the NASA IDS grant 80NSSC18K0432 (JK, UH, and CW).
Conflict of Interest Statement
The authors declare that the research was conducted in the absence of any commercial or financial relationships that could be construed as a potential conflict of interest.
Acknowledgments
This project was carried out using CSK® Products, © ASI (Italian Space Agency), delivered under an ASI license to use. The images for the Jure landslide analysis were made available by the Italian Space Agency (https://www.asi.it/) through the Committee on Earth Observation Satellites (CEOS) Working Group on Disasters. The Planet Labs Education and Research Program are thanked for providing access to RapidEye imagery. Figures 5, 7 contain modified Copernicus Sentinel data (2017). Block diagrams were created using the R package ‘rayshader’ and the AW3D30 DEM provided by the Japan Aerospace Exploration Agency (http://www.eorc.jaxa.jp/ALOS/en/aw3d30/index.htm) ©JAXA. The authors would also like to thank the NASA Disasters Program, NASA SERVIR Program-Himalaya Hub and NASA High Mountain Asia team for their role in encouraging the ideas for this paper and their sustained support for hazard and disaster research in the High Mountain Asia region. Thanks to Dr. Jeanne Sauber-Rosenberg for her feedback on section “Earthquakes.” We greatly acknowledge the three reviewers who helped to improve the quality and content of this manuscript.
Supplementary Material
The Supplementary Material for this article can be found online at: https://www.frontiersin.org/articles/10.3389/feart.2019.00197/full#supplementary-material
Footnotes
- ^ https://nsidc.org/glims
- ^ https://nsidc.org/data/highmountainasia
- ^ https://comet.nerc.ac.uk/COMET-LiCS-portal/
- ^ https://tandemx-science.dlr.de/
- ^ https://www.riskscape.org.nz/
References
Acharya, T., Mainali, S., Yang, I., and Lee, D. (2016). Analysis of jure landslide dam, sindhupalchowk using gis and remote sensing. Int. Arch. Photogr. Remote Sens. Spat. Inform. Sci. XLI-B6, 201–203. doi: 10.5194/isprsarchives-XLI-B6-201-2016
Allen, S. K., Linsbauer, A., Randhawa, S. S., Huggel, C., Rana, P., and Kumari, A. (2016a). Glacial lake outburst flood risk in Himachal Pradesh, India: an integrative and anticipatory approach considering current and future threats. Nat. Hazards 84, 1741–1763. doi: 10.1007/s11069-0162511-x
Allen, S. K., Rastner, P., Arora, M., Huggel, C., and Stoffel, M. (2016b). Lake outburst and debris flow disaster at Kedarnath, June 2013: hydrometeorological triggering and topographic predisposition. Landslides 13, 1479–1491. doi: 10.1007/s10346-015-0584-3
Ambrosi, C., Strozzi, T., Scapozza, C., and Wegmüller, U. (2018). Landslide hazard assessment in the Himalayas (Nepal and Bhutan) based on earth-observation data. Eng. Geol. 237, 217–228. doi: 10.1016/J.ENGGEO.2018.02.020
Andermann, C., Bonnet, S., and Gloaguen, R. (2011). Evaluation of precipitation data sets along the Himalayan front. Geochem. Geophys. Geosyst. 12, 785–814. doi: 10.1029/2011GC003513
Anders, A. M., Roe, G. H., Hallet, B., Montgomery, D. R., Finnegan, N. J., and Putkonen, J. (2006). Spatial patterns of precipitation and topography in the Himalaya. Spec. Pap. Geol. Soc. Am. 398, 39–53. doi: 10.1130/2006.2398(03)
Anderson, E. R., Griffin, R. E., Irwin, D. E. (2016). “Implications of different digital elevation models and preprocessing techniques to delineate debris flow inundation hazard zones in El Salvador,” in Natural Hazard Uncertainty Assessment, eds K. Riley, P. Webley, M. Thompson, and P. Webley (Hoboken, NJ: John Wiley & Sons, Inc.). doi: 10.1002/9781119028116.ch11
Avtar, R., Singh, C., Singh, G., Verma, R., Mukherjee, S., and Sawada, H. (2011). Landslide susceptibility zonation study using remote sensing and GIS technology in the Ken-Betwa River Link area, India. Bull. Eng. Geol. Environ. 70, 595–606. doi: 10.1007/s10064-011-0368-5
Barros, A. P., Kim, G., Williams, E., and Nesbitt, S. W. (2004). Probing orographic controls in the Himalayas during the monsoon using satellite imagery. Nat. Hazards Earth Syst. Sci. 4, 29–51. doi: 10.5194/nhess-4-29-2004
Benn, D. I., Bolch, T., Hands, K., Gulley, J., Luckman, A., Nicholson, L. I., et al. (2012). Response of debris-covered glaciers in the Mount Everest region to recent warming, and implications for outburst flood hazards. Earth Sci. Rev. 114, 156–174. doi: 10.1016/J.EARSCIREV.2012.03.008
Berardino, P., Fornaro, G., Lanari, R., and Sansosti, E. (2002). A new algorithm for surface deformation monitoring based on small baseline differential SAR interferograms. IEEE Trans. Geosci. Remote Sens. 40, 2375–2383. doi: 10.1109/tgrs.2002.803792
Beyer, R. A., Alexandrov, O., and McMichael, S. (2018). The Ames Stereo Pipeline: NASA’s open source software for deriving and processing terrain data. Earth Space Sci. 5, 537–548. doi: 10.1029/2018EA000409
Bhambri, R., Mehta, M., Dobhal, D. P., Gupta, A. K., Pratap, B., Kesarwani, K., et al. (2016). Devastation in the Kedarnath (Mandakini) Valley, Garhwal Himalaya, during 16–17 June 2013: a remote sensing and ground-based assessment. Nat. Hazards 80, 1801–1822. doi: 10.1007/s11069-015-2033-y
Bhattacharya, A., Mukherjee, K., Kuri, M., Vöge, M., Sharma, M. L., Arora, M. K., et al. (2015). Potential of SAR intensity tracking technique to estimate displacement rate in a landslide-prone area in Haridwar region, India. Nat. Hazards 79, 2101–2121. doi: 10.1007/s11069-015-1949-6
Blaschke, T., Burnett, C., and Pekkarinen, A. (2004). “Image segmentation methods for object-based analysis and classification,” in Remote Sensing Image Analysis: Including the Spatial Domain, eds S. M. D. Jong and F. D. V. Meer (Dordrecht: Springer), 211–236. doi: 10.1007/978-1-4020-2560-0_12
Bolch, T., Shea, J. M., Liu, S., Azam, F. M., Gao, Y., Gruber, S., et al. (2019). “Status and change of the cryosphere in the extended Hindu Kush Himalaya Region,” in The Hindu Kush Himalaya Assessment: Mountains, Climate Change, Sustainability and People, eds P. Wester, A. Mishra, A. Mukherji, and A. B. Shrestha (Lalitpur: ICIMOD), doi: 10.1007/978-3-319-92288-1
Brun, F., Berthier, E., Wagnon, P., Kääb, A., and Treichler, D. (2017). A spatially resolved estimate of High Mountain Asia glacier mass balances from 2000 to 2016. Nat. Geosci. 10, 668–673. doi: 10.1038/ngeo2999
Butz, D., and Cook, N. (2015). “Political ecology of human-environment change in Gojal, GilgitBaltistan, Pakistan,” in Advances in Asian Human-Environmental Research, eds H. Kreutzmann and T. Watanabe (Cham: Springer), 197–214. doi: 10.1007/978-3-319-23198-3_13
Byers, A. C., Rounce, D. R., Shugar, D. H., Lala, J. M., Byers, E. A., and Regmi, D. (2018). A rockfall-induced glacial lake outburst flood, Upper Barun Valley, Nepal. Landslides 16, 533–549. doi: 10.1007/s10346-018-1079-9
Cardona, O., Aalst, M., Birkmann, J., Fordham, M., Mcgregor, G., Perez, R., et al. (2012). “Determinants of risk: exposure and vulnerability,” in Managing the Risks of Extreme Events and Disasters to Advance Climate Change Adaptation, eds C. B. Field, V. Barros, T. F. Stocker, D. Qin, D. J. Dokken, K. L. Ebi, et al. (Cambridge: Cambridge University Press), doi: 10.1017/CBO9781139177245.005
Carey, M. (2005). Living and dying with glaciers: people’s historical vulnerability to avalanches and outburst floods in Peru. Glob. Planet. Change 47, 122–134. doi: 10.1016/j.gloplacha.2004.10.007
Carrivick, J. L. (2006). Application of 2D hydrodynamic modelling to high-magnitude outburst floods: an example from Kverkfjöll, Iceland. J. Hydrol. 321, 187–199. doi: 10.1016/j.jhydrol.2005.07.042
Carrivick, J. L., Turner, A. G. D., Russell, A. J., Ingeman-Nielsen, T., and Yde, J. C. (2013). Outburst flood evolution at Russell Glacier, western Greenland: effects of a bedrock channel cascade with intermediary lakes. Quat. Sci. Rev. 67, 39–58. doi: 10.1016/j.quascirev.2013.01.023
Carrivick, J. L., and Tweed, F. S. (2013). Proglacial lakes: character, behaviour and geological importance. Quat. Sci. Rev. 78, 34–52. doi: 10.1016/j.quascirev.2013.07.028
Carrivick, J. L., and Tweed, F. S. (2016). A global assessment of the societal impacts of glacier outburst floods. Glob. Planet. Change 144, 1–16. doi: 10.1016/j.gloplacha.2016.07.001
Casson, B., Delacourt, C., Baratoux, D., and Allemand, P. (2003). Seventeen years of the “La Clapière” landslide evolution analysed from ortho-rectified aerial photographs. Eng. Geol. 68, 123–139. doi: 10.1016/S0013-7952(02)00201-6
Casu, F., Manconi, A., Pepe, A., and Lanari, R. (2011). Deformation time-series generation in areas characterized by large displacement dynamics: the SAR amplitude pixel-offset SBAS technique. IEEE Trans. Geosci. Remote Sens. 49, 2752–2763. doi: 10.1109/TGRS.2010.2104325
Cenderelli, D. A., and Wohl, E. E. (2003). Flow hydraulics and geomorphic effects of glacial-lake outburst floods in the Mount Everest region, Nepal. Earth Surf. Process. Landforms 28, 385–407. doi: 10.1002/esp.448
Center for International Earth Science Information Network[CIESIN] - Columbia University, and Information Technology Outreach Services -[ITOS]- University of Georgia (2013). Global Roads Open Access Data Set, Version 1 (gROADSv1). Palisades, NY: NASA Socioeconomic Data and Applications Center (SEDAC). doi: 10.7927/H4VD6WCT
Clague, J. J., and Evans, S. G. (2000). A review of catastrophic drainage of moraine-dammed lakes in British Columbia. Quat. Sci. Rev. 19, 1763–1783. doi: 10.1016/S0277-3791(00)00090-1
Cloude, S. R., and Pottier, E. (1996). A review of target decomposition theorems in radar polarimetry. IEEE Trans. Geosci. Remote Sens. 34, 498–518. doi: 10.1109/36.485127
Cloude, S. R., and Pottier, E. (1997). An entropy based classification scheme for land applications of polarimetric SAR. IEEE Trans. Geosci. Remote Sens. 35, 68–78. doi: 10.1109/36.551935
Cole, T., Wanik, D., Molthan, A., Román, M., and Griffin, R. (2017). Synergistic use of nighttime satellite data, electric utility infrastructure, and ambient population to improve power outage detections in urban areas. Remote Sens. 9:286. doi: 10.3390/rs9030286
Colesanti, C., and Wasowski, J. (2006). Investigating landslides with space-borne synthetic aperture radar (SAR) interferometry. Eng. Geol. 88, 173–199. doi: 10.1016/j.enggeo.2006.09.013
Cook, K. L., Andermann, C., Gimbert, F., Adhikari, B. R., and Hovius, N. (2018). Glacial lake outburst floods as drivers of fluvial erosion in the Himalaya. Science 362, 53–57. doi: 10.1126/science.aat4981
Cook, N., and Butz, D. (2016). Mobility justice in the context of disaster. Mobilities 11, 400–419. doi: 10.1080/17450101.2015.1047613
Cook, S. J., and Quincey, D. J. (2015). Estimating the volume of Alpine glacial lakes. Earth Surf. Dyn. 3, 559–575. doi: 10.5194/esurf-3-559-2015
Costa, J. E., and Schuster, R. L. (1988). The formation and failure of natural dams. GSA Bull. 100, 1054–1068. doi: 10.3133/ofr87392
Cui, Y., Cheng, D., Choi, C. E., Jin, W., Lei, Y., and Kargel, J. S. (2019). The cost of rapid and haphazard urbanization: lessons learned from the Freetown landslide disaster. Landslides 16, 1167–1176. doi: 10.1007/s10346-019-01167-x
Czuchlewski, K. R., Weissel, J. K., and Kim, Y. (2003). Polarimetric synthetic aperture radar study of the Tsaoling landslide generated by the 1999 Chi-Chi earthquake, Taiwan. J. Geophys. Res. 108: NO. F1, 6006. doi: 10.1029/2003JF000037
Daanen, R. P., Grosse, G., Darrow, M. M., Hamilton, T. D., and Jones, B. M. (2012). Rapid movement of frozen debris-lobes: implications for permafrost degradation and slope instability in the south-central Brooks Range, Alaska. Nat. Hazards Earth Syst. Sci. 12, 1521–1537. doi: 10.5194/nhess-12-1521-2012
Dal Zilio, L., van Dinther, Y., Gerya, T., and Avouac, J.-P. (2019). Bimodal seismicity in the Himalaya controlled by fault friction and geometry. Nat. Commun. 10:48. doi: 10.1038/s41467-018-07874-8
Das, S., Kar, N. S., and Bandyopadhyay, S. (2015). Glacial lake outburst flood at Kedarnath, Indian Himalaya: a study using digital elevation models and satellite images. Nat. Hazards 77, 769–786. doi: 10.1007/s11069-015-1629-6
Dehecq, A., Gourmelen, N., Gardner, A. S., Brun, F., Goldberg, D., Nienow, P. W., et al. (2019). Twenty-first century glacier slowdown driven by mass loss in High Mountain Asia. Nat. Geosci. 12, 22–27. doi: 10.1038/s41561-018-0271-9
Deline, P. (2001). Recent Brenva rock avalanches (Valley of Aosta): new chapter in an old story? Geogr. Fis. e Din. Quat. 5, 55–63.
Deloitte Access Economics (2016). The Economic Cost of the Social Impact of Natural Disasters. Available at: http://australianbusinessroundtable.com.au/assets/documents/Report%20-%20Social%20costs/Report%20-%20The%20economic%20cost%20of%20the%20social%20impact%20of%20natural%20disasters.pdf
Dou, J., Chang, K.-T., Chen, S., Yunus, A., Liu, J.-K., Xia, H., et al. (2015). Automatic case-based reasoning approach for landslide detection: integration of object-oriented image analysis and a genetic algorithm. Remote Sens. 7, 4318–4342. doi: 10.3390/rs70404318
Dredge, L. A. (1992). Breakup of limestone bedrock by frost shattering and chemical weathering, Eastern Canadian Arctic. Arct. Alp. Res. 24, 314–323. doi: 10.1080/00040851.1992.12002963
Dube, A., Ashrit, R., Ashish, A., Sharma, K., Iyengar, G. R., Rajagopal, E. N., et al. (2014). Forecasting the heavy rainfall during Himalayan flooding—June. (2013). Weather Clim. Extrem. 4, 22–34. doi: 10.1016/J.WACE.2014.03.004
Durga Rao, K. H. V., Rao, V., Dadhwal, V., and Diwakar, P. (2014). Kedarnath flash floods: a hydrological and hydraulic simulation study. Curr. Sci. 106, 598–603.
Elliott, J. R., Walters, R. J., and Wright, T. J. (2016). The role of space-based observation in understanding and responding to active tectonics and earthquakes. Nat. Commun. 7:13844. doi: 10.1038/ncomms13844
Evans, S. G., and Clague, J. J. (1994). Recent climatic change and catastrophic geomorphic processes in mountain environments. Geomorphology 10, 107–128. doi: 10.1016/B978-0-444-82012-9.50012-8
Falátková, K. (2016). Temporal analysis of GLOFs in high-mountain regions of Asia and assessment of their causes. AUC Geogr. 51, 145–154. doi: 10.14712/23361980.2016.12
Farinotti, D., Huss, M., Fürst, J. J., Landmann, J., Machguth, H., Maussion, F., et al. (2019). A consensus estimate for the ice thickness distribution of all glaciers on Earth. Nat. Geosci. 12, 168–173. doi: 10.1038/s41561-019-0300-3
Ferretti, A., Fumagalli, A., Novali, F., Prati, C., Rocca, F., and Rucci, A. (2011). A new algorithm for processing interferometric data-stacks: SqueeSAR. IEEE Trans. Geosci. Remote Sens. 49, 3460–3470. doi: 10.1109/tgrs.2011.2124465
Ferretti, A., Prati, C., and Rocca, F. (2001). Permanent scatterers in SAR interferometry. IEEE Trans. Geosci. Remote Sens. 39, 8–20. doi: 10.1109/36.898661
Freeman, A., and Durden, S. L. (1998). A three-component scattering model for polarimetric SAR data. IEEE Trans. Geosci. Remote Sens. 36, 963–973. doi: 10.1109/36.673687
Frey, H., Huggel, C., Chisolm, R. E., Baer, P., McArdell, B., Cochachin, A., et al. (2018). MultiSource Glacial Lake outburst flood hazard assessment and mapping for Huaraz, Cordillera Blanca, Peru. Front. Earth Sci. 6:210. doi: 10.3389/feart.2018.00210
Froude, M. J., and Petley, D. N. (2018). Global fatal landslide occurrence from 2004 to 2016. Nat. Hazards Earth Syst. Sci. 18, 2161–2181. doi: 10.5194/nhess-18-2161-2018
Funk, C., Peterson, P., Landsfeld, M., Pedreros, D., Verdin, J., Shukla, S., et al. (2015). The climate hazards infrared precipitation with stations—a new environmental record for monitoring extremes. Sci. Data 2:150066. doi: 10.1038/sdata.2015.66
GAPHAZ (2017). “Assessment of glacier and permafrost hazards in mountain regions – technical guidance document,” in Proceedings of the Standing Group on Glacier and Permafrost Hazards in Mountains (GAPHAZ) of the International Association of Cryospheric Sciences (IACS) and the International Permafrost Association (IPA), eds S. Allen, H. Frey, and C. Huggel (Zurich/Lima: GAPHAZ), 72.
Gardelle, J., Arnaud, Y., and Berthier, E. (2011). Contrasted evolution of glacial lakes along the Hindu Kush Himalaya mountain range between 1990 and 2009. Glob. Planet Change 75, 47–55. doi: 10.1016/j.gloplacha.2010.10.003
George, D. L., Iverson, R. M., and Cannon, C. M. (2017). New methodology for computing tsunami generation by subaerial landslides: application to the 2015 Tyndall Glacier landslide. Alaska. Geophys. Res. Lett. 44, 7276–7284. doi: 10.1002/2017gl074341
Gilbert, A., Leinss, S., Kargel, J., Kääb, A., Gascoin, S., Leonard, G., et al. (2018). Mechanisms leading to the 2016 giant twin glacier collapses, Aru Range, Tibet. Cryosphere 12, 2883–2900. doi: 10.5194/tc-12-2883-2018
Gill, J. C., and Malamud, B. D. (2016). Hazard interactions and interaction networks (cascades) within multi-hazard methodologies. Earth Syst. Dyn. 7, 659–679. doi: 10.5194/esd-7-659-2016
González, P. J., Walters, R. J., Hatton, E. L., Spaans, K., McDougall, A., Hooper, A. J., et al. (2016). “LiCSAR: tools for automated generation of Sentinel-1 frame interferograms,” in Proceedings of the 2016 AGU Fall Meeting Abstract G23A-1037, San Francisco, CA.
Griswold, J. P., and Iverson, R. M. (2008). Mobility Statistics and Automated Hazard Mapping for Debris Flows and Rock Avalanches. Available at: https://pubs.usgs.gov/sir/2007/5276/ (accessed April 1, 2019).
Gruber, S. (2012). Derivation and analysis of a high-resolution estimate of global permafrost zonation. Cryosphere 6, 221–233. doi: 10.5194/tc-6-221-2012
Gruber, S., and Haeberli, W. (2007). Permafrost in steep bedrock slopes and its temperature-related destabilization following climate change. J. Geophys. Res. 112:F02S18. doi: 10.1029/2006JF000547
Gunn, J. P. (1930). The shyok flood, 1929. Himal. J. 2. Available at: https://www.himalayanclub.org/hj/02/5/the-shyok-flood-1929/
Gurung, D. R., Khanal, N. R., Bajracharya, S. R., Tsering, K., Joshi, S., Tshering, P., et al. (2017). Lemthang Tsho glacial Lake outburst flood (GLOF) in Bhutan: cause and impact. Geoenviron. Disast. 4:17. doi: 10.1186/s40677-017-0080-2
Haeberli, W., Schaub, Y., and Huggel, C. (2017). Increasing risks related to landslides from degrading permafrost into new lakes in de-glaciating mountain ranges. Geomorphology 293, 405–417. doi: 10.1016/J.GEOMORPH.2016.02.009
Haemmig, C., Huss, M., Keusen, H., Hess, J., Wegmüller, U., Ao, Z., et al. (2014). Hazard assessment of glacial lake outburst floods from Kyagar glacier, Karakoram mountains, China. Ann. Glaciol. 55, 34–44. doi: 10.3189/2014AoG66A001
Haider, N. (2012). Disaster in Paradise. Available at: https://www.chinadialogue.net/article/4709 (accessed March 11, 2019).
Han, S.-C., Sauber, J., and Pollitz, F. (2014). Broadscale postseismic gravity change following the 2011 Tohoku-Oki earthquake and implication for deformation by viscoelastic relaxation and afterslip. Geophys. Res. Lett. 41, 5797–5805. doi: 10.1002/2014GL060905
Han, S.-C., Sauber, J., and Riva, R. (2011). Contribution of satellite gravimetry to understanding seismic source processes of the 2011 Tohoku-Oki earthquake. Geophys. Res. Lett. 38:L24312. doi: 10.1029/2011GL049975
Hansen, M. C., Potapov, P. V., Moore, R., Hancher, M., Turubanova, S. A., Tyukavina, A., et al. (2013). High-resolution global maps of 21st-century forest cover change. Science 342, 850–853. doi: 10.1126/science.1244693
Haritashya, U., Kargel, J., Shugar, D., Leonard, G., Strattman, K., Watson, C., et al. (2018). Evolution and controls of large glacial lakes in the Nepal Himalaya. Remote Sens. 10:798. doi: 10.3390/rs10050798
Harrison, S., Kargel, J. S., Huggel, C., Reynolds, J., Shugar, D. H., Betts, R. A., et al. (2018). Climate change and the global pattern of moraine-dammed glacial lake outburst floods. Cryosphere 12, 1195–1209. doi: 10.5194/tc-12-1195-2018
Hashim, M., Misbari, S., and Pour, A. B. (2017). Landslide mapping and assessment by integrating Landsat-8, PALSAR-2 and GIS techniques: a case study from Kelantan State, Peninsular Malaysia. J. Indian Soc. Remote Sens. 46, 233–248. doi: 10.1007/s12524-017-0675-9
Hewitt, K. (1982). Natural dams and outburst floods of the Karakoram Himalaya. Paper Presented at the Hydrological Aspects of Alpine and High Mountain Areas: Proceedings of the Exeter Symposium, IAHS, Wallingford. 259–269. (accessed February 8, 2019).
Hewitt, K. (2007). Tributary glacier surges: an exceptional concentration at Panmah Glacier, Karakoram Himalaya. J. Glaciol. 53, 181–188. doi: 10.3189/172756507782202829
Hewitt, K. (2014). in Glaciers of the Karakoram Himalaya: Glacial Environments, Processes, Hazards and Resources, ed. M. Nusser (Dordrecht: Springer). doi: 10.3189/172756507782202829
Hewitt, K., and Liu, J. (2010). Ice-dammed lakes and outburst floods, Karakoram Himalaya: historical perspectives on emerging threats. Phys. Geogr. 31, 528–551. doi: 10.2747/02723646.31.6.528
Hill, H., Wiener, J., and Warner, K. (2012). From fatalism to resilience: reducing disaster impacts through systematic investments. Disasters 36, 175–194. doi: 10.1111/j.1467-7717.2011.01256.x
Hooper, A. (2008). A multi-temporal InSAR method incorporating both persistent scatterer and small baseline approaches. Geophys. Res. Lett. 35:L16302. doi: 10.1029/2008GL034654
Hooper, A., Zebker, H., Segall, P., and Kampes, B. (2004). A new method for measuring deformation on volcanoes and other natural terrains using InSAR persistent scatterers. Geophys. Res. Lett. 31:L23611. doi: 10.1029/2004GL021737
Huffman, G. J., Adler, R. F., Bolvin, D. T., and Nelkin, E. J. (2010). “The TRMM Multi-satellite Precipitation Analysis (TMPA),” in Satellite Rainfall Applications for Surface Hydrology, eds F. Hossain and M. Gebremichael (Berlin: Springer Verlag), 3–22. doi: 10.1007/978-90-481-2915-7_1
Huffman, G. J., Bolvin, D. T., Braithwaite, D., Hsu, K., Joyce, R. J., and Xie, P. (2018). Algorithm Theoretical Basis Document (ATBD) for NASA Global Precipitation Measurement (GPM) Integrated Multi-satellitE Retrievals for GPM (IMERG) v5.2. Available at: https://pmm.nasa.gov/sites/default/files/document_files/IMERG_ATBD_V5.2_0.pdf (accessed April 1, 2019).
Huggel, C., Caplan-Auerbach, J., Waythomas, C. F., and Wessels, R. L. (2007). Monitoring and modeling ice-rock avalanches from ice-capped volcanoes: a case study of frequent large avalanches on Iliamna Volcano, Alaska. J. Volcanol. Geotherm. Res. 168, 114–136. doi: 10.1016/J.JVOLGEORES.2007.08.009
Huggel, C., Kääb, A., and Salzmann, N. (2004). GIS-based modeling of glacial hazards and their interactions using Landsat-TM and IKONOS imagery. Nor. Geogr. Tidsskr. Nor. J. Geogr. 58, 61–73. doi: 10.1080/00291950410002296
Huggel, C., Muccione, V., Carey, M., James, R., Jurt, C., and Mechler, R. (2018). Loss and Damage in the mountain cryosphere. Reg. Environ. Change 19, 1387–1399. doi: 10.1007/s10113-018-1385-8
Immerzeel, W. W., van Beek, L. P. H., and Bierkens, M. F. P. (2010). Climate change will affect the Asian water towers. Science 328, 1382–1385. doi: 10.1126/science.1183188
Iturrizaga, L. (2005). New observations on present and prehistorical glacier-dammed lakes in the Shimshal valley (Karakoram Mountains). J. Asian Earth Sci. 25, 545–555. doi: 10.1016/j.jseaes.2004.04.011
Iverson, R. M., Schilling, S. P., and Vallance, J. W. (1998). Objective delineation of lahar-inundation hazard zones. Geol. Soc. Am. Bull. 110, 972–984. doi: 10.1130/001676061998110<0972:ODOLIH>2.3.CO;2
Kääb, A., Huggel, C., and Fischer, L. (2006). “Remote sensing technologies for monitoring climate change impacts on glacier- and permafrost-related hazards,” in Proceedings of the 2006 ECI Conference on Geohazards, (Lillehammer), doi: 10.5167/uzh-77035
Kääb, A., Huggel, C., Fischer, L., Guex, S., Paul, F., Roer, I., et al. (2005). Remote sensing of glacier- and permafrost-related hazards in high mountains: an overview. Nat. Hazards Earth Syst. Sci. 5, 527–554. doi: 10.5194/nhess-5-527-2005
Kääb, A., Leinss, S., Gilbert, A., Bühler, Y., Gascoin, S., Evans, S. G., et al. (2018). Massive collapse of two glaciers in western Tibet in 2016 after surge-like instability. Nat. Geosci. 11, 114–120. doi: 10.1038/s41561-017-0039-7
Kappes, M. S., Keiler, M., von Elverfeldt, K., and Glade, T. (2012). Challenges of analyzing multihazard risk: a review. Nat. Hazards 64, 1925–1958. doi: 10.1007/s11069-012-0294-2
Kargel, J. S., Leonard, G., Crippen, R., Delaney, K., Evans, S. G., and Schneider, J. (2010). Satellite monitoring of Pakistan’s Rockslide-Dammed Lake Gojal. Eos 91, 394–395. doi: 10.1029/2010EO02004
Kargel, J. S., Leonard, G. J., Shugar, D. H., Haritashya, U. K., Bevington, A., Fielding, E. J., et al. (2016). Geomorphic and geologic controls of geohazards induced by Nepal’s 2015 Gorkha earthquake. Science 351:aac8353. doi: 10.1126/science.aac8353
Karimzadeh, S., Mastuoka, M., Karimzadeh, S., and Mastuoka, M. (2017). Building damage assessment using multisensor dual-polarized synthetic aperture radar data for the 2016 M 6.2 Amatrice Earthquake, Italy. Remote Sens. 9:330. doi: 10.3390/rs9040330
Kattelmann, R. (2003). Glacial lake outburst floods in the Nepal Himalaya: a manageable hazard? Nat. Hazards 28, 145–154. doi: 10.1023/a:1021130101283
Kazama, M., and Noda, T. (2012). Damage statistics (Summary of the 2011 off the Pacific Coast of Tohoku Earthquake damage). Soils Found. 52, 780–792. doi: 10.1016/J.SANDF.2012.11.003
Kelman, I. (2019). Axioms and actions for preventing disasters. Prog. Disaster Sci. 2:100008. doi: 10.1016/j.pdisas.2019.100008
Keyport, R. N., Oommen, T., Martha, T. R., Sajinkumar, K. S., and Gierke, J. S. (2018). A comparative analysis of pixel- and object-based detection of landslides from very high resolution images. Int. J. Appl. Earth Observ. Geoinform. 64, 1–11. doi: 10.1016/J.JAG.2017.08.015
Khanal, N. R., and Gurung, D. R. (2014). ICIMOD Rapid Field Investigation: Jure Landslide Dam Site Jure, Sindhupalchowk District, Nepal. Lalitpur: ICIMOD.
Khattri, K. N. (1987). Great earthquakes, seismicity gaps and potential for earthquake disaster along the Himalaya plate boundary. Tectonophysics 138, 79–92. doi: 10.1016/0040-1951(87)90067-9
King, A., and Bell, R. (2006). “RiskScape New Zealand: a multihazard loss modelling tool,” in Proceedings of the Conference on. Earthquake Engineering in 21st Century. Napier
King, O., Dehecq, A., Quincey, D., and Carrivick, J. (2018). Contrasting geometric and dynamic evolution of lake and land-terminating glaciers in the central Himalaya. Glob. Planet. Change 167, 46–60. doi: 10.1016/j.gloplacha.2018.05.006
Kirschbaum, D. (2015). Regional Landslide Susceptibility Map. NASA Nepal Earthquake Response. Available at: https://weather.msfc.nasa.gov/sport/disasters/nepal/inducedHazardsLandslidesFloods/landslideSusceptibilityMap/gsfc_preQuakeAnalysis_20150501.html (accessed August 4, 2019).
Kirschbaum, D., Stanley, T., and Zhou, Y. (2015). Spatial and temporal analysis of a global landslide catalog. Geomorphology 249, 4–15. doi: 10.1016/j.geomorph.2015.03.016
Konishi, T., and Suga, Y. (2018). Landslide detection using COSMO-SkyMed images: a case study of a landslide event on Kii Peninsula, Japan. Eur. J. Remote Sens. 51, 205–221. doi: 10.1080/22797254.2017.1418185
Kopacz, M., Mauzerall, D. L., Wang, J., Leibensperger, E. M., Henze, D. K., and Singh, K. (2011). Origin and radiative forcing of black carbon transported to the Himalayas and Tibetan Plateau. Atmos. Chem. Phys. 11, 2837–2852. doi: 10.5194/acp-11-2837-2011
Kougkoulos, I., Cook, S. J., Edwards, L. A., Clarke, L. J., Symeonakis, E., Dortch, J. M., et al. (2018). Modelling glacial lake outburst flood impacts in the Bolivian Andes. Nat. Hazards 94, 1415–1438. doi: 10.1007/s11069-018-3486-6
Kraaijenbrink, P. D. A., Bierkens, M. F. P., Lutz, A. F., and Immerzeel, W. W. (2017). Impact of a global temperature rise of 1.5 degrees Celsius on Asia’s glaciers. Nature 549, 257–260. doi: 10.1038/nature23878
Kutuzov, S., Thompson, L. G., Lavrentiev, I., and Tian, L. (2018). Ice thickness measurements of Guliya ice cap, western Kunlun Mountains (Tibetan Plateau), China. J. Glaciol. 64, 977–989. doi: 10.1017/jog.2018.91
Lacroix, P. (2016). Landslides triggered by the Gorkha earthquake in the langtang valley, volumes and initiation processes. Earth Planets Sp. 68:46. doi: 10.1186/s40623-016-0423-3
Lala, J. M., Rounce, D. R., and Mckinney, D. C. (2018). Modeling the glacial lake outburst flood process chain in the Nepal Himalaya: reassessing Imja Tsho’s hazard. Hydrol. Earth Syst. Sci. 22, 3721–3737. doi: 10.1016/10.5194/hess-22-3721-2018
Lekkas, E., Andreadakis, E., Kostaki, I., and Kapourani, E. (2011). Critical Factors for run-up and impact of the Tohoku Earthquake Tsunami. Int. J. Geosci. 02, 310–317. doi: 10.4236/ijg.2011.23033
Linsbauer, A., Frey, H., Haeberli, W., Machguth, H., Azam, M. F., and Allen, S. (2016). Modelling glacier-bed overdeepenings and possible future lakes for the glaciers in the Himalaya— Karakoram region. Ann. Glaciol. 57, 119–130. doi: 10.3189/2016AoG71A627
Liu, P., Li, Z., Hoey, T., Kincal, C., Zhang, J., Zeng, Q., et al. (2013). Using advanced InSAR time series techniques to monitor landslide movements in Badong of the Three Gorges region, China. Int. J. Appl. Earth Observ. Geoinform. 21, 253–264. doi: 10.1016/J.JAG.2011.10.010
Madson, A., Fielding, E., Sheng, Y., Cavanaugh, K., Madson, A., Fielding, E., et al. (2019). High-resolution spaceborne, airborne and in situ landslide kinematic measurements of the slumgullion landslide in Southwest Colorado. Remote Sens. 11:265. doi: 10.3390/rs11030265
Manconi, A., Casu, F., Ardizzone, F., Bonano, M., Cardinali, M., Luca, C., et al. (2014). Brief communication: rapid mapping of event landslides: the 3 December 2013 Montescaglioso landslide (Italy). Nat. Hazards Earth Syst. Sci. Discuss. 12, 1465–1479. doi: 10.5194/nhessd-2-1465-2014
Martha, T. R., Kerle, N., Jetten, V., van Westen, C. J., and Vinod Kumar, K. (2010). Landslide volumetric analysis using cartosat-1-derived DEMs. IEEE Geosci. Remote Sens. Lett. 7, 582–586. doi: 10.1109/LGRS.2010.2041895
Martha, T. R., Roy, P., Govindharaj, K. B., Kumar, K. V., Diwakar, P. G., and Dadhwal, V. K. (2015). Landslides triggered by the June 2013 extreme rainfall event in parts of Uttarakhand state. India. Landslides 12, 135–146. doi: 10.1007/s10346-014-0540-7
Martha, T. R., Roy, P., Mazumdar, R., Govindharaj, K. B., and Kumar, K. V. (2017). Spatial characteristics of landslides triggered by the 2015 Mw 7.8 (Gorkha) and Mw 7.3 (Dolakha) earthquakes in Nepal. Landslides 14, 697–704. doi: 10.1007/s10346-016-0763-x
Maurer, J., and Rupper, S. (2015). Tapping into the Hexagon spy imagery database: a new automated pipeline for geomorphic change detection. ISPRS J. Photogramm. Remote Sens. 108, 113–127. doi: 10.1016/J.ISPRSJPRS.2015.06.008
Maurer, J. M., Schaefer, J. M., Rupper, S., and Corley, A. (2019). Acceleration of ice loss across the Himalayas over the past 40 years. Sci. Adv. 5:eaav7266. doi: 10.1126/sciadv.aav7266
McDougall, S. (2017). 2014 Canadian Geotechnical Colloquium: landslide runout analysis — current practice and challenges. Can. Geotechnol. J. 54, 605–620. doi: 10.1139/cgj-2016-0104
McFeeters, S. K. (1996). The use of the normalized difference water index (NDWI) in the delineation of open water features. Int. J. Remote Sens. 17, 1425–1432. doi: 10.1080/01431169608948714
Mei, Y., Maggioni, V., Houser, P., and Rouf, T. (2018). “A nonparametric statistical technique for spatial downscaling of precipitation over high-mountain Asia,” in Poster Presented at American Geophysical Union, fall meeting 2018, (Washington DC).
Melgar, D., Bock, Y., and Crowell, B. W. (2012). Real-time centroid moment tensor determination for large earthquakes from local and regional displacement records. Geophys. J. Int. 188, 703–718. doi: 10.1111/j.1365-246X.2011.05297.x
Mergili, M., Fischer, J.-T., Krenn, J., and Pudasaini, S. P. (2017). r.avaflow v1, an advanced opensource computational framework for the propagation and interaction of two-phase mass flows. Geosci. Model Dev. 10, 553–569. doi: 10.5194/gmd-10-553-2017
Mergili, M., and Schneider, J. F. (2011). Regional-scale analysis of lake outburst hazards in the southwestern Pamir, Tajikistan, based on remote sensing and GIS. Nat. Hazards Earth Syst. Sci. 11, 1447–1462. doi: 10.5194/nhess-11-1447-2011
Metternicht, G., Lorenz, H., and Radu, G. (2005). Remote sensing of landslides: an analysis of the potential contribution to geo-spatial systems for hazard assessment in mountainous environments. Remote Sens. Environ. 98, 284–303. doi: 10.1016/j.rse.2005.08.004
Miles, E. S., Steiner, J., Willis, I., Buri, P., Immerzeel, W. W., Chesnokova, A., et al. (2017). Pond dynamics and supraglacial-englacial connectivity on debris-covered Lirung Glacier, Nepal. Front. Earth Sci. 5:69. doi: 10.3389/feart.2017.00069
Miles, E. S., Watson, C. S., Brun, F., Berthier, E., Esteves, M., Quincey, D. J., et al. (2018). Glacial and geomorphic effects of a supraglacial lake drainage and outburst event, Everest region, Nepal Himalaya. Cryosphere 12, 3891–3905. doi: 10.5194/tc-12-3891-2018
Miles, K. E., Hubbard, B., Quincey, D. J., Miles, E. S., Sherpa, T. C., Rowan, A. V., et al. (2018). Polythermal structure of a Himalayan debris-covered glacier revealed by borehole thermometry. Sci. Rep. 8:16825. doi: 10.1038/s41598-018-34327-5
Moosavi, V., Talebi, A., and Shirmohammadi, B. (2014). Producing a landslide inventory map using pixel-based and object-oriented approaches optimized by Taguchi method. Geomorphology 204, 646–656. doi: 10.1016/j.geomorph.2013.09.012
Muñoz-Salinas, E., Castillo-Rodríguez, M., Manea, V., Manea, M., and Palacios, D. (2009). Lahar flow simulations using LAHARZ program: application for the Popocatépetl volcano, Mexico. J. Volcanol. Geotherm. Res. 182, 13–22. doi: 10.1016/J.JVOLGEORES.2009.01.030
Nagai, H., Watanabe, M., Tomii, N., Tadono, T., and Suzuki, S. (2017). Multiple remote-sensing assessment of the catastrophic collapse in langtang valley induced by the 2015 Gorkha earthquake. Nat. Hazards Earth Syst. Sci. 17, 1907–1921. doi: 10.5194/nhess-17-1907-2017
Nie, Y., Sheng, Y., Liu, Q., Liu, L., Liu, S., Zhang, Y., et al. (2017). A regional-scale assessment of Himalayan glacial lake changes using satellite observations from 1990 to 2015. Remote Sens. Environ. 189, 1–13. doi: 10.1016/J.RSE.2016.11.008
Noetzli, J., Huggel, C., Hoelzle, M., and Haeberli, W. (2006). GIS-based modelling of rock-ice avalanches from Alpine permafrost areas. Comput. Geosci. 10, 161–178. doi: 10.1007/s10596005-9017-z
Noh, M.-J., Howat, I. M., Porter, C., Morin, P., Clementz, M., and Cloutier, M. (2015). Advice for use of the SETSM 2m posting ditigal elevation model covering the Kathmandu region of Nepal. GISci. Remote Sens. 1603, 1–20. doi: 10.1080/15481603.2015.1008621
NSIDC (2019). High Mountain Asia Overview. Available at: https://nsidc.org/data/highmountainasia (accessed April 4, 2019).
Pathak, D. (2016). Remote sensing and GIS application in landslide risk assessment and management. Nepalese J. Geoinform. 15, 52–57.
Pescaroli, G., and Alexander, D. (2016). Critical infrastructure, panarchies and the vulnerability paths of cascading disasters. Nat. Hazards 82, 175–192. doi: 10.1007/s11069-016-2186-3
Petley, D. N., Hearn, G. J., Hart, A., Rosser, N. J., Dunning, S. A., Oven, K., et al. (2007). Trends in landslide occurrence in Nepal. Nat. Hazards 43, 23–44. doi: 10.1007/s11069-006-9100-3
Planet Team (2018). Planet Application Program Interface: In Space for Life on Earth. San Francisco, CA: Planet Team.
Plank, S., Twele, A., and Martinis, S. (2016). Landslide mapping in vegetated areas using change detection based on optical and polarimetric sar data. Remote Sens. 8:307. doi: 10.3390/rs8040307
Pour, A. B., and Hashim, M. (2017). Application of Landsat-8 and ALOS-2 data for structural and landslide hazard mapping in Kelantan, Malaysia. Nat. Hazards Earth Syst. Sci. 17, 1285–1303. doi: 10.5194/nhess-17-1285-2017
Qinghua, F. (1991). Characteristics of Glacier Outburst Flood in the Yarkant River, Karakorum Mountains. GeoJournal 25, 255–263. doi: 10.2307/41145287
Quincey, D., Klaar, M., Haines, D., Lovett, J., Pariyar, B., Gurung, G., et al. (2018). The changing water cycle: the need for an integrated assessment of the resilience to changes in water supply in High-Mountain Asia. Wiley Interdiscip. Rev. Water 5:e1258. doi: 10.1002/wat2.1258
Quincey, D. J., Glasser, N. F., Cook, S. J., and Luckman, A. (2015). Heterogeneity in Karakoram glacier surges. J. Geophys. Res. Earth Surf. 120, 1288–1300. doi: 10.1002/2015JF003515
Quincey, D. J., Richardson, S. D., Luckman, A., Lucas, R. M., Reynolds, J. M., Hambrey, M. J., et al. (2007). Early recognition of glacial lake hazards in the Himalaya using remote sensing datasets. Glob. Planet. Change 56, 137–152. doi: 10.1016/J.GLOPLACHA.2006.07.013
Raspini, F., Bianchini, S., Ciampalini, A., Del Soldato, M., Solari, L., Novali, F., et al. (2018). Continuous, semi-automatic monitoring of ground deformation using Sentinel-1 satellites. Sci. Rep. 8:7253. doi: 10.1038/s41598-018-25369-w
Raspini, F., Ciampalini, A., Del Conte, S., Lombardi, L., Nocentini, M., Gigli, G., et al. (2015). Exploitation of amplitude and phase of satellite SAR images for landslide mapping: the Case of Montescaglioso (South Italy). Remote Sens. 7, 14576–14596. doi: 10.3390/rs71114576
Rautela, P. (2018). “Lessons learned from 16/17 June 2013 Disaster of Uttarakhand, India,” in Disaster Risk Governance in India and Cross Cutting Issues. Disaster Risk Reduction (Methods, Approaches and Practices), eds I. Pal and R. Shaw (Singapore: Springer), 165–192. doi: 10.1007/978-981-10-3310-0_9
Reynolds, J. M. (2014). Assessing glacial hazards for hydro development in the Himalayas, Hindu Kush and Karakoram. Hydropower Dams 2, 60–65.
Richardson, S. D., and Reynolds, J. M. (2000). An overview of glacial hazards in the Himalayas. Quat. Int. 65–66, 31–47. doi: 10.1016/S1040-6182(99)00035-X
RiskScape (2019). RiskScape Home. Available at: https://www.riskscape.org.nz/ (accessed March 13, 2019).
Roback, K., Clark, M. K., West, A. J., Zekkos, D., Li, G., Gallen, S. F., et al. (2018). The size, distribution, and mobility of landslides caused by the 2015 Mw7.8 Gorkha earthquake, Nepal. Geomorphology 301, 121–138. doi: 10.1016/j.geomorph.2017.01.030
Robson, B. A., Nuth, C., Dahl, S. O., Hölbling, D., Strozzi, T., and Nielsen, P. R. (2015). Automated classification of debris-covered glaciers combining optical, SAR and topographic data in an object-based environment. Remote Sens. Environ. 170, 372–387. doi: 10.1016/j.rse.2015.10.001
Rodriguez, K. M., Weissel, J. K., and Kim, Y. (2002). “Classification of landslide surfaces using fully polarimetric SAR: examples from Taiwan,” in Proceedings of the IEEE International Geoscience and Remote Sensing Symposium, (Toronto, ON: IEEE), 2918–2920.
Rounce, D. R., Byers, A. C., Byers, E. A., and McKinney, D. C. (2017a). Brief communication: observations of a glacier outburst flood from Lhotse Glacier, Everest area, Nepal. Cryosphere 11, 443–449. doi: 10.5194/tc-11-443-2017
Rounce, D. R., Watson, C., and McKinney, D. (2017b). Identification of hazard and risk for glacial lakes in the Nepal Himalaya using satellite imagery from 2000–2015. Remote Sens. 9:654. doi: 10.3390/rs9070654
Round, V., Leinss, S., Huss, M., Haemmig, C., and Hajnsek, I. (2017). Surge dynamics and lake outbursts of Kyagar Glacier, Karakoram. Cryosphere 11, 723–739. doi: 10.5194/tc-11-723-2017
Roy, P., Martha, T. R., and Kumar, K. V. (2014). Assessment of the Sunkoshi (Nepal) landslide using multitemporal satellite images. Curr. Sci. 107, 1961–1964.
Rupnik, E., Daakir, M., and Pierrot Deseilligny, M. (2017). MicMac – a free, open-source solution for photogrammetry. Open Geospat. Data Softw. Stand. 2:14. doi: 10.1186/s40965-017-0027-2
Salzmann, N., Kääb, A., Huggel, C., Allgöwer, B., and Haeberli, W. (2004). Assessment of the hazard potential of ice avalanches using remote sensing and GIS-modelling. Nor. Geogr. Tidsskr. - Nor. J. Geogr. 58, 74–84. doi: 10.1080/00291950410006805
Sati, S. P., and Gahalaut, V. K. (2013). The fury of the floods in the north-west Himalayan region: the Kedarnath tragedy. Geomat. Nat. Hazards Risk 4, 193–201. doi: 10.1080/19475705.2013.827135
Schmid, M.-O., Baral, P., Gruber, S., Shahi, S., Shrestha, T., Stumm, D., et al. (2015). Assessment of permafrost distribution maps in the Hindu Kush Himalayan region using rock glaciers mapped in Google Earth. Cryosphere 9, 2089–2099. doi: 10.5194/tc-9-2089-2015
Schneiderbauer, S., and Ehrlich, D. (2004). Risk, Hazard and People’s Vulnerability to Natural Hazards: a Review of Definitions, Concepts and Data. Ispra: Office for Official Publication of the European Communities.
Schultz, L., and Molthan, A. (2015). Percent of Normal Emitted Light Data. NASA Gorkha Earthquake Response. Available at: https://weather.msfc.nasa.gov/sport/disasters/gorkha/opticalImagery/pcntNormalLight/pcntNormalLight_20150427.html (Accessed March 20, 2019).
Schwanghart, W., Worni, R., Huggel, C., Stoffel, M., and Korup, O. (2016). Uncertainty in the Himalayan energy–water nexus: estimating regional exposure to glacial lake outburst floods. Environ. Res. Lett. 11:074005. doi: 10.1088/1748-9326/11/7/074005
Shakya, D., and Sabha, S. (2017). Arun Displaced Urge Government for Relief - National - The Kathmandu Post. Kathmandu: Kathmandu Post.
Sharma, R., Tateishi, R., Hara, K., Nguyen, H., Gharechelou, S., Nguyen, L., et al. (2017). Earthquake damage visualization (EDV) technique for the rapid detection of earthquake induced damages using SAR data. Sensors 17:235. doi: 10.3390/s17020235
Shean, D. (2017). High Mountain Asia 8-meter DEM Mosaics Derived from Optical Imagery, Version 1. Boulder, Co: : ASA National Snow and Ice Data Center Distributed Active Archive Center, doi: 10.5067/KXOVQ9L172S2
Shean, D. E., Alexandrov, O., Moratto, Z. M., Smith, B. E., Joughin, I. R., Porter, C., et al. (2016). An automated, open-source pipeline for mass production of digital elevation models (DEMs) from very-high-resolution commercial stereo satellite imagery. ISPRS J. Photogramm. Remote Sens. 116, 101–117. doi: 10.1016/j.isprsjprs.2016.03.012
Shean, D. E., Montesano, P., Osmanoglu, B., and Arendt, A. A. (2018). “High-mountain Asia geodetic glacier mass balance from a high-resolution DEM record,” in Proceedings of the American Geophysical Union, Fall Meeting 2018, abstract #C43B-06, (Washington, D.C: American Geophysical Union).
Shibayama, T., Yamaguchi, Y., and Yamada, H. (2015). Polarimetric scattering properties of landslides in forested areas and the dependence on the local incidence angle. Remote Sens. 7, 15424–15442. doi: 10.3390/rs71115424
Shimada, M., Watanabe, M., Kawano, N., Ohki, M., Motooka, T., and Wada, Y. (2014). Detecting mountainous landslides by SAR polarimetry: a comparative study using Pi-SAR-L2 and Xband SARs. Trans. Japan Soc. Aeronaut. Sp. Sci. Aerosp. Technol. Japan 12, n_9–n_15.
Sivakumar, M. V. K. (2005). “Impacts of natural disasters in agriculture, rangeland and forestry: an overview,” in Natural Disasters and Extreme Events in Agriculture, eds M. V. Sivakumar, R. P. Motha, and H. P. Das (Berlin: Springer-Verlag), 1–22. doi: 10.1007/3-540-28307-2_1
Sökefeld, M. (2012). ““The Attabad landslide and the politics of disaster in Gojal, Gilgit-Baltistan,” in Negotiating Disasters?: Politics, Representation, Meanings, ed. U. Luig (Frankfurt: Peter Lang), 176–204.
Solari, L., Raspini, F., Del Soldato, M., Bianchini, S., Ciampalini, A., Ferrigno, F., et al. (2018). Satellite radar data for back-analyzing a landslide event: the Ponzano (Central Italy) case study. Landslides 15, 773–782. doi: 10.1007/s10346-018-0952-x
Stanley, T., and Kirschbaum, D. B. (2017). A heuristic approach to global landslide susceptibility mapping. Nat. Hazards 87, 145–164. doi: 10.1007/s11069-017-2757-y
Steiner, J. F., Kraaijenbrink, P. D. A., Jiduc, S. G., and Immerzeel, W. W. (2018). Brief communication: the Khurdopin glacier surge revisited – extreme flow velocities and formation of a dammed lake in 2017. Cryosphere 12, 95–101. doi: 10.5194/tc-12-95-2018
Stoffel, M., and Huggel, C. (2012). Effects of climate change on mass movements in mountain environments. Prog. Phys. Geogr. Earth Environ. 36, 421–439. doi: 10.1177/0309133312441010
Strozzi, T., Wiesmann, A., Kääb, A., Joshi, S., and Mool, P. (2012). Glacial lake mapping with very high resolution satellite SAR data. Nat. Hazards Earth Syst. Sci. 12, 2487–2498. doi: 10.5194/nhess-12-2487-2012
Sun, L., and Muller, J.-P. (2016). Evaluation of the use of sub-pixel offset tracking techniques to monitor landslides in densely vegetated steeply sloped areas. Remote Sens. 8:659. doi: 10.3390/rs8080659
Sun, Q., Hu, J., Zhang, L., and Ding, X. (2016). Towards slow-moving landslide monitoring by integrating multi-sensor InSAR time series datasets: the Zhouqu Case Study, China. Remote Sens. 8:908. doi: 10.3390/rs8110908
Sun, W., Tian, Y., Mu, X., Zhai, J., Gao, P., and Zhao, G. (2017). Loess landslide inventory map based on GF-1 satellite imagery. Remote Sens. 9:314. doi: 10.3390/rs9040314
Tierney, K. (2006). “Social inequality, hazards, and disasters,” in On Risk and Disaster: Lessons from Hurricane Katrina - Google Books, eds R. Daniels, D. Kettl, and H. Kunreuther (Philidelphia, PA: University of Pennsylvania Press), 109–128.
Tiwari, B., Ajmera, B., and Dhital, S. (2017). Characteristics of moderate- to large-scale landslides triggered by the M w 7.8 2015 Gorkha earthquake and its aftershocks. Landslides 14, 1297–1318. doi: 10.1007/s10346-016-0789-0
Tofani, V., Raspini, F., Catani, F., and Casagli, N. (2014). “Persistent scatterer interferometry (PSI) technique for landslide characterization and monitoring,” in Landslide Science for a Safer Geoenvironment, eds K. Sassa, P. Canuti, and Y. Yin (Cham: Springer), 351–357. doi: 10.1007/978-3-319-05050-8_55
Toya, H., and Skidmore, M. (2007). Economic development and the impacts of natural disasters. Econ. Lett. 94, 20–25. doi: 10.1016/J.ECONLET.2006.06.020
Tsutsui, K., Rokugawa, S., Nakagawa, H., Miyazaki, S., Cheng, C.-T., Shiraishi, T., et al. (2007). Detection and volume estimation of large-scale landslides based on elevation-change analysis using DEMs extracted from high-resolution satellite stereo imagery. IEEE Trans. Geosci. Remote Sens. 45, 1681–1696. doi: 10.1109/TGRS.2007.895209
Uddin, K., and Shrestha, B. (2011). “Assessing flood and flood damage using remote Sensing: a case study from Sunsari, Nepal,” in Proceedings of the 3rd International Conference on Water & Flood Management, (Dhaka: Institute of Water and Flood Management, BUET).
UNISDR (2015). “Sendai framework for disaster risk reduction 2015 - 2030,” in Proceedings of the 3rd World Conference on Disaster Risk Reduction, (Sendai), 1–25.
UNISDR (2019). Global Risk Assessment Framework. Available at: https://www.preventionweb.net/disaster-risk/graf (accessed March 13, 2019).
van der Geest, K., and Schindler, M. (2016). Case Study Report: Loss and Damage from a Catastrophic Landslide in Sindhupalchok District, Nepal. Available at: https://www.preventionweb.net/publications/view/58621 (accessed March 15, 2019).
van Westen, C. J., and Lulie Getahun, F. (2003). Analyzing the evolution of the Tessina landslide using aerial photographs and digital elevation models. Geomorphology 54, 77–89. doi: 10.1016/S0169-555X(03)00057-6
Veh, G., Korup, O., von Specht, S., Roessner, S., and Walz, A. (2019). Unchanged frequency of moraine-dammed glacial lake outburst floods in the Himalaya. Nat. Clim. Chang. 9, 379–383. doi: 10.1038/s41558-019-0437-5
Vuichard, D., and Zimmermann, M. (1987). The 1985 catastrophic drainage of a Moraine-Dammed Lake, Khumbu Himal, Nepal: cause and consequences. Mt. Res. Dev. 7, 91–110. doi: 10.2307/3673305
Wang, X., Ding, Y., Liu, S., Jiang, L., Wu, K., Jian, Z., et al. (2013). Changes of glacial lakes and implications in Tian Shan, Central Asia, based on remote sensing data from 1990 to 2010. Environ. Res. Lett. 8, 1–11. doi: 10.1088/1748-9326/8/4/044052
Wang, Z., Román, M. O., Sun, Q., Molthan, A. L., Schultz, L. A., and Kalb, V. L. (2018). Monitoring disaster-related power outages using NASA black marble nighttime light product. Int. Arch. Photogramm. Remote Sens. Spat. Inf. Sci. XLII-3, 1853–1856. doi: 10.5194/isprs-archives-XLII-3-1853-2018
Warren, S. G. (2013). Can black carbon in snow be detected by remote sensing? J. Geophys. Res. Atmos. 118, 779–786. doi: 10.1029/2012JD018476
Watanabe, T., Lamsal, D., and Ives, J. D. (2009). Evaluating the growth characteristics of a glacial lake and its degree of danger of outburst flooding: imja Glacier, Khumbu Himal, Nepal. Nor. Geogr. Tidsskr. Nor. J. Geogr. 63, 255–267. doi: 10.1080/00291950903368367
Watanabe, T., and Rothacher, D. (1996). The 1994 Lugge Tsho Glacial Lake Outburst Flood, Bhutan Himalaya. Mt. Res. Dev. 16, 77–81. doi: 10.2307/3673897
Watson, C., Kargel, J., Tiruwa, B., Watson, C. S., Kargel, J. S., and Tiruwa, B. (2019). UAV-derived himalayan topography: hazard assessments and comparison with global DEM products. Drones 3:18. doi: 10.3390/drones3010018
Watson, C. S., Carrivick, J., and Quincey, D. (2015). An improved method to represent DEM uncertainty in glacial lake outburst flood propagation using stochastic simulations. J. Hydrol. 529(Pt 3), 1373–1389. doi: 10.1016/j.jhydrol.2015.08.046
Watson, C. S., Quincey, D. J., Carrivick, J. L., Smith, M. W., Rowan, A. V., and Richardson, R. (2017). Heterogeneous water storage and thermal regime of supraglacial ponds on debris-covered glaciers. Earth Surf. Process. Landforms 43, 229–241. doi: 10.1002/esp.4236
Westoby, M. J., Brasington, J., Glasser, N. F., Hambrey, M. J., Reynolds, J. M., Hassan, M. A. A. M., et al. (2015). Numerical modelling of glacial lake outburst floods using physically based dam-breach models. Earth Surf. Dyn. 3, 171–199. doi: 10.1016/10.5194/esurf-3-171-2015
Westoby, M. J., Glasser, N. F., Brasington, J., Hambrey, M. J., Quincey, D. J., and Reynolds, J. M. (2014a). Modelling outburst floods from moraine-dammed glacial lakes. Earth Sci. Rev. 134, 137–159. doi: 10.1016/j.earscirev.2014.03.009
Westoby, M. J., Glasser, N. F., Hambrey, M. J., Brasington, J., Reynolds, J. M., and Hassan, M. A. A. M. (2014b). Reconstructing historic Glacial Lake Outburst Floods through numerical modelling and geomorphological assessment: extreme events in the Himalaya. Earth Surf. Process. Landforms 39, 1675–1692. doi: 10.1016/10.1002/esp.3617
Williams, J. G., Rosser, N. J., Kincey, M. E., Benjamin, J., Oven, K. J., Densmore, A. L., et al. (2018). Satellite-based emergency mapping using optical imagery: experience and reflections from the 2015 Nepal earthquakes. Nat. Hazards Earth Syst. Sci. 18, 185–205. doi: 10.5194/nhess-18-185-2018
World Bank (2011). Analyzing the Social Impacts of Disasters: Methodology, Vol. I. Washington, DC: World Bank Global Facility for Disaster Reduction and Recovery, 52.
World Bank (2014). Rapidly Assessing Flood Damage in Uttarakhand, India. Washington, DC: World Bank.
Worni, R., Huggel, C., Clague, J., Schaub, Y., and Stoffel, M. (2014). Coupling glacial lake impact, dam breach, and flood processes: a modeling perspective. Geomorphology 224, 161–176. doi: 10.1016/j.geomorph.2014.06.031
Yamada, M., Hashimoto, M., Fukushima, Y., Matsushi, Y., and Chigira, M. (2013). “Automatic detection of landslides from SAR images: application to the 2011 Kii landslides,” in Proceedings of the 2013 Asia-Pacific Conference on Synthetic Aperture Radar (APSAR), (Tsukuba: IEEE), 245–248.
Yin, B., Zeng, J., Zhang, Y., Huai, B., and Wang, Y. (2018). Recent Kyagar glacier lake outburst flood frequency in Chinese Karakoram unprecedented over the last two centuries. Nat. Hazards 95, 877–881. doi: 10.1007/s11069-018-3505-7
Yun, S.-H., Hudnut, K., Owen, S., Webb, F., Simons, M., Sacco, P., et al. (2015). Rapid damage mapping for the 2015 Mw 7.8 Gorkha Earthquake Using Synthetic Aperture Radar Data from COSMO–SkyMed and ALOS-2 Satellites. Seismol. Res. Lett. 86, 1549–1556. doi: 10.1785/0220150152
Zekkos, D., Clark, M., Whitworth, M., Greenwood, W., West, A. J., Roback, K., et al. (2017). Observations of landslides caused by the April 2015 Gorkha, Nepal, Earthquake Based on Land, UAV, and Satellite Reconnaissance. Earthq. Spectra 33, S95–S114. doi: 10.1193/121616EQS237M
Zhang, G., Yao, T., Xie, H., Wang, W., and Yang, W. (2015). An inventory of glacial lakes in the Third Pole region and their changes in response to global warming. Glob. Planet. Change 131, 148–157. doi: 10.1016/J.GLOPLACHA.2015.05.013
Zhang, J., Liu, R., Deng, W., Khanal, N. R., Gurung, D. R., Murthy, M. S. R., et al. (2016). Characteristics of landslide in Koshi River Basin, Central Himalaya. J. Mt. Sci. 13, 1711–1722. doi: 10.1007/s11629-016-4017-0
Zhao, L., Ding, R., and Moore, J. C. (2014). Glacier volume and area change by 2050 in high mountain Asia. Glob. Planet. Change 122, 197–207. doi: 10.1016/j.gloplacha.2014.08.006
Zhou, Z., Ma, W., Zhang, S., Mu, Y., and Li, G. (2018). Effect of freeze-thaw cycles in mechanical behaviors of frozen loess. Cold Reg. Sci. Technol. 146, 9–18. doi: 10.1016/J.COLDREGIONS.2017.11.011
Keywords: cascading hazards, High Mountain Asia, remote sensing, glacial lake outburst floods, landslides, risk assessment
Citation: Kirschbaum D, Watson CS, Rounce DR, Shugar DH, Kargel JS, Haritashya UK, Amatya P, Shean D, Anderson ER and Jo M (2019) The State of Remote Sensing Capabilities of Cascading Hazards Over High Mountain Asia. Front. Earth Sci. 7:197. doi: 10.3389/feart.2019.00197
Received: 14 April 2019; Accepted: 18 July 2019;
Published: 04 September 2019.
Edited by:
Carmine Galasso, University College London, United KingdomReviewed by:
Bayes Ahmed, University College London, United KingdomFederico Raspini, University of Florence, Italy
Christian Huggel, University of Zurich, Switzerland
Copyright © 2019 Kirschbaum, Watson, Rounce, Shugar, Kargel, Haritashya, Amatya, Shean, Anderson and Jo. This is an open-access article distributed under the terms of the Creative Commons Attribution License (CC BY). The use, distribution or reproduction in other forums is permitted, provided the original author(s) and the copyright owner(s) are credited and that the original publication in this journal is cited, in accordance with accepted academic practice. No use, distribution or reproduction is permitted which does not comply with these terms.
*Correspondence: Dalia Kirschbaum, ZGFsaWEua2lyc2NoYmF1bUBuYXNhLmdvdg==