 Julius Jara-Muñoz
 Daniel Melnick
 Kevin Pedoja
 Manfred R. Strecker1
- 1Institute of Geosciences, University of Potsdam, Potsdam, Germany
- 2Millennium Nucleus CYCLO, the Seismic Cycle Along Subduction Zones, Valdivia, Chile
- 3Instituto de Ciencias de la Tierra, TAQUACh, Universidad Austral de Chile, Valdivia, Chile
- 4Unicaen, Unirouen, CNRS, Normandie Université, Caen, France
The morphology of marine and lacustrine terraces has been largely used to measure past sea- and lake-level positions and estimate vertical deformation in a wealth of studies focused on climate and tectonic processes. To obtain accurate morphometric assessments of terrace morphology we present TerraceM-2, an improved version of our Matlab® graphic-user interface that provides new methodologies for morphometric analyses as well as landscape evolution and fault-dislocation modeling. The new version includes novel routines to map the elevation and spatial distribution of terraces, to model their formation and evolution, and to estimate fault-slip rates from terrace deformation patterns. TerraceM-2 has significantly improves its processing speed and mapping capabilities, and includes separate functions for developing customized workflows beyond the graphic-user interface. We illustrate these new mapping and modeling capabilities with three examples: mapping lacustrine shorelines in the Dead Sea to estimate deformation across the Dead Sea Fault, landscape evolution modeling to estimate a history of uplift rates in southern Peru, and dislocation modeling of deformed marine terraces in California. These examples also illustrate the need to use topographic data of different resolutions. The new modeling and mapping routines of TerraceM-2 highlight the advantages of an integrated joint mapping and modeling approach to improve the efficiency and precision of coastal terrace metrics in both marine and lacustrine environments.
Introduction
Marine and lacustrine wave-cut terraces are geomorphic markers largely used to estimate past sea- and lake-level positions (e.g., Zeuner, 1952; James et al., 1971), from which surface deformation rates may be assessed (e.g., Bradley and Griggs, 1976; Strecker et al., 1986; Bloom and Yonekura, 1990; Padgett et al., 2019). The increasing availability of high-resolution topography has substantially contributed to the study of coastal geomorphic markers since the last decade (e.g., Palamara et al., 2007; Bowles and Cowgill, 2012). However, the identification and precise assessments of geomorphic markers using high-resolution topography requires dedicated morphometric analyses and data visualization techniques, which are in most cases not available in standard GIS platforms. TerraceM has been designed to close this gap by providing open-source tools to interactively map and model the formation of marine and lacustrine wave-cut terraces using high-resolution topography and Matlab® programming. So far, TerraceM has been used for diverse purposes in different coastal settings worldwide (e.g., Melnick, 2016; Benjelloun, 2017; Jara-Muñoz et al., 2017; Melnick et al., 2017, 2019; Pedoja et al., 2018; Bilbao-Lasa et al., 2019; de Gelder et al., 2019; Jara-Munñoz et al., 2019; Racano et al., 2019). These studies include research topics such as coastal dynamics, paleo-geography, paleo-climate, neotectonics, and earthquake geology, highlighting the broad spectrum of applications and the advantages of applying integrated joint mapping and modeling techniques in the Earth sciences.
TerraceM was originally designed as a Matlab® Graphical User Interface (GUI) to assess marine terrace elevations using high-resolution topography. The new version “TerraceM-2” goes further, including new modeling tools and processing functions inside user-friendly GUIs. Furthermore, TerraceM-2 is based on a novel programmatic architecture improving the computational efficiency and processing speed (see Table 1). Topotoolbox functions (Schwanghart and Scherler, 2014) are nested in TerraceM-2 to perform basic analyses, such as swath profile extraction, calculation between topographic parameters, and DEM visualization. The TerraceM-2 architecture is based on independent functions, whose outputs are stored as data structures, enabling memory efficiency, and processing greater number of swath profiles and larger DEMs, at least eleven times faster than the previous release (see speed test in SP1 and Supplementary Figure 1SP). The three new TerraceM-2 modules are devoted to mapping marine and lacustrine terraces, estimating metrics of past sea-level positions, exploring their formation and degradation mechanisms, and using these metrics to estimate deformation processes. The shoreline-angle mapping tool in the previous version (Jara-Muñoz et al., 2016) has been complemented with an interface to compute surface classification models, which allow mapping marine and lacustrine terraces based on the distribution of morphometric parameters extracted from the topography. Additionally, TerraceM-2 includes a new interface to model terraces formation using a Landscape Evolution Model, which simulates the effect of sea-erosion and vertical deformations on the development of wave-cut terraced topography. Furthermore, the spatial distribution of terrace elevations and surface uplift estimated from past sea- or lake-level metrics can be compared with fault dislocation models to derive fault slip rates. The integration of TerraceM-2 interfaces and routines, in addition to user-friendly GUIs, optimizes the time required for mapping and modeling marine and lacustrine terraces for inexperienced users in Matlab® scripting. However, the TerraceM-2 architecture comprises independent functions allowing experienced users to create customized workflows. Taken together, we envisage that the evolving technological advances and the increased accessibility of high-resolution topography, in addition to the advanced morphometric and modeling methods in TerraceM-2, will promote studies on Quaternary sea- and lake-level changes and neotectonics. In light of the impacts of global sea-level change and seismic activity at plate-margin settings, such studies are crucial, particularly regarding the adequate assessment of hazards associated with seismicity and sea-level change, and a combination thereof.
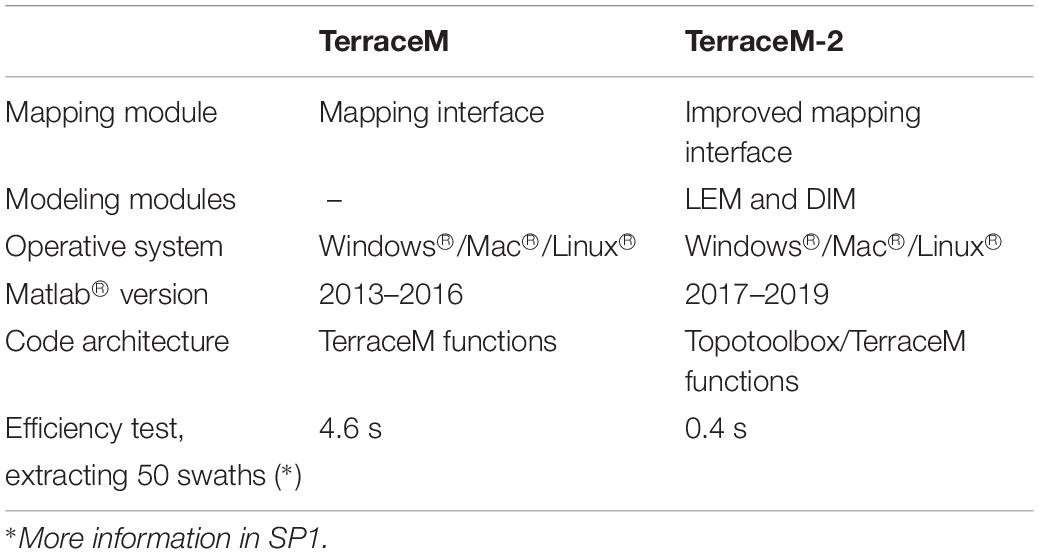
Table 1. Differences and improvements between TerraceM and TerraceM-2.
Conceptual Framework and New Modules in TerraceM-2
Here we present several concepts to define the morphogenetic characteristics of marine and lacustrine terraces, which are essential to understand the functionalities of TerraceM-2. For instance, the term coastal terraces refer to marine and lacustrine wave-cut terraces, generated by the effects wave erosion. In contrast to wave-built marine or lacustrine terraces formed by the accumulation of beach deposits (e.g., Dietz, 1963; Jara-Muñoz and Melnick, 2015), these terraces are purely erosional and may be covered by a thin veneer of sediments. The term coastal-terrace sequence denotes several coastal terraces that occur at successively higher positions above a reference datum, i.e., sea-level or lake level. The terraces form during rather high water levels and may form staircase-like sequences if the climatically controlled water-level changes are superposed to vertical crustal movements (e.g., Lajoie, 1986; Pedoja et al., 2011, 2014). There are several methods and markers that have been used to estimate the elevation of marine terraces; for instance, by identifying slope changes along topographic profiles (e.g., Armijo et al., 1996; Saillard et al., 2009; Regard et al., 2010; Roberts et al., 2013), or more sophisticated methods like semi-automated mapping of the inner edge (e.g., Palamara et al., 2007). However, using inadequate markers of terrace elevation may result in disparate errors. Therefore, the accurate mapping of marine terraces is crucial to obtain consistent elevation estimates and to derive unequivocal uplift rate estimates. The morphology of coastal terraces usually comprises a sub-horizontal paleo-platform bounded by a paleo-cliff inlands, the intersection between the paleo-cliff and the paleo-platform defines the shoreline angle, a geomorphic marker that represents the maximum reach of the sea or lake level during the formation of the terrace (Lajoie, 1986). Thus, the shoreline angle represents a geodetic marker that can be used to estimate relative water-level changes and vertical deformation (e.g., Lajoie, 1986; Burbank and Anderson, 2011; Jara-Muñoz et al., 2016).
TerraceM-2 uses these geomorphic relationships and provides quantitative methodologies to analyze the metrics of coastal terraces by assessing their morphological elements and by modeling the topographic arrangement of coastal terrace sequences. TerraceM-2 comprises three modules, (a) Maptools (MAP) (b) Landscape evolution model (LEM), and (c) Dislocation Modeling (DIM), designed to be used both as independent and complementary GUI’s (Figure 1). Various ancillary tools are available for data analysis and interpretation as well, each module include an information interface that displays verbose operations to guide the user through the GUI’s workflow, the World Catalog of Coastal Sequences (WCCS, Figure 1) comprising, wave-cut and wave-built marine terraces, coral reefs, and strandlines from the last high-stands (MIS 5, MIS 7, and MIS 9). This catalog is an update of the compilation of Pedoja et al. (2014, 2011), which currently includes 1010 sites based on 1232 references. The WCCS interface displays the location of marine terrace studies within a defined distance from the TerraceM-2 mapping area, allowing the user to rapidly integrate previous estimates of marine terrace elevations, terrace ages, dating methods, uplift rates, data quality index, and references. Another ancillary tool of TerraceM-2 is the Uplift Calculator that allows quick determination of uplift rates using both the typical method correlating terrace levels with sea-level high-stands (e.g., Lajoie, 1986), and the synchronous correlation method (Roberts et al., 2013) that considers the elevations of all terrace levels of a sequence simultaneously, by comparing observed and predicted marine terrace elevations based on the assumption of constant uplift rate along time.
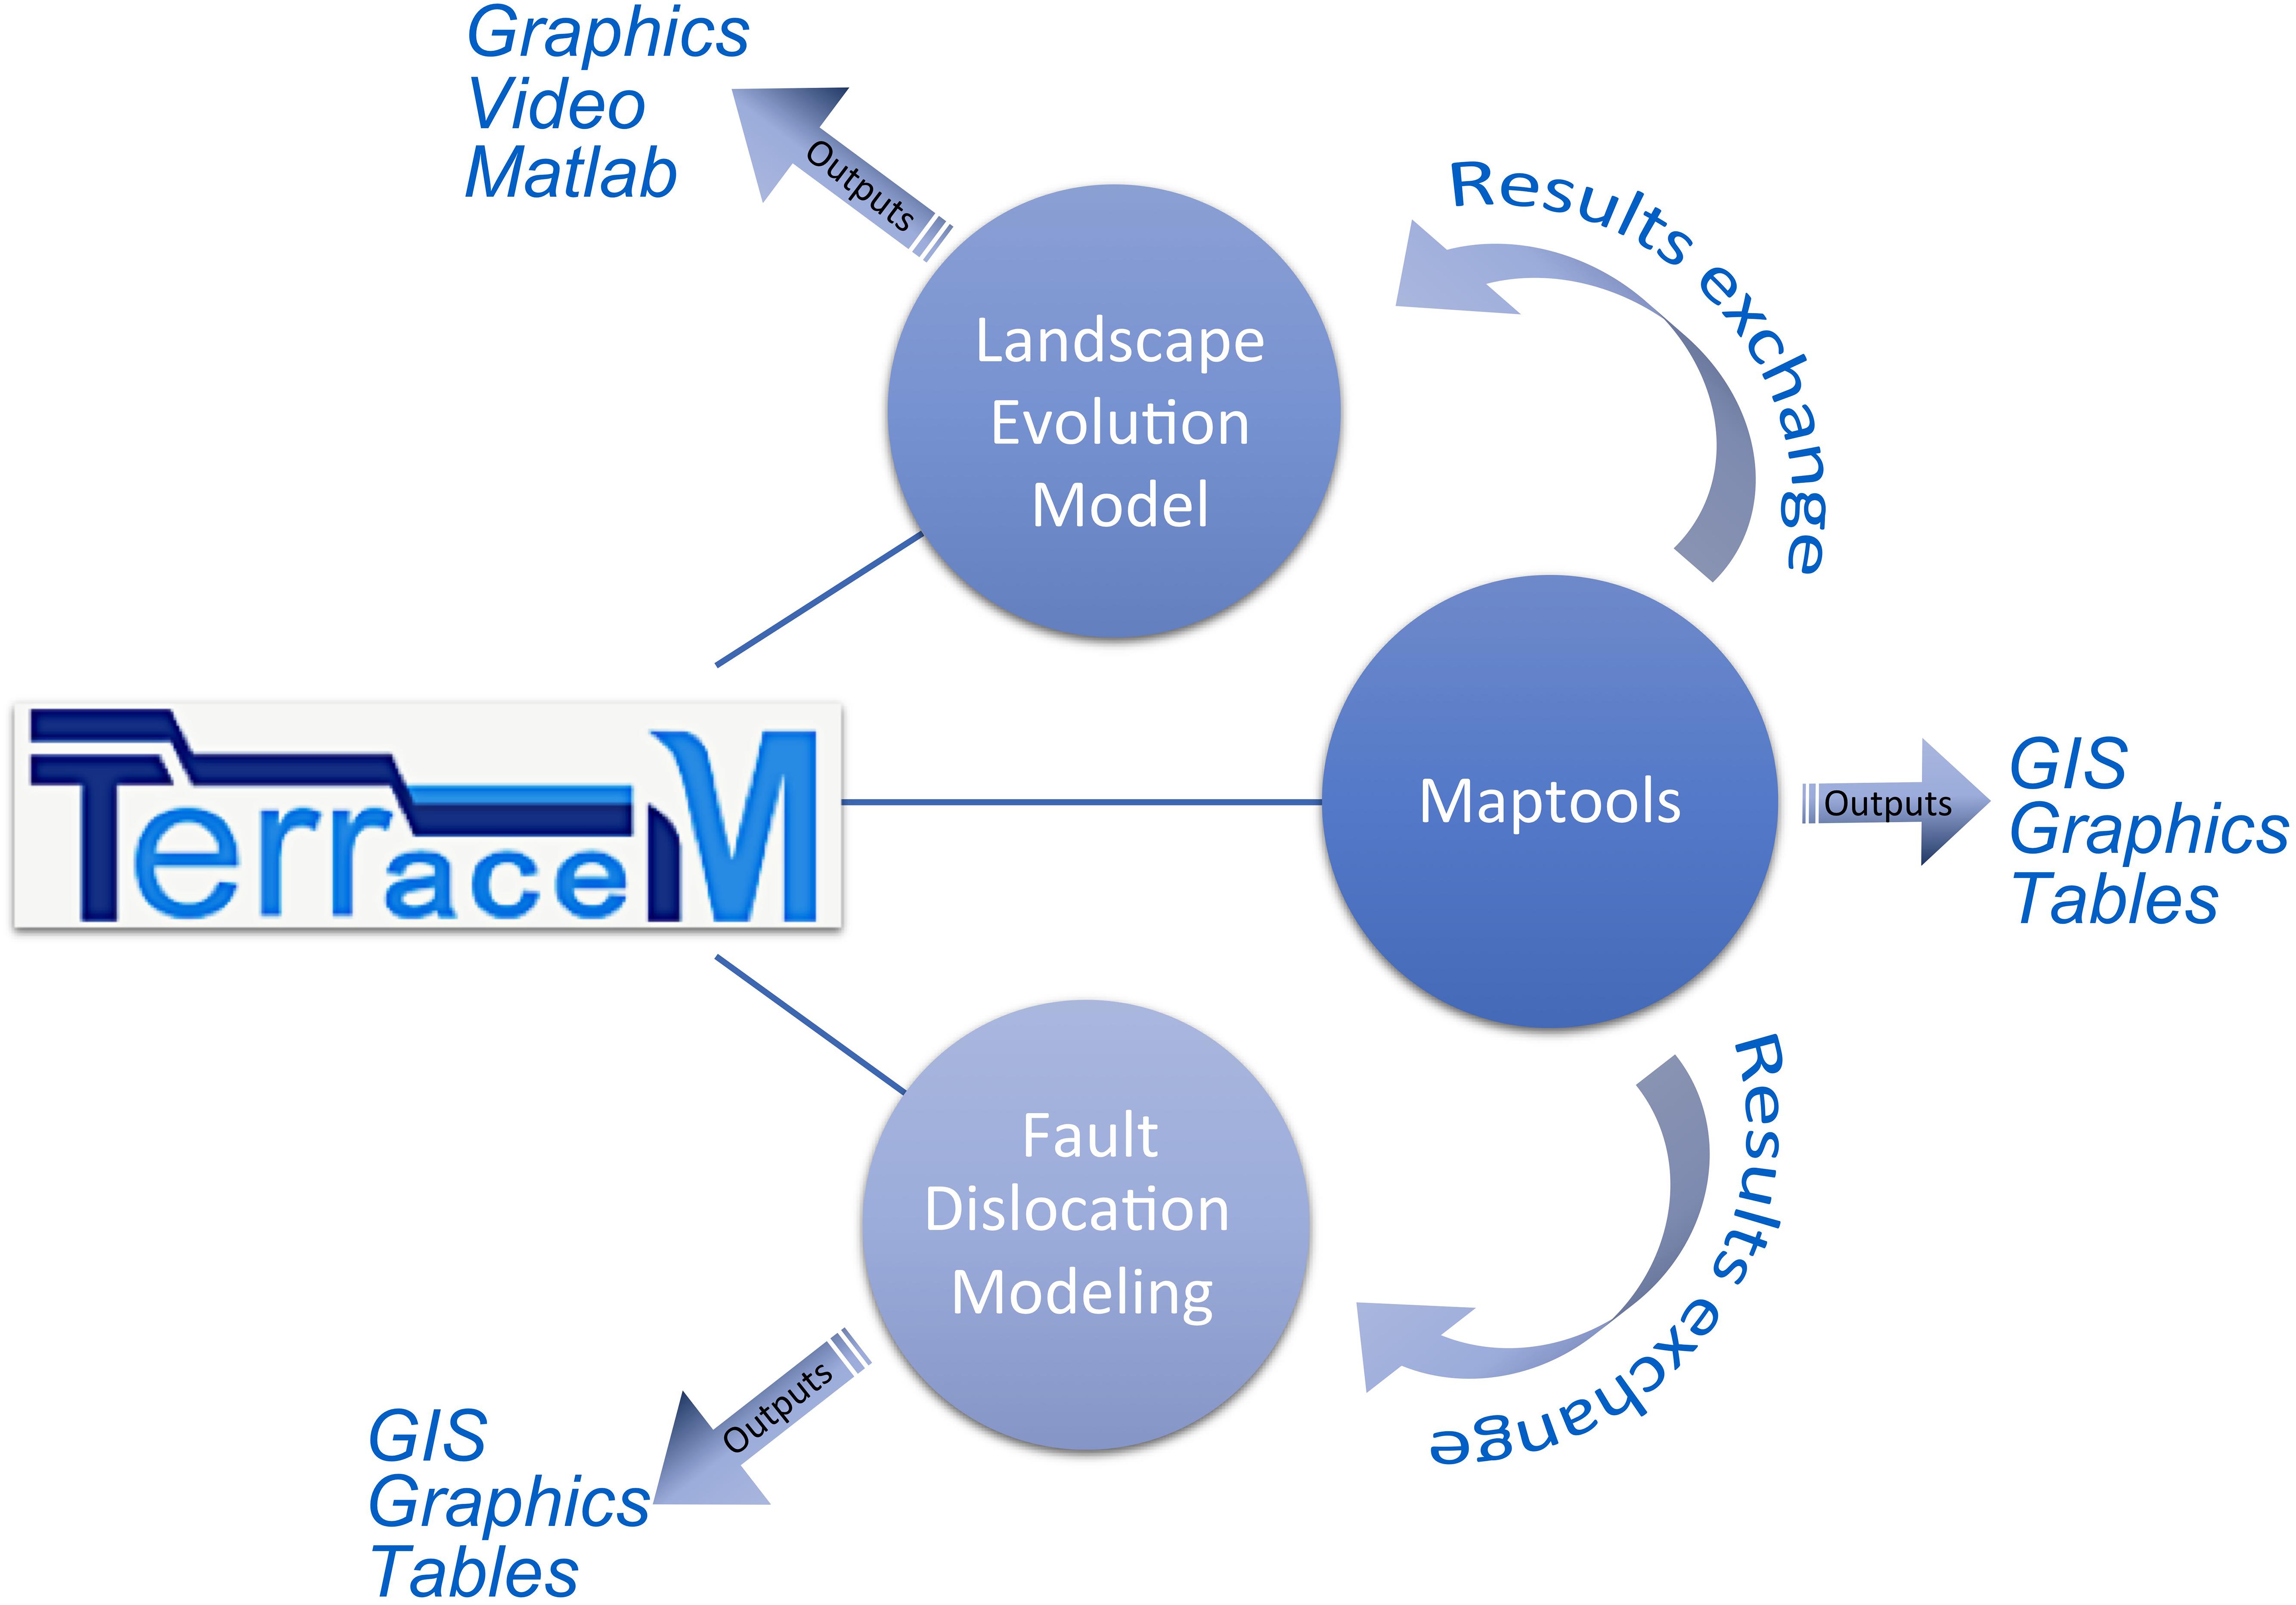
Figure 1. Structure of TerraceM-2 modules, exchange of results between modules, and outputs.
TerraceM-2 is designed to run in Mac®, Linux®, and Windows® computers using Matlab® 2017 or later (see Table 1), minimal RAM memory required is 2GB and more than 5 GB free disk space, which are also the minimal requirements to run Matlab®. The inputs and outputs of each TerraceM-2 module are based on data structures (Supplementary Figures 2SP, 3SP) allowing flexible organization and exchange between the different modules. TerraceM-2 inputs are: topography in raster format (geotiff or Arcgrid ascii), and polygon(s) in shapefile format that may be created in any GIS platform (for example QGIS or ArcGIS) containing rectangular boxes defining the location of swath profiles. Inputs are loaded and processed in the MAP module, and these results may be used as inputs for the LEM and DIM modules facilitating data exchange between the different modules. The outputs of each module may be exported to shapefiles and Matlab® structures (.mat format). This latter file also stores all the data that defines a particular project, allowing for subsequent editing and visualization. Furthermore, each module comprises independent functions, which can be used to create custom scripts beyond the GUI environment (see examples included in SP2).
TerraceM-2 Maptools
TerraceM-2 MAP is a module designed for mapping coastal terraces (Figure 2). This module includes two complementary methods to measure the elevation and characterize the spatial distribution of coastal terraces.
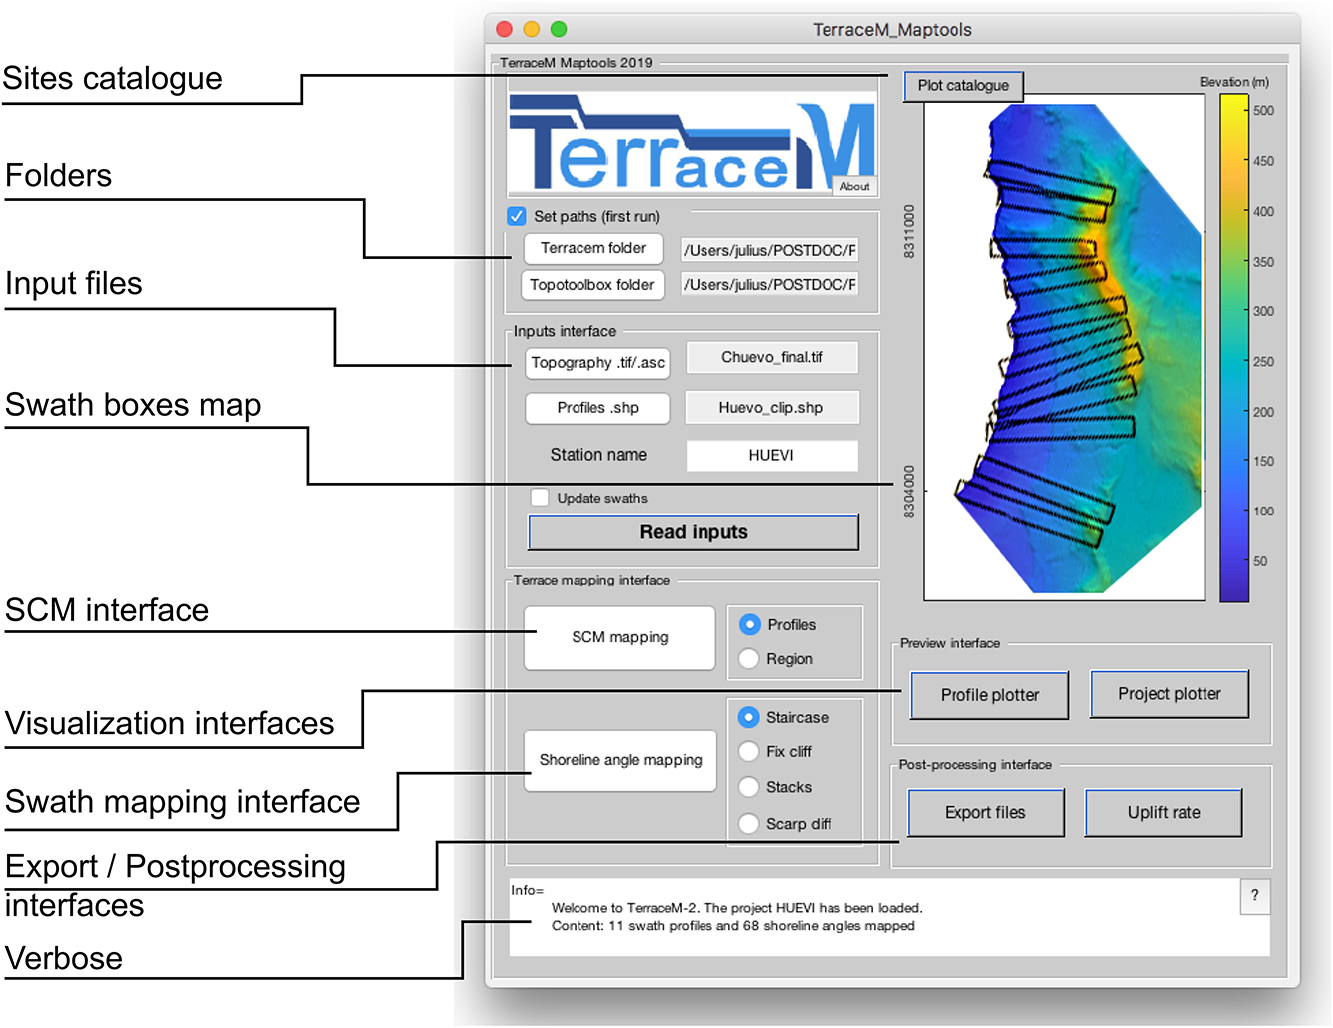
Figure 2. TerraceM Maptools (MAP) GUI (see text for further details).
Swath Profile Mapping
The swath profile mapping interface is an improved GUI that allows mapping and visualizing shoreline angles (Figure 3). TerraceM-2 uses the maximum elevations of swath profiles, which resemble the original coastal terrace morphology without the effects of post-abandonment modification, principally resulting from fluvial incision. As in the previous version of TerraceM, linear regressions are fitted upon user-defined segments of the paleo-cliff and paleo-platform of coastal terraces (Figure 3); the shoreline angle is then located by intersecting the extrapolations of linear regressions. Errors are determined by intersecting the 2σ confidence intervals of both regression lines. The swath profile mapping interface includes different methods (see TerraceM in Jara-Muñoz et al. (2016) for further details): (a) Staircase analysis, which is based on the intersection between paleo-platform and cliff, (b) the Fixed cliff analysis, which includes the option of adding field measurements to calibrate the paleo-cliff slope, and (c) the Stack analysis, to determine the shoreline angle in rough coastal areas comprising sea stacks, and (d) the Cliff diffusion analysis, determines the geometry of the colluvium wedge to reconstruct the original terrace profile as well as determining the geomorphic age of the terrace scarp (e.g., Hanks et al., 1984). Swath mapping can be also called from command line as an independent function (see SP2.1 and Supplementary Figures 4SP, 5SP). TerraceM-2 MAP includes ancillary visualization tools, such as Profile and Project Plotter, to create publication-quality plots of the mapping results.
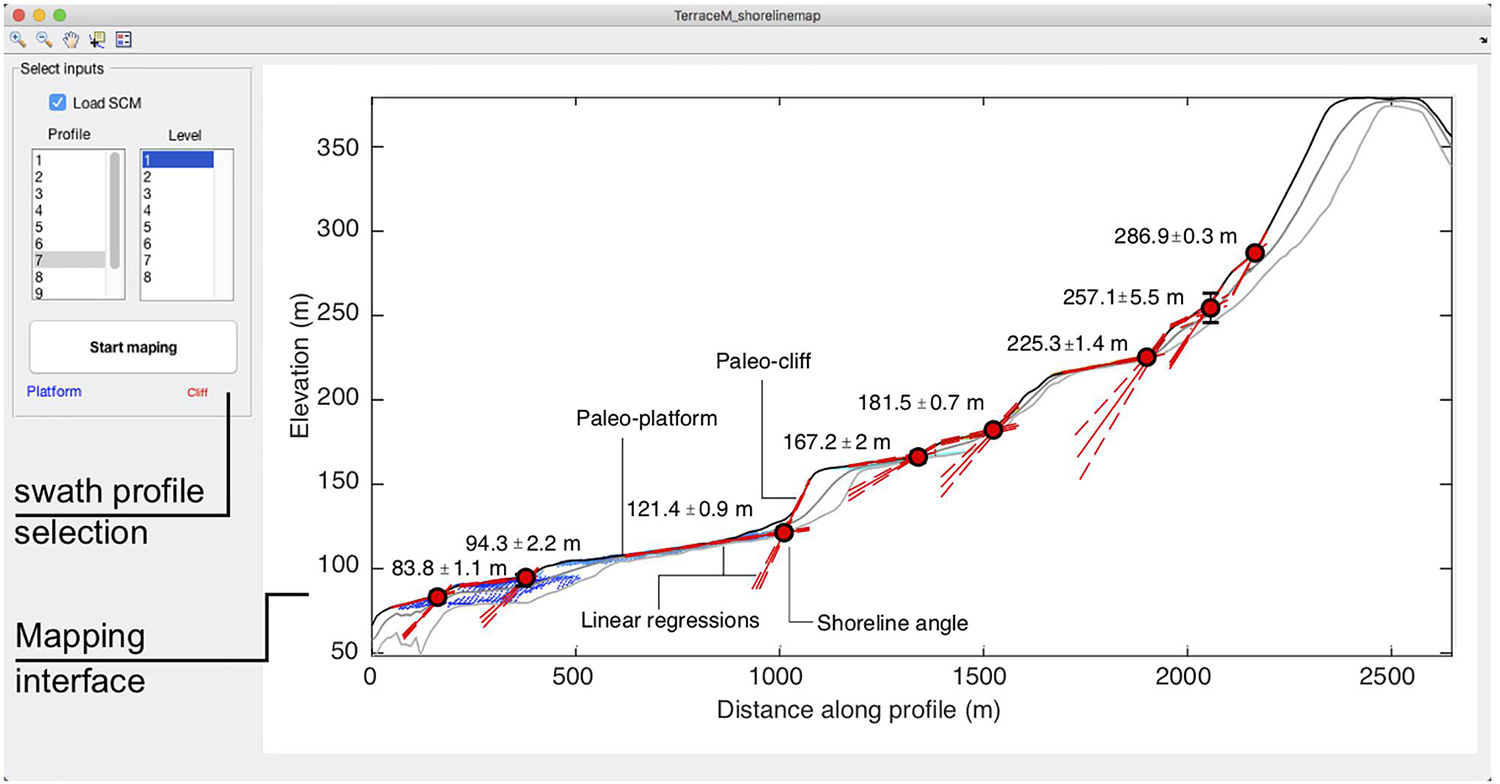
Figure 3. Shoreline mapping GUI. Numbers indicate elevation and error of shoreline angle measurements. Left panels allow for interactive selection of swath profiles and mapping methods.
Surface Classification Model
The second mapping method of TerraceM-2 MAP is based on Surface Classification Models (SCM) (Figure 4), designed to semi-automatically detect low-relief and gently inclined smooth areas, often associated with coastal terrace paleo-platforms and steeper areas that may represent terrace paleo-cliffs (Eqs. 1 and 2). The SCM is based on the method developed by Bowles & Cowgill (2012) that uses a combination of topographic slope (SLP) and roughness (RG), the former being defined as the standard deviation of the slope (Frankel and Dolan, 2007).
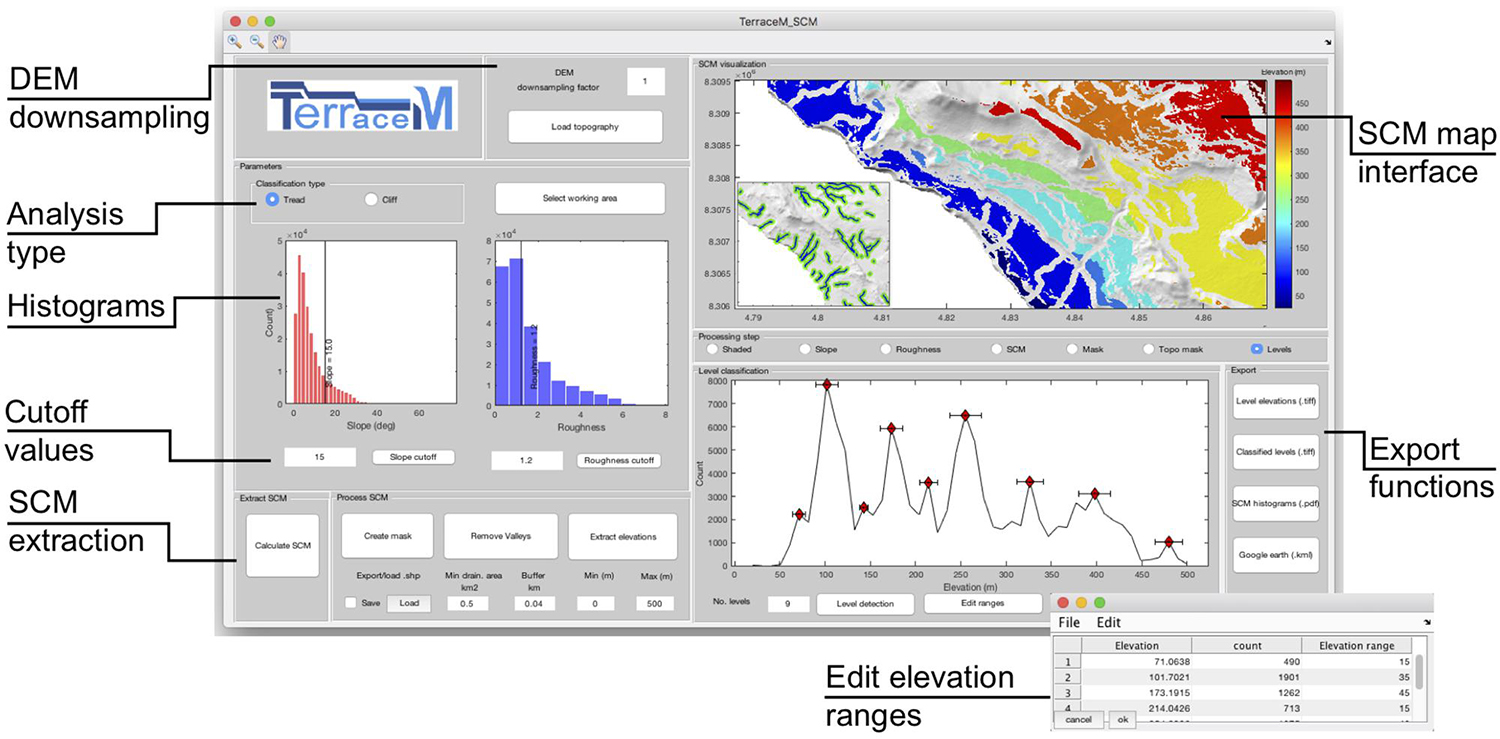
Figure 4. Surface Classification Module (SCM) mapping GUI. Blue and red histograms show distributions of slope and roughness, respectively; vertical black lines are the cut-off values. The upper right plots display the classified terrace levels and the drainage network used to remove false positive classifications.
The distribution of slope and roughness are truncated by user-defined cut-offs that characterize the morphometric attributes of paleo-platforms or paleo-cliffs (SLPr and RGr). The SCM is then calculated by normalizing and combining slope and roughness ranges, represented by patches masking marine terrace platforms or cliffs depending of the selected analysis (SCMcliff or SCMplat, Eqs. 1 and 2). False positive classifications may usually occur at valley bottoms and slopes; TerraceM-2 allows including a drainage network map and user-defined distance buffers to filter out such erroneous classifications (Figure 4). The resulting SCM patches are intersected with the topography to extract the elevations. Finally, elevation histograms are used to classify the SCM and to differentiate distinct terrace levels. The SCM algorithms are included in a GUI that allows for a quick adjustment and visualization of the morphometric parameters and interactive mapping of coastal terrace surfaces (Figure 4). The results of the SCM and swath profile mapping can be readily exported in shapefile, geotiff raster, or Googlearth® formats.
TerraceM-2 Landscape Evolution Model
Architecture and Inputs
The application of LEMs in wave-dominated coastal systems have allowed studying diverse processes shaping the landscape, such as relative sea-level variations, vertical deformation, coral reef growth rates, sediment transport and deposition, cliff retreat and diffusion, eolian transport, and river erosion among others (e.g., Hanks et al., 1984; Anderson et al., 1999; Storms and Swift, 2003; Nakamura and Nakamori, 2007; Refice et al., 2012; Thébaudeau et al., 2013; Kline et al., 2014; Shikakura, 2014; Melnick, 2016; Husson et al., 2018; Limber and Barnard, 2018). The application of LEMs for modeling the development of sequences of coastal terraces sequences can provide valuable chronological information in the absence of terrace ages (e.g., Jara-Muñoz et al., 2017; Bilbao-Lasa et al., 2019). Furthermore, LEMs allow simulating a diversity of possible geomorphic scenarios that may be difficult to evaluate using other approaches; for instance, complex histories of marine terrace reoccupation (e.g., Melnick, 2016), or marine terraces affected by variable uplift rates along time (Racano et al., 2019).
The TerraceM-2 LEM has been adapted from the wave erosion and energy dissipation model initially formulated by Sunamura (1992) and further developed by Anderson et al. (1999). This model has been already used to simulate the development of drowned shorelines in southern Chile (Jara-Muñoz et al., 2017), rasa surfaces in northern Chile (Melnick, 2016) as well as staircase marine terrace sequences in Turkey (Racano et al., 2019). The model simulates the morphology of wave-cut terraces formed under oscillating sea level conditions and variable or constant uplift rates (Figure 5). The erosive power of wave abrasion is defined as a linear function of the rate of wave energy dissipation (E1, Eq. 3) that follows an exponential increase as depth decreases landwards (Sunamura, 1992).
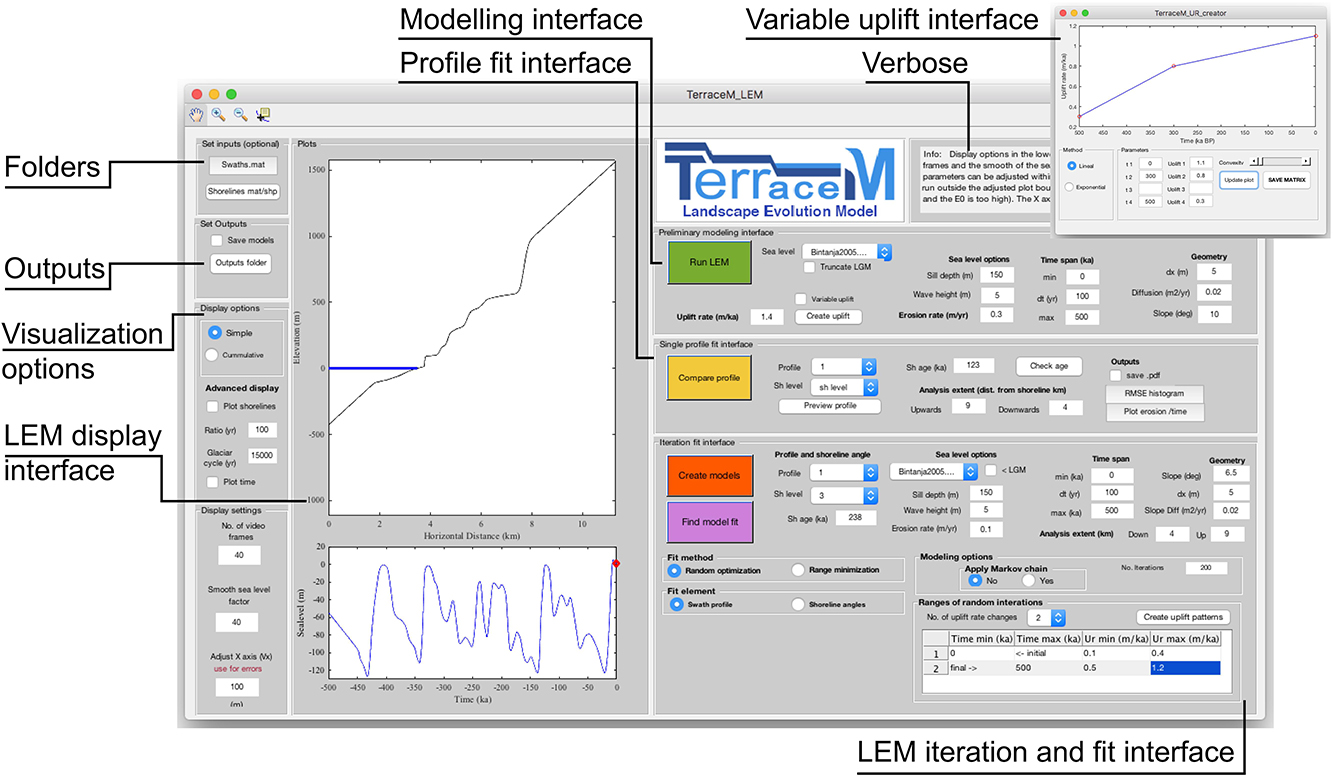
Figure 5. Landscape Evolution Model (LEM) GUI.
where Sl is the sea-level position at time t and Zn is the local water depth, (dz/dt) represents the vertical seabed erosion rate, which depends of wave base depth (Wb, Eq. 4).
beyond Wb water particle motions are too low to erode the sea floor (e.g., Bradley, 1958; Sunamura, 1992), Wb is related to the breaking wave height (HB) by the dimensionless constant B (Eq. 4). This constant has been assessed in several studies (e.g., Hallermeier, 1978; Thornton and Guza, 1983; Kline et al., 2014) ranging between 0.1 and 0.5. The wave energy dissipates as the wave approach to the coast and depends of the water depth and the near shore platform morphology (Bradley, 1958; Komar, 1998). E0 is the initial energy in the far field, which resembles the erosive power of waves, and is assumed to be constant. When dissipation is lower than E0 the remaining energy in the system (Ec, Eq. 5) can drive cliff retreat leading to an expansion of the wave-cut platform (Sunamura, 1992; Anderson et al., 1999).
The initial model geometry is a linear synthetic slope on which the terraces are carved; the slope angle (ϕ) as well as the size and resolution of the modeling domain can be customized. The simulated topography is adjusted incrementally depending of the uplift rate, which can be constant or variable over time. Likewise, slope diffusion (Hanks et al., 1984) may be included to account for the effect of local climate and surface-process dynamics on topography, to reproduce realistic marine terrace morphologies. To account for sea-level variations, we included a compilation of 10 published sea-level curves (Imbrie et al., 1984; Hemleben et al., 1996; Rohling et al., 1998, 2009; Lambeck et al., 2002; Lea et al., 2002; Waelbroeck et al., 2002; Siddall et al., 2003; Bintanja et al., 2005; Spratt and Lisiecki, 2016). The amplitude of low-stand periods of the sea-level curves can be modified to reproduce the influence of local bathymetry, as for instance the sill in the Gulf of Corinth (e.g., de Gelder et al., 2019). In addition, the effects of the Holocene sea-level rise can be removed to preserve low-stand marine terraces. TerraceM-2 LEM provides various outputs including the evolution of the coastline position, time series of cliff erosion rate (Figures 6A,B), synthetic topographic profiles, synthetic shoreline angle elevations for each modeled terrace level, and chronology of the marine terrace sequences (Figure 6C). The LEM outputs can be exported as image (.pdf), video (.mp4), and GIS files (.shp).
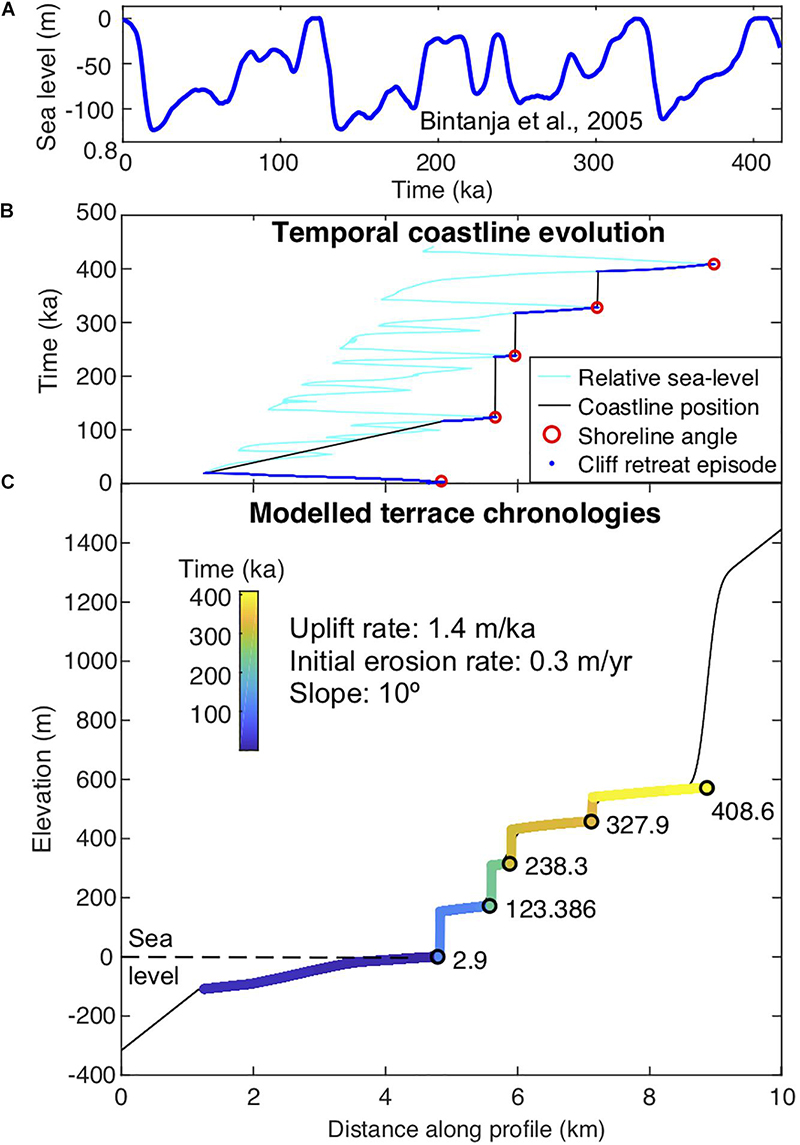
Figure 6. Example of LEM results. (A) Input sea-level curve. (B) Modeled temporal coastline evolution. (C) Modeled terrace topography color coded by age, for an uplift rate of 1.4 m/ka, initial erosion rate (E0) of 0.3 m/yr, and initial slope of 10°.
Comparing LEM Results With Marine Terrace Topography
The synthetic topography generated by TerraceM-2 LEM can be compared with measured swath profiles to determine ages of undated coastal terrace levels and estimate the uplift rate history. This analysis is recommended for areas of well-preserved coastal terraces, which include at least three terrace levels per profile. The horizontal scaling of modeled LEM topography and mapped TerraceM-2 MAP swath profiles is adjusted using a single shoreline angle of known age as piercing point. After modeled and measured profiles are scaled, the slope, diffusion, initial erosion rate, uplift rate, as well as other LEM parameters, can be adjusted to fit the width and height of the paleo-platforms and cliffs to reproduce the entire sequence of coastal terraces.
To search for the best-fitting modeled to measured topography, we developed two statistical approaches: (a) iteration of LEM parameters based on defined ranges and increments; and (b) a random optimization method based on random sampling Monte Carlo -based scheme. The first method is useful to search for discrete time-independent parameters. The second method can be applied when higher degrees of freedom are involved in the computation, such as for time-dependent scenarios involving variable uplift or erosion rates. Best-fitting models are selected based on Root Mean Square (RMS, Eq. 6) and Normalized Root Mean Square Error (NRMSE, Eq. 7) statistics,
where Zobs is the maximum distribution of elevations of swath topography and ZLEM is the LEM elevations. TerraceM-2 LEM also includes the option to find the best fit by minimizing the area between model and observations. To perform the analyses, we developed the “LEM iteration and fit interface,” which allows an interactive selection of the modeling parameters and quick analysis of profiles (Figure 5). The best-fit models can be exported as graphic (.pdf) and Matlab® data (.mat) files. The LEM model and LEM fit functions can be called independently from command line to develop custom workflows (see SP2.2 and Supplementary Figure 6SP).
TerraceM-2 Dislocation Modeling
Active faults in coastal areas may produce local relative sea-level changes, surface ruptures, and increasing the magnitude and arrival times of tsunami waves (e.g., Wendt et al., 2009; Melnick et al., 2012; Jara-Muñoz et al., 2017). Therefore, identifying seismically active structures and estimating their slip rate are crucial to assess the spatial and temporal characteristics of seismic hazards in coastal areas. TerraceM-2 includes a novel routine to model fault dislocations and surface deformation based on the spatial distribution of coastal terrace elevation or uplift rates (Figure 7). TerraceM DIM is based on the fault-dislocation theory of Okada (1985) that provides an analytical solution for surface deformation resulting from slip along a fault in a homogeneous elastic half-space. Fault parameters such as fault-slip rate and length are crucial to infer potential earthquake scenarios as well as recurrence times and earthquake magnitude (e.g., Anderson and Menking, 1994; Wells and Coppersmith, 1994; Jara-Muñoz et al., 2017).
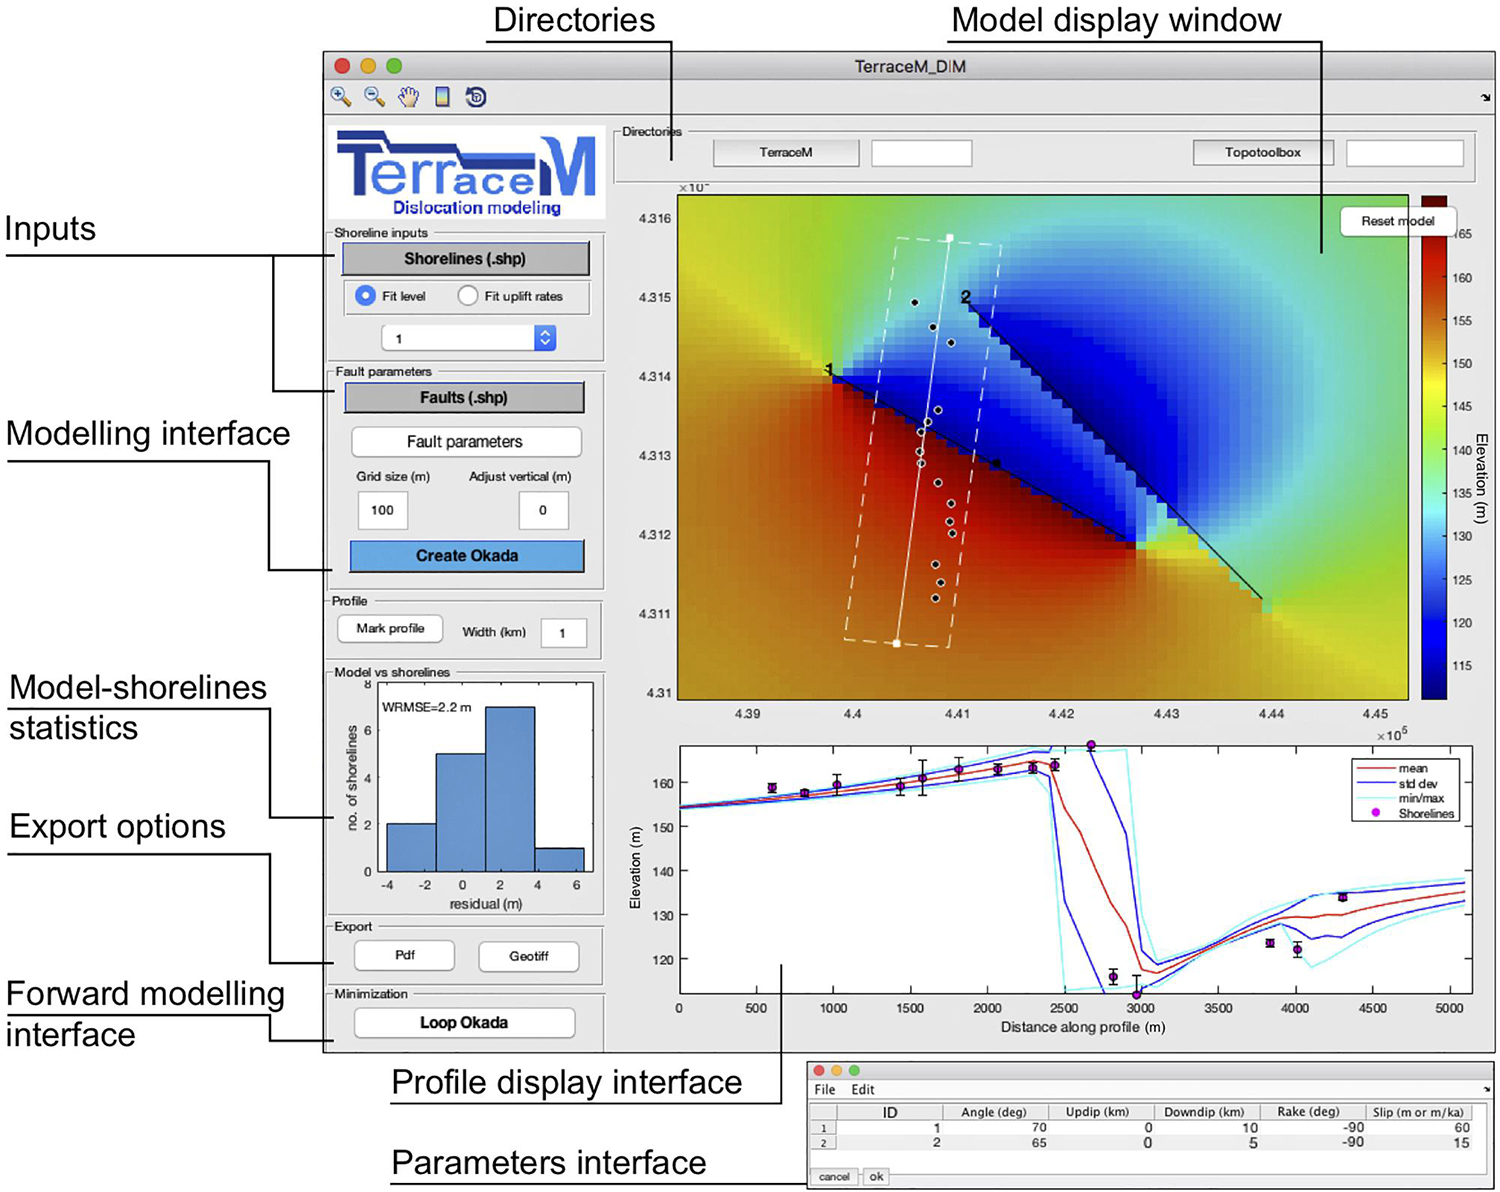
Figure 7. Dislocation Model (DIM) GUI.
TerraceM-2 DIM is designed as a workflow including three steps: (a) loading inputs, (b) sensitivity tests to define the ranges of fault parameters, and (c) iterating fault parameters to search for a best-fitting model. Fault parameters include strike, length, slip, rake, down-dip, up-dip, and dip angle; fault geometries can be imported from GIS platforms as shapefile (.shp). Furthermore, the TerraceM-2 DIM functions can be executed from command line to create custom workflows (see SP2.3 and Supplementary Figure 7SP). The TerraceM-2 DIM GUI is designed to perform quick sensitivity tests to determine the approximate solution and set the parameter ranges (Figure 7). Fault parameters are then iterated using random optimization for an unlimited number of faults. The Weighted Root Mean Square Error (WRMSE) is calculated by comparing modeled uplift or elevations with measured shoreline angles, and minimized to determine the best-fitting model using the WRMSE (Eq. 8),
where Zobs are the elevations of shoreline angles, ZobsE are the associated errors, and Zmodel are the surface displacements of the dislocation model at the location of the shoreline angles. The best-fit model can be exported as geotiff raster and added as an new attribute to the shoreline angle shapefile; fault parameters can be exported as tables (.xls and .txt), for rapid interaction with other software platforms and further analysis of the results. TerraceM-2-DIM scripts and the other TerraceM-2 modules are included in the Supplementary Material SP2.
Examples
Three examples are provided to illustrate the capabilities of TerraceM-2 modules and also the use of topographic data with different spatial resolution. The spatial resolution ranges from very-high (0.5 m/px) for drone surveys in the Dead Sea, high (2 m/px) for airborne Light Detection and Ranging (LiDAR) surveys in California, and moderate (12-m) for radar topography such as TanDEM-X along the coast of Peru. These need for moderate, high, or very-high resolution data will depend on the spatial scale of the geomorphic features of interest and the analysis method, which will be illustrated in the following case studies.
Mapping Lacustrine Shorelines in the Dead Sea
The Dead Sea is the deepest continental basin on the Earth, located along the left-lateral transform boundary Dead Sea transform fault (DSF, Figure 8A), between the Arabian and Sinai plates (Garfunkel, 1981; Garfunkel and Ben-Avraham, 1996), characterized by ongoing tectonic activity. During the Late Pleistocene the Dead Sea basin experienced a dramatic lake-level drop of ∼200 m recorded in the sedimentary sequences of the Lisan Formation and as sequences of regressive lacustrine shorelines that straddle the coast of the Dead Sea (Figures 8B,C) (Bowman, 1971; Bartov et al., 2002; Ghazleh and Kempe, 2009; Torfstein et al., 2013). The outstanding exposure and excellent preservation of dozens of fossil lacustrine shorelines represent a perfect site to test the mapping capabilities of TerraceM-2 and to track permanent deformation accumulated by the DSF.
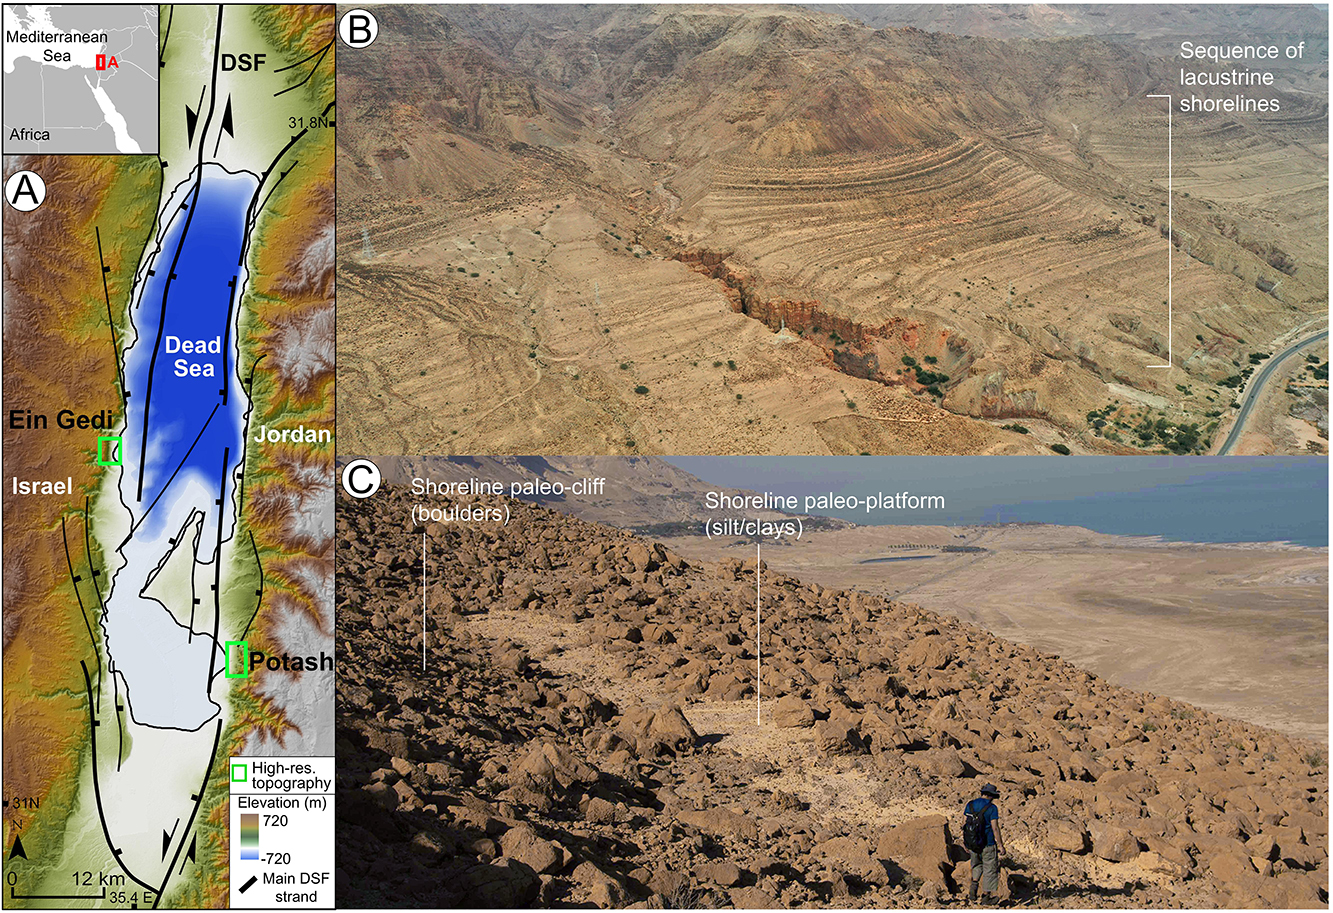
Figure 8. Fossil lacustrine shorelines of the Dead Sea. (A) Tectonic setting of the Dead Sea showing main strands of the Dead Sea Fault (DSF). Green rectangles show location of analyzed sites. (B) Aerial view of lacustrine shorelines in Jordan, dark and light fringes are shoreline cliffs and treads, respectively. (C) Detailed view of a shoreline in Israel, note cliff formed by boulders and the paleo-platform by accumulations of fine sediments.
Lacustrine shorelines at Ein Gedi site, Israel, comprise a sequence of 21 levels between -185 and -355 m asl (Bowman, 1971, 1997). The shorelines morphology is characterized by paleo-platforms of 5–40 m width partly covered by clays and silt; in contrast, the shoreline cliffs are characterized by accumulations of boulders and slight changes in slope (Figure 8C). The site in Jordan is located in front of the Lisan Peninsula, near the Potash company area, and comprises a sequence of 23 shorelines formed between -170 and -355 m asl and almost continuously exposed along the coast in this area (Ghazleh and Kempe, 2009). The morphology of the shoreline cliffs and platforms is similar to Ein Gedi. The overall morphology of both sites resembles a bar-code formed by light and dark fringes corresponding to the paleo -platforms and -cliffs (Figure 8B). The ages of the lacustrine shorelines at both sides of the Dead Sea range between 20 and 30 ka (Ghazleh and Kempe, 2009; Jara-Munñoz et al., 2019), and record the progressive drop of the lake during the Late Pleistocene.
We used the TerraceM-2 MAP module to estimate the amount of permanent deformation accumulated by the DSF, comparing the distribution of lacustrine shorelines at both flanks of the Dead Sea. Lacustrine shorelines along the Dead Sea are characterized by a smooth topographic expression that complicates the mapping of shoreline angles using topographic swath profiles. Therefore, instead of using swath profiles we studied the metrics of lacustrine shorelines using the SCM that can be adjusted to enable the distinction between slight changes of slope, differentiating shoreline paleo-platforms of different levels (Figures 9A,B). We performed this analysis using high-resolution topography, and complementing our mapping with field geomorphic observations. We surveyed high-resolution topography in Israel and Jordan using a photogrammetric drone, the images were processed using structure from motion software and vertically georeferenced with ground control points, obtaining a 0.5 m/px digital terrain models (Figures 9A,B).
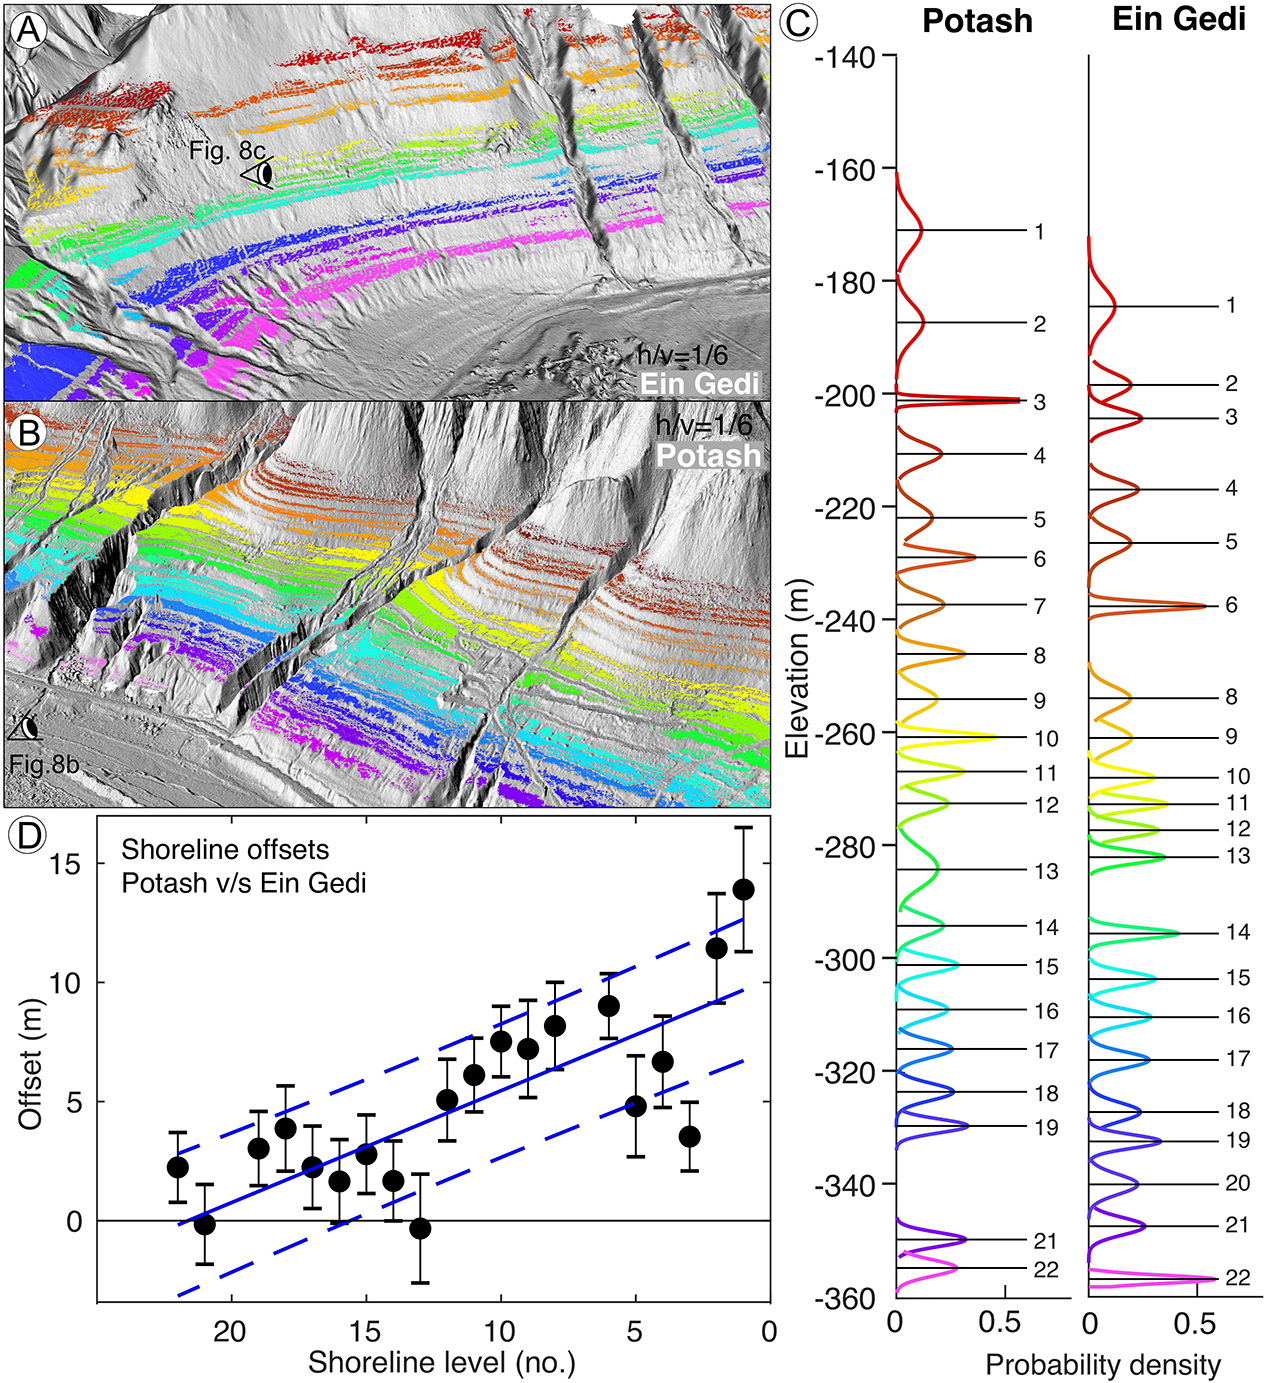
Figure 9. Results of the morphometric analysis of Dead Sea lacustrine shorelines at Ein Gedi (Israel) and Potash (Jordan) sites. (A,B) 3D perspective views of SCM mapping using high-resolution SfM topography, h/v is the proportion between vertical and horizontal scales. (C) Distribution of elevations of fossil lacustrine shorelines at Potash and Ein Gedi. (D) Vertical offsets between Potash and Ein Gedi shorelines, assuming continuity and no reoccupation; blue dashed lines show the 95% confidence bounds of the linear regression (see text for details).
We adjusted the roughness and slope thresholds of the SCM between 0.1 and 0.3 and between 8° and 12° respectively. We converted the shoreline elevations to probability density functions, using the mean value of the distribution of the elevations of each shoreline level to perform the comparisons between sites (Figure 9C). Due to the lack of chronological constraints of individual shoreline levels we attempt to correlate shorelines between Potash and Ein Gedi comparing first levels of lower elevations considering that accumulated less deformation and thus are preserved at similar elevation and by assuming that the sequence of shorelines at both sites is continuous. Our results display a linearly incremental pattern of vertical offsets between shorelines at both sites (Figure 9D), ranging from 0 to 4 m for the lower shorelines (levels 13 to 22) and between 5 and 14 m for the higher shorelines (levels 1 to 12). The shoreline offsets represent relative vertical displacements between both sites; therefore, we cannot identify which of the sites has been uplifting or subsiding. However, it is possible to distinguish that lacustrine shorelines at the Potash site are higher than at Ein Gedi (Figure 9C). If we consider that the maximum age of these shorelines is ∼30 ka (Ghazleh and Kempe, 2009), then the mean differential vertical velocity between both sites would be ∼0.5 m/ka. Furthermore, both sites are located on the footwalls of the main fault strands of the DSF (Figure 8A), located offshore along the Israeli and the Jordan coasts and at similar distance from the sites (∼5 km). When compared to the DSF strand in Israel, our results suggest a faster slip rate of the DSF along the fault strand near the coast of Jordan.
Despite the limited age constraints and the possible uncertainties in our correlation method, this example highlights the applicability of TerraceM-2 morphometric analyses in mapping lacustrine shorelines and in efforts to detect and measure subtle manifestations of surface deformation. These new approach open new possibilities for potential application in other terminal lakes exhibiting emerged lacustrine shorelines, such as at Uyuni salt lake in Bolivia and lake Bonneville in US among others (Chen and Maloof, 2017; Zeilinger et al., 2018).
Modeling Fault Slip Rates Using Marine Terraces at Santa Cruz, California
We compare fault slip rates derived from marine terrace deformation patterns obtained by previous studies and by TerraceM-2 DIM in the Monterrey bay, California. This area is characterized by continuous exposure of several levels of extensive marine terraces that can be followed over distances of hundreds of kilometers along the coast (Alexander, 1953; Bradley and Griggs, 1976). The marine terraces are preserved at elevations between ∼30 and ∼200 m asl and displaying a notorious warping apparently related to deformation of the plate boundary strike slip San Andreas fault (SAF, Figure 10A). Anderson and Menking (1994) associated marine terrace deformation patterns to co-seismic fault slip during earthquakes similar to the Loma Prieta earthquake (Mw 6.9) occurred in 1989, which epicenter was located 15 km east of the bay (Lisowski et al., 1990; Wald et al., 1991). Using elastic dislocation models, the deformation patterns of the whole sequence of marine terraces, and the rupture parameters of the Loma Prieta earthquake, Anderson and Menking (1994) determined a long term vertical fault slip rate between 2.4 and 4.1 m/ka.
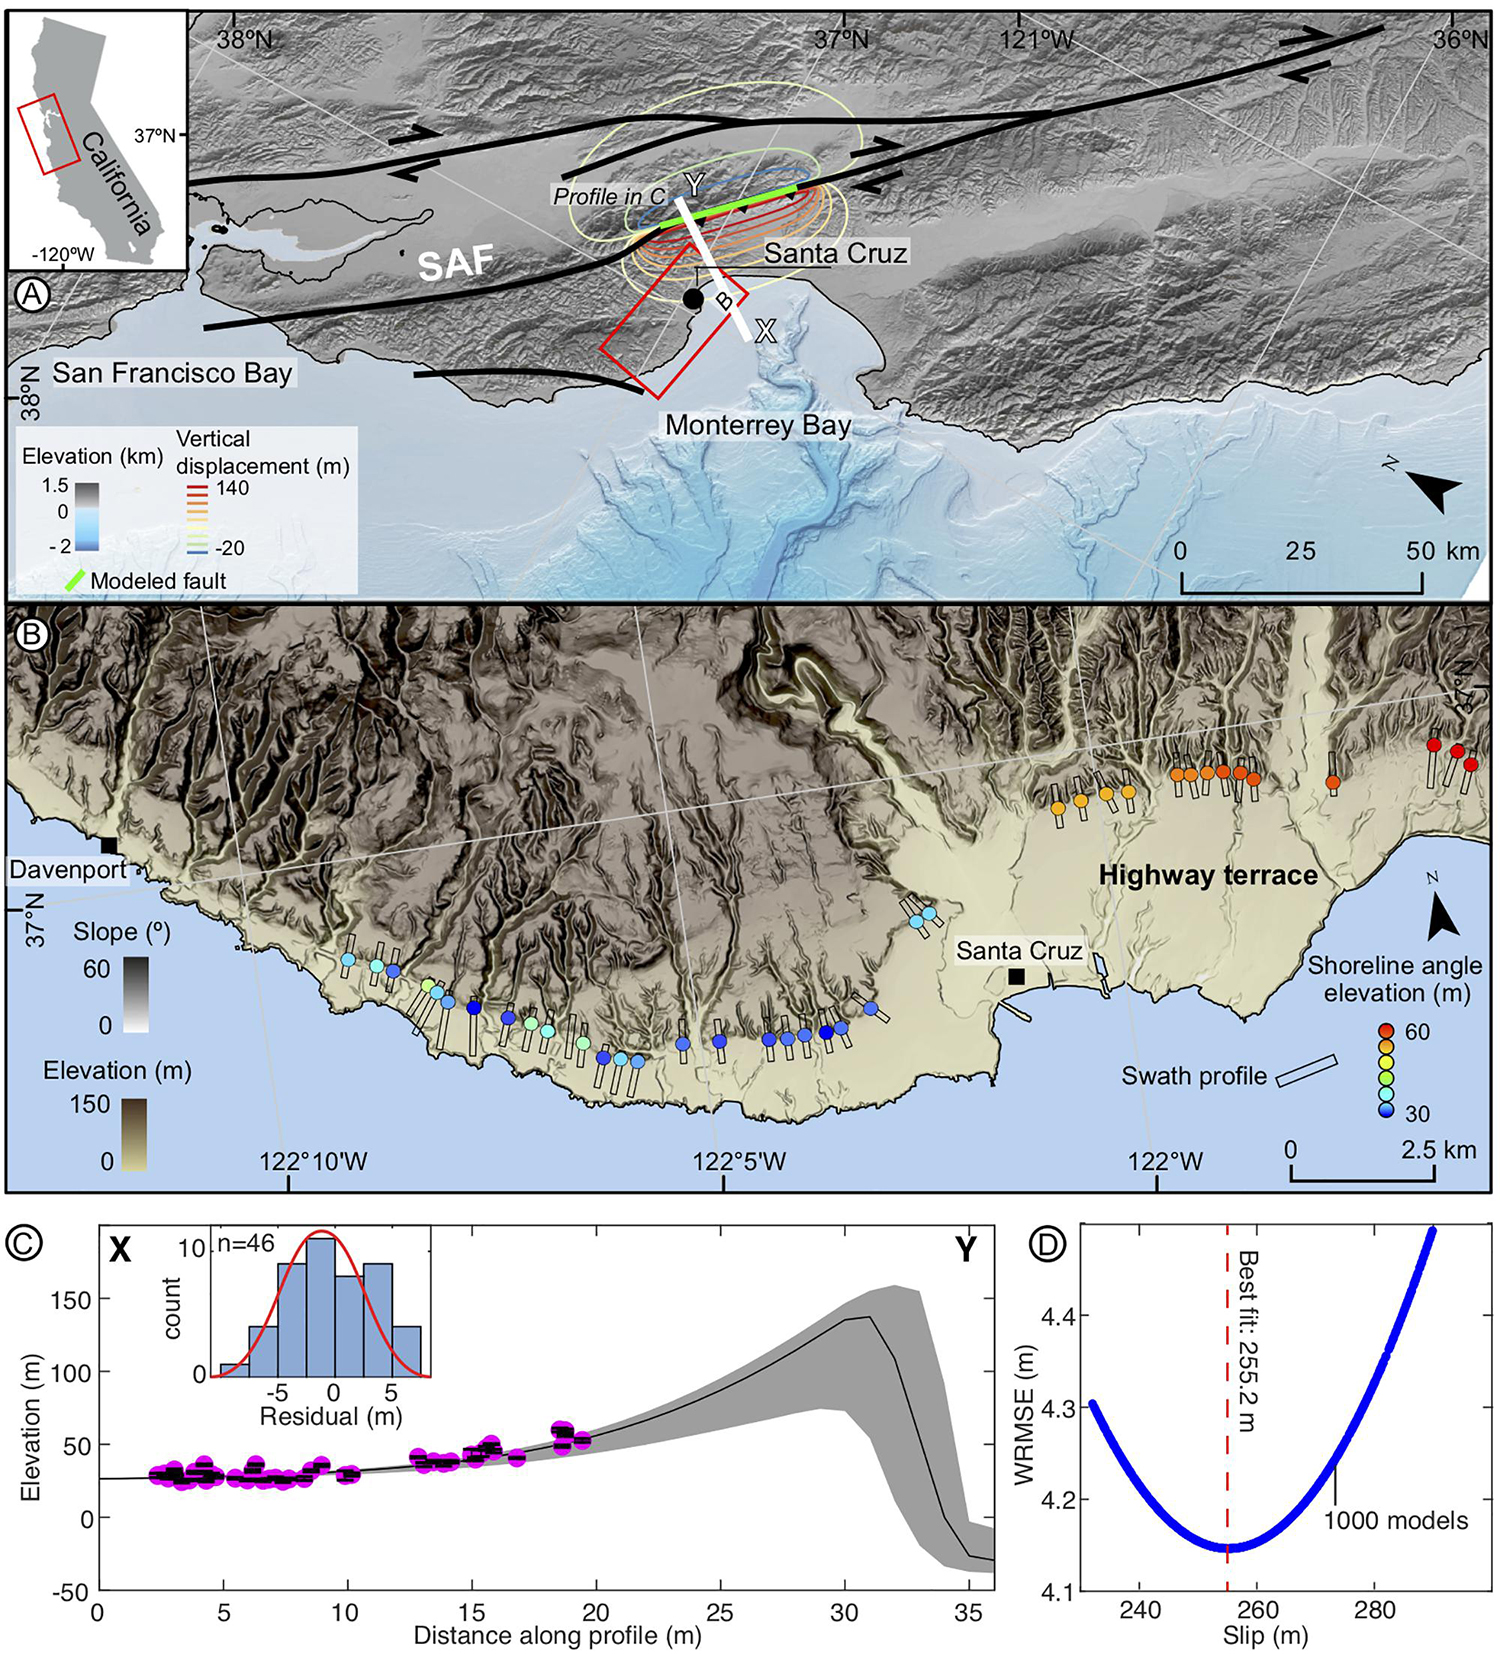
Figure 10. Estimating fault-slip rate in Monterrey bay, California. (A) Tectonic setting displaying the location of the San Andreas Fault (SAF) and the Monterrey Bay. The green line is the rupture zone of the Mw 6.9 Loma Prieta earthquake, the white line X-Y is the profile in C, contours are the surface displacements of the best-fit dislocation model in C. (B) Shoreline angles mapped with TerraceM MAP colored by elevation. (C) Best fit elastic dislocation model, pink dots are shoreline angles, the inset display the distribution of residuals. (D) Iterations and Minimum weighted root mean squared error (WRMSE), red dashed line indicate the best-fit slip value.
In this example we focus on the Highway terrace, the lowest and best-preserved terrace level in the area bounded by a prominent paleo-cliff. We use TerraceM-2 MAP and LiDAR data (2-m/px) available from the National Oceanic and Atmospheric Administration (NOAA1) to determine shoreline angles from 46 swath profiles (Figure 10B). We obtained a continuous record of shoreline angles along 25 km of coast, ranging between ∼30 and ∼60 m asl and increasing in elevation eastwards. Anderson and Menking (1994) tentatively correlated the Highway terrace with MIS 5; however, due to the lack of chronological constraint at that time the authors were unable to distinguish between the MIS5e (∼125 ka) and MIS 5c (∼105 ka) levels. Therefore, for this example we compared fault slip rates considering both possible ages. We use TerraceM-2 DIM to generate a dislocation model based on the fault parameters of the Loma Prieta earthquake; we consider a single reverse fault oriented N50°W and with a 70°SW dip (Wald et al., 1991; Anderson and Menking, 1994), 50 km length (Smith and Sandwell, 2006), and up- and downdip depths of 1 and 17 km, respectively (Lisowski et al., 1990; Anderson and Menking, 1994). To simplify our model, we neglect lateral displacements using a rake of 90°. We iterate 1000 models (Figure 10D) using random slip values within the range of previous estimates, determining the best fit for a vertical dip and fault slip of 255.2 m (Figure 10C), equivalent to a fault slip rate of between 2.1 and 2.6 m/ka for MIS 5e and MIS 5c ages, respectively, which is similar to the previous estimates of Anderson and Menking (1994). This example and highlights the advantage of integrated mapping and modeling routines of TerraceM-2 and also the quick and easy application of modeling methods, which would usually require advanced knowledge in computer programming.
Modeling the Evolution of Marine Terraces in Southern Peru
We compared the uplift rates estimated with TerraceM-2 LEM and previous estimates at Cerro el Huevo, southern Peru. This area is characterized by remarkably well-preserved and laterally continuous marine terrace sequences that form a staircase morphology. The Cerro el Huevo site is located adjacent to San Juan de Marcona bay, above the south-eastern flank of the Nazca Ridge, which is subducted beneath the South American plate (Figure 11A). Previous studies in this area (Hsu, 1988, 1992; Ortlieb and Macharé, 1990; Saillard et al., 2011) have described staircase sequences of uplifted wave-cut marine terraces comprising more than 10 levels reaching ∼250 m asl and etched on the western slope of Cerro el Huevo (Figure 11B). The chronology of these terraces has been partly determined by amino acid racemization spanning the period between the marine isotope stages (MIS) 3 and 11 (∼60 to ∼400 ka) (Hsu, 1988, 1992); additionally, Ortlieb and Macharé (1990) determined U/Th ages for the period between MIS 5 and 7 (∼125 to ∼230 ka). However, most of these ages were reinterpreted in the context of cosmogenic radionuclide dating that provided ages between MIS 7 and 11 (∼230 to ∼400 ka) (Saillard et al., 2011). Saillard et al. (2011) compared marine terraces ages to sea-level high-stands using the compilation of sea-level variations of Siddall et al. (2007), obtaining uplift rate estimates between 0.4 and 0.9 m/ka. However, according to Saillard et al. (2011), these rates vary along time from 0.6 m/ka between 400 and 100 ka to 0.8 m/ka after 100 ka, associated with the progressive southward migration of the Nazca ridge. Considering the complex uplift history of this area, and the availability of marine terrace ages and TanDEM-X topography data (12 m/px), Cerro el Huevo represents a perfect site to test the modeling and mapping capabilities of TerraceM-2.
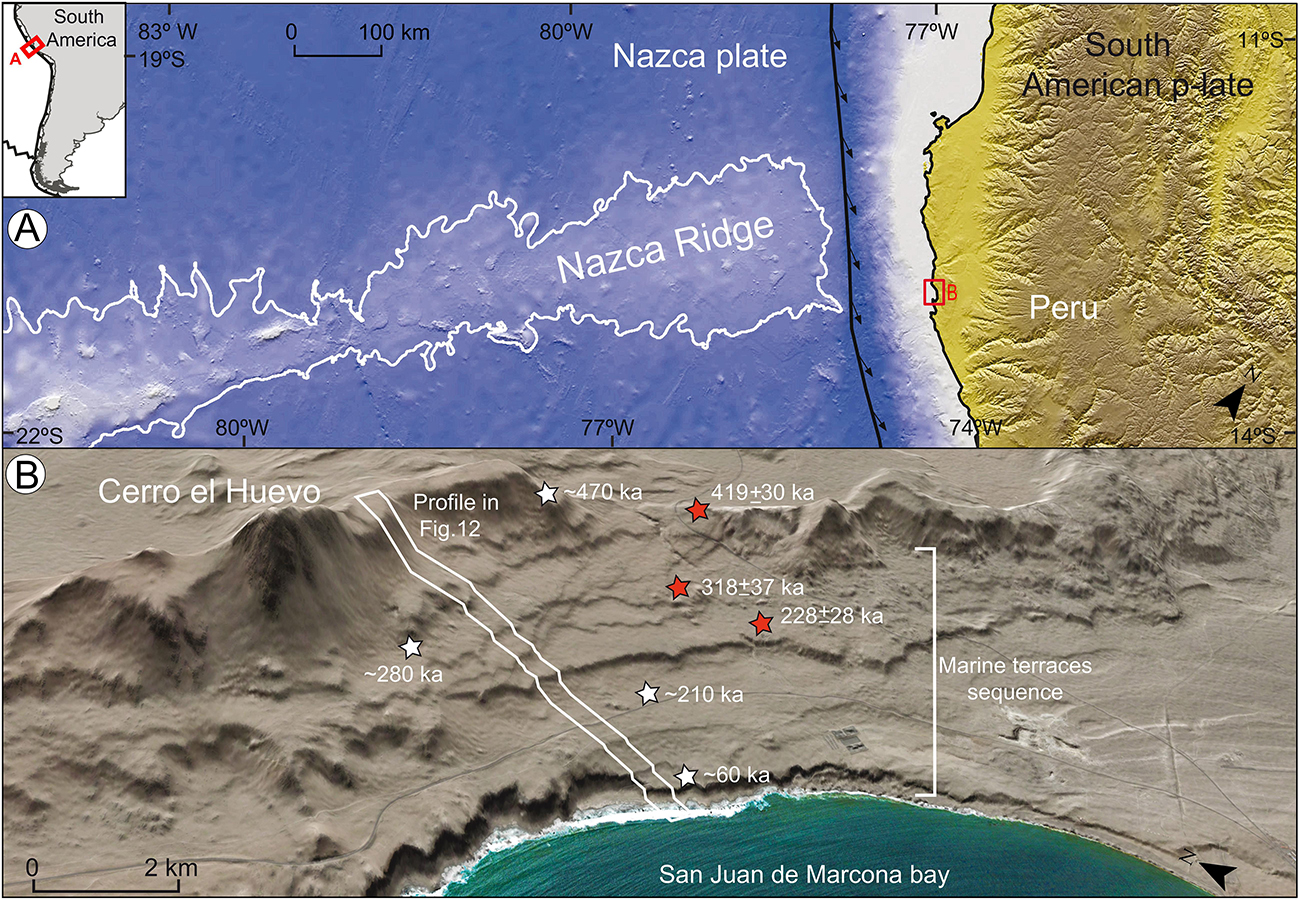
Figure 11. Marine terraces at Cerro el Huevo, in Southern Peru. (A) Tectonic setting highlighting the morphology of the Nazca Ridge. (B) Geoeye Google Earth® image of Cerro el Huevo and the Marcona Bay. Note staircase marine terrace morphology. Red and white stars denote ages from Saillard et al. (2011) and Hsu (1988), respectively (see text for details).
To reproduce the Cerro el Huevo marine terrace sequence, we apply the LEM with the sea-level curve of Rohling et al. (2009), which is based in part in Siddall et al. (2007), but provides a better resolution for high-stand periods, allowing the generation of detailed sequences of synthetic LEM terraces. The initial slope of the LEM was fixed to 11° based on the angle between the highest elevation point and the coastline along the swath profile. The optimal E0 was determined after sensitivity tests, obtaining an initial value of 0.05 m/yr that better reproduce the average width of the marine terrace platforms. To simplify our model, we neglected cliff diffusion. We measure the elevation of marine terraces using 12 m/px TanDEM-X topography, provided by the Deutschen Zentrums für Luft- und Raumfahrt (DLR), extracting a swath profile of 2.5 × 0.3 km that included the whole sequence of marine terraces (Figure 11B). The modeled and measured marine terraces topography were tied using the shoreline angle of the MIS 5e terrace level (Figure 12A) located at ∼100 m asl (Saillard et al., 2011). To find the best-fitting model that reproduces both the topography and ages, we used an optimization technique, generating random patterns of variable uplift rates within a range that included the previous uplift rate estimates of Saillard et al. (2011). We iterated 150 uplift rate histories and determined the best fit model by minimizing the NRMSE; this model comprises a history of uplift variability, including rates between 0.1 and 0.2 m/ka during the period between 500 and 350 ka, 0.3 and 0.5 m/ka between 350 and 150 ka, and between 0.9 and 1 m/ka since 150 ka (Figure 12B).
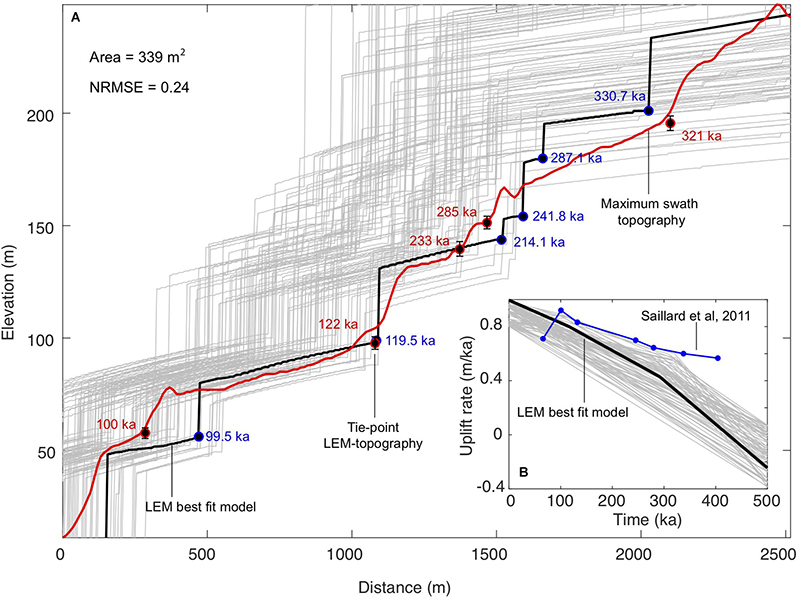
Figure 12. LEM results at Cerro el Huevo. (A) Black line shows best-fit modeled topography and red line measured maximum swath topography using a TanDEM-X 12-m DEM. Gray lines show results from random-sampling modeling using 150 iterations. Blue and red numbers indicate the age of the modeled and measured shoreline angles, respectively. (B) Uplift rate histories from LEM iterations and from Saillard et al. (2011). Black line shows best-fit model. The minimized area between model and topography and the Normalized Root Mean Squared Error (NRMSE) of the best fit model are indicted in the upper left corner.
This difference between our LEM-based uplift rate history and the previous estimates of Saillard et al. (2011) is interesting as it points to a common flaw in the methodology to determine uplift rates using shoreline angles. The LEM minimization method identifies the modeled topography that optimally fits the maximum swath topography; therefore, it may be argued that the discrepancy between our results and those of Saillard et al. (2011) could be related to an incorrect fit between terrace levels of different ages. However, as may be observed in Figure 12A, the modeled ages and the terrace ages from Saillard et al. (2011) are in good agreement. In fact, Saillard et al. (2011) estimated uplift rates by comparing the present-day shoreline angle elevation with the sea-level position and the age of the associated high-stand. They missed out on taking into account the fact that surface uplift is incremental, and therefore temporal variations in uplift rates will affect cumulative vertical displacements. Thus, uplift rate determinations that exclusively consider the present-day elevation of marine terraces may include systematic biases. For instance, if uplift rate increase over time, older marine terraces will accumulate the sum of vertical displacements, and thus uplift rates estimates based on the present-day elevation of shoreline angles will be overestimated. We suggest that this was the case for the measurements of Saillard et al. (2011), which overestimated uplift rates of the older marine terraces (MIS 7 to 11, Figure 12B). Our uplift rate history for the Cerro El Huevo in southern Peru suggests a continuous increase of uplift rates over the past ∼500 ka, which agrees with reconstructions of the southward-migrating collision between the Nazca ridge and the South American margin (Hampel, 2002). This example highlights the advantage of LEMs to resolve vertical displacements under complex uplift rate histories, which would be difficult using conventional marine terrace analysis methods.
Summary
Coastal terraces have been widely used to estimate past water level positions and vertical deformation rates in marine and lacustrine landscapes. Since its release in 2016, TerraceM has been used in different coastal settings around the world to map terraces in marine and lacustrine realms quantitatively. The upgraded version of TerraceM-2 improves processing efficiency and includes new modules and ancillary functions to map, process, analyze, model, export, and display morphometric and spatial characteristics of marine and lacustrine terraces. Next, we describe the advantages and limitations of TerraceM-2.
Advantages of TerraceM-2:
• Interface: TerraceM-2 includes GUIs that facilitate the analysis of terraces for inexperienced users, and also includes independent functions designed for custom command line programming for advanced users.
• User experience: The intuitive TerraceM-2 interface design includes interactive message windows to guide the user through the different modules.
• Integration: TerraceM-2 modules are designed to exchange data between them allowing to easily integrate the mapping and modeling capabilities.
• Efficiency: TerraceM-2 improved its processing speed at least eleven times in comparison with the previous release of TerraceM.
Limitations of TerraceM-2:
• Objective: TerraceM-2 is designed for mapping only marine and lacustrine terraces. However, the SCM interface may be used to map any planar landform, such as peneplains or fluvial terraces associated with both aggradation or erosion.
• Inputs: TerraceM-2 is designed to work with high-resolution topography. However, the resolution will
• depend on the spatial scale of the targeted geomorphic features. We present three examples that rely on data at different resolutions to illustrate
the use of TerraceM-2 to analyze geomorphic features with different spatial scales.
• Software platform: TerraceM-2 is open source but runs under Matlab® 2017 or later, which is a paid software. However, MathWorks® provides free Matlab® licenses to students and low-cost licenses for educational and research institutions. We favor Matlab® above other open-source programming software because of its versatility with GIS data.
• Efficiency: TerraceM-2 can be used in a normal desktop or notebook computer running Windows®, Linux®, or Mac® operational systems. However, its efficiency depends of the technical characteristics of each computer (e.g., amount of memory or processor speed).
We present three examples to highlight the new features in TerraceM-2: lacustrine shoreline mapping using very-high-resolution drone topography (0.5 m/px) in the Dead Sea, estimating fault slip rates using the deformation pattern of marine terraces in California using high-resolution LiDAR data (2 m/px), and estimating temporal variability of coastal uplift rates associated with ridge subduction in southern Peru using TanDEM-X data (12 m/px). These examples provide a guide on the resolution of the topographic data needed to map, model, and analyze different wave-cut geomorphic features quantitatively and highlight the novel methodological improvements of TerraceM-2, which will help the research community studying marine and lacustrine terraces.
Data Availability Statement
All datasets generated for this study are included in the manuscript/Supplementary Files.
Author Contributions
JJ-M developed TerraceM and wrote the manuscript. DM participated in the conceptual and technical development of the TerraceM-2 functions and prepared the manuscript. KP compiled a worldwide database of marine terraces included in this version of TerraceM-2 and actively participated in the development of the manuscript and in the discussion of marine terrace concepts. MS actively assisted in the development of this manuscript, the discussion of marine terrace concepts, and quantitative mapping methods.
Funding
This study was supported by the Deutsche Forschungsgemeinschaft (DFG), the Project “LIFE: Linking Lake-level variations, surface deformation and seismogenesis in the Dead Sea” Grant JA 2860/1-1 funded by DFG, Grant STR 373/30-1, project ME 3157/4-1 funded by DFG, and the Millennium Science Initiative (ICM) of the Chilean government through Grant NC160025 “Millennium Nucleus the Seismic Cycle along Subduction Zones, Cyclo,” National Fund for Scientific and Technological Development (FONDECYT) grants 1150321, 1181479, and 1190258. MS was supported by the German Israeli Foundation (GIF) (Grant No. I-1280-301.8/2014).
Conflict of Interest
The authors declare that the research was conducted in the absence of any commercial or financial relationships that could be construed as a potential conflict of interest.
Acknowledgments
We thank Peru Bilbao, Simone Racano, José-Miguel Martínez, Gino de Gelder, and Sedigheh Farahi for valuable suggestions and bug reports that helped improving TerraceM-2, and Marco Meschis for insights on the synchronous correlation method. The TerraceM-2 codes and scripts are included in the Supporting Information and available at www.terracem.com. We would also like to thank Prof. Amotz Agnon and Yaniv Darvasi from the Institute of Earth Sciences of the Hebrew University of Jerusalem that surveyed the drone topography in Israel and introduced the authors on the geology and geomorphology of the Dead Sea.
Supplementary Material
The Supplementary Material for this article can be found online at: https://www.frontiersin.org/articles/10.3389/feart.2019.00255/full#supplementary-material
Footnotes
References
Alexander, C. S. (1953). The Marine and Stream Terraces of the Capitola-Watsonville Area. Berkeley, CA: University of California Press.
Anderson, R., Densmore, A., and Ellis, M. (1999). The generation and degredation of marine terraces. Basin Res. 11, 7–19. doi: 10.1046/j.1365-2117.1999.00085.x
Anderson, R. S., and Menking, K. M. (1994). The Quaternary marine terraces of santa cruz, California: evidence for coseismic uplift on two faults. Geol. Soc. Am. Bull. 106, 649–664.
Armijo, R., Meyer, B., King, G., Rigo, A., and Papanastassiou, D. (1996). Quaternary evolution of the Corinth Rift and its implications for the late cenozoic evolution of the Aegean. Geophys. J. Int. 126, 11–53. doi: 10.1111/j.1365-246x.1996.tb05264.x
Bartov, Y., Stein, M., Enzel, Y., Agnon, A., and Reches, Z. (2002). Lake levels and sequence stratigraphy of Lake Lisan, the late Pleistocene precursor of the dead sea. Quat. Res. 57, 9–21. doi: 10.1006/qres.2001.2284
Benjelloun, Y. (2017). The Middle Strand of the North Anatolian Fault in Iznik Region : Insights From Geomorphology and Archeoseismology. Ph.D. thesis, Université Grenoble Alpes, Grenoble.
Bilbao-Lasa, P., Jara-Muñoz, J., Álvarez, I., Aranburu, A., Iriarte, E., Arriolabengoa, M., et al. (2019). “Aproximación a las paleolineas de costa en la plataforma del pais vasco en la última transgresión,” in XV Reunion Nacional Cuaternario, ed. L. Bilbao, (Hungary: Asociación Española para el Estudio del Cuaternario).
Bintanja, R., van de Wal, R. S., and Oerlemans, J. (2005). Modelled atmospheric temperatures and global sea levels over the past million years. Nature 437, 125–128. doi: 10.1038/nature03975
Bloom, A. L., and Yonekura, N. (1990). Graphic Analysis of Dislocated Quaternary Shorelines. Washington DC: National Academic Press, 104–115.
Bowles, C. J., and Cowgill, E. (2012). Discovering marine terraces using airborne LiDAR along the mendocino-sonoma coast, northern California. Geosphere 8, 386–402.
Bowman, D. (1971). Geomorphology of the shore terraces of the late pleistocene lisan lake (Israel). Palaeogeogr. Palaeoclimatol. Palaeoecol. 9, 183–209. doi: 10.1016/0031-0182(71)90031-9
Bowman, D. (1997). “Geomorphology of the dead sea western margin,” in The Dead Sea: The Lake and Its Setting, eds T. N. Niemi, Z. Ben-Avraham, and J. R. Gat, (Oxford: Oxford Monographs on Geology and Geo-Physics), 217–225.
Bradley, W., and Griggs, G. (1976). Form, genesis, and deformation of central California wave-cut platforms. Geol. Soc. Am. Bull. 87, 433–449.
Chen, C. Y., and Maloof, A. C. (2017). Revisiting the deformed high shoreline of lake bonneville. Quat. Sci. Rev. 159, 169–189. doi: 10.1016/j.quascirev.2016.12.019
de Gelder, G., Fernández-Blanco, D., Melnick, D., Duclaux, G., Bell, R. E., Jara-Muñoz, J., et al. (2019). Lithospheric flexure and rheology determined by climate cycle markers in the corinth rift. Sci. Rep. 9:4260. doi: 10.1038/s41598-018-36377-1
Dietz, R. S. (1963). Wave-base, marine profile of equilibrium, and wave-built terraces: a critical appraisal. Geol. Soc. Am. Bull. 74, 971–990.
Frankel, K. L., and Dolan, J. F. (2007). Characterizing arid region alluvial fan surface roughness with airborne laser swath mapping digital topographic data. J. Geophys. Res. 112, 1–14.
Garfunkel, Z. (1981). Internal structure of the dead sea leaky transform (rift) in relation to plate kinematics. Tectonophysics 80, 81–108. doi: 10.1016/0040-1951(81)90143-8
Garfunkel, Z., and Ben-Avraham, Z. (1996). The structure of the dead sea basin. Tectonophysics 266, 155–176. doi: 10.1016/s0040-1951(96)00188-6
Ghazleh, S. A., and Kempe, S. (2009). Geomorphology of lake lisan terraces along the eastern coast of the dead sea, Jordan. Geomorphology 108, 246–263. doi: 10.1016/j.geomorph.2009.02.015
Hallermeier, R. J. (1978). “Uses for a calculated limit depth to beach erosion,” in Proceedings of the 16th International Conference on Coastal Engineering, (New York, NY: American Society of Civil Engineers).
Hampel, A. (2002). The migration history of the nazca ridge along the peruvian active margin: a re-evaluation. Earth Planet. Sci Lett. 203, 665–679. doi: 10.1016/s0012-821x(02)00859-2
Hanks, T. C., Bucknam, R. C., Lajoie, K. R., and Wallace, R. E. (1984). Modification of wave-cut and faulting-controlled landforms. J. Geophys. Res. 89, 5771–5790. doi: 10.1029/jb089ib07p05771
Hemleben, C., Meischner, D., Zahn, R., Almogi-Labin, A., Erlenkeuser, H., and Hiller, B. J. P. (1996). Three hundred eighty thousand year long stable isotope and faunal records from the red sea: influence of global sea level change on hydrography. Paleoceanography 11, 147–156. doi: 10.1029/95pa03838
Hsu, J. (1988). Emerged Quaternary Marine Terraces in Southern Peru: Sea Level Changes And Continental Margin Tectonics Over the Subducting Nazca Ridge. Ithaca, NY: Cornell University.
Hsu, J. T. (1992). Quaternary uplift of the peruvian coast related to the subduction of the Nazca Ridge: 13.5 to 15.6 degrees south latitude. Quat. Int. 15-16, 87–97. doi: 10.1016/1040-6182(92)90038-4
Husson, L., Pastier, A. M., Pedoja, K., Elliot, M., Paillard, D., Authemayou, C., et al. (2018). Reef carbonate productivity during quaternary sea level oscillations. Geochem. Geophys. Geosyst. 19, 1148–1164. doi: 10.1002/2017gc007335
Imbrie, J., Hays, J. D., Martinson, D. G., McIntyre, A., Mix, A. C., Morley, J. J., et al. (1984). The Orbital Theory of Pleistocene Climate: Support From A Revised Chronology of the Marine D18o Record. Dordrecht: Reidel Publishing Company.
James, N. P., Mountjoy, E. W., and Omura, A. (1971). An early wisconsin reef terrace at barbados, west indies, and its climatic implications. J. Geol. Soc. Am. Bull. 82, 2011–2018.
Jara-Muñoz, J., Agnon, A., Melnick, D., Garcin, Y., Darvasi, Y., and Strecker, M. R. (2019). Linking Surface Deformation and Lake Level Changes in the Dead Sea. Vienna: EGU General Assembly.
Jara-Muñoz, J., and Melnick, D. (2015). Unraveling sea-level variations and tectonic uplift in wave-built marine terraces, Santa María Island, Chile. Quat. Res. 83, 216–228. doi: 10.1016/j.yqres.2014.10.002
Jara-Muñoz, J., Melnick, D., and Strecker, M. R. (2016). TerraceM: a MATLAB(R) tool to analyze marine and lacustrine terraces using high-resolution topography. Geosphere 12, 176–195. doi: 10.1130/ges01208.1
Jara-Muñoz, J., Melnick, D., Zambrano, P., Rietbrock, A., González, J., Argandoña, B., et al. (2017). Quantifying offshore fore−arc deformation and splay−fault slip using drowned pleistocene shorelines, Arauco Bay, Chile. J. Geophys. Res. 122, 4529–4558. doi: 10.1002/2016jb013339
Kline, S. W., Adams, P. N., and Limber, P. W. (2014). The unsteady nature of sea cliff retreat due to mechanical abrasion, failure and comminution feedbacks. Geomorphology 219, 53–67. doi: 10.1016/j.geomorph.2014.03.037
Lajoie, K. R. (1986). “Coastal tectonics,” in Active Tectonics, ed. R. Wallace, (Washington, D.C: National Academy Press), 95–124.
Lambeck, K., Esat, T. M., and Potter, E.-K. (2002). Links between climate and sea levels for the past three million years. Nature 419, 199–206. doi: 10.1038/nature01089
Lea, D. W., Martin, P. A., Pak, D. K., and Spero, H. J. (2002). Reconstructing a 350 ky history of sea level using planktonic Mg/Ca and oxygen isotope records from a cocos ridge core. Quat. Sci. Rev. 21, 283–293. doi: 10.1016/s0277-3791(01)00081-6
Limber, P. W., and Barnard, P. L. (2018). Coastal knickpoints and the competition between fluvial and wave-driven erosion on rocky coastlines. Geomorphology 306, 1–12. doi: 10.1016/j.geomorph.2017.12.035
Lisowski, M., Prescott, W., Savage, J., and Johnston, M. (1990). Geodetic estimate of coseismic slip during the 1989 Loma Prieta, California, earthquake. Geophys. Res. Lett. 17, 1437–1440. doi: 10.1029/gl017i009p01437
Melnick, D. (2016). Rise of the central andean coast by earthquakes straddling the Moho. Nat. Geosci. 9, 401–407. doi: 10.1038/ngeo2683
Melnick, D., Hillemann, C., Jara-Muñoz, J., Garrett, E., Cortés-Aranda, J., Molina, D., et al. (2019). Hidden holocene slip along the coastal El Yolki fault in central chile and its possible link with megathrust earthquakes. J. Geophys. Res. 124, 7280–7302. doi: 10.1029/2018jb017188
Melnick, D., Moreno, M., Motagh, M., Cisternas, M., and Wesson, R. L. (2012). Splay fault slip during the Mw 8.8 2010 Maule Chile earthquake. Geology 40, 251–254. doi: 10.1130/g32712.1
Melnick, D., Yıldırım, C., Hillemann, C., Garcin, Y., Çiner, A., Pérez-Gussinyé, M., et al. (2017). Slip along the sultanhani fault in central anatolia from deformed pleistocene shorelines of palaeo-lake konya and implications for seismic hazards in low-strain regions. Geophys. J. Int. 209, 1431–1454. doi: 10.1093/gji/ggx074
Nakamura, T., and Nakamori, T. (2007). A geochemical model for coral reef formation. Coral Reefs 26, 741–755. doi: 10.1371/journal.pone.0165825
Okada, Y. (1985). Surface deformation due to shear and tensile faults in a half-space. Bull. Seismol. Soc. Am. 75, 1135–1154.
Ortlieb, L., and Macharé, J. (1990). Geocronologia y morfoestratigrafia de terrazas marinas del Pleistoceno superior: el caso de San Juan-Marcona. Peru. Boletin de la Sociedad Geologica del Peru 81, 87–106.
Padgett, J. S., Kelsey, H. M., and Lamphear, D. (2019). Upper-plate deformation of late pleistocene marine terraces in the Trinidad, California, coastal area, southern cascadia subduction zone. Geosphere 15, 1323–1341. doi: 10.1130/ges02032.1
Palamara, D. R., Dickson, M. E., and Kennedy, D. M. (2007). Defining shore platform boundaries using airborne laser scan data: a preliminary investigation. Earth Surf. Process. Landf. 32, 945–953. doi: 10.1002/esp.1485
Pedoja, K., Husson, L., Johnson, M. E., Melnick, D., Witt, C., Pochat, S., et al. (2014). Coastal staircase sequences reflecting sea-level oscillations and tectonic uplift during the quaternary and neogene. Earth Sci. Rev. 132, 13–38. doi: 10.1016/j.earscirev.2014.01.007
Pedoja, K., Husson, L., Regard, V., Cobbold, P. R., Ostanciaux, E., Johnson, M. E., et al. (2011). Relative sea-level fall since the last interglacial stage: are coasts uplifting worldwide? Earth Sci. Rev. 108, 1–15. doi: 10.1016/j.earscirev.2011.05.002
Pedoja, K., Jara-Muñoz, J., De Gelder, G., Robertson, J., Meschis, M., Fernandez-Blanco, D., et al. (2018). Neogene-quaternary slow coastal uplift of Western Europe through the perspective of sequences of strandlines from the Cotentin Peninsula (Normandy. France). Geomorphology 303, 338–356. doi: 10.1016/j.geomorph.2017.11.021
Racano, S., Jara-Muñoz, J., and Cosentino, D. (2019). Defining the Quaternary Uplift Trend at the Southern Margin of the Central Anatolian Plateau by Marine Terraces Evolution Modelling. Vienna: EGU General Assembly.
Refice, A., Giachetta, E., and Capolongo, D. (2012). SIGNUM: a MATLAB, TIN-based landscape evolution model. Comput. Geosci. 45, 293–303. doi: 10.3109/03091902.2014.973615
Regard, V., Saillard, M., Martinod, J., Audin, L., Carretier, S., Pedoja, K., et al. (2010). Renewed uplift of the central andes forearc revealed by coastal evolution during the quaternary. Earth Planet. Sci. Lett. 297, 199–210. doi: 10.1016/j.epsl.2010.06.020
Roberts, G. P., Meschis, M., Houghton, S., Underwood, C., and Briant, R. M. (2013). The implications of revised quaternary palaeoshoreline chronologies for the rates of active extension and uplift in the upper plate of subduction zones. Quat. Sci. Rev. 78, 169–187. doi: 10.1016/j.quascirev.2013.08.006
Rohling, E., Fenton, M., Jorissen, F., Bertrand, P., Ganssen, G., and Caulet, J. (1998). Magnitudes of sea-level lowstands of the past 500,000 years. Nature 394, 162–165. doi: 10.1038/28134
Rohling, E. J., Grant, K., Bolshaw, M., Roberts, A., Siddall, M., Hemleben, C., et al. (2009). Antarctic temperature and global sea level closely coupled over the past five glacial cycles. Nat. Geosci. 2, 500–504. doi: 10.1038/ngeo557
Saillard, M., Hall, S., Audin, L., Farber, D., Hérail, G., Martinod, J., et al. (2009). Non-steady long-term uplift rates and pleistocene marine terrace development along the andean margin of Chile (31 S) inferred from 10 Be dating. Earth Planet. Sci. Let. 277, 50–63. doi: 10.1016/j.epsl.2008.09.039
Saillard, M., Hall, S., Audin, L., Farber, D., Regard, V., and Hérail, G. (2011). Andean coastal uplift and active tectonics in southern Peru: 10Be surface exposure dating of differentially uplifted marine terrace sequences (San Juan de Marcona, 15.4 S). Geomorphology 128, 178–190. doi: 10.1016/j.geomorph.2011.01.004
Schwanghart, W., and Scherler, D. (2014). Topotoolbox 2–MATLAB-based software for topographic analysis and modeling in earth surface sciences. Earth Surf. Dyn. 2, 1–7. doi: 10.5194/esurf-2-1-2014
Shikakura, Y. (2014). Marine terraces caused by fast steady uplift and small coseismic uplift and the time-predictable model: case of kikai Island, Ryukyu Islands, Japan. Earth Planet. Sci. Lett. 404, 232–237. doi: 10.1016/j.epsl.2014.08.003
Siddall, M., Chappell, J., and Potter, E.-K. (2007). “7. Eustatic sea level during past interglacials,” in Developments in Quaternary Sciences, eds J. S. Aber, and A. Ber, (Amsterdam: Elsevier), 75–92. doi: 10.1016/s1571-0866(07)80032-7
Siddall, M., Rohling, E. J., Almogi-Labin, A., Hemleben, C., Meischner, D., Schmelzer, I., et al. (2003). Sea-level fluctuations during the last glacial cycle. Nature 423, 853–858. doi: 10.1038/nature01690
Smith, B. R., and Sandwell, D. T. (2006). A model of the earthquake cycle along the san andreas fault system for the past 1000 years. J. Geophys. Res. 111:B01405.
Spratt, R. M., and Lisiecki, L. E. (2016). A late pleistocene sea level stack. Clim. Past 12, 1079–1092. doi: 10.5194/cp-12-1079-2016
Storms, J. E., and Swift, D. J. P. (2003). Shallow-marine sequences as the building blocks of stratigraphy: insights from numerical modelling. Basin Res. 15, 287–303. doi: 10.1046/j.1365-2117.2003.00207.x
Strecker, M., Bloom, A., Gilpin, L., and Taylor, F. (1986). Karst morphology of uplifted Quaternary coral limestone terraces: santo Island, Vanuatu. Zeitschrift fur Geomorphologie 30, 387–405.
Thébaudeau, B., Trenhaile, A. S., and Edwards, R. J. (2013). Modelling the development of rocky shoreline profiles along the northern coast of Ireland. Geomorphology 203, 66–78. doi: 10.1016/j.geomorph.2013.03.027
Thornton, E. B., and Guza, R. (1983). Transformation of wave height distribution. J. Geophys. Res: Oceans 88, 5925–5938. doi: 10.1161/CIRCIMAGING.114.002167
Torfstein, A., Goldstein, S. L., Stein, M., and Enzel, Y. (2013). Impacts of abrupt climate changes in the levant from last glacial dead sea levels. Quat. Sci. Rev. 69, 1–7. doi: 10.1016/j.quascirev.2013.02.015
Waelbroeck, C., Labeyrie, L., Michel, E., Duplessy, J. C., McManus, J., Lambeck, K., et al. (2002). Sea-level and deep water temperature changes derived from benthic foraminifera isotopic records. Quat. Sci. Rev. 21, 295–305. doi: 10.1016/s0277-3791(01)00101-9
Wald, D. J., Helmberger, D. V., and Heaton, T. H. (1991). Rupture model of the 1989 Loma Prieta earthquake from the inversion of strong-motion and broadband teleseismic data. Bul. Seismol. Soc. Am. 81, 1540–1572.
Wells, D. L., and Coppersmith, K. J. (1994). New empirical relationships among magnitude, rupture length, rupture width, rupture area, and surface displacement. Bull. Seismol. Soc. Am. 84, 974–1002.
Wendt, J., Oglesby, D. D., and Geist, E. L. (2009). Tsunamis and splay fault dynamics. Geophys. Res. Lett. 36:15303.
Zeilinger, G., Garcin, Y., and Melnick, D. (2018). Large Wavelength Deformation Across Plateaus of Subduction Systems, Case Study at Salar De Uyuni, Central Andes. Vienna: EGU General Assembly.
Keywords: TerraceM, marine terraces, tectonic geomorphology, geomorphic markers, LiDAR, coastal geomorphology, neotectonics, morphometry
Citation: Jara-Muñoz J, Melnick D, Pedoja K and Strecker MR (2019) TerraceM-2: A Matlab® Interface for Mapping and Modeling Marine and Lacustrine Terraces. Front. Earth Sci. 7:255. doi: 10.3389/feart.2019.00255
Received: 24 July 2019; Accepted: 13 September 2019;
Published: 04 October 2019.
Edited by:
Maria-Teresa Ramirez-Herrera, National Autonomous University of Mexico, MexicoReviewed by:
Li Wu, Anhui Normal University, ChinaYingkui Li, The University of Tennessee, Knoxville, United States
Krzysztof Gaidzik, The University of Silesia in Katowice, Poland
Copyright © 2019 Jara-Muñoz, Melnick, Pedoja and Strecker. This is an open-access article distributed under the terms of the Creative Commons Attribution License (CC BY). The use, distribution or reproduction in other forums is permitted, provided the original author(s) and the copyright owner(s) are credited and that the original publication in this journal is cited, in accordance with accepted academic practice. No use, distribution or reproduction is permitted which does not comply with these terms.
*Correspondence: Julius Jara-Muñoz, amFyYUBnZW8udW5pLXBvdHNkYW0uZGU=