 Federica Marone1†
 Christian M. Schlepütz1†
 Sina Marti2
 Florian Fusseis2
 Andrés Velásquez-Parra3,5
 Michele Griffa4
 Joaquín Jiménez-Martínez3,5
 Katherine J. Dobson6,7
 Marco Stampanoni1,8*
- 1Swiss Light Source, Paul Scherrer Institut, Villigen, Switzerland
- 2School of Geosciences, The University of Edinburgh, Edinburgh, United Kingdom
- 3Department of Water Resources and Drinking Water, EAWAG, Dübendorf, Switzerland
- 4Swiss Federal Laboratories for Materials Science and Technology (Empa), Dübendorf, Switzerland
- 5Department of Civil, Environmental and Geomatic Engineering, ETH Zürich, Zurich, Switzerland
- 6Department of Earth Sciences, Durham University, Durham, United Kingdom
- 7Department of Civil and Environmental Engineering, University of Strathclyde, Glasgow, United Kingdom
- 8Institute for Biomedical Engineering, ETH Zürich, Zurich, Switzerland
X-ray tomographic microscopy is a well-established analysis technique in different fields of the Earth Sciences to access volumetric information of the internal microstructure of a large variety of opaque materials with high-spatial resolution and in a non-destructive manner. Synchrotron radiation, with its coherence and high flux, is required for pushing the temporal resolution into the second and sub-second regime and beyond, and therefore moving from the investigation of static samples to the study of fast dynamic processes as they happen in 3D. Over the past few years, several hardware and software developments at the TOMCAT beamline at the Swiss Light Source contributed to establishing its highly flexible and user-friendly fast tomography endstation, making a large variety of new dynamic in situ and operando investigations possible. Here we present an overview of the different devices, including an in-house developed detector, a new highly efficient macroscope and a programmable fast rotation stage. Their tight interplay and synchronization are key for lifting experimental design compromises and follow dynamic processes with high spatial and temporal resolution unfolding over prolonged periods of time, as often required by many applications. We showcase these new capabilities for the Earth Sciences community by presenting three different geological studies, which make use of different sample environments. With a tri-axial deformation rig, chemo-mechanical-hydraulic feedbacks between gypsum dehydration and halite deformation have been studied, while the spatio-temporal evolution of a solute plume has been investigated for the first time in 3D with a flow cell. A laser-based heating system available at the beamline provides access to the high temperatures required to address bubble growth and collapse as well as bubble-bubble interaction and coalescence in volcanological material. With the integration of a rheometer, information on bubble deformation could also be gained. In the near future, upgrades of most large-scale synchrotron radiation facilities to diffraction-limited storage rings will create new opportunities, for instance through sub-second tomographic imaging capabilities at sub-micron length scales.
Introduction
X-ray tomographic microscopy (XTM) provides access to volumetric information of the internal microstructure of a large variety of opaque materials with high-spatial resolution and in a non-destructive manner. During the past decade, XTM has become a widespread analysis technique and invaluable tool in different branches of the Earth Sciences in laboratory settings with conventional sources and at synchrotron facilities (Cnudde and Boone, 2013). Typical applications cover the 3D morphological characterization of micro- and macro-fossils (Friis et al., 2015; Lindgren et al., 2018; Voeten et al., 2018) for new insights into their anatomy, development and preservation, leading to a deeper understanding of the paleobiology of extinct organisms and related evolutionary theories (Cunningham et al., 2014). Detailed microstructural and compositional analyses of extraterrestrial materials (Hanna and Ketcham, 2017) are fundamental for advancing our knowledge regarding, e.g., their formation. Direct access to complex 3D pore networks at multiple scales in different geological bodies and soils provides key structural information for numerical modeling of, for instance, fluid flow in porous media (Munawar et al., 2018). Recently, XTM has been successfully used to document metamorphic reactions (Zhu et al., 2016; Bedford et al., 2017), for digital rock (and reservoir) petrophysical property predictions and direct insight into micro-scale phenomena (Fusseis et al., 2012; Blunt et al., 2013), and in volcanology, where it has been providing insights into, for example, crystallization and degassing processes in magma evolution (Moretti et al., 2019), bubble growth in basaltic foams (Baker et al., 2012) and magma rheology (Pistone et al., 2015c).
Although XTM for static samples and post-mortem specimens is nowadays a well-established technique for geological materials, many dynamic geological processes are still not fully understood due to the lack of adequate investigation tools. Tomographic analyses require sample stability during the data acquisition process, which typically lasts several minutes to a few hours. Microstructural changes during dynamic processes are usually investigated in in situ experiments by “freezing” the ongoing process at different intermediate conditions. In this way, it was for instance possible to image metallic melt migration at high pressure and temperature conditions (Berg et al., 2018). Only recently, experiments with a higher temporal resolution have become possible, in particular at tomography beamlines of synchrotron facilities, thanks to the high brilliance and flux of their beams (Di Michiel et al., 2005). Time-resolved tomographic microscopy experiments at pore scales with a time resolution of a few tens of seconds have also been performed with conventional sources (Bultreys et al., 2016), but, for studying faster processes with dynamics in the sub-second regime and beyond, a third generation synchrotron source is a must. In addition to the higher flux, which for a specific scan time intrinsically leads to a higher quality tomographic volume, synchrotron radiation is also characterized by at least partial coherence. This feature unlocks the possibility of phase retrieval, a key tool to further enhance the image quality in particular in time-resolved applications (Mokso et al., 2013), with usually sparse noisy data.
Several hard X-ray tomographic microscopy beamlines have developed time-resolved capabilities over the past few years, and have demonstrated XTM measurements with a time resolution in the sub-second regime (e.g., ID15 at the ESRF, TOPO-TOMO at ANKA, JEEP i12 at the Diamond Light Source, TOMCAT at the Swiss Light Source, BL13W at SSRL, EDDI at BESSY II, BL28B2 at SPring-8) (Salvo et al., 2012; dos Santos Rolo et al., 2014; Dobson et al., 2016; Maire et al., 2016; Xu et al., 2016; García-Moreno et al., 2018; Yashiro et al., 2018). Despite these successful sub-second tomographic experiments, their widespread use in the imaging community and a further increase of the achievable temporal resolution has been hampered by several fundamental and technical limitations that need to be overcome in those measurements. Firstly, the available X-ray flux and optical efficiency of the image acquisition process determine the achievable imaging contrast, thus setting a lower limit on the necessary exposure time for a measurement. This is application-dependent and systems exhibiting a high inherent X-ray contrast (e.g., between hard matter and gases) generally require shorter acquisition times than those with lower contrast (e.g., between different crystalline phases). Secondly, the scanning time for a full 3D volume is also limited by how fast the sample can be rotated through 180° (assuming the parallel beam geometry available at the synchrotron). Fortunately, most modern high-precision rotation stages can reach continuous angular velocities of 600–900 rpm, corresponding to 20–30 180° rotations per second. A further bottleneck are the high-speed imaging detectors. To reach the high frame rates (1–20 kHz) needed to acquire several tomographic datasets per second, it is often necessary to reduce the read-out region of interest with respect to the full detector frame, severely compromising the available overall field-of-view (FOV) of the measurement. Additionally, commercial high-frame rate CMOS detectors are usually designed for a burst operation, utilizing fast on-board memory of at maximum a few hundreds of GBs in size. Thus, only a few seconds of the studied dynamics can be captured before the internal memory is full and the data need to be downloaded from the camera, a process taking typically several minutes during which no further acquisitions are possible. The achievable acquisition durations and intervals are therefore insufficient to investigate many dynamic phenomena, which can instead span time periods of several minutes if not hours. Another obstacle is that most dynamic measurements require complex sample environments, which may simply not be compatible with a fast or a continuous sample rotation, for example, due to external electric or fluid connections. Back-and-forth scanning avoids coiling up of connection lines, but comes at a significant cost in speed due to the additional time required to accelerate and decelerate the rotation stage for every scan, and potential sample motion associated with changes in direction. Lastly, available software tools and computing infrastructures are not always adequate to efficiently transfer, store, reconstruct, visualize and analyze the tens of TBs of data generated during extended fast time-resolved experiments.
The most intriguing dynamical phenomena tend to occur under environments far from ambient conditions, such as high temperatures, high pressures, reactive atmospheres, etc. This is particularly true for the Earth Sciences, where, for example, sub-surface conditions at elevated pressures and temperatures comprise a major part of the research activities. To gain access to these conditions, the user community has been actively developing dedicated sample environments that are compatible with the restrictions imposed by the tomographic data acquisition protocol, namely the need to rotate a sample while guaranteeing an unobstructed pathway for the X-rays to the sample region to be imaged from all viewing directions (e.g., Renard et al., 2016; Glatz et al., 2018; Voltolini et al., 2019, to mention but a few). Dedicated devices with a range of capabilities are even available from commercial companies (e.g., Deben1). To optimally exploit these developments in a very active community, the experimental stations at synchrotron beamlines need to be designed such that they provide sufficient space and load capacity to accommodate these chambers as well as the required signal processing and connectivity capabilities to synchronize the control and monitoring signals from the sample cell with the imaging data.
Recent hardware and software developments at the TOMCAT beamline at the Swiss Light Source (SLS) (Stampanoni et al., 2006) helped in consolidating its cutting-edge fast tomography endstation and dynamical tomographic microscopy program (Lovric et al., 2016). In the following, we first describe these hardware and software advancements and highlight their relevance for Earth Sciences studies (Table 1). We then present three different respective applications, making use of different sample environments. Finally, we discuss current limitations and future plans also related to the scheduled SLS machine upgrade (Streun et al., 2018).
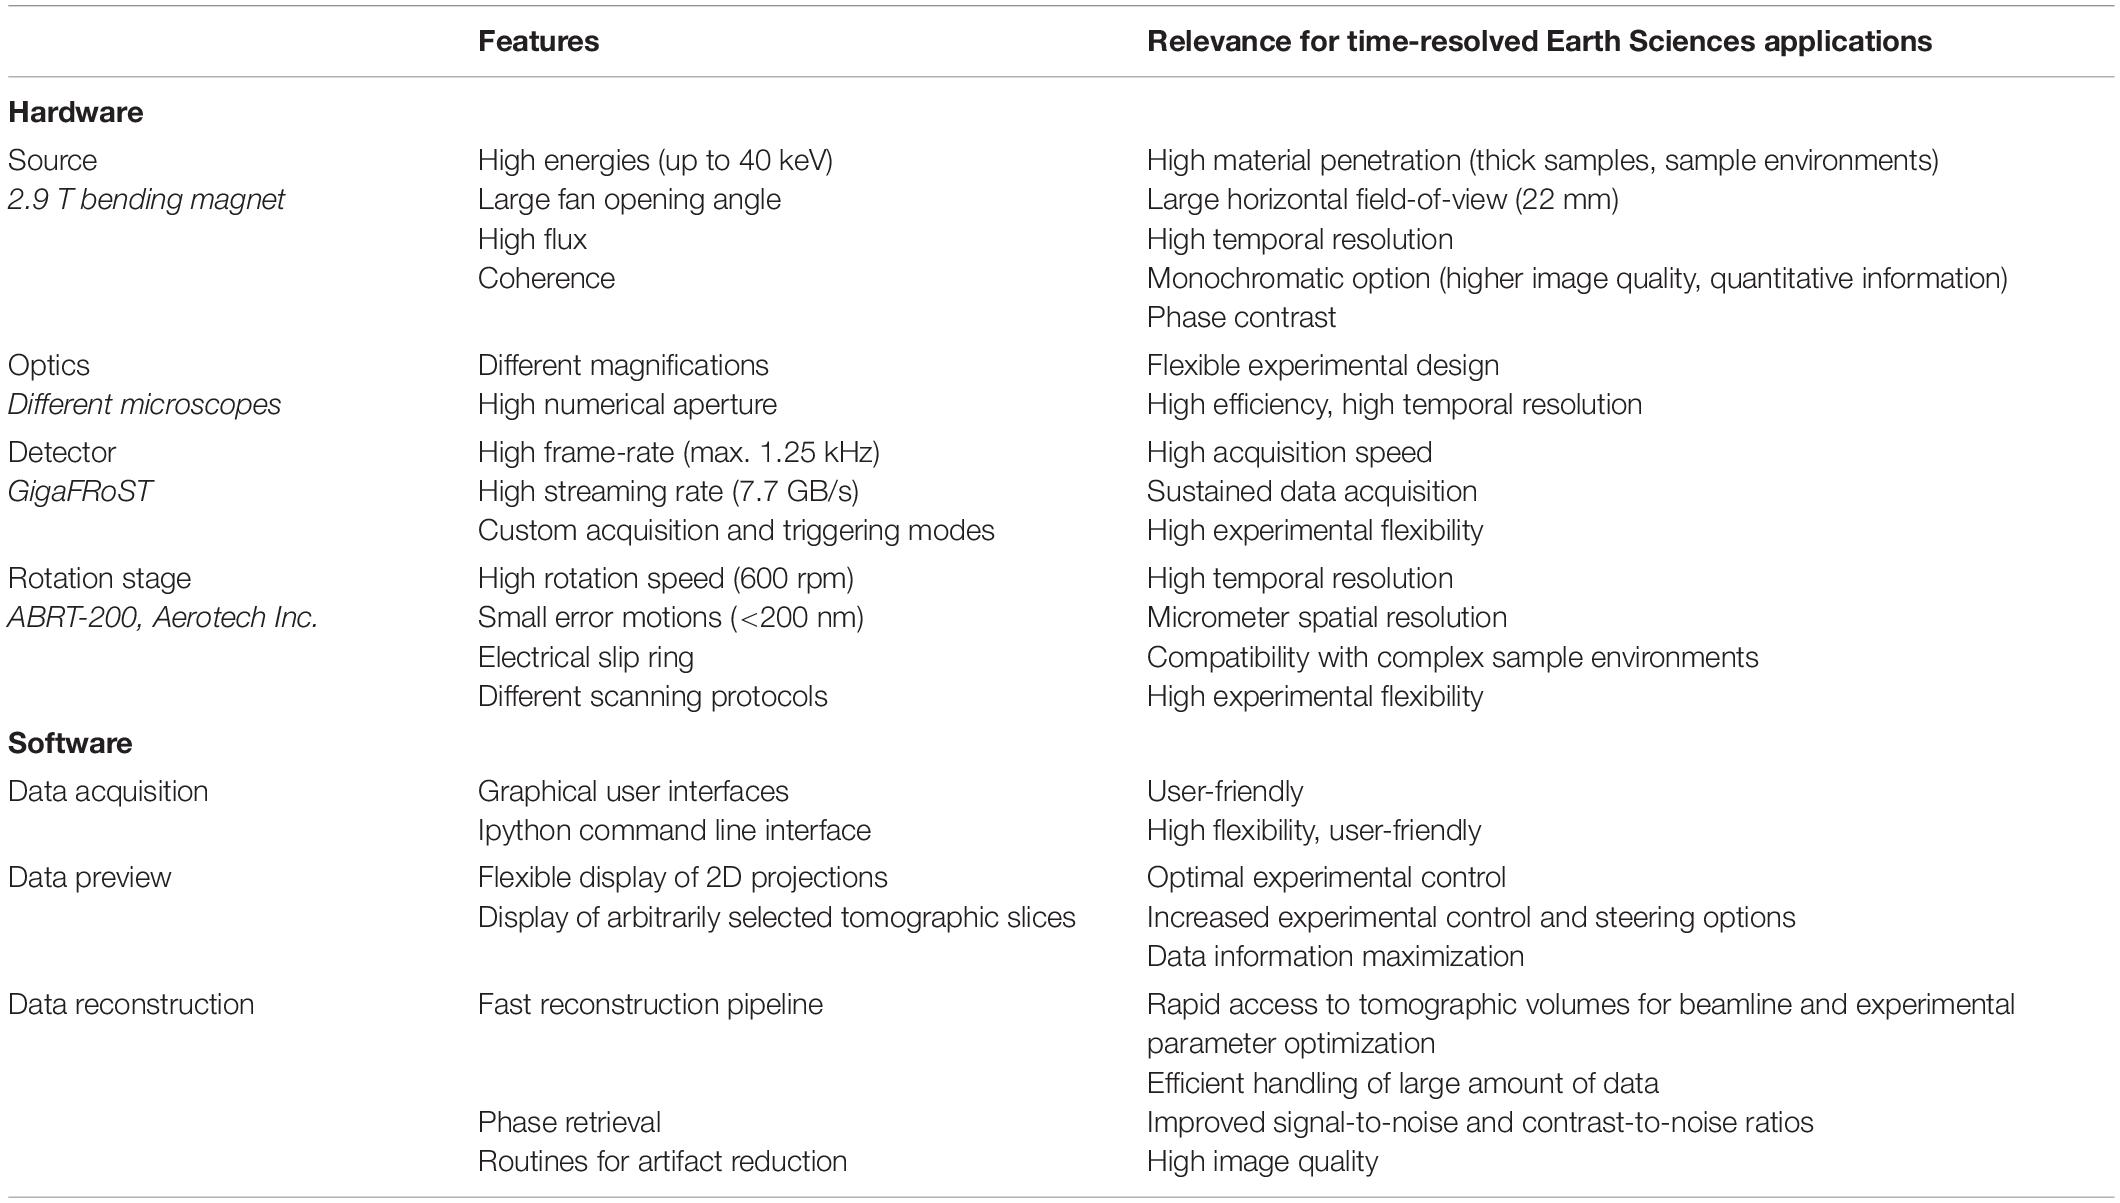
Table 1. Summary of the features of recent hardware and software developments at the TOMCAT beamline and their relevance for time-resolved Earth Sciences applications.
Time-Resolved X-ray Tomographic Microscopy Endstation
Hardware
Source
X-ray radiation to the TOMCAT fast tomography endstation is delivered by a 2.9 T bending magnet with a critical energy of 11.1 keV (Stampanoni et al., 2006). The higher magnetic field of the TOMCAT source compared to the normal SLS bending magnets (1.8 T) enhances the flux at energies higher than 20 keV by more than an order of magnitude. This aspect is highly relevant for most in situ experiments, for which the sample diameter is often 5 mm or more (also to avoid excessive boundary effects) and the beam might have to penetrate a sample environment, sometimes consisting of X-ray absorbing materials, in addition to the sample itself.
XTM measurements using monochromatic radiation provide superior image quality compared to those using a polychromatic spectrum, in particular for strongly absorbing samples, since beam-hardening artifacts can be avoided. However, the final image quality is also strongly coupled to the number of photons available for imaging. For time-resolved experiments in the sub-second regime, the monochromatic flux at energies higher than 20 keV, as mostly required in Earth Sciences applications, is usually insufficient to achieve the necessary image quality required to perform accurate data quantification. Therefore, despite possible minor beam-hardening artifacts, fast imaging at TOMCAT is almost exclusively performed with polychromatic radiation.
The integrated flux over 2.75 × 2.75 μm2 (typical pixel area for dynamic experiments) on axis at 25 m from the source delivered by the TOMCAT superbend is shown in Figure 1A (blue curve). A large portion of this flux consists of low energy photons (<10 keV), which would not contribute to the image formation since they would be completely absorbed by the sample (and possibly contribute to radiation damage) but lead to enhanced beam hardening. For this reason, the full beam as delivered by the source (blue curve in Figure 1A) is never used for the experiments, but it is always filtered at least to some degree. At TOMCAT, we have different options to modify the beam spectrum. In Figure 1A, the flux is presented as a function of energy, after different routinely used filters. Usually, an attenuator (5 mm Sigradur), cutting at least 50% of the beam power, is inserted into the beam, also to prevent sample and optics damage. Additional filters are used to further condition the beam and in particular to achieve a narrower bandwidth, so to further reduce (beam hardening) artifacts, when required.
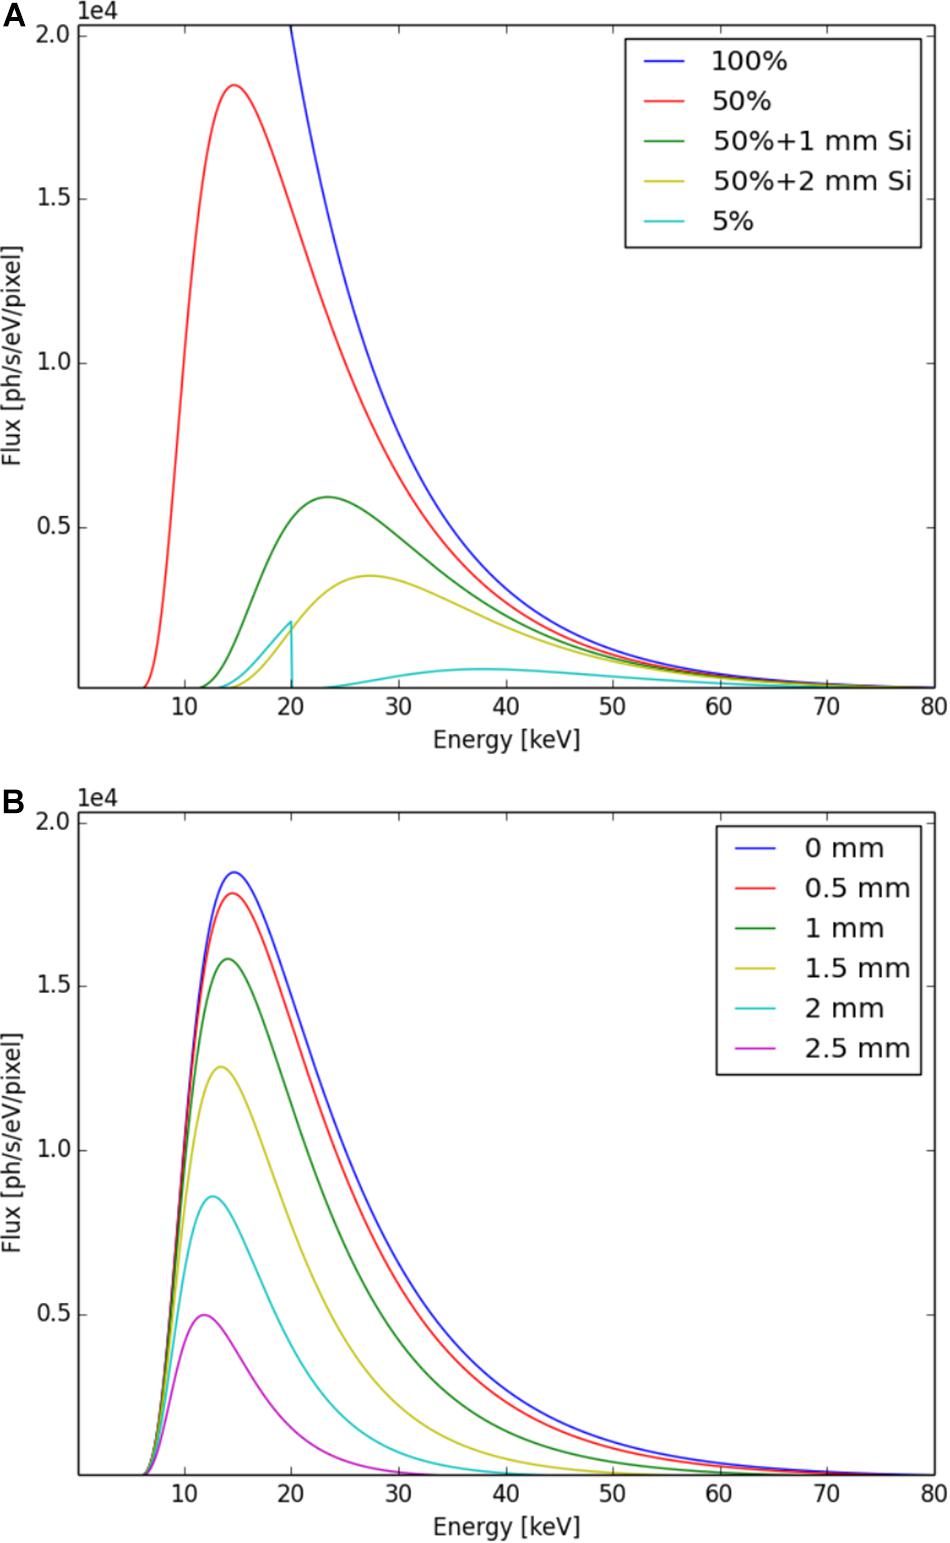
Figure 1. Integrated flux over 2.75 × 2.75 μm2 (typical pixel area for dynamic experiments) at 25 m from the source delivered by the TOMCAT superbend (A) on-axis and filtered by different attenuators (50%: 5 mm Sigradur, 5%: 20 mm Sigradur and 75 μm Mo), (B) off-axis at different vertical positions attenuated by the 50% filter. The flux is expressed per eV (instead of per 0.1% bandwidth) so that the absolute number of photons at a specific energy can be directly read from the plot.
It should also be noted that the beam spectrum (and therefore also the flux) is not constant over the entire FOV, but it varies off-axis along the vertical direction, since the vertical photon source divergence is energy dependent (Figure 1B). To mitigate this dependence and the resulting artifacts, a vertical FOV larger than 5 mm is usually avoided. Horizontally, the maximum fan opening angle is instead as large as 2 mrad (50 mm at sample position 25 m downstream from the source). Contingent to the available optics and detectors, however, a horizontal FOV larger than 22 mm is never used.
Optics
At TOMCAT, different microscopes compatible with polychromatic beam applications are available. For high spatial resolution experiments requiring a pixel size of 1 μm or less, a microscope (Optique Peter, Lentilly, France) equipped with interchangeable long-working distance Mitutoyo objective lenses is used and features a discrete set of magnification values ranging from 5× up to 26×. For very low-resolution experiments, a system with a high numerical aperture tandem 1:1 configuration (Optique Peter, Lentilly, France) is available [pixel size of 11 μm if coupled to the GigaFRoST detector (see Section Detector)].
The workhorse for many dynamic experiments, in particular when a high time resolution is required, is, however, a recently procured high efficiency custom-made macroscope (Optique Peter, Lentilly, France) (Bührer et al., 2019). This system has a fixed 4× intermediate magnification, which is suitable for the investigation of many systems at a relatively high spatial resolution of a few μm while at the same time capturing a representative volume of interests of several mm. The key aspect of this new optical component is its high numerical aperture of 0.35, which boosted the efficiency compared to a previously used system by nearly a factor of 5, while at the same time providing a far superior image quality (the effective spatial resolution, defined as the 10% modulation transfer function bandwidth values for the high temporal resolution setup is 2.5 pixels). The design of the macroscope is modular, with independent camera and front modules which can be rotated into different positions. The system can also be mounted with its principal optical axis oriented both horizontally and vertically. This flexibility is important for optimally accommodating complex sample environments, as it is often the case for Earth Sciences applications.
Detector
Commercially available detectors capable of reaching kHz frame-rates are normally designed for burst operation and are therefore equipped with an internal memory of typically at maximum a few hundreds of GBs, while the data download to storage happens a posteriori via a communication protocol standard. This architecture severely limits the optimal design of time resolved experiments in several ways. The recorded FOV and number of projections per scan often need to be compromised in favor of increasing the total number of frames (hence of scans) that can be stored in memory in order to gain a sufficient time duration of the recording. Even then, an accurate synchronization of the few second-long possible acquisition period to match an unpredictable and sometimes still unexplored dynamical process is often difficult to achieve, bearing the risk of missing the time point of interest. Furthermore, inspections of the acquired data to validate beamline and experimental settings are delayed by the relatively long download times, leading to unwanted unutilized beamtime.
Efficient and reliable investigations of dynamic processes, instead, require a sustained data acquisition capability over extended periods of time, coupled with real-time availability of the current image frame. The GigaFRoST (Mokso et al., 2017) detection and read-out system, developed in-house and based on a commercial CMOS imaging sensor, can acquire and stream data with a rate as high a 7.7 GB/s directly to a backend system in a sustained manner, eliminating any experimental design compromise necessary with commercial systems. Further advantages of the GigaFRoST include its customized acquisition and triggering modes, which provide a high flexibility in the experimental execution. A highly useful feature for most high-speed experiments, which is provided by the GigaFRoST, is the possibility of monitoring the ongoing process by previewing the acquired projections while simultaneously storing the relevant data to disk. This option enables a direct insight into the investigated phenomena and the means to adjust the acquisition protocol to the actual dynamics in real-time. Additional details relevant to the specific applications are discussed in Section “Applications” and summarized in Table 2.
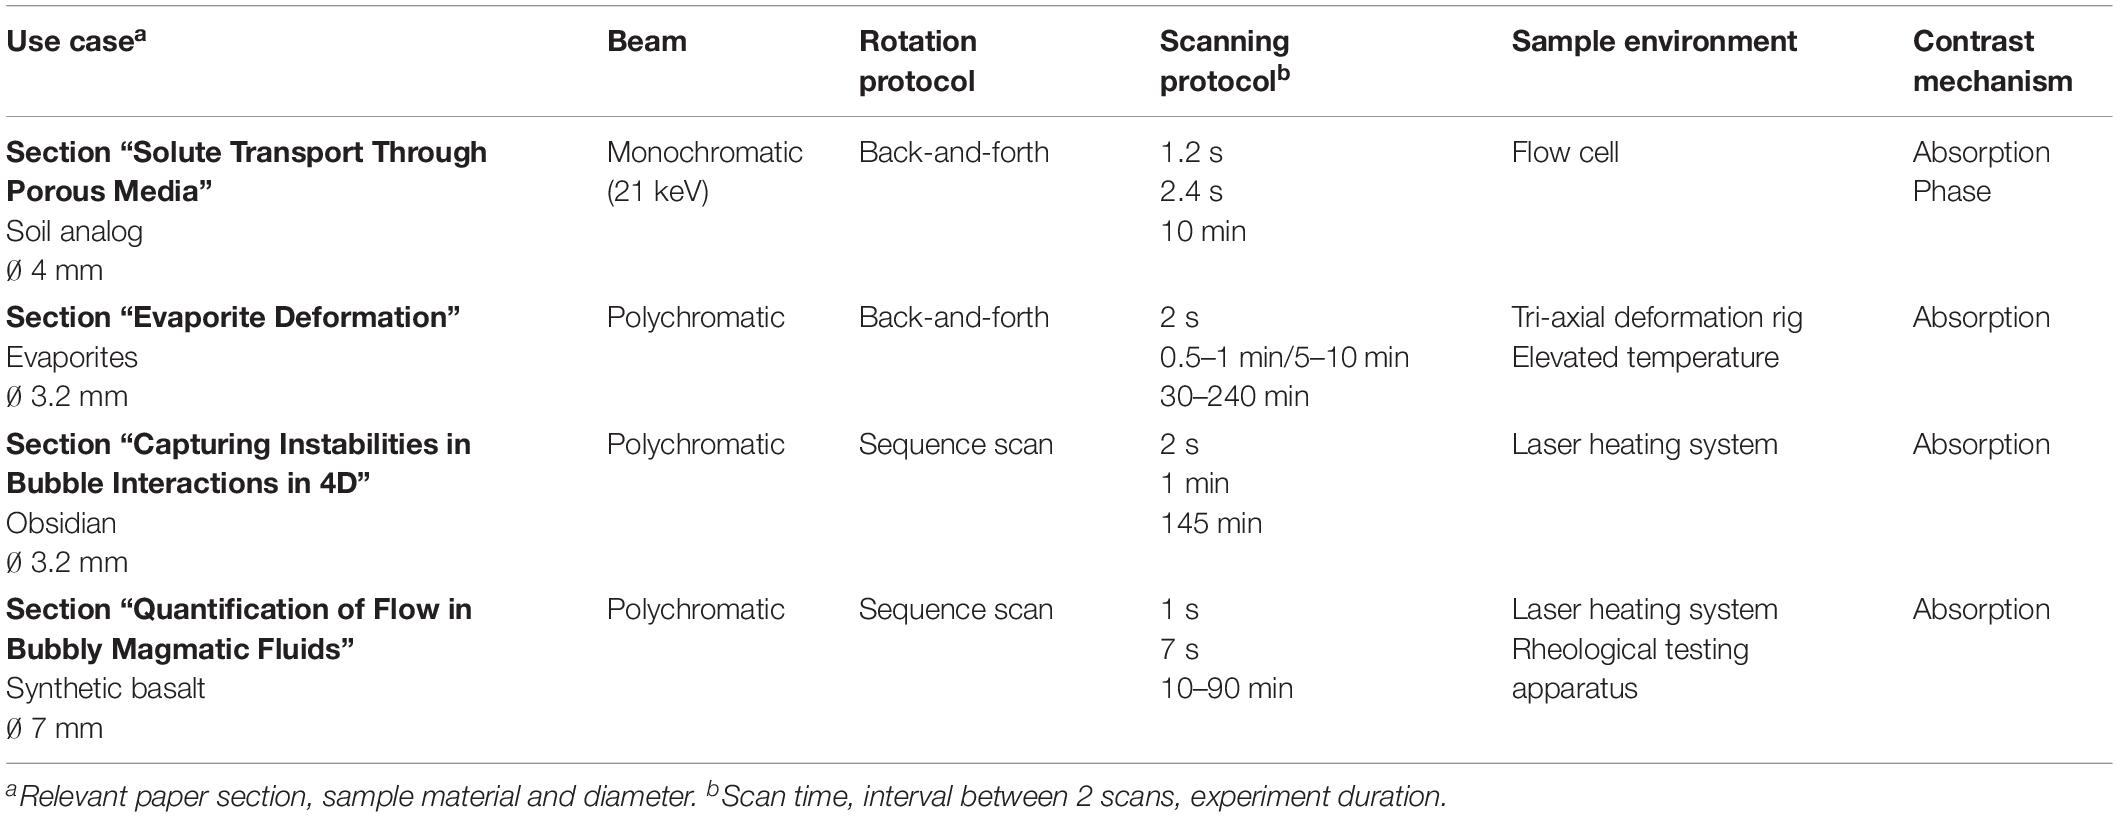
Table 2. Summary of the technical details key to each presented Earth Sciences application.
Rotation Stage
The TOMCAT sample manipulator (Lovric et al., 2016) has been custom designed to satisfy the stringent requirements of time-resolved high-resolution tomographic microscopy in terms of sample translational and rotational precision over a broad range of rotation velocities. At the same time, sufficient degrees of freedom are required to accurately align the rotation axis with respect to the beam and detector as well as to choose the desired volume of interest in the investigated sample.
A key component for reaching a temporal resolution in the sub-second regime is the high-precision air-bearing rotation stage (ABRT-200, Aerotech Inc.). It couples a maximum continuous rotational speed as high as 800 rpm (finally limited to 600 rpm by other mechanical components) with axial and radial error motions below 200 nm, totally acceptable for experiments with pixel sizes of 2–3 μm. In parallel beam geometry, as it is the case at the TOMCAT beamline, a maximum rotational speed of 10 full turns per second (600 rpm) corresponds to a maximum time resolution of 20 tomograms per second (tps). If a higher time resolution is required, a faster rotation unit provided by the user group can easily be integrated in the beamline infrastructure. In this way, an experiment requiring the acquisition of more than 200 tomograms per seconds has recently been carried out at TOMCAT (García-Moreno et al., 2019).
The air-bearing rotation stage is synchronized with a mechanical rotation stage (ADRS-150, Aerotech Inc.) which drives an electrical slip-ring with 60 lead-throughs. This slip-ring decouples the spinning top part of the stage from the static portion below. This is essential for achieving a high temporal resolution with sample environments which require analog or digital signals, since fast continuous rotation with dragged cables is not feasible. In addition to providing the connectivity for two linear translation stages mounted on top of the rotation axis used for region-of-interest alignment, the slip-ring also serves 2 D-sub/DB-9 connectors available for easily interfacing user-specific sample cells in the beamline environment. A slip-ring for gases or fluids as well as a slip-ring positioned above the rotating sample is not yet part of the beamline equipment, but can be integrated in collaboration with user groups on demand.
The rotation stage is integrated in the EPICS beamline control system and can be operated in different modes, providing and/or accepting multiple TTL triggering signals to and from detectors and other external devices (Lovric et al., 2016). The highest possible temporal resolution in tomography is achieved by a continuous data acquisition over many rotation cycles during a high-speed steady sample rotation. The tomographic reconstruction of each time point requires image data covering an angular range of 180°. The full dataset can thus be subdivided into consecutive ranges of 180°, each one representing one discrete time step, as shown in Figure 2A. However, while a short scan time for each individual volume is crucial to avoid any motion artifacts caused by the evolving system, the relevant structural changes can often still be clearly resolved with a scanning interval for consecutive time points a few times longer than the individual scan time. To this end, one of the most used triggering modes is the so-called “sequence mode,” lending a great amount of flexibility for defining customized time-structures for a series of (non-continuous) scans. In this mode, multiple triggering sequences, typically to be used as a gating signal for the detector, can be defined, so that tomographic scans can be easily acquired at different time intervals to best match the investigated dynamics. This mode is shown schematically in Figure 2B.
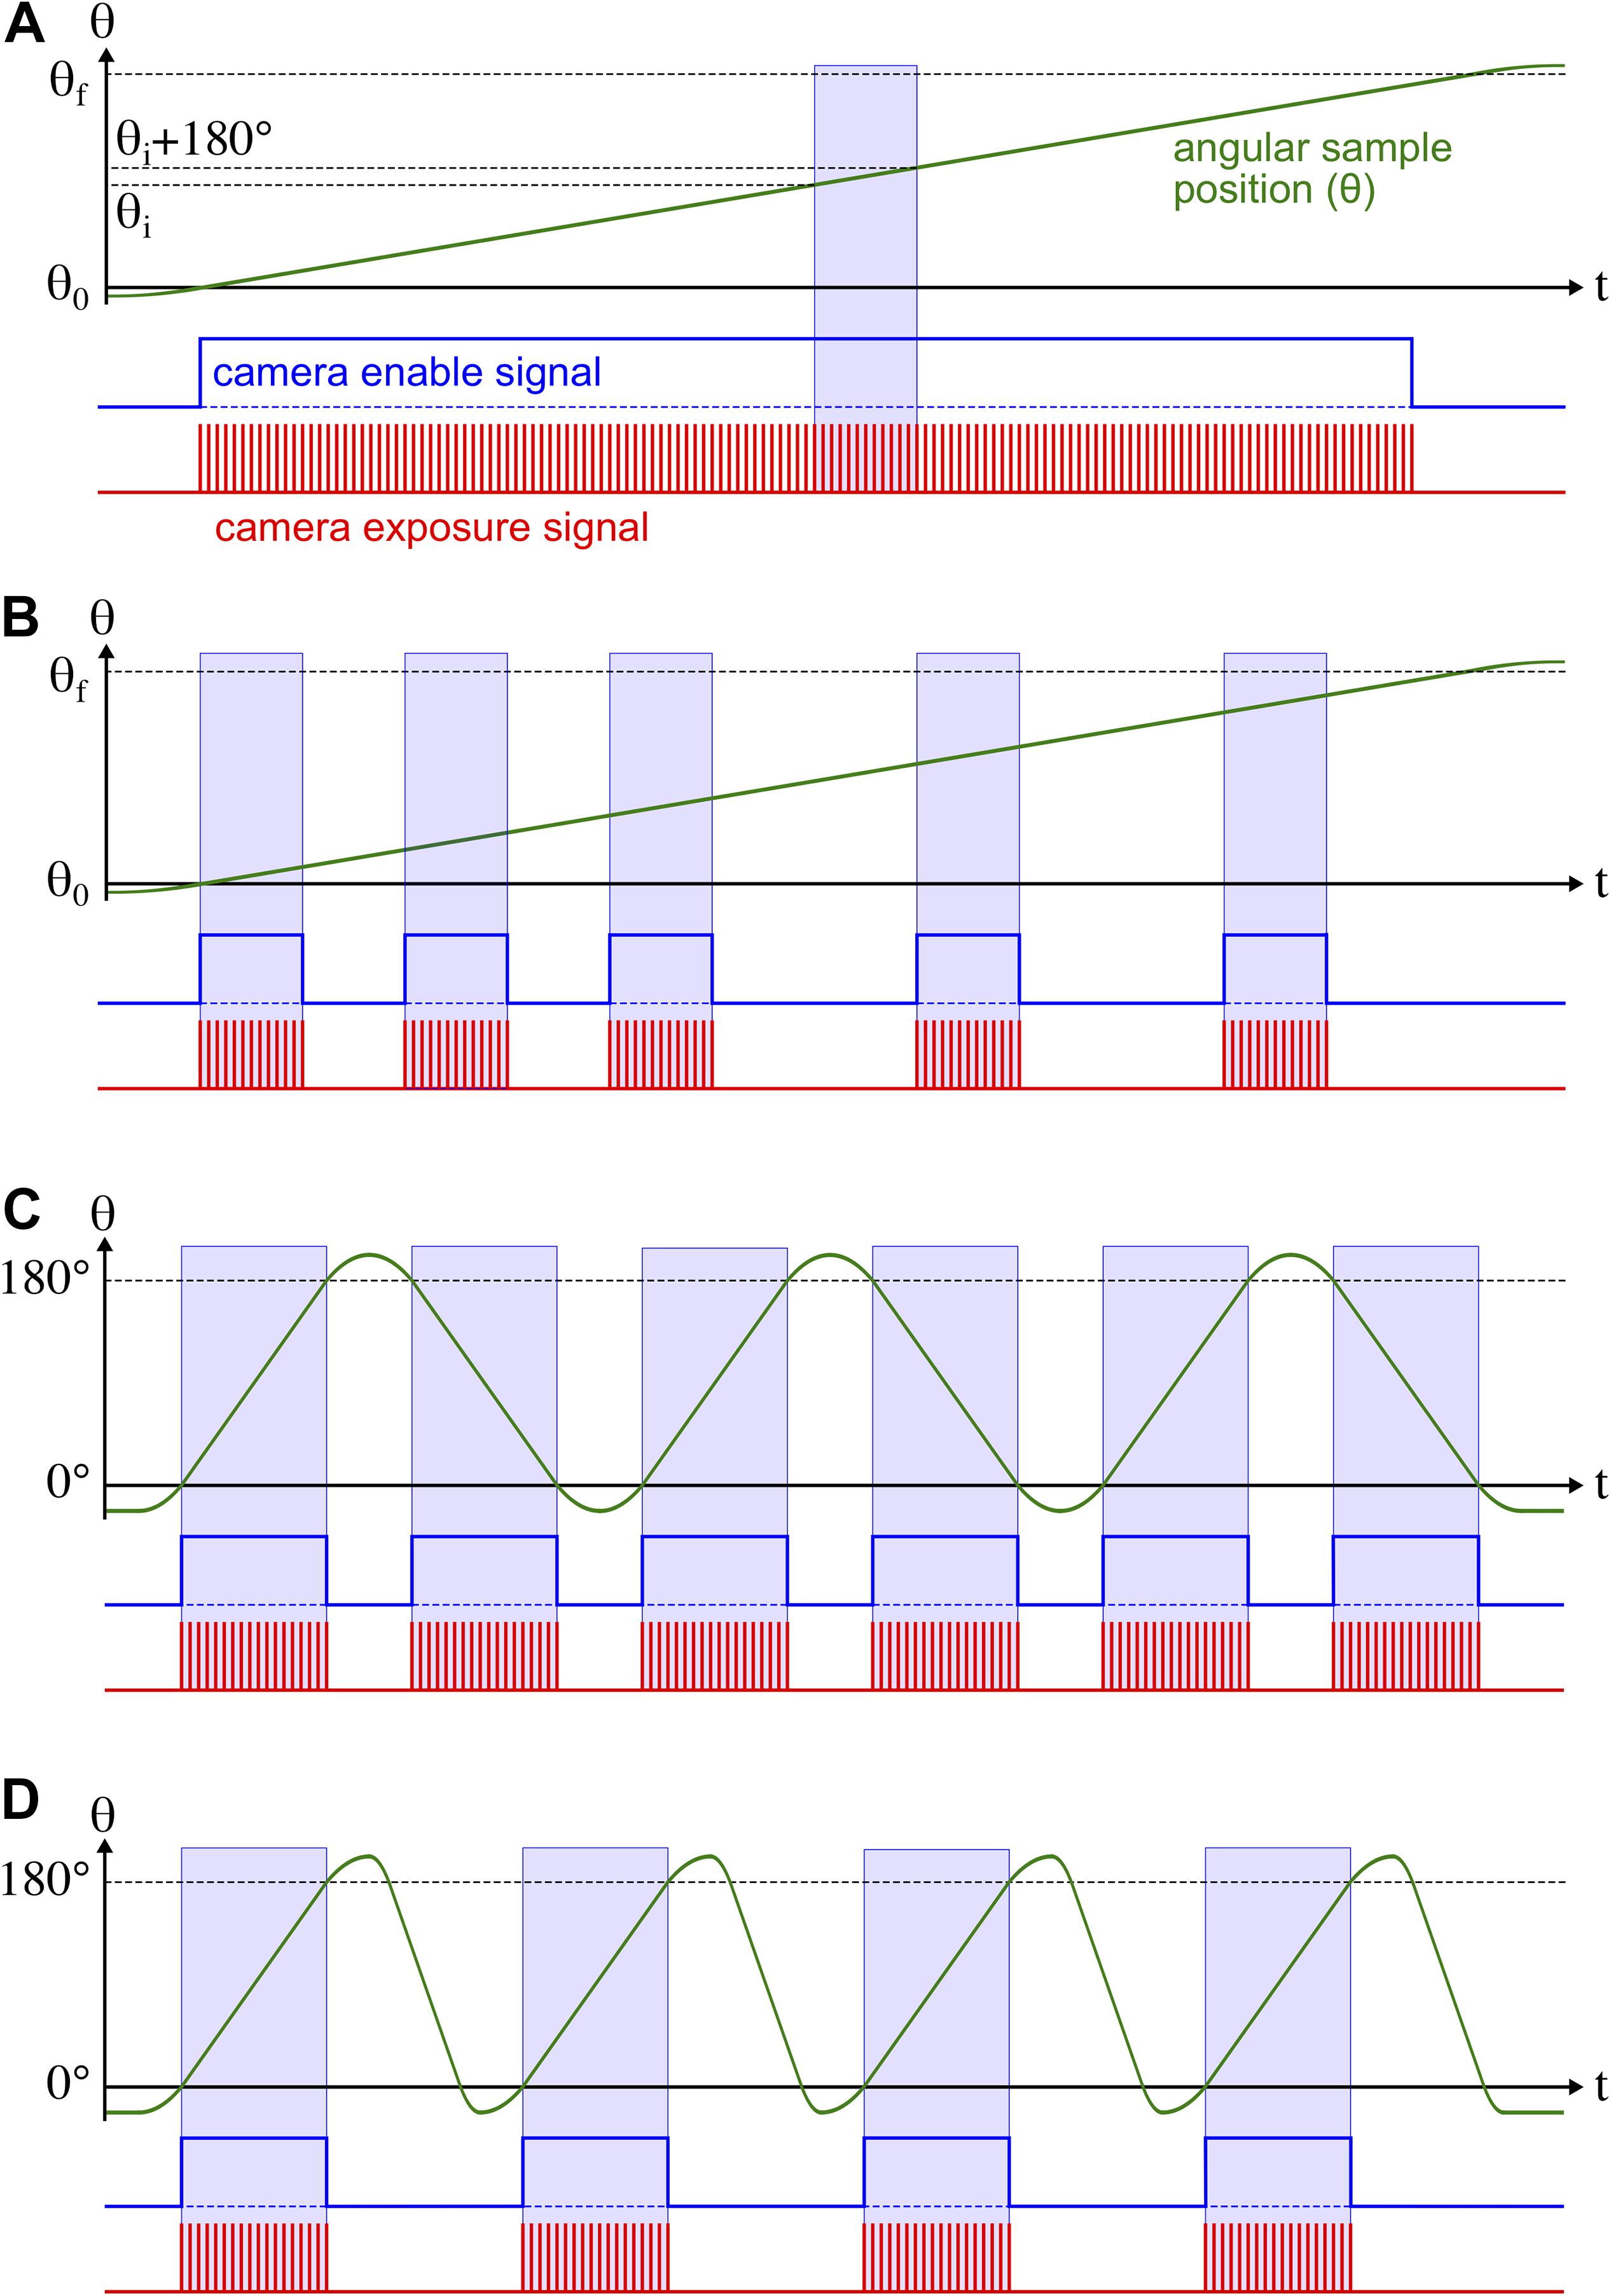
Figure 2. Illustration of different data acquisition modes for fast tomographic measurements. The angular position of the sample is displayed by the green line as a function of time in the θ(t) coordinate system. Below this plot, typical TTL control signal sequences are represented by the blue line for the camera enable signal and the red line for individual camera frame exposure signals. The translucent blue rectangles mark the boundaries for individual tomographic scans. Four different acquisition modes are shown: (A) continuous acquisition during a continuous rotation of the sample. The total rotation angle covers many times the 180° range required to reconstruct a single volume. (B) The so-called “sequence scan,” where acquisition windows can be programed to occur at configurable positions of the continuous rotation, allowing for a tighter control of the time series properties and scanning intervals. (C,D) Where a continuous rotation of the sample is not possible, scans can be acquired in a back-and-forth motion of the sample, either in both movement directions (C) or only along one direction with a rewinding operation in between (D).
As mentioned earlier, many in situ sample environments are unfortunately not compatible with a continuous sample rotation due to external fluid or electrical connections. In such cases, assuming that the external connections safely allow for rotations of somewhat more than 180°, one can fall back on back-and-forth scanning modes. Data can either be acquired both during the forward and backward rotation (Figure 2C), or always in the same rotation direction by rewinding the sample orientation in between (Figure 2D). However, these modes are decreasing the achievable temporal resolution considerably to scan intervals upwards of about 1 s. For faster scan times, the acceleration and deceleration times and distances for the back-and-forth motion are becoming prohibitive, both taking increasingly more time than the scan itself and requiring acceleration distances of several multiples of 180° for realistic acceleration rates available in high-precision rotation stages.
The flexibility in choosing the most adequate scanning protocol for each specific application is crucial to accommodate a wide variety of use cases. In Section “Applications” and Table 2, additional details specific for each of the showcase applications are given.
Sample Environments
The TOMCAT endstation for time-resolved tomography is highly flexible and features sufficient space around the sample position to enable the easy installation and integration of user-specific sample environments, including, for example, a humidity chamber (Derome et al., 2011), a cell for in situ methane hydrate growth (Sahoo et al., 2018), a tensile rig (Maire et al., 2016), a flow cell (Armstrong et al., 2014), a cold chamber (Maus et al., 2011), electrochemical cells for in situ battery (Ebner et al., 2013) and fuel cell (Eller et al., 2015) operation, as well as complex setups for in vivo experiments, e.g., on insects (Walker et al., 2014) or mice (Lovric et al., 2017).
A Measurement Computing USB Analog/Digital IO Module, integrated in EPICS, is also available to acquire, process and output electronic signals. This multi-function device is particularly suited to record analog electronic (high-speed) signals (e.g., for monitoring and logging temperatures or pressures during an investigation), as well as send custom-defined signal sequences to control an experiment.
For studies at elevated temperature, a laser-based heating system (Fife et al., 2012) can be mounted in a short time on top of the standard sample manipulator. In addition to the two laser heads with a small rectangular focus of 1 × 0.2 mm2 described in Fife et al. (2012), a pair of laser heads with a larger focal spot have been procured (Apollo Instruments, Irvine, CA, United States) and can be interchanged with the original set. The focus of the new lasers is oval with a Gaussian-like power distribution and 6 × 4 mm2 in size at a working distance of 150 mm. They are better suited to achieve near isothermal heating of samples with a size in the order of 5 × 5 × 5 mm3, typical for time-resolved experiments (Pleše et al., 2018). Both class IV diode laser sets operate at the same wavelength (980 nm) with a power output of 150 W per laser head.
The original pyrometry approach for measuring the sample temperature is limited to temperatures above 350°C. To cover lower temperature ranges, important, for instance, for oil shale pyrolysis investigations (Saif et al., 2019), a new option to use a K-type thermocouple (Omega Engineering, Stamford, CT, United States) has been implemented and can be used simultaneously with the pyrometer. The thermocouple is typically inserted through the bottom of the sample holder and located at or near the base of the sample. The signals are read out through the slip-ring by a signal conditioner box (Omega Engineering, Stamford, CT, United States). As opposed to the pyrometer, which measures at different locations on the surface of the sample or sample holder during rotation, the thermocouple sensor remains stationary with respect to it, leading to a significantly more stable temperature measurement. The disadvantage of the thermocouple is the impossibility to position the sensor directly at the heating (and imaging) position, resulting in an offset of the measured temperature.
Temperature control is achieved either through the direct definition of laser current profiles or by dynamically adjusting the heating power using a PID-based feedback-loop on the measured temperature. The latter approach is very susceptible to variations in the temperature readings of the pyrometer due to material inhomogeneities, changes of the emissivity and sample wobble or the slow response of the thermocouple system, rendering a stable tuning of the PID parameters very difficult and often resulting in large unwanted temperature fluctuations. For this reason, most experiments rely on the direct control of the laser power. This approach requires a calibration step at the beginning of each experiment, but results in significantly more stable temperature profiles.
For experiments at high temperatures, the samples are usually contained in (relatively) X-ray transparent boron nitride or alumina crucibles or quartz capillaries. A gas diffuser positioned above the sample can be used to control the sample atmosphere during the measurement.
While the fast tomography endstation at TOMCAT can accommodate a large palette of user-provided devices, for safety reasons it was not possible to integrate external laser systems in the same way until now. With the ongoing development of a new laser safety and integration concept, this limitation will soon be lifted and lasers with different characteristics than those presently available at the beamline could be used for tomographic experiments.
Software
In addition to outstanding imaging performance, one of the key guiding principles for the development of the hardware for the fast TOMCAT endstation has been its flexibility. Adaptations of the application-specific sample setups required to match the beamline infrastructure are kept to a minimum, while the choice and combination of different endstation components and tools (sample environment, microscope, detector, etc.) enables an optimal match of the measurement system to the investigation needs. These same principles, together with a focus on user-friendliness, are also used as a precept for all software developments.
Data Acquisition
All major hardware components (slits, shutters, detectors, microscopes, rotation stage and sample environments) at the beamline are integrated in the EPICS beamline control system. Manual manipulation and monitoring of individual components is available via graphical user interface panels for EPICS (caqtdm). For the development and automation of more complex data acquisition protocols, libraries and bindings for EPICS exist for various programing and scripting languages (python, java, MATLAB, etc.).
The tight synchronization of data acquisition and measurement devices required for fast tomography, however, is not achievable by software communication between these sets of devices. Instead, electronic control signals need to be used to send signals triggering or enabling different parts of the process chain. Both the rotation stage controller and the GigaFRoST detector can be programed to accept and output TTL signals in a variety of different modes (Lovric et al., 2016; Mokso et al., 2017). The synchronization is aided by a custom-designed TTL signal distribution box and the Measurement Computing DAQ device to record the signal trains.
Measurements with the GigaFRoST are controlled via an ipython command line interface. It allows the configuration of all measurement parameters (e.g., number of images to be acquired, region of interests, exposure time, rotation mode, etc.) and controls all of the necessary beamline devices during experiments. After the initial setup, users usually need to learn but a handful of different simple commands (4–6) to control their complex experiments.
To increase the flexibility with regards to the integration of user-specific equipment as part of the measurements, a plugin-system to communicate with additional external devices on demand, as part of the experimental workflow, is currently under development.
Raw experimental data is saved in an HDF5 file structured according to the Data Exchange format (De Carlo et al., 2014), including the metadata information describing the acquisition parameters of the measurement.
Data Preview
With the GigaFRoST detector, it is possible to preview radiographic projections while data are acquired (Mokso et al., 2017). This feature is key for the optimal control of fast tomographic experiments, where often the time scales of the dynamics under investigation are not yet well known. The option to display only selected images, for instance projections only at a specific angle to effectively suppress the rotational motion of the sample in the preview, makes it possible to even better observe and assess ongoing changes.
Although 2D X-ray projections of the sample already provide very insightful information to control and steer the experiment, for several applications they are unfortunately not sufficient to detect subtle but important changes indicating for instance the onset of a particular event. To expand the controlling and steering options, a previewing tool outputting selected arbitrarily oriented tomographic slices on-the-fly is currently being developed (Buurlage et al., 2019). This tool enables the optimization of the beamline and of experimental parameters as well as for instance the real-time selection of a region of interest in a larger volume, an operation often very difficult to achieve from 2D projections only. In a proof-of-concept experiment, the water uptake by a yarn sample and the filling of its pore space with liquid could be followed in real-time through selected tomographic slices. Per contra, the arrival of water at the measurement position remained invisible in the corresponding 2D projections.
Dynamic processes can be very sample- and experimental parameter-dependent and it is not always possible to predict when an event (e.g., crack opening) in the imaged region will occur. Furthermore, different mechanisms with different characteristic velocities, including very abrupt changes, could be present at the same time (e.g., slow plastic deformation and abrupt failure) requiring therefore the acquisition of single tomographic volumes as fast as possible to optimally image also the fastest processes. To avoid the collection of a large amount of useless data as well as putting the streaming and storage infrastructure under unnecessary load, it is of utmost importance to match the data acquisition to the dynamics of the studied process.
This new tool not only leads to information maximization in the acquired data, but opens up new options for an active experimental control, e.g., stabilizing a temperature ramp as soon as a magma starts vesiculating, or adjusting the tensile or compressive force when a particular microstructure starts to develop, further enhancing the flexibility of the endstation and helping in the realization of complex time-resolved tomographic studies.
Data Reconstruction
The sustained data rates provided by the GigaFRoST can be as high as 7.7 GB/s, leading to the collection of tens to hundreds of TBs of raw data per day. To fully exploit the potential of the TOMCAT fast tomography endstation, these large amounts of acquired data need to be efficiently handled and, in particular, tomographically reconstructed. Full access to the 3D microstructure shortly after the experiment is in addition important for decisions on beamline and experimental parameters. Computational tools for post-processing raw tomographic data have unfortunately not experienced the same rapid developments as high frame rate detectors. At TOMCAT we have developed a fast and user-friendly tomographic reconstruction pipeline delivering full tomographic volumes just a few seconds to minutes after data acquisition completion (Marone et al., 2017). In addition to several routines for the reduction of artifacts (e.g., ring and zinger removal), phase retrieval according to the Paganin algorithm (Paganin et al., 2002) is part of the pipeline and key for improving the signal-to-noise and contrast-to-noise ratios of sub-second time-resolved tomographic experiments (Mokso et al., 2013). With a combination of dedicated and shared computing infrastructures, it is possible to simultaneously reconstruct selected tomographic volumes almost in real-time for fast data assessment as well as post-process TBs of raw tomographic projections in an efficient manner.
Applications
Solute Transport Through Porous Media
The transport of substances dissolved in liquids and their chemical reactions in topologically complex environments, such as porous media, play an important role in many environmental and industrial applications, including, for example, contaminant remediation (e.g., Williams et al., 2009), nuclear waste disposal (e.g., Winograd, 1981), enhanced oil recovery (e.g., Jiménez-Martínez et al., 2016) and geothermal energy production (e.g., Barbier, 2002), among many others. The majority of natural and man-made porous media exhibits a high degree of spatial heterogeneity in terms of flow dynamics, with development of both preferential paths (high velocity regions) and stagnation zones (low velocity regions). Such a degree of heterogeneity makes solute transport very complex and difficult to understand and characterize, and therefore to be controlled (Dentz et al., 2011).
Dispersion and mixing are two of the main transport processes of solutes through porous media. Dispersion describes the continuous increase through time of the spatial extent of a solute (generically called “solute plume” in what follows) within the media. It is mostly a consequence of the high degree of spatial heterogeneity in the fluid flow velocity, which enhances the spatial heterogeneity of the solute concentration within the liquid. Mixing, in contrast, is the process that increases the actual total volume occupied by the solute, i.e., a spatial smoothing of the solute concentration field (Ottino, 1989; Kitanidis, 1994; Dentz et al., 2011). Mixing can also be defined as the process in which two solutes (e.g., resident and incoming solution) tend to occupy the same volume in space. The characterization of dispersion is important to predict the spatial extent of a solute plume. However, it does not provide any information about the actual mixing of solutes (i.e., the distribution of the solute concentrations) within the plume. This is a major problem because concentration fields control chemical reactions (Flühler et al., 1996; Dentz et al., 2011; Chiogna et al., 2012; de Barros et al., 2012; de Anna et al., 2014). Indeed, mixing plays a key role in controlling both fluid-fluid and fluid-solid reactions. Since in porous media both mixing and chemical reactions intrinsically occur at the pore-scale, i.e., at the length scale of the space between the components of the solid skeleton, mixing also needs to be characterized at this length scale. The relative importance of transport to chemical reactions, either within the liquid or with the hosting solid environment, is measured by the Damköhler number (Da), representing the ratio of advection to reaction time scales. Chemical reactions can thus be classified as mixing-driven (or mixing-limited), when the reaction is fast compared to advection (Da>>1), or kinetics-driven (Da<<1) in the opposite case.
The experimental characterization of mixing and chemical reactions in porous media has been so far very difficult, mainly due to technological bottlenecks in visually accessing these “hidden” environments. While microfluidics enables the visualization and quantification of, e.g., concentration gradients with high temporal and spatial resolution (e.g., Jiménez-Martínez et al., 2015), it is experimentally limited to 2D, with obvious and expected differences in the observed phenomenology compared with the reality. As an example, a recent theoretical and numerical study has suggested that the additional degree of freedom offered by the third dimension affects mixing and mixing-driven processes (Lester et al., 2013, 2016). Time-resolved synchrotron-based XTM provides the means to advance in the investigation of solute dispersion and mixing through partially or fully saturated porous media, at the actual pore-scale, beyond the 2D model case studies employed so far.
In this study, we have been focusing on a fluid-fluid solute system to characterize the impact of the third dimension, i.e., of a larger tortuosity in the pore space (Ghanbarian et al., 2013) compared with that achievable in a 2D microfluidics model, on the dispersion front’s geometrical and topological properties and on the concentration gradients distribution, therefore on the mixing. The physical model used in our in situ experiment during XTM consisted of a packing of sintered, irregularly shaped borosilicate glass beads, manufactured by Hilgenberg GmbH. We chose such a bead packing as an analog of soil. As a porous medium, it possesses a spatially heterogeneous pore space with a size distribution in the range of 40–100 μm. The bulk porosity of the whole bead packing is about 28% and its permeability is 10–10 m2. For this in situ experiment, we manufactured a flow cell consisting of three pieces: two conic containers, at the top and bottom of the cell, used as flow inlet and outlet, and a central, cylindrical container, within which the bead packing was fixed (Figure 3). Paraffin film was set between the bead packing and the container to minimize boundary effects. Any of the three parts of the flow cell was printed in 3D by stereo-lithography (DWS) using a photosensitive resin composed of acrylic monomers (Vitra 429). The central part of the cell, containing the bead packing, has an external diameter of 4 mm and is 8 mm high. The whole flow cell with the bead packing was mounted on the TOMCAT fast tomography endstation rotation stage, its inlet and outlet parts being connected to PEEK tubes (790 μm OD, 250 μm ID) (Figure 3). The in situ experiment consisted in pushing a liquid (called herein “tracer fluid”) through the inlet into the bead packing, after having partially saturated the sample in advance with another liquid (herein called “resident background fluid”). Both the saturation with the background fluid and the further injection of the tracer fluid occurred via an automatically controlled syringe pump (by Harvard Apparatus) connected to the inlet and pumping at a constant flow rate (0.015 mL min–1). The pressure difference between the inlet and the outlet was simultaneously measured using microfluidics pressure sensors (MPS by Elveflow). As background fluid, we used a KI water-based solution with 0.06 M concentration. The tracer was also a KI water-based solution, but with a much higher concentration (0.9 M). We chose KI as the solute to be transported because of (1) its lack of chemical reactivity with the borosilicate beads and (2) because of its high effective atomic number Zeff, mainly due to presence of the I– ion. It allowed creating a sufficient X-ray absorption and phase contrast on the voxel length scale inside the regions of the pore space saturated with the liquids during dispersion and mixing of the tracer within the background fluid.
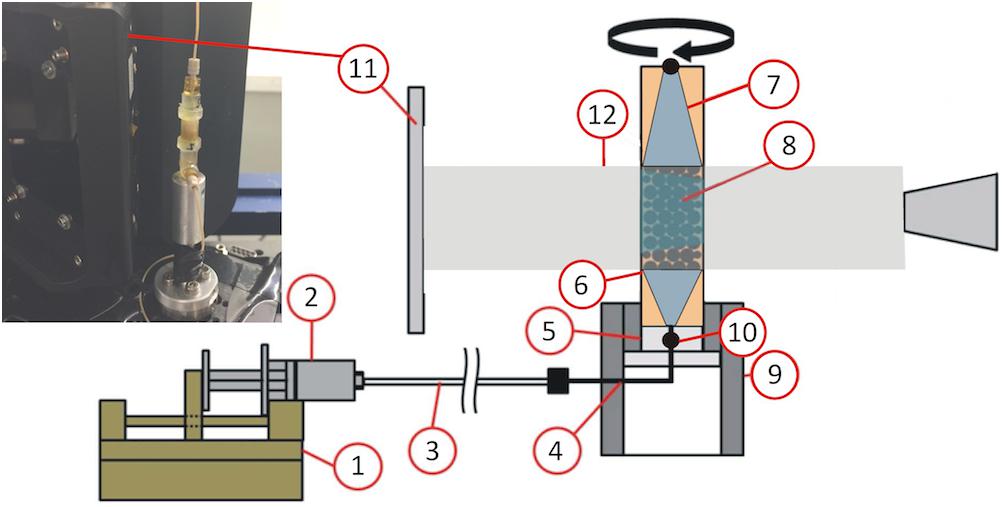
Figure 3. Experimental setup used to study solute transport through porous media (modified from Setiawan et al., 2014), which includes: (1) syringe pump, (2) syringe, (3) tubing, (4) connector, (5) bottom cap, (6) flow cell printed in resin, (7) cone at the inlet and outlet, (8) sintered irregular glass beads, (9) holder, (10) pressure sensor, (11) X-ray detector, and (12) parallel beam.
Since the tubes were directly connected to the inlet and outlet of the flow cell without a slip ring, it was not possible to continuously rotate the flow cell mounted on the TOMCAT X-ray tomographic rotation stage. Instead, the flow cell was rotated around its vertical axis of 180° during the tomographic data acquisition, then it was rotated back to the 0° orientation before starting the tomographic acquisition at the next point in the time series (cf. Figure 2D, back-and-forth rotation protocol). The tomographic acquisition settings were kept constant throughout the time series. As in most time-resolved experiments, the high-efficiency 4× macroscope coupled to the GigaFRoST detector was used. Since achieving quantitative information about the solution concentration from the voxel values was an essential point for this study, we decided to use monochromatic radiation (21 keV) so to avoid beam hardening artifacts, despite the significant flux reduction. Thanks to the high quality and efficiency of the used optics, it was nonetheless possible to keep the scan time around 1 s. Indeed, the actual acquisition of a single tomographic dataset, including rotation acceleration and deceleration, took about 1.2 s. The experiment consisted in acquiring a time series of such datasets at a sampling frequency of one tomogram about every 2.4 s, while the tracer was continuously pushed into the flow cell at the constant flow rate mentioned above. This high acquisition frequency achievable at the TOMCAT fast tomography endstation is essential in capturing the targeted processes. Indeed, the time scale of the tomographic acquisition (τac) must be smaller than the time scale of both the solute’s advection (τa) and of its diffusion (τd) over a pore length (τac<<τa<<τd). The sustained acquisition possibilities offered by the GigaFRoST enabled the acquisition of a tomographic time series with 80 time-frames, of which about 50 were necessary to displace the tracer from the inlet to the bottom of the bead packing. The voxel size of each tomogram was 2.75 μm, with an effective spatial resolution of approximately 2 voxels (5.5 μm). This resolution allowed us to get access to a sufficient level of details of the pore space as well as of the concentration gradients and geometrical features of the tracer plume. All tomograms were reconstructed (including phase retrieval) using the beamline hardware and software infrastructure (Table 2).
Figure 4 shows the spatio-temporal evolution of the solute plume at 4 out of the 80 available time frames. The time frame of Figure 4A was designated as time = 0 s and depicts the tracer fluid starting to enter into the porous medium. Each panel in Figure 4 shows, by 3D rendering, about one quarter of a reconstructed tomogram as two overlapped volumes: the bead packing volume (in gray tones) and the volume occupied by the liquids (in colors). Both volumes were selected via a customized 3D image segmentation workflow. The gray tone scale used to represent the bead packing voxel values was associated to the same voxel value range fixed for any time frame. The same was done for the representation of the liquid voxel values. In Figure 4, only the color scale bar describing the liquid volume is shown, normalized to its maximum value in space and time. Such a color scale represents a proxy of the physical tracer concentration scale. Thus, bluish colors mean lower concentration, while more reddish colors are associated with a higher concentration of KI in water. The arrow in each inset indicates the flow direction through the porous medium. For providing better evidence of the successful resolution of the tracer concentration gradients inside the liquid volume, each inset shows a planar cross-section parallel to the flow direction depicting the complete sample’s volume and adopting the same color scale of the 3D rendering.
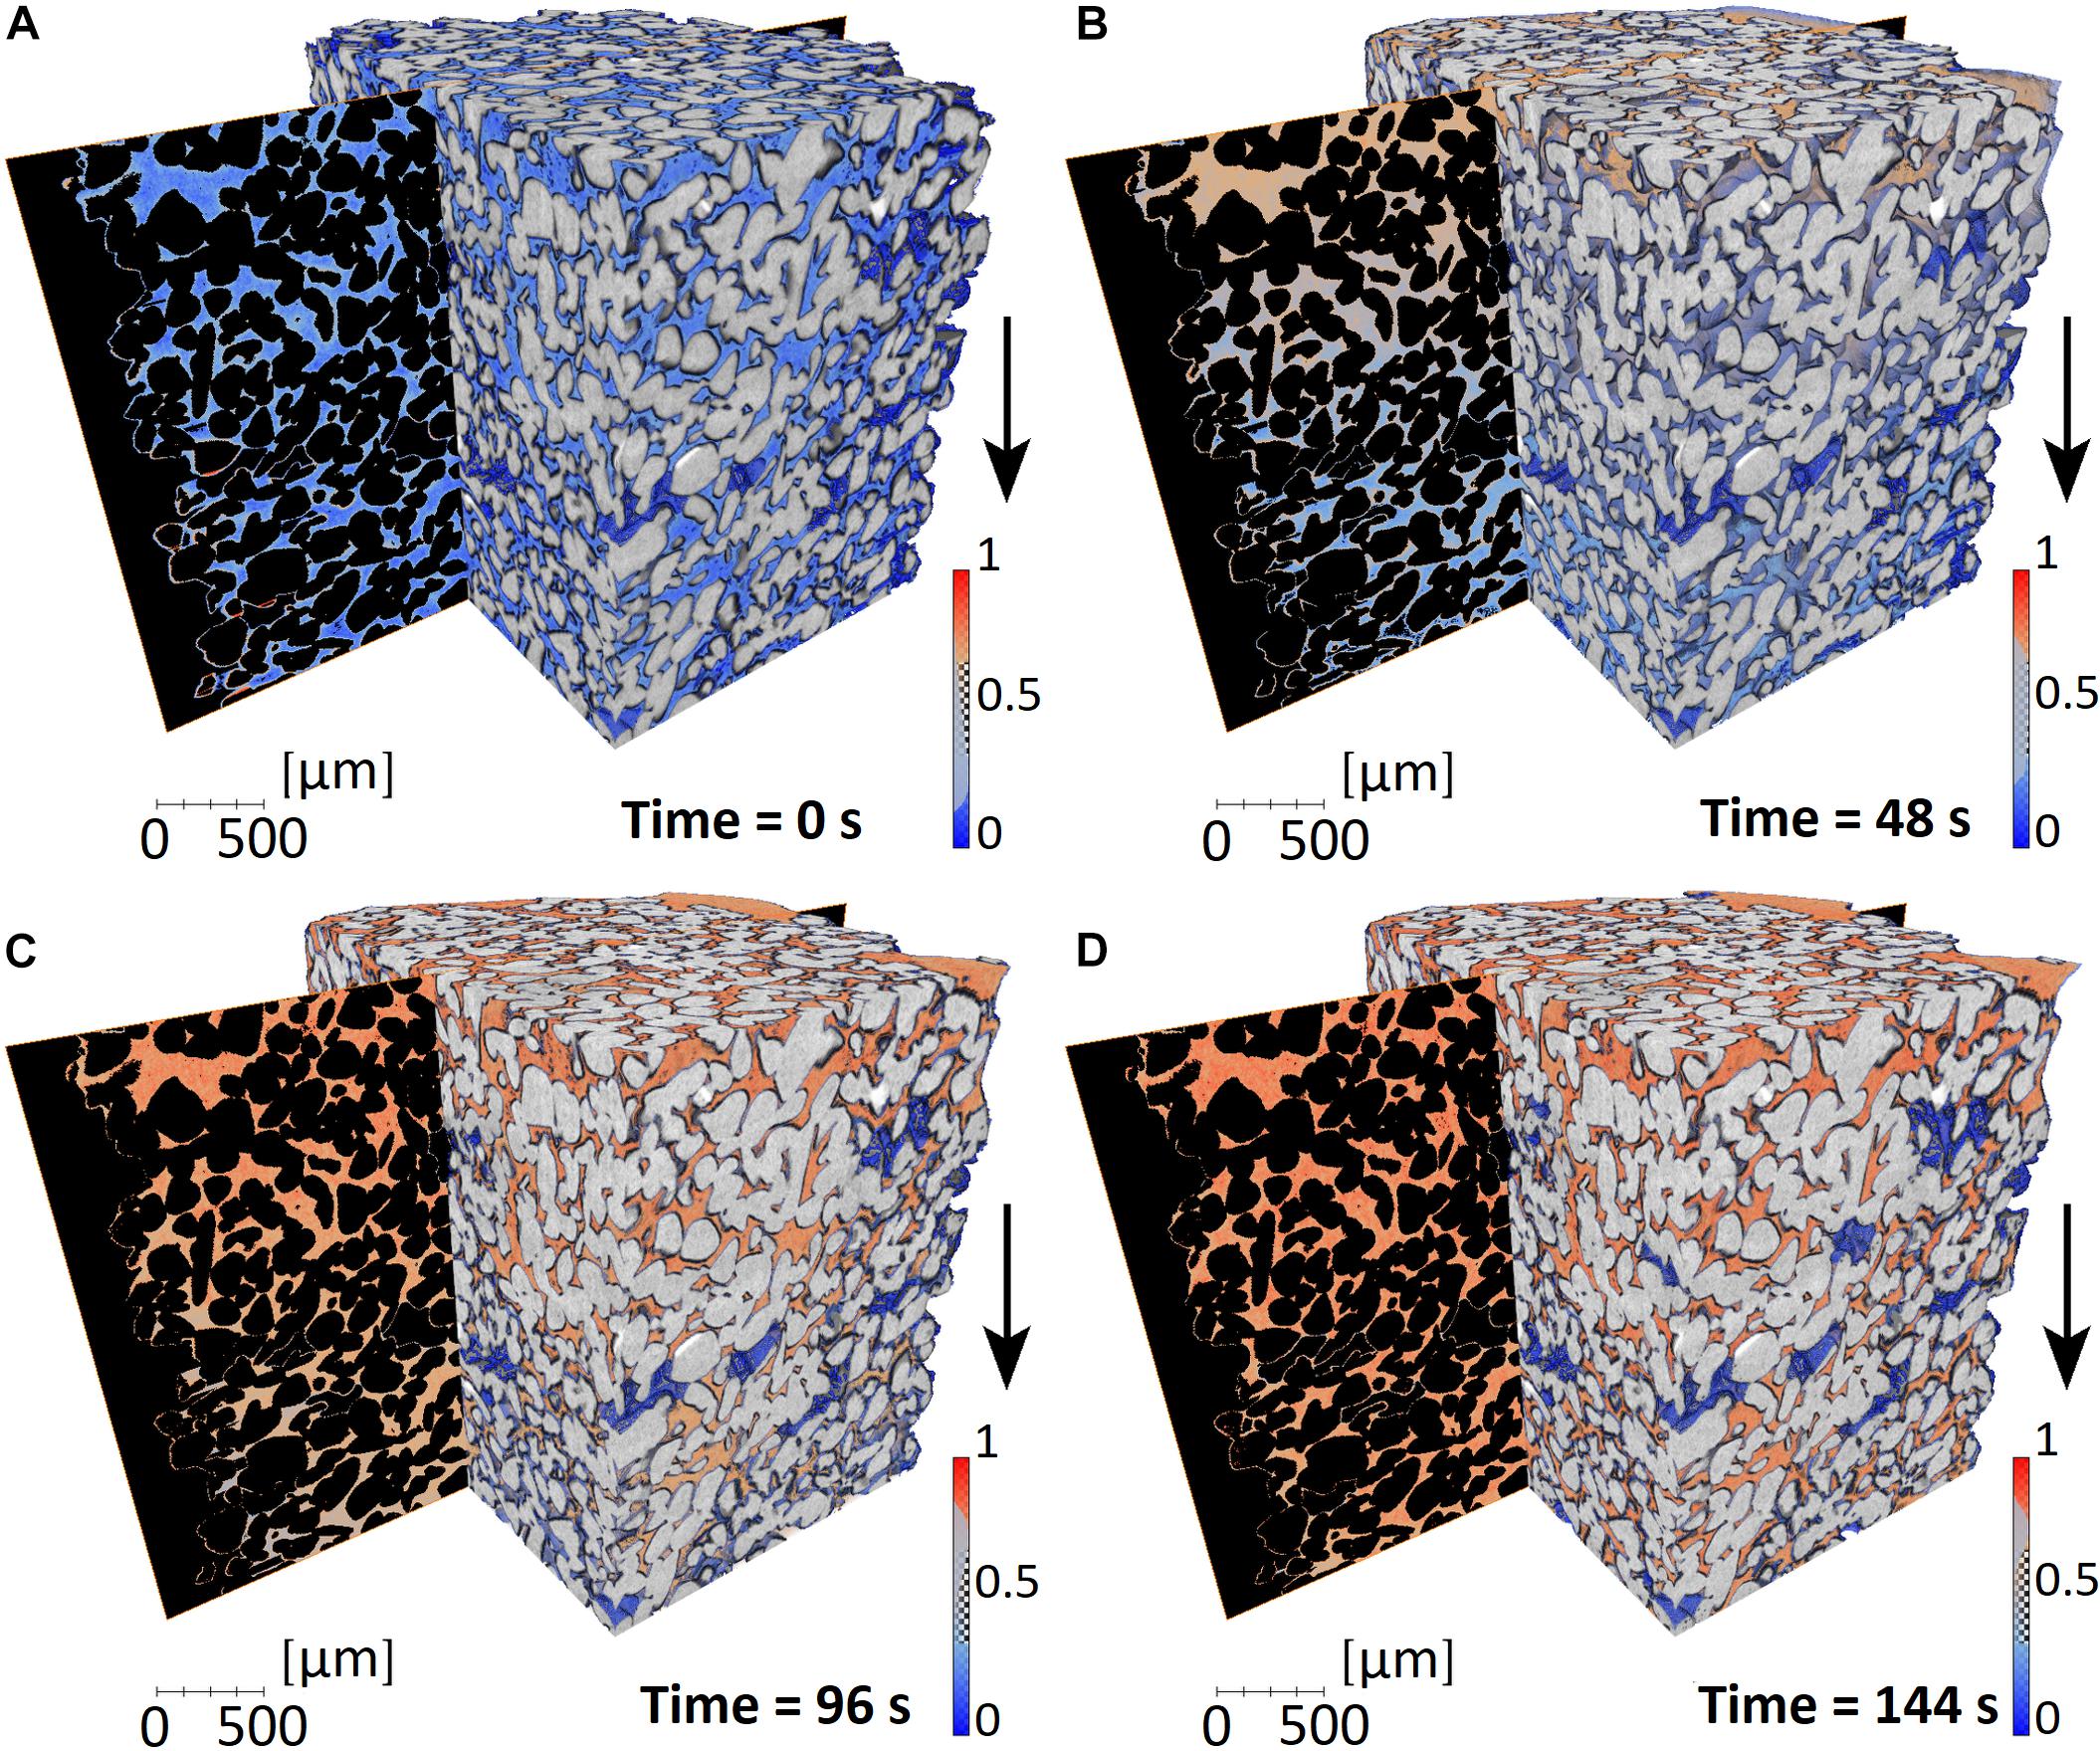
Figure 4. Graphical rendering of the time series of tomographic datasets during the solute transport through a porous medium. Each panel refers to a distinct point in the time series. The time scale was set to 0 s for the dataset in panel (A), corresponding to the time when the tracer starts to penetrate the porous medium. Each panel (B for time = 48 s, C for time = 96 s, D for time = 144 s) shows the 3D rendering of two distinct and complementary sub-sets of the acquired X-ray phase contrast tomogram: the glass beads volume (in gray scale) and the liquid (in colors). Approximately one quarter of the porous medium volume is shown, while the rest was cut out in order to better show the liquid distribution inside the pore space. The arrows indicate the main flow direction. The color mapping is identical for all time points, and the liquid phase value range was renormalized to its maximum value in space and time during the overall experiment duration. The corresponding color bar is shown in each inset. More bluish colors correspond to smaller (normalized) solute concentration values while more reddish ones indicate higher concentrations. Additionally, a planar cross-section through the full extent of the liquid volume along the flow direction is shown in each panel. All voxels not belonging to the liquid phase are rendered in black in these vertical slices.
The insets in Figure 4 represent a small excerpt of the complete concentration field temporal evolution, showcasing the very heterogeneous chemical landscape. The dispersion (spreading along the main flow direction) increases with time, as does the existence of a larger volume of fluid with concentration different from 0 and 1, indicating a temporal increase of mixing between the two fluids. Note that the co-existence of high and low fluid flow velocity regions induces an incomplete mixing behind the plume’s front. In the low velocity regions, high concentrations are mainly reached by molecular diffusion. The spatial distribution of the phases and the imposed boundary conditions allow estimating the local flow velocities with the help of a computational fluid dynamics solver. Incomplete mixing has implications in the global reactivity of the system, i.e., the existence of concentration gradients promotes reactions. Although the main purpose of this first proof-of-concept study was to infer dispersion and mixing, in addition to testing the potential of the experimental approach for this purpose, the chemical reactivity could be also investigated. Assuming a fast reversible reaction, i.e., a mixing-driven reaction (Da<<1), of known equilibrium constant, the local reaction rate can be inferred from the mixing of the tracer with the background liquid using the method presented by De Simoni et al. (2005, 2007) and Willmann et al. (2010), already successfully applied to 2D experimental data by Jiménez-Martínez et al. (2015). This allows quantifying the 3D spatial distribution of local reaction rates from the measured tracer concentration fields.
Evaporite Deformation
The processes that allow for km-scale rock deformation and mountain building are taking place on the grain scale. “Thin-skinned” foreland mountain belts like the Swiss Jura Mountains usually form where km thick sediment stacks get detached from underlying rock units along evaporitic rock sequences (e.g., Jordan, 1992; Vergés et al., 1992). Evaporites are a type of sedimentary rock that forms due to the evaporation of saline water in isolated basins, and are mostly composed of calcite (CaCO3), halite (NaCl) and calcium sulfates such as gypsum (CaSO4⋅2H2O). In the course of diagenesis (with increasing pressure and temperature during burial), gypsum dehydrates to bassanite (CaSO4⋅0.5H2O) and anhydrite (CaSO4).
The exact grain-scale mechanisms operating in evaporitic detachments are still debated. There is consensus on the significance of the low mechanical strength and low permeability of rock salt. The exact role of the gypsum dehydration reaction, which releases large quantities of pressurized water and affects the effective stress in detachment faults, is still being explored.
In a pressure and temperature dependent reaction, gypsum dehydrates to form bassanite:
The reaction is accompanied by a solid volume reduction of ∼29%, which usually causes the formation of porosity around the nucleating and growing bassanite grains. However, the total volume of the reaction is positive with +8%, due to the large volume of the released water. Where the water cannot drain, pore fluid pressure will build up.
Although, individually, gypsum dehydration and salt deformation have been studied extensively, little is known about the complex chemo-mechanical-hydraulic feedbacks between gypsum dehydration and halite deformation. The (i) reduction in solid volume during the dehydration reaction which produces porosity, (ii) hydraulic fracturing induced by fluid overpressure, which reduces the pore fluid pressure and lets the dehydration reaction progress, and (iii) the expected low permeability of salt affect the transport properties and influence the deformability of the rock. Ultimately, it is these coupled processes on the grain scale that determine the role of evaporites in tectonic processes. In situ experiments documented with time-resolved (4D) synchrotron-based X-ray tomography are ideally suited to study feedback processes in evaporites with the necessary temporal and spatial resolution.
To investigate the chemo-mechano-hydraulical feedbacks during evaporite deformation and dehydration, rock deformation experiments have been performed at SLS’s TOMCAT beamline. These experiments were enabled by the X-ray-transparent tri-axial deformation rig Mjölnir (Figure 5, Butler et al., 2017), integrated at the beamline just for this specific experiment. Mjölnir deforms cylindrical samples with a diameter of 3.2 mm and 8–10 mm height. At ambient temperatures, it allows the application of a confining pressure (Pc) of up to 50 MPa via a confining fluid, and axial loads of more than 600 MPa. The axial load is applied via a piston that is driven by a hydraulic actuator. Both, the confining pressure and axial load are remotely controlled via two high-pressure syringe pumps (Figure 5B). For the experiments described here, the rig was equipped with band heaters (Figures 5A,B) to perform experiments at sample temperatures of up to 110°C. Higher temperatures are possible but were not necessitated by the experiments described here.
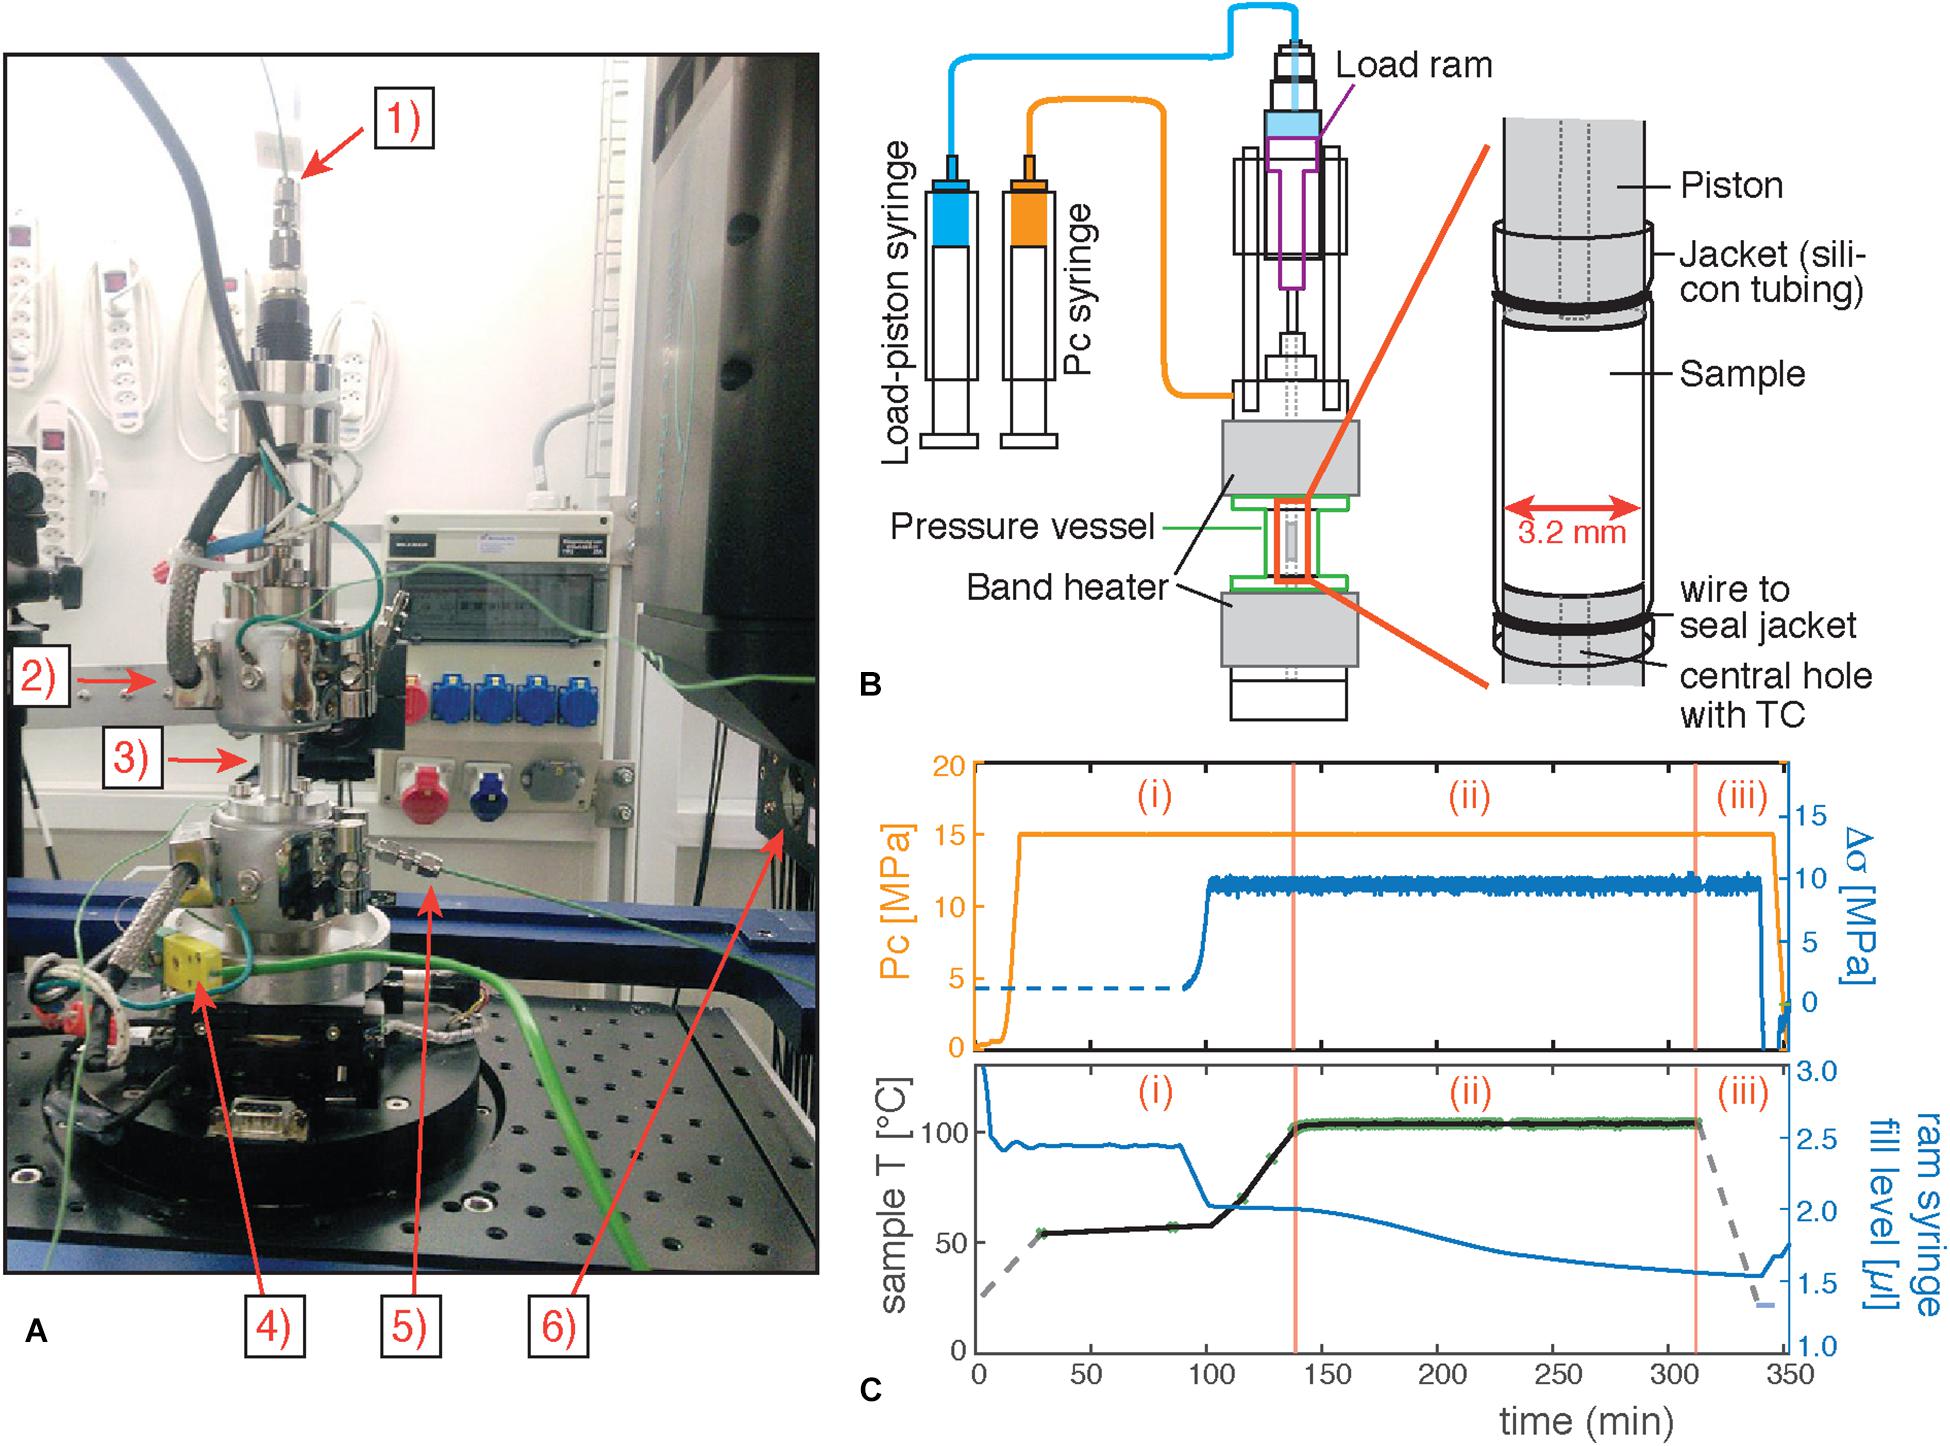
Figure 5. Experimental setup. (A) Photograph of the deformation rig Mjölnir installed at the TOMCAT beamline. (1) Fluid inlet to load ram. (2) Upper band heater. (3) X-ray transparent pressure vessel (sample located inside). (4) Thermocouple connector. (5) Confining fluid inlet. (6) Scintillator. (B) Schematic sketch of Mjölnir, the high-pressure syringes controlling load and confining pressure, and the inner sample assembly. (C) Data derived from high-pressure pumps and temperature log. Stages of an experiment are indicated: (i) Initiation of the experiment: Pressurization, loading and heating (ii) Main part of the experiment with XTM scans at short intervals. Semi-transparent green crosses on temperature log curve (black) indicate time of XTM scan acquisition. (iii) End of experiment. De-pressurization and cooling. The ram syringe fill level curve is a proxy for load piston displacement. Decrease of the syringe fill level during the experiment indicates advance of the piston into the sample chamber as response to sample shortening/deformation.
We deformed/dehydrated solid samples composed of either homogeneous mixtures of NaCl and gypsum or alternating NaCl – gypsum layers. Samples were pressurized to a Pc of 15 MPa, loaded to 8 MPa of differential stress and heated to 96–110°C (Figure 5C). The Pc and the axial load were logged at 1 Hz. The temperature was logged every time a tomographic scan was acquired. The FOV was ∼5 mm wide and 3.3 mm high, at a voxel resolution of 2.753 μm3.
The coupled dehydration/deformation processes investigated in this study involve non-linear positive feedbacks and transient, run-away behavior can occur. Consequently, a good balance between fast data acquisition and data quality was very important to us to avoid motion artifacts and minimize noise in the XTM data. On the basis of previous experiments, we further anticipated that the relevant processes would unfold over prolonged periods of time, where the capability to continuously stream data from the camera would be critical. The GigaFRoST camera coupled to the highly efficient 4x macroscope allowed us to meet both requirements. Individual XTM datasets were acquired in ∼2 sec, rotating Mjölnir over 180° while collecting 2000 projections. White/dark field images were acquired every 3–5 h. At the start of an experiment, the scan interval was chosen to be high, at either every 0.5–1 min. In later stages of the experiment, where the rate of microstructural change slowed down, acquisition intervals were reduced to every 5–10 min. 3D data were reconstructed from the projections at the beamline (Table 2).
With the acquired time resolved 3D data it is possible to closely follow the spatial and temporal advance of the dehydration reaction in the gypsum layers and its link to the microstructural changes observed in the sample. The high quality of the data, especially in terms of absorption contrasts, allowed the use of largely unsupervised segmentation algorithms to extract pores and bassanite confidently. Tracking the discrete evolution of these two phases in the large 4D datasets is critical for the quantification of the different feedback mechanisms.
Heating the sample over the gypsum stability field destabilizes the gypsum and causes it to dehydrate. This destabilization of the system triggers a number of coupled transient developments. In these experiments, dehydration reaction in the gypsum initiates at the contact to the salt layer, and reaction spreads over the whole gypsum layer on the order of a few tens of minutes (Figure 6). Whereas porosity formation in the gypsum layer is an expected result of the dehydration reaction (e.g., Fusseis et al., 2012; Bedford et al., 2017), porosity and permeability changes can also be observed within the salt layer (Figure 7). There, the changes can be correlated to the fluid release and pore fluid pressure buildup caused by the dehydration reaction in the gypsum layer, showing an example of a coupled process. Further developments that feed into grain-scale feedbacks include the (i) temporary fluid release until the dehydration reaction has completed, (ii) the formation and, at least partly, subsequent compaction of porosity, or (iii) increased salt deformation rates where water enters the system from the dehydration reaction. It is during these transient stages that the rock is most likely to weaken significantly and where/when we expect to find the processes that explain the susceptibility of evaporitic rocks to function as detachment horizons.
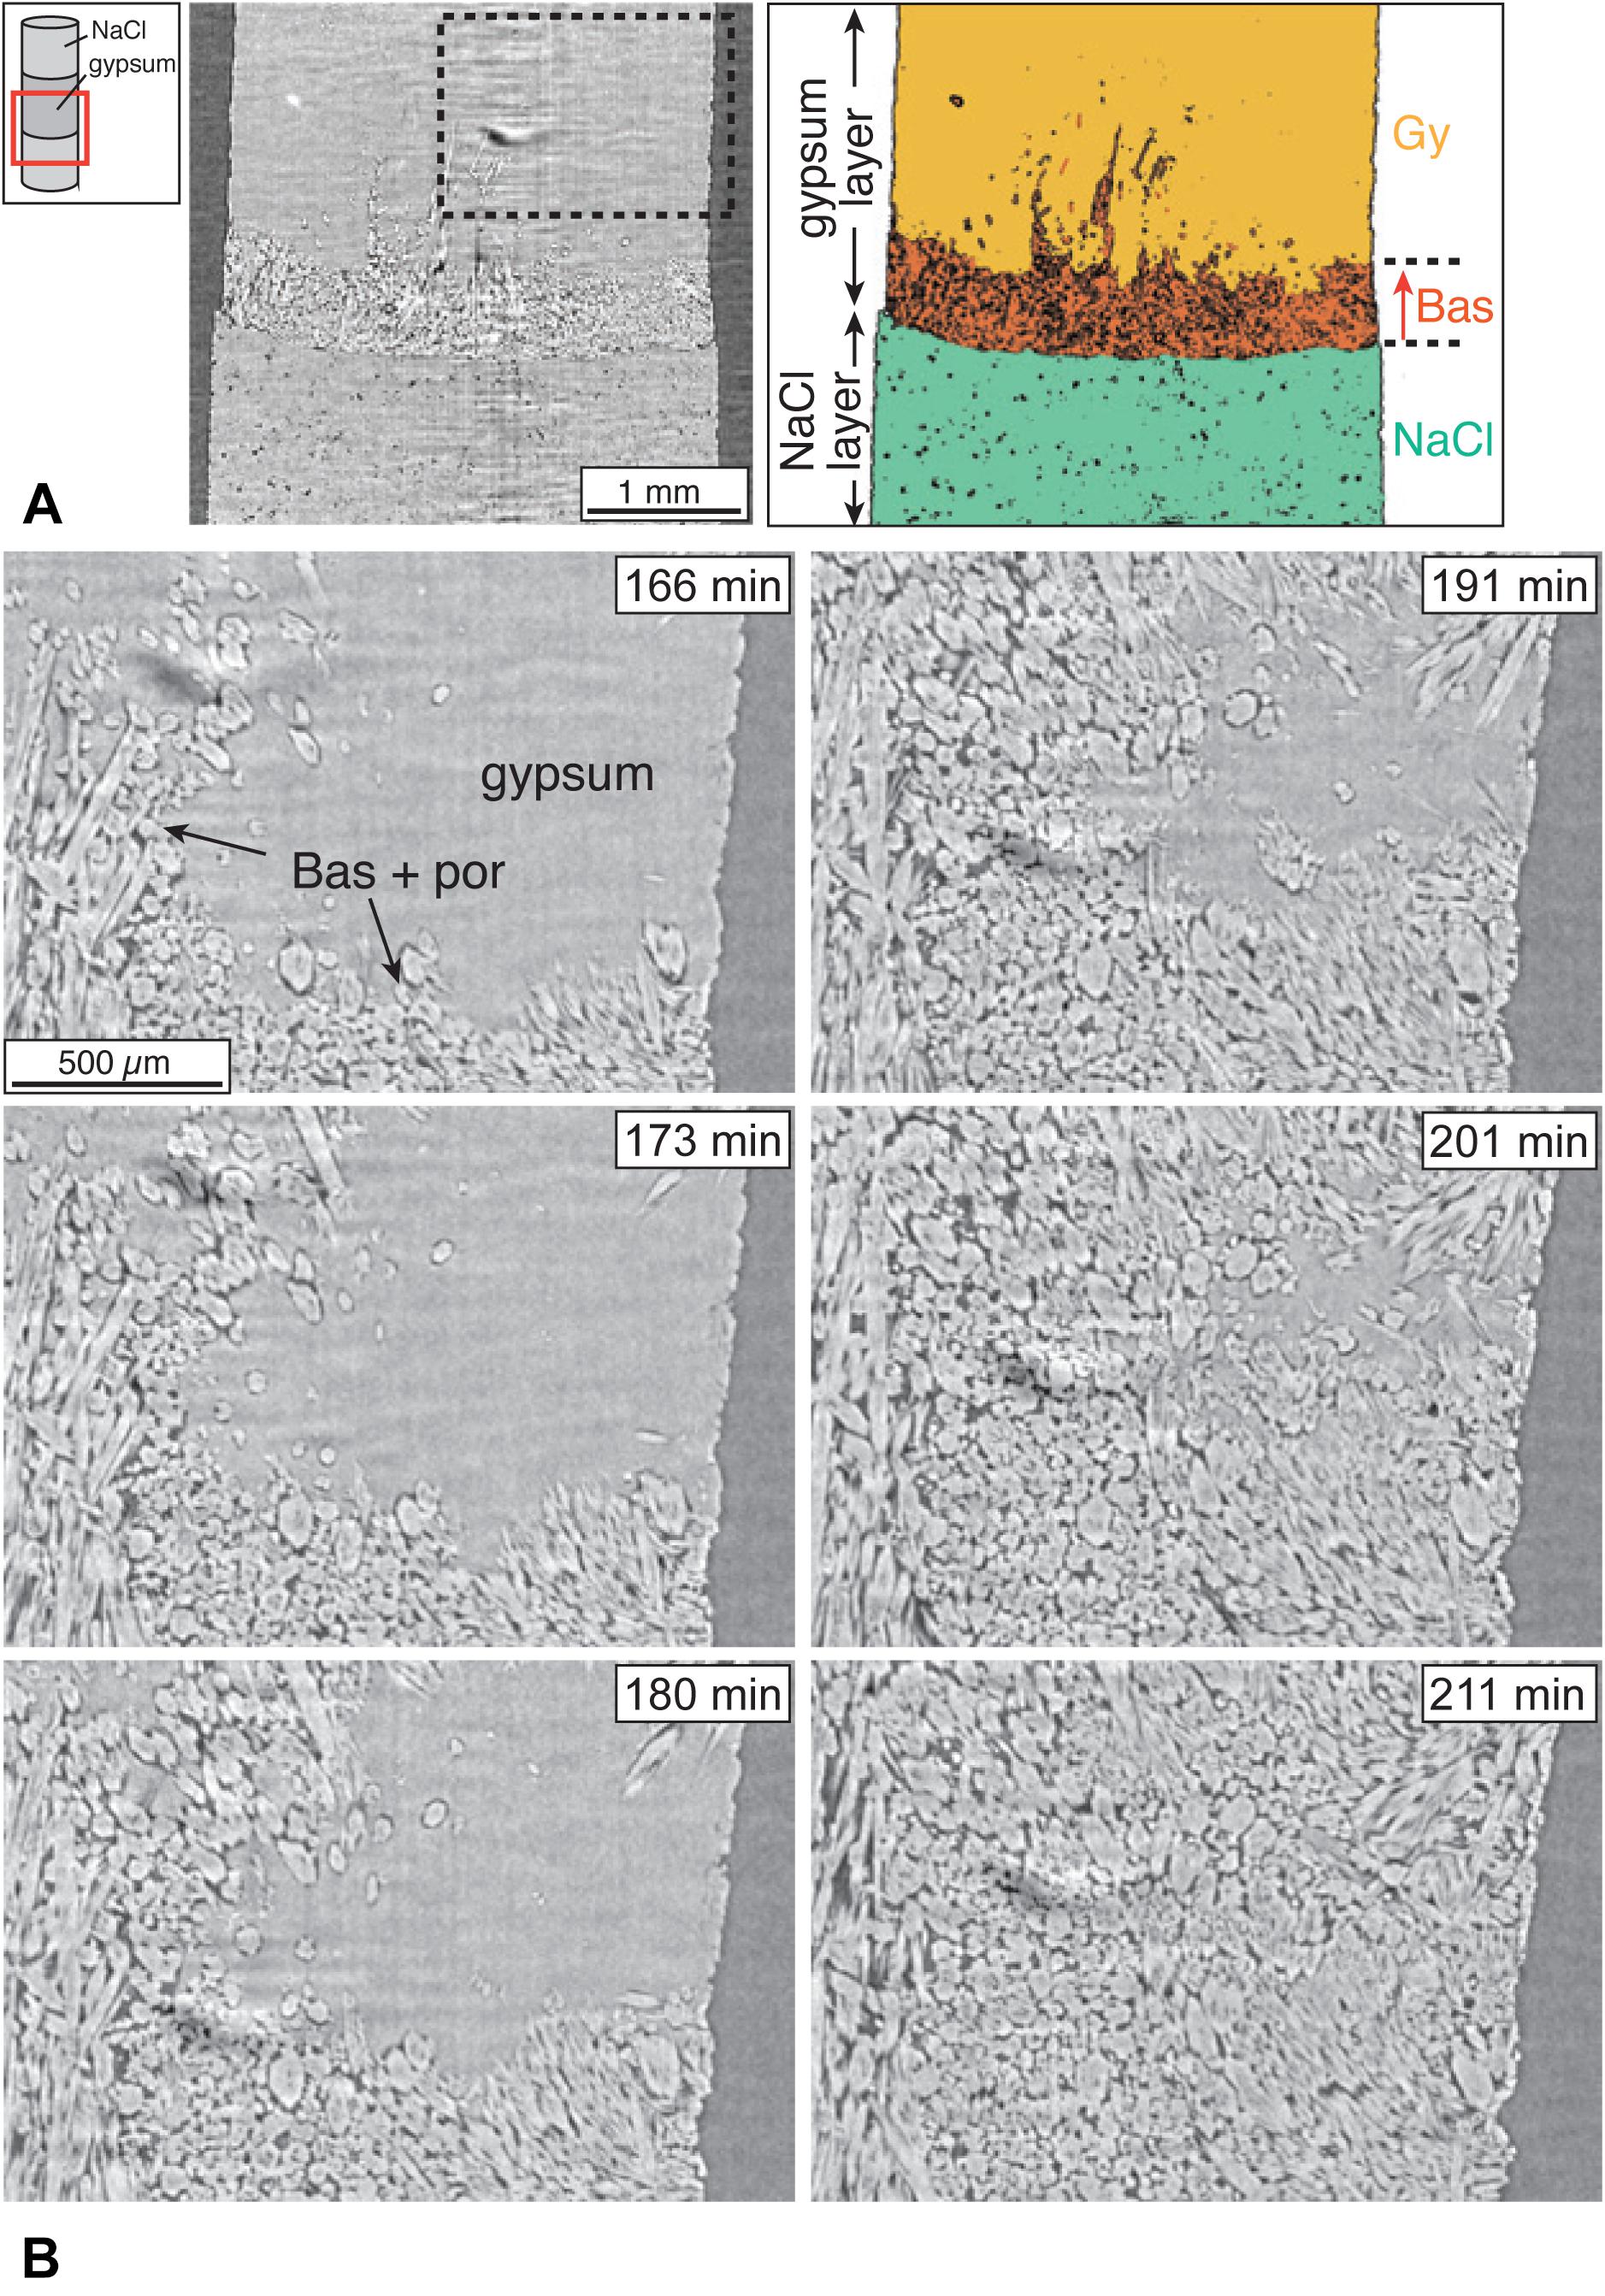
Figure 6. Microstructural development overview. (A) Left: sketch of sample assembly with indicated FOV, which captures the interface between an upper gypsum and a lower NaCl layer. Middle: tomographic reconstruction. Vertical slice through the sample. Right: Same as middle image, but segmented for the different phases for better visibility. Orange: Gypsum, Red: Bassanite, Green: NaCl. The dehydration reaction, forming bassanite, initiates at the gypsum – NaCl interface and travels upwards into the gypsum layer. (B) Time-series showing the advance of the dehydration reaction.
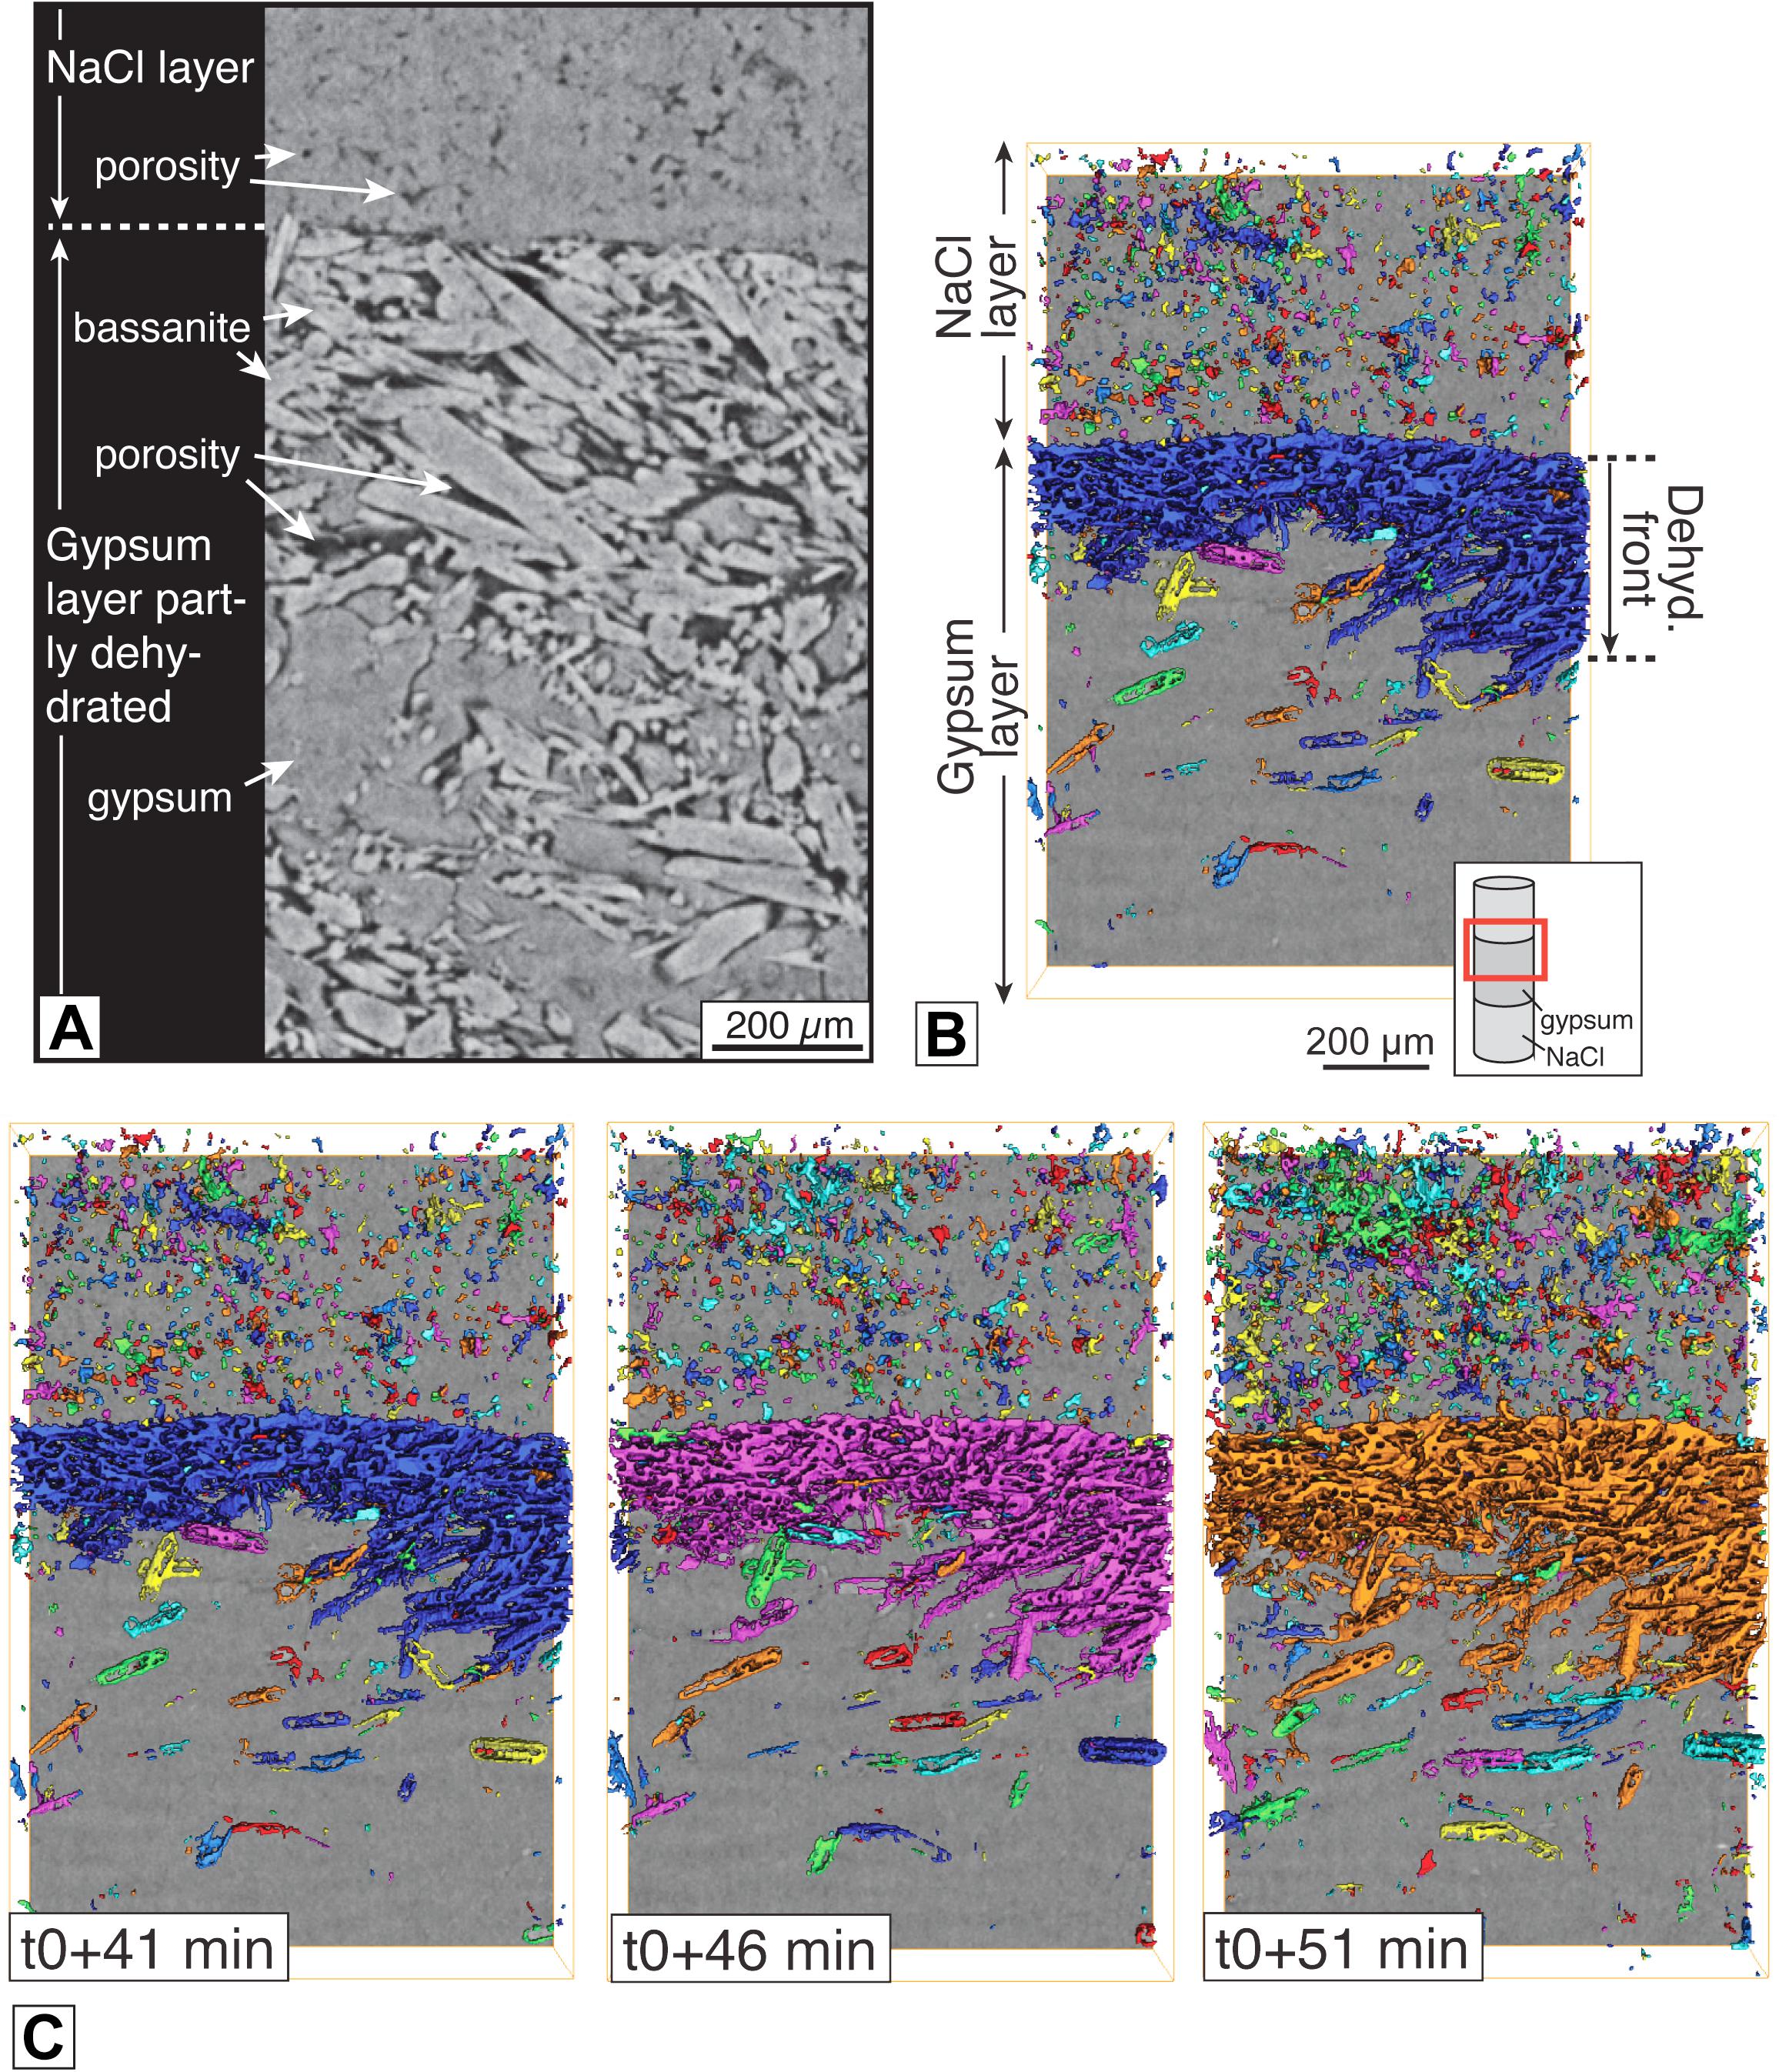
Figure 7. Porosity evolution. (A) Microstructure overview. Sub-area of reconstructed XTM scan, vertical cross section. (B) Explanatory image for how to read data in (C). 3D subvolume of segmented porosity. To each pore, an individual color is assigned (although colors repeat). The subvolume contains part of an NaCl layer to the top, a gypsum layer to the bottom and a dehydrated layer traveling from the NaCl – gypsum interface downwards into the gypsum layer. The large connected pore volume (large blue pore) shows how porosity in the dehydrated layer is well connected. (C) Time-series of pore network evolution with a time step of 5 min between successive time points.
Magmatic Processes
Modern volcanology uses a wide range of field and laboratory techniques, analyzing and comparing cooled natural samples with experimental products, real time geophysical measurements and field observations to improve our understanding of magmatic behavior. However, many of the key sub-surface processes that control magma mobility and influence eruption behavior remain extremely challenging to constrain. This is because of the multiple spatial and temporal scales over which the processes operate, and the range of physical and chemical heterogeneity in the magmatic systems; a level of complexity further compounded by overprinting and alteration of the microstructural information during all subsequent stages of formation, storage, mobilization and transport of magma. The natural and experimental samples we can analyze post mortem will not retain the textures that controlled behavior at depth, or those that existed under experimental conditions.
Understanding what triggers eruptions, what controls eruption explosivity, and how the coupled physical, chemical and thermal evolution of the magma control its eruptability remain core challenges in the discipline. This includes the nucleation and growth of multiple mineral and bubble populations through time; how crystal and bubble “cargoes” control magmatic mobility; the mechanisms of mixing and mobilization of magmas during recharge; and how bubble growth and coalescence control permeability and outgassing during magma ascent and therefore influence eruption explosivity. Fragmentation, welding or sintering, and understanding how deformation and flow can affect the rheological behavior and mobility are also targets of ongoing investigation.
Making advances in these areas requires real-time, direct observations of the processes operating at all stages of magmatic evolution. Analysis of post-emplacement natural samples or experimental charges both include a component of overprinting, with early processes obscured or obliterated by later stages of the evolution, and neither allow us to capture the dynamics of the processes involved. X-ray tomography at synchrotron facilities such as TOMCAT now gives us the capability to perform these much needed in situ experiments, and allow us to observe and quantify processes that have hitherto been inaccessible. This continues to lead to new advances in conceptual understanding and the development of new empirical and numerical models to describe magmatic evolution.
In recent years the TOMCAT time-resolved endstation has been used with great effect in a number of high temperature volcanology studies, including work that has identified the mechanism of volcanic sintering (Wadsworth et al., 2017, 2019), tracked bubble growth (Baker et al., 2012; Pistone et al., 2015b; Pleše et al., 2018), and melt segregation mechanisms (Pistone et al., 2015a). In many of these cases, the starting point of the processes under investigation and its duration are unknown or hard to predict prior to the experiment. Often, the kinetics of the processes has a strong thermal dependence, or is controlled by the initial sample microstructure. In these cases, the ability to exploit the GigaFRoST to capture multiple, pre-registered 3D datasets at a variable image frequency over the course of an experiment is invaluable, as is the absence of any delay for data download from the camera before starting another acquisition, should additional data be required. To briefly highlight the capability of the TOMCAT endstation for volcanological research, we present two exemplar datasets that show the range of high-temperature experimental conditions that can be achieved. For the purposes of this study, we focus here on the power of the temporal resolution of the data, and the information that can then be extracted from such data, rather than giving a detailed analysis and interpretation in any volcanological context.
Capturing Instabilities in Bubble Interactions in 4D
Capturing the bubble growth and collapse along with bubble-bubble interaction and coalescence is key to understanding degassing and out-gassing of magmas, which in turn controls the build-up and release of the over-pressure that drives explosive eruptions. The TOMCAT endstation has been instrumental in shedding light on the evolution of permeability and porosity.
Samples were loaded into an Al2O3 ceramic crucible and mounted on the TOMCAT rotation stage. The laser heating system (Fife et al., 2012) was used to heat the samples at 15°C/min to a fixed dwell temperature. The isothermal dwell was varied systematically (550–1200°C depending on sample) to constrain the process dynamics. During the testing phase, the continuous rotation provided the capability to move between temperatures without the need for a cooling step. The complex experimental charges used for this kind of experiment can be challenging to produce, and their behavior can be influenced by their initial heterogeneous microstructure and the cooling paths they have experienced. The ability to image the behavior of the same sample while changing temperature or deformation can therefore be extremely useful for cross-correlation of behavior between initial microstructures or between multiple samples under the same conditions. The evolving microstructure strongly influences the behavior at any time step, so the rate of change observed in the structural evolution can vary. Where progression occurs at a rate different to that predicted, the GigaFRoST allows for additional acquisition periods at different tomography acquisition frequencies without the need to stop rotation or quench the sample. In the example illustrated here, images were collected during heating, regularly through the isothermal dwell at 900°C, and during the sample cooling. 1000 projections were acquired per 3D data set, with an exposure time of 2 ms and a total scan acquisition time of 2 s. A 3D scan was started every 60 s throughout the experiment (Table 2). The reconstructed data have a voxel edge length of 3.7 μm. Although we acquired successive tomographies at low frequency (1/min), we obtain the individual tomographies with short exposures as scan times larger than a few seconds introduce significant motion blur into some regions of the reconstructed image.
In this foam collapse scenario, we use a natural obsidian sample (Newberry volcano) that had been foamed in the lab (ex situ), and exploit the TOMCAT endstation to capture the bubble-bubble interactions during a second phase of heating. In the ex situ experiments, this heating schedule causes significant collapse of the already degassed foam. The data from the foam collapse experiment (Figure 8, left), shows small sections of the reconstructed 2D slices at different time points (t = 1 min to t = 80 min shown) through the 4D data set and allows us to trace the geometric evolution of a particular bubble assemblage. The entire sample is contracting heterogeneously, but generally radially inwards in the images shown (the figure shows the central region of a slice perpendicular to the rotation axis, from the central region of the sample). The data, as illustrated by these typical 2D time slices and the 3D rendered pairs of bubbles (Figure 8, right), show that, despite the onset of collapse, we see no coalescence, even where high curvature bubble-bubble contacts are undergoing deformation. Such textures have previously been suggested as indicative of nascent coalescence. Yet, while we see significant but incomplete collapse over the 145 min heating schedule, we see no coalescence where these complex bubble interactions are observed.
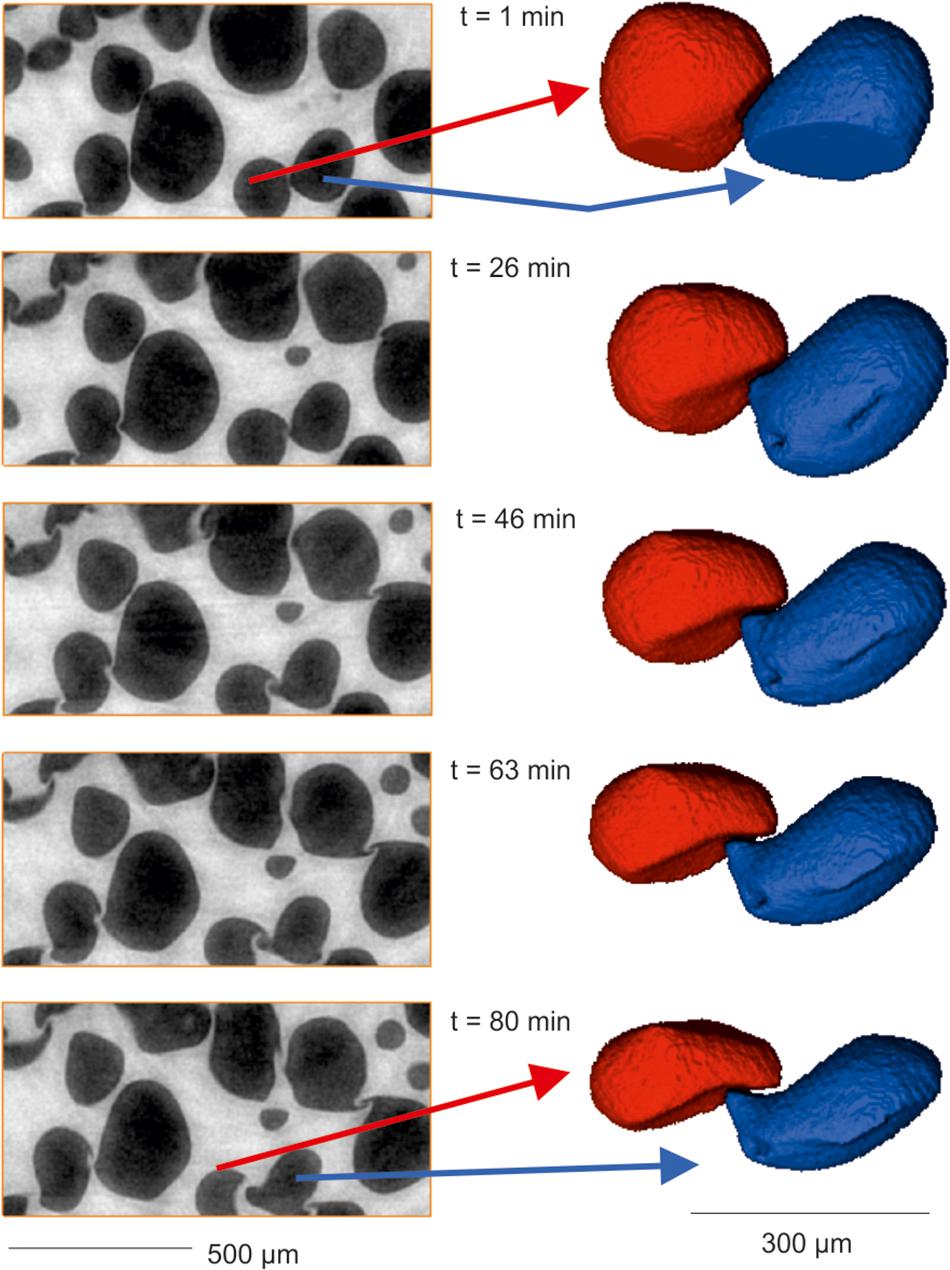
Figure 8. Tracking bubble interactions during foam collapse. The panels on the left show a 2D axial slice through a sub-volume of the 4D data set at five time points during the experiment. The 3D renderings on the right show the changing interaction and complex “handshake” between two typical bubbles. Note the comparable near symmetric deformation of both bubbles around the interface. Most bubbles in the sample show some degree of dimpling at multiple bubble-bubbler interfaces, although some do have truly planar films. No thinning of the dimpled films is seen during this experiment, and no coalescence is observed despite the volume reduction in the foam.
Quantification of Flow in Bubbly Magmatic Fluids
Moving beyond simple static systems, the TOMCAT endstation and laser furnace system have also been integrated with a rheological testing apparatus (XRheo, see Dobson et al., submitted) to investigate the response of magmas to deformation. In the more challenging torsional experiments, the bubbly melt undergoes deformation in a miniaturized wide gap concentric cylinder rheometer (Figure 9, upper left). The beamline rotation stage is used to control the cup, with the XRheo providing the differential load for deformation. Given the high speed of individual coalescence events in these samples (simulating a fully degassed basaltic magma with an initial porosity of ∼40%), there remains some motion blur, even when working with short tomography acquisition times of 0.25 s. Speeds of 0.25 s per tomogram were achievable, but the slight reduction in motion blur was outweighed by the increase in detrimental image noise from shorter exposure times or fewer projections (see Dobson et al., submitted for details). Using an acquisition protocol with 1000 projections per scan at a speed of 1 tps (1 ms exposure time) with a 3.7 μm voxel size, the quality of the data is sufficient to perform a qualitative assessment of the bubble motion, and detailed quantitative analysis using the latest Digital Volume Correlation (DVC) techniques (3Dmagination and Avizo, Thermo Fisher) to define the accommodation of displacement and strain across the sample volume (Figure 9). The 2D images from three consecutive time steps at the same slice position (Figure 9, top right) clearly show the motion and deformation of the bubbles (with minimal motion blur), and the quantitative DVC analysis for the same time points (Figure 9, bottom) shows the 3-dimensional distribution and heterogeneity of the displacement vector field.
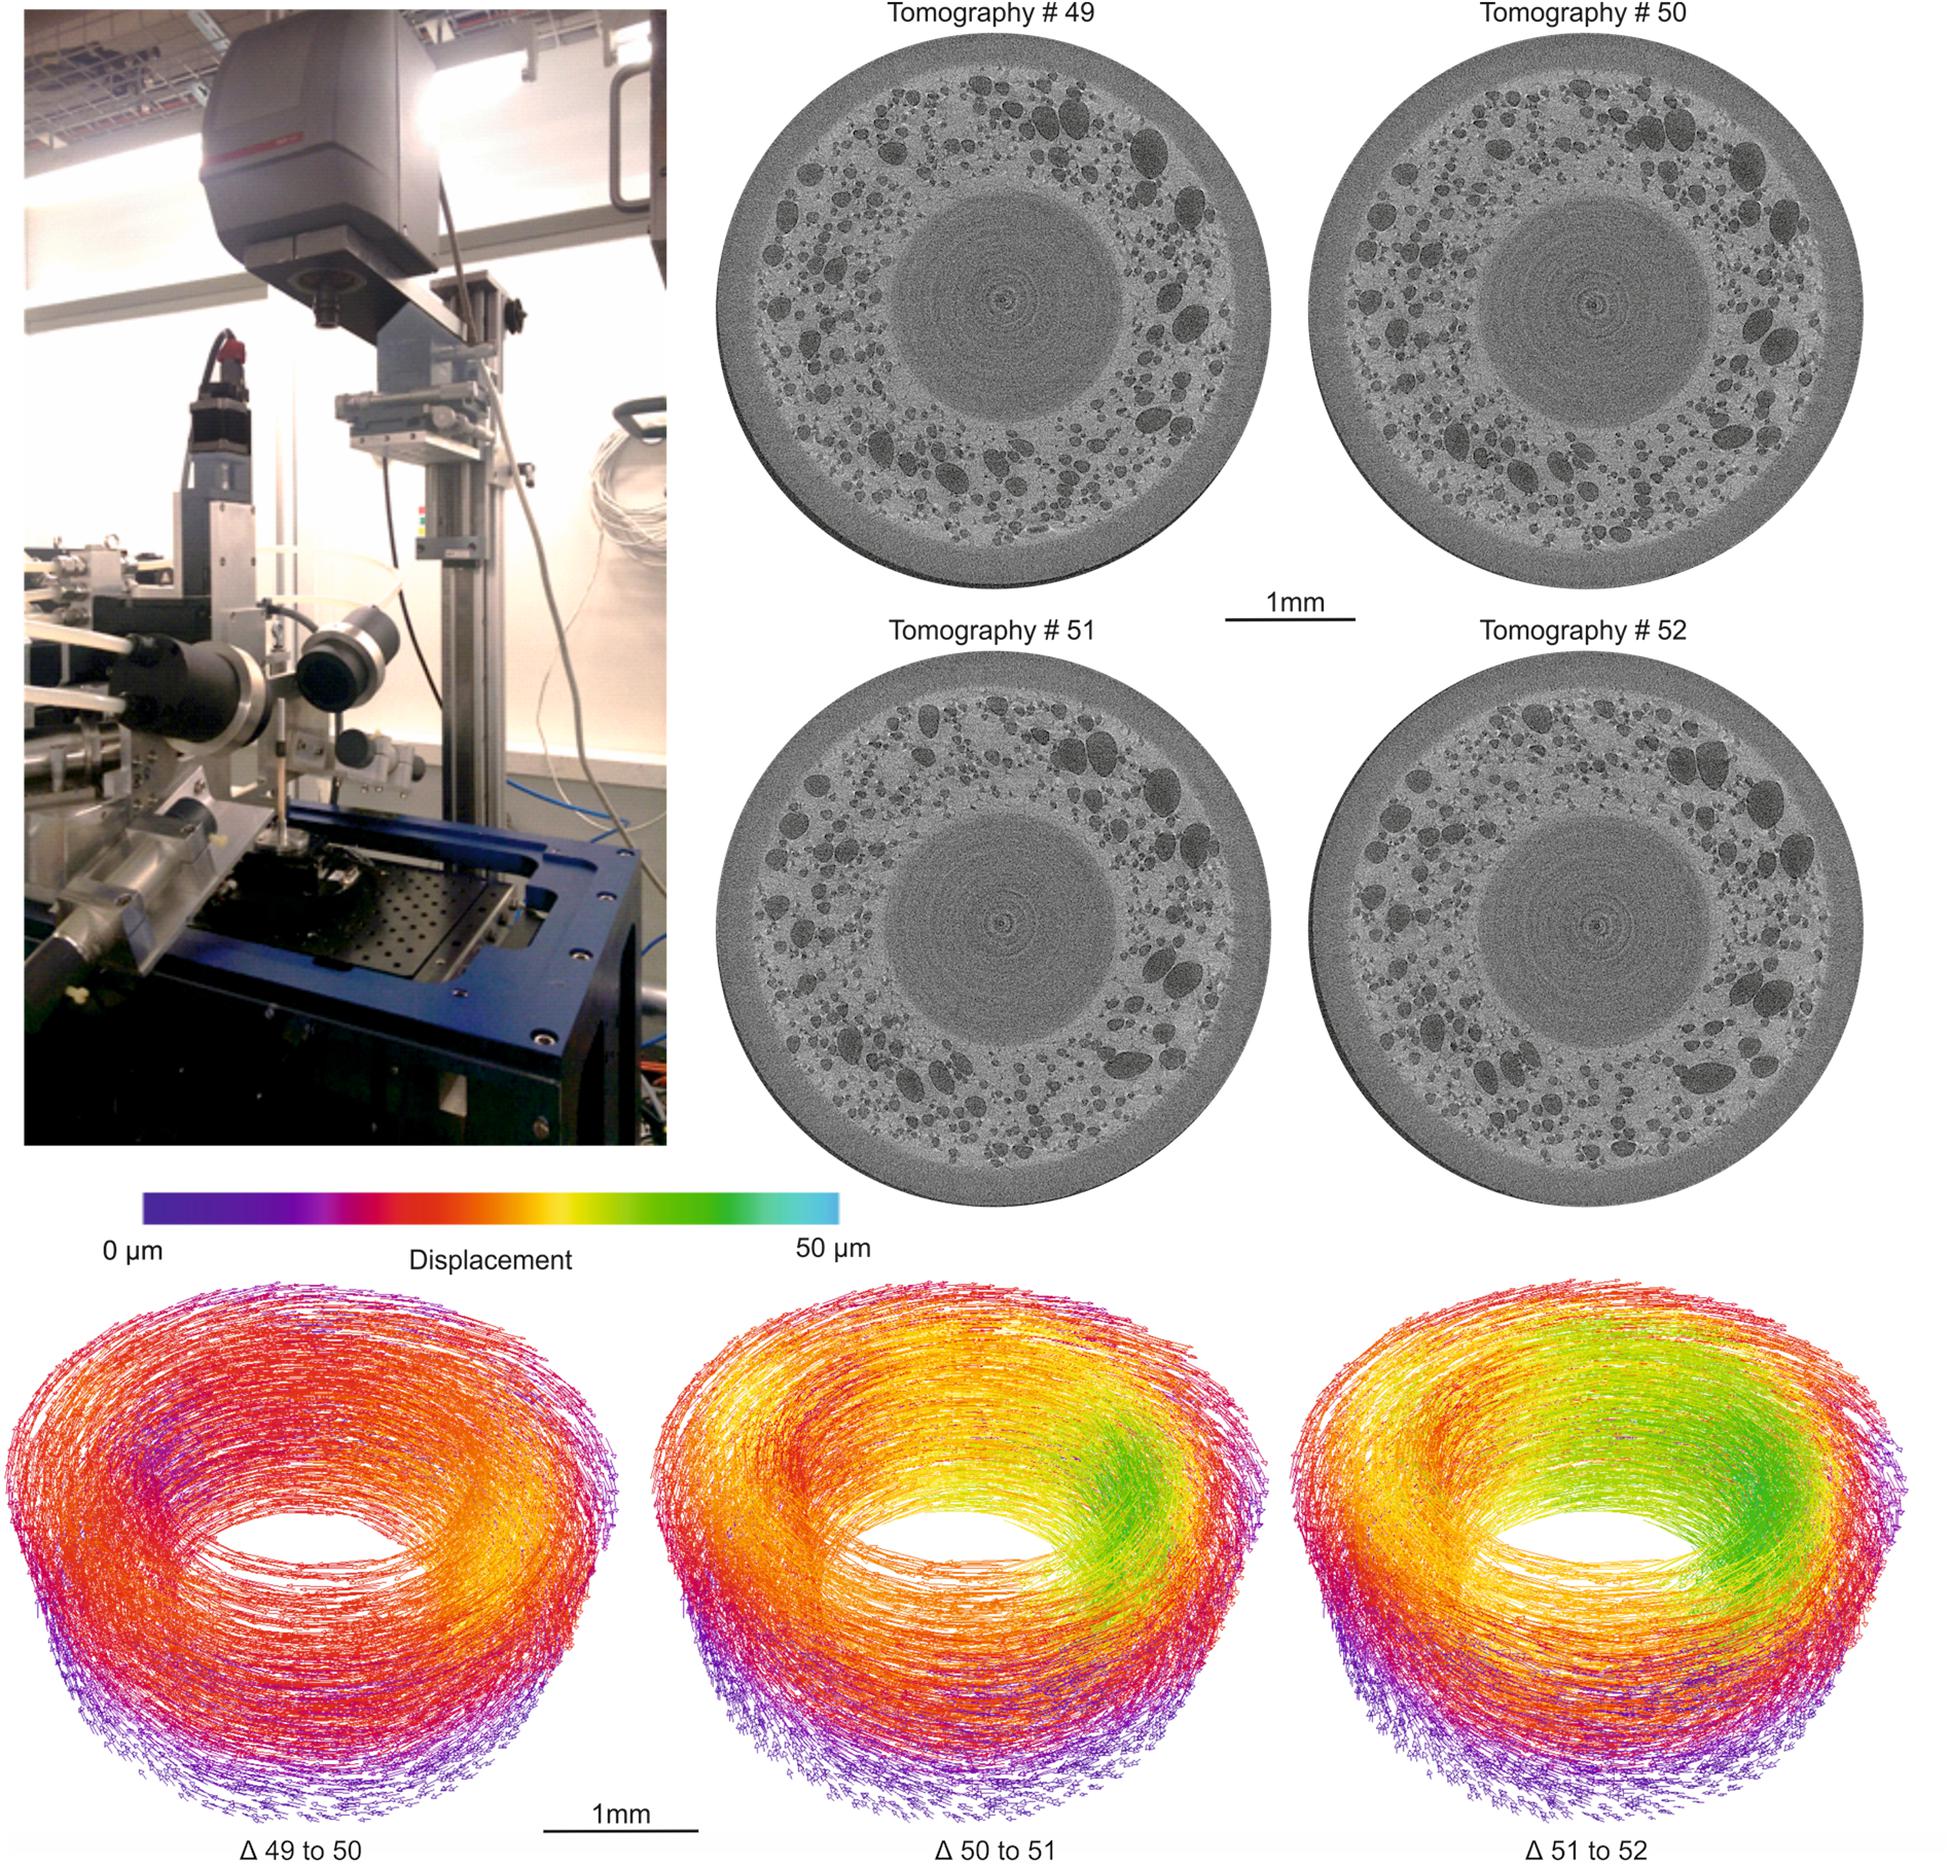
Figure 9. Capturing deformation during rotational deformation. (TOP LEFT) Photograph showing the XRheo and the SLS laser system installed at TOMCAT (See Dobson et al., submitted for further details). (TOP RIGHT) Mid-section axial slices from four time steps through the measured volume (each image is 7 s apart). The cup and spindle are the mid gray cylindrical regions bounding the bubble-bearing melt (pale gray). Highly heterogeneous motion of bubbles (black) can be seen between all four images (especially in the bottom right quadrant). Data quality is sufficient to allow these displacements to be quantified using Digital Volume Correlation (BOTTOM), with the displacement vectors of the mesh centers shown colored by displacement magnitude.
Discussion and Outlook
XTM is an established analysis technique in different fields of the Earth Sciences and an increasing number of institutes in these fields are nowadays equipped with their own tomographic scanners (or even entire X-ray tomography facilities) for the on-site investigation of static samples. Synchrotron radiation, with its coherence and high flux, is instead required for studying fast dynamic processes as they happen in 3D. Hardware and software developments (Table 1) over the past decade have pushed the time resolution for tomographic microscopy investigations at large scale facilities well into the sub-second regime, opening up a wealth of new possibilities for addressing scientific questions outside reach until recently.
Since the advent on the market of the first high-quality, high-frame-rate detectors (Mokso et al., 2010), the TOMCAT beamline has been at the forefront of the time-resolved tomographic microscopy activities. In addition to its highly flexible design, able to accommodate the most diverse applications, a few key unique hardware devices made new groundbreaking experiments (Walker et al., 2014; García-Moreno et al., 2019) at the TOMCAT fast tomography endstation possible. The high field bending magnet source and the relatively short beamline (samples typically located at 25 m from the source of the radiation) lead to a large (∼20 × 5 mm2) but at the same time intense beam, even though the used FOV is typically more around 5 × 5 mm2. These beam sizes are not always available at other imaging beamlines based on undulator sources, unless the endstation is far away from the source outside the main building or a beam expander is used. The recently procured custom-made high-efficiency 4× optical component coupled to the in-house developed GigaFRoST detector is essential to best exploit the available photon flux and push time-resolved imaging to the 20 Hz regime and beyond. The flexible hardware integration makes planning and designing a variety of different experiments with the most diverse requirements possible, while efficient data handling and reconstruction tools provide rapid access to post-processed data, facilitating and speeding up decisions affecting the on-ongoing experiment, a feature strongly appreciated by the scientific user community.
The study of the most diverse transient geological processes across different Earth Sciences disciplines has strongly benefited from these new capabilities. In particular the high spatial and temporal resolutions coupled to the potential for long duration experiments have proved essential for the investigation of highly dynamic systems where critical developments occur over several minutes, as it is often the case. Compromises on the experimental design (e.g., a higher number of projections or scans to the detriment of a smaller FOV) and on the portion of the processes to be investigated are no longer necessary. These new opportunities have also strongly contributed to pushing fields beyond the 2D approach and support with experimental evidence the behavior of phenomena in 3D at unprecedented spatio-temporal resolution. This newly unlocked knowledge will be invaluable for the validation and advancement of theoretical and numerical models in different Earth Sciences communities, key tools for addressing several environmental, industrial and medical applications.
Although 20 Hz tomographic experiments with a few micron spatial resolution are routine at TOMCAT (Maire et al., 2016), investigations of sub-second dynamic processes with a higher-spatial resolution are still borderline due to insufficient photon flux leading to unsatisfactory data quality. A high-quality, high-efficiency microscope lens as the one described in Section “Optics,” but with a higher magnification (e.g., 10×) would directly lead to an increase of time resolution by a few times. The in-line arrangement (Mokso et al., 2013) of two different efficient optics coupled to two GigaFRoST detectors, actually available in-house, would also make time-resolved multi-resolution studies a reality. This arrangement would enable the simultaneous acquisition of overview and zoomed-in scans of exactly the same sample and process, providing important simultaneous 3D information on the relationship between microstructural details and the overall structure or permitting the observation of processes at two different length scales. The immediate benefits for studies of pore scale flow processes in heterogeneous multiscale porous media are obvious for a wide range of geological settings, including volcanology, where the behavior of thin bubble films (elucidating the processes of bubble nucleation and coalescence) could be captured alongside the larger scale bubble evolution. Similarly, in rock deformation experiments, both grain scale and continuum behaviors in the same sample could be captured simultaneously under identical conditions.
With a 2.4 GeV ring and a 2.9 T bending magnet, the high energy photons available at TOMCAT are limited (Figure 1). For energies above 40 keV the flux is strongly reduced and at 80 keV it approaches 0. Although the beam on sample could be wider than 22 mm, the low number of high energy photons restrains the maximum sample size for typical geological materials like rocks to 5–7 mm, at times not satisfactory for in situ experiments, both because small cells could be difficult to realize and the observed processes could be dominated by boundary effects.
The SLS is planning an upgrade to a diffraction-limited storage ring for 2023–2024 (Streun et al., 2018). For the current TOMCAT fast tomography endstation, the proposed upgrade opens the doors to experiments with larger samples since the flux at higher energies should significantly increase by placing a bending magnet with a stronger magnetic field in the new ring. Furthermore, the portfolio of imaging options of the new ring (still under discussion) could potentially offer new opportunities as, for instance, sub-second tomographic imaging capabilities in the sub-micron regime if a new tomography endstation could be located at an undulator beamline. Additional envisaged hardware upgrades include a new modular sample manipulator and a faster high-frame rate detector.
Despite the efficient tools developed for handling, reconstructing and post-processing the large amount of data produced during time-resolved experiments, a margin for improvement still exists. While new technological solutions (e.g., more powerful computational hardware and larger bandwidths) will naturally ease the work with TBs of experimental data, we believe that with smarter acquisition strategies and new software solutions as those provided by the emerging deep learning field, a higher image quality, temporal and spatial resolution will be within reach with actually less data.
Currently, in time-resolved experiments, the data acquisition is often performed essentially blindly, resulting in large amounts of data without any information of interest. Not only is this large amount of useless data produced, transferred, stored and reconstructed in the first place, but these multiple TB of data need to be interrogated, either manually or semi-automatically, to identify its small useful portion, before any actual analysis can start. The synchronization possibilities offered at TOMCAT (see Sections “Rotation Stage” and “Data Acquisition”) at least partially mitigate this data deluge. The 3D preview currently under development (Buurlage et al., 2019) opens up new opportunities for an active experimental feedback and should enable smarter experiment control, thereby significantly reducing the amount of acquired data while maximizing its information content.
Until now, it has mostly been possible to tomographically reconstruct the acquired data using standard approaches based on analytical solutions (Marone et al., 2017), even for under-sampled and noisy datasets typical for investigations with a high temporal resolution. Yet, iterative reconstruction techniques incorporating a priori knowledge about the sample’s microstructure or time-evolution (Van Eyndhoven et al., 2015) and deep learning methods for image denoising and post-processing (e.g., segmentation) (Pelt et al., 2018) have the potential to further decrease the size of the raw datasets (by reducing the number of projections required to achieve a given data quality) or to increase the quality of tomographic volumes (for a given number of projections or scan time), thus improving and enabling automation of post-processing segmentation and quantification workflows. The current lack of reliable automatic data post-processing procedures still hinders the development of more streamlined large data quantification pipelines. Improvements to the data quality are expected to increase the level of automation for interrogating big data. This should lead to a net decrease of the delay between experiments and publication of the results, which can currently amount to several years.
Data Availability Statement
The raw data supporting the conclusions of this article will be made available by the authors, without undue reservation, to any qualified researcher.
Author Contributions
FM, CS, and MS were involved over the years in the development of the different aspects of the TOMCAT fast tomography endstation. JJ-M, MG, and FM performed the experiments for Section “Solute Transport Through Porous Media.” AV-P, MG, and JJ-M performed the 3D image analysis. SM and FF developed and provided the deformation rig for Section “Evaporite Deformation.” SM, FF, and CS performed the experiments. SM and FF post-processed the data. KD developed the XRheo rheology setup for Section “Magmatic Processes.” KD and FM (see Dobson et al., submitted) carried out the experiments. KD post-processed and analyzed the data. All authors contributed in drafting and revising the manuscript.
Funding
SM and FF acknowledge funding from the Swiss National Science Foundation (SNF) (early postdoc Mobility grant Nr. 178615). Financial support is gratefully acknowledged from the Swiss National Science Foundation (SNF, grant Nr. 200021_178986) and from the Swiss Light Source, PSI (TOMCAT beamtime Nr. 20170607) for AV-P, MG, and JJ-M. KD was supported by NERC NE/M018687/1, and European Research Council Advanced Grant (EVOKES-247076).
Conflict of Interest
The authors declare that the research was conducted in the absence of any commercial or financial relationships that could be construed as a potential conflict of interest.
Acknowledgments
AV-P, MG, and JJ-M acknowledge Dr. Rolf Kaufmann, Dr. Selina Kolokhyta, Mahdieh Shakoorioskooie, and Bekmurza Beisenov (Empa) for their help during the experiments. They also acknowledge the usage of the Empa Platform for Image Analysis (https://www.empa.ch/web/s499/software-/-imaging-platform) at Empa’s Center for X-ray Analytics and of the Ra computer cluster at PSI (funded by the Data Analysis As Service, DaaS, project Nr. 142-004 of the swissuniversities SUC P-02 program) for part of the software and hardware resources used for the performed 3D image analysis. KD acknowledges the XRheo team for help during beamtime. We acknowledge the Paul Scherrer Institut, Villigen, Switzerland for provision of synchrotron radiation beamtime at the TOMCAT beamline X02DA of the SLS, and all the researchers and technical staff who assisted with the many beam time experiments that have contributed to this manuscript.
Footnotes
References
Armstrong, R. T., Ott, H., Georgiadis, A., Rücker, M., Schwing, A., and Berg, S. (2014). Subsecond pore-scale displacement processes and relaxation dynamics in multiphase flow. Water Resour. Res. 50, 9162–9176. doi: 10.1002/2014wr015858
Baker, D. R., Brun, F., O’Shaughnessy, C., Mancini, L., Fife, J. L., and Rivers, M. (2012). A four-dimensional X-ray tomographic microscopy study of bubble growth in basaltic foam. Nat. Commun. 3:1135. doi: 10.1038/ncomms2134
Barbier, E. (2002). Geothermal energy technology and current status: an overview. Renew. Sustain. Energy Rev. 6, 3–65. doi: 10.1016/S1364-0321(02)00002-3
Bedford, J., Fusseis, F., Leclère, H., Wheeler, J., and Faulkner, D. (2017). A 4D view on the evolution of metamorphic dehydration reactions. Sci. Rep. 7:6881. doi: 10.1038/s41598-017-07160-7165
Berg, M. T. L., Bromiley, G. D., Le Godec, Y., Philippe, J., Mezouar, M., Perrillat, J. P., et al. (2018). Rapid core formation in terrestrial planets by percolative flow: in-situ imaging of metallic melt migration under high pressure/temperature conditions. Front. Earth Sci. 6:77. doi: 10.3389/feart.2018.00077
Blunt, M. J., Bijeljic, B., Dong, H., Gharbi, O., Iglauer, S., Mostaghimi, P., et al. (2013). Pore-scale imaging and modelling. Adv. Water Resour. 51, 197–216. doi: 10.1016/j.advwatres.2012.03.003
Bührer, M., Stampanoni, M., Rochet, X., Büchi, F., Eller, J., and Marone, F. (2019). High-numerical-aperture macroscope optics for time-resolved experiments. J. Sync. Radiat. 26, 1161–1172. doi: 10.1107/S1600577519004119
Bultreys, T., Boone, M. A., Boone, M. N., De Schryver, T., Masschaele, B., Van Hoorebeke, L., et al. (2016). Fast laboratory-based micro-computed tomography for pore-scale research: illustrative experiments and perspectives on the future. Adv. Water Resour. 95, 341–351. doi: 10.1016/j.advwatres.2015.05.012
Butler, I. B., Flynn, M., Fusseis, F., and Cartwright-Taylor, A. (2017). “Mjölnir: a novel x-ray transparent triaxial rock deformation apparatus,” in Proceedings of the 3rd International Conference on Tomography and Materials and Structures, Lund.
Buurlage, J.-W., Marone, F., Pelt, D. M., Palestijn, W. J., Stampanoni, M., Batenburg, K. J., et al. (2019). Real-time reconstruction and visualization towards dynamic feedback control during time-resolved tomography experiments at TOMCAT. Sci. Rep. 9:18379. doi: 10.1038/s41598-019-54647-4
Chiogna, G., Hochstetler, D. L., Bellin, A., Kitanidis, P. K., and Rolle, M. (2012). Mixing, entropy and reactive solute transport. Geophys. Res. Lett. 39:GL053295. doi: 10.1029/2012GL053295
Cnudde, V., and Boone, M. N. (2013). High-resolution X-ray computed tomography in geosciences: a review of the current technology and applications. Earth Sci. Rev. 123, 1–17. doi: 10.1016/j.earscirev.2013.04.003
Cunningham, J. A., Rahman, I. A., Lautenschlager, S., Rayfield, E. J., and Donoghue, P. C. J. (2014). A virtual world of paleontology. Trends Ecol. Evol. 29, 347–357. doi: 10.1016/j.tree.2014.04.004
de Anna, P., Jimenez-Martinez, J., Tabuteau, H., Turuban, R., Le Borgne, T., Derrien, M., et al. (2014). Mixing and reaction kinetics in porous media: an experimental pore scale quantification. Environ. Sci. Technol. 48, 508–516. doi: 10.1021/es403105b
de Barros, F. P. J., Dentz, M., Koch, J., and Nowak, W. (2012). Flow topology and scalar mixing in spatially heterogeneous flow fields. Geophys. Res. Lett. 39:L08404. doi: 10.1029/2012GL051302
De Carlo, F., Gursoy, D., Marone, F., Rivers, M., Parkinson, D. Y., Khan, F., et al. (2014). Scientific data exchange: a schema for HDF5-based storage of raw and analyzed data. J. Sync. Radiat. 21, 1224–1230. doi: 10.1107/S160057751401604X
De Simoni, M., Carrera, J., Sánchez-Vila, X., and Guadagnini, A. (2005). A procedure for the solution of multicomponent reactive transport problems. Water Resour. Res. 41:W11410. doi: 10.1029/2005WR004056
De Simoni, M., Sanchez-Vila, X., Carrera, J., and Saaltink, M. W. (2007). A mixing ratios-based formulation for multicomponent reactive transport. Water Resour. Res. 43:W07419. doi: 10.1029/2006WR005256
Dentz, M., Le Borgne, T., Englert, A., and Bijeljic, B. (2011). Mixing, spreading and reaction in heterogeneous media: a brief review. J. Contam. Hydrol. 12, 1–17. doi: 10.1016/j.jconhyd.2010.05.002
Derome, D., Griffa, M., Koebel, M., and Carmeliet, J. (2011). Hysteretic swelling of wood at cellular scale probed by phase-contrast X-ray tomography. J. Struct. Biol. 173, 180–190. doi: 10.1016/j.jsb.2010.08.011
Di Michiel, M., Merino, J. M., Fernandez-Carreiras, D., Buslaps, T., Honkimaki, V., Falus, P., et al. (2005). Fast microtomography using high energy synchrotron radiation. Rev. Sci. Instru. 76:043702. doi: 10.1063/1.1884194
Dobson, K. J., Coban, S. B., McDonald, S. A., Walsh, J. N., Atwood, R. C., and Withers, P. J. (2016). 4-D imaging of sub-second dynamics in pore-scale processes using real-time synchrotron X-ray tomography. Solid Earth 7, 1059–1073. doi: 10.5194/se-7-1059-2016
dos Santos Rolo, T., Ershov, A., van de Kamp, T., and Baumbach, T. (2014). In vivo X-ray cine-tomography for tracking morphological dynamics. Proc. Natl. Acad. Sci. U.S.A. 111:3921. doi: 10.1073/pnas.1308650111
Ebner, M., Marone, F., Stampanoni, M., and Wood, V. (2013). Visualization and quantification of electrochemical and mechanical degradation in Li ion batteries. Science 342:716. doi: 10.1126/science.1241882
Eller, J., Marone, F., and Büchi, F. N. (2015). Operando sub-second tomographic imaging of water in PEFC gas diffusion layers. ECS Trans. 69, 523–531. doi: 10.1149/06917.0523ecst
Fife, J. L., Rappaz, M., Pistone, M., Celcer, T., Mikuljan, G., and Stampanoni, M. (2012). Development of a laser-based heating system for in situ synchrotron-based x-ray tomographic microscopy. J. Sync. Radiat. 19, 352–358. doi: 10.1107/S0909049512003287
Flühler, H., Durner, W., and Flury, M. (1996). Lateral solute mixing processes - A key for understanding field-scale transport of water and solutes. Geoderma 70, 165–183. doi: 10.1016/0016-7061(95)00079-78
Friis, E. M., Crane, P. R., Raunsgaard Pedersen, K., Stampanoni, M., and Marone, F. (2015). Exceptional preservation of tiny embryos documents seed dormancy in early angiosperms. Nature 528:551. doi: 10.1038/nature16441
Fusseis, F., Schrank, C., Liu, J., Karrech, A., Llana-Fúnez, S., Xiao, X., et al. (2012). Pore formation during dehydration of a polycrystalline gypsum sample observed and quantified in a time-series synchrotron X-ray micro-tomography experiment. Solid Earth 3, 71–86. doi: 10.5194/se-3-71-2012
García-Moreno, F., Kamm, P. H., Neu, T. R., and Banhart, J. (2018). Time-resolved in situ tomography for the analysis of evolving metal-foam granulates. J. Sync. Radiat. 25, 1505–1508. doi: 10.1107/S1600577518008949
García-Moreno, F., Kamm, P. H., Neu, T. R., Bülk, F., Mokso, R., Schlepütz, C. M., et al. (2019). Using X-ray tomoscopy to explore the dynamics of foaming metal. Nat. Commun. 10:3762. doi: 10.1038/s41467-019-11521-11521
Ghanbarian, B., Hunt, A. G., Ewing, R. P., and Sahimi, M. (2013). Tortuosity in porous media: a critical review. Soil Sci. Soc. Am. J. 77, 1461–1477. doi: 10.2136/sssaj2012.0435
Glatz, G., Lapene, A., Castanier, L. M., and Kovscek, A. R. (2018). An experimental platform for triaxial high-pressure/high-temperature testing of rocks using computed tomography. Rev. Sci. Instrum. 89:045101. doi: 10.1063/1.5030204
Hanna, R. D., and Ketcham, R. A. (2017). X-ray computed tomography of planetary materials: a primer and review of recent studies. Geochemistry 77, 547–572. doi: 10.1016/j.chemer.2017.01.006
Jiménez-Martínez, J., Anna, P. D., Tabuteau, H., Turuban, R., Borgne, T. L., and Méheust, Y. (2015). Pore-scale mechanisms for the enhancement of mixing in unsaturated porous media and implications for chemical reactions. Geophys. Res. Lett. 42, 5316–5324. doi: 10.1002/2015GL064513
Jiménez-Martínez, J., Porter, M. L., Hyman, J. D., Carey, J. W., and Viswanathan, H. S. (2016). Mixing in a three-phase system: enhanced production of oil-wet reservoirs by CO2 injection. Geophys. Res. Lett. 43, 196–205. doi: 10.1002/2015GL066787
Jordan, P. (1992). Evidence for large-scale decoupling in the Triassic evaporites of Northern Switzerland: an overview. Ecl. Geol. Helvetiae 85, 677–693. doi: 10.5169/seals-167025
Kitanidis, P. K. (1994). The concept of the dilution index. Water Resour. Res. 30, 2011–2026. doi: 10.1029/94WR00762
Lester, D. R., Dentz, M., and Le Borgne, T. (2016). Chaotic mixing in three-dimensional porous media. J. Fluid Mech. 803, 144–174. doi: 10.1017/jfm.2016.486
Lester, D. R., Metcalfe, G., and Trefry, M. G. (2013). Is chaotic advection inherent to porous media flow? Phys. Rev. Lett. 111:174101. doi: 10.1103/PhysRevLett.111.174101
Lindgren, J., Sjövall, P., Thiel, V., Zheng, W., Ito, S., Wakamatsu, K., et al. (2018). Soft-tissue evidence for homeothermy and crypsis in a Jurassic ichthyosaur. Nature 564, 359–365. doi: 10.1038/s41586-018-0775-x
Lovric, G., Mokso, R., Arcadu, F., Vogiatzis Oikonomidis, I., Schittny, J. C., Roth-Kleiner, M., et al. (2017). Tomographic in vivo microscopy for the study of lung physiology at the alveolar level. Sci. Rep. 7:12545. doi: 10.1038/s41598-017-12886-12883
Lovric, G., Mokso, R., Schlepütz, C. M., and Stampanoni, M. (2016). A multi-purpose imaging endstation for high-resolution micrometer-scaled sub-second tomography. Phys. Med. 32, 1771–1778. doi: 10.1016/j.ejmp.2016.08.012
Maire, E., Le Bourlot, C., Adrien, J., Mortensen, A., and Mokso, R. (2016). 20 Hz X-ray tomography during an in situ tensile test. Int. J. Fract. 200, 3–12. doi: 10.1007/s10704-016-0077-y
Marone, F., Studer, A., Billich, H., Sala, L., and Stampanoni, M. (2017). Towards on-the-fly data post-processing for real-time tomographic imaging at TOMCAT. Adv. Struct. Chem. Imaging 3:1. doi: 10.1186/s40679-016-0035-39
Maus, S., Müller, S., Büttner, J., Brütsch, S., Huthwelker, T., Schwikowski, M., et al. (2011). Ion fractionation in young sea ice from Kongsfjorden, Svalbard. Ann. Glaciol. 52, 301–310. doi: 10.3189/172756411795931804
Mokso, R., Marone, F., Irvine, S., Nyvlt, M., Schwyn, D., Mader, K., et al. (2013). Advantages of phase retrieval for fast x-ray tomographic microscopy. J. Phys. D Appl. Phys. 46:494004. doi: 10.1088/0022-3727/46/49/494004
Mokso, R., Marone, F., and Stampanoni, M. (2010). Real Time Tomography at the Swiss Light Source. AIP Conf. Proc. 1234, 87–90.
Mokso, R., Schlepütz, C. M., Theidel, G., Billich, H., Schmid, E., Celcer, T., et al. (2017). GigaFRoST: the gigabit fast readout system for tomography. J. Sync. Radiat. 24, 1250–1259. doi: 10.1107/S1600577517013522
Moretti, R., Arienzo, I., Di Renzo, V., Orsi, G., Arzilli, F., Brun, F., et al. (2019). Volatile segregation and generation of highly vesiculated explosive magmas by volatile-melt fining processes: the case of the Campanian Ignimbrite eruption. Chem. Geol. 503, 1–14. doi: 10.1016/j.chemgeo.2018.10.001
Munawar, M. J., Lin, C., Cnudde, V., Bultreys, T., Dong, C., Zhang, X., et al. (2018). Petrographic characterization to build an accurate rock model using micro-CT: case study on low-permeable to tight turbidite sandstone from Eocene Shahejie formation. Micron 109, 22–33. doi: 10.1016/j.micron.2018.02.010
Ottino, J. M. (1989). The Kinematics of Mixing: Stretching, Chaos, and Transport. Cambridge: Cambridge University Press.
Paganin, D., Mayo, S. C., Gureyev, T. E., Miller, P. R., and Wilkins, S. W. (2002). Simultaneous phase and amplitude extraction from a single defocused image of a homogeneous object. J. Microscopy 206, 33–40. doi: 10.1046/j.1365-2818.2002.01010.x
Pelt, D. M., Batenburg, K. J., and Sethian, J. A. (2018). Improving tomographic reconstruction from limited data using mixed-scale dense convolutional neural networks. J. Imaging 4:128. doi: 10.3390/jimaging4110128
Pistone, M., Arzilli, F., Dobson, K. J., Cordonnier, B., Reusser, E., Ulmer, P., et al. (2015a). Gas-driven filter pressing in magmas: insights into in-situ melt segregation from crystal mushes. Geology 43, 699–702. doi: 10.1130/g36766.1
Pistone, M., Caricchi, L., Fife, J. L., Mader, K., and Ulmer, P. (2015b). In situ X-ray tomographic microscopy observations of vesiculation of bubble-free and bubble-bearing magmas. Bull. Volcanol. 77:108. doi: 10.1007/s00445-015-0992-1
Pistone, M., Cordonnier, B., Caricchi, L., Ulmer, P., and Marone, F. (2015c). The viscous to brittle transition in crystal- and bubble-bearing magmas. Front. Earth Sci. 3:71. doi: 10.3389/feart.2015.00071
Pleše, P., Higgins, M. D., Mancini, L., Lanzafame, G., Brun, F., Fife, J. L., et al. (2018). Dynamic observations of vesiculation reveal the role of silicate crystals in bubble nucleation and growth in andesitic magmas. Lithos 29, 532–546. doi: 10.1016/j.lithos.2017.11.024
Renard, F., Cordonnier, B., Dysthe, D. K., Boller, E., Tafforeau, P., and Rack, A. (2016). A deformation rig for synchrotron microtomography studies of geomaterials under conditions down to 10 km depth in the Earth. J. Sync. Radiat. 23, 1030–1034. doi: 10.1107/S1600577516008730
Sahoo, S. K., Madhusudhan, B. N., Marín-Moreno, H., North, L. J., Ahmed, S., Falcon-Suarez, I. H., et al. (2018). Laboratory insights into the effect of sediment-hosted methane hydrate morphology on elastic wave velocity from time-lapse 4-D synchrotron x-ray computed tomography. Geochem. Geophys. Geosyst. 19, 4502–4521. doi: 10.1029/2018gc007710
Saif, T., Lin, Q., Gao, Y., Al-Khulaifi, Y., Marone, F., Hollis, D., et al. (2019). 4D in situ synchrotron X-ray tomographic microscopy and laser-based heating study of oil shale pyrolysis. Appl. Energy 235, 1468–1475. doi: 10.1016/j.apenergy.2018.11.044
Salvo, L., Di Michiel, M., Scheel, M., Lhuissier, P., Mireux, B., and Suéry, M. (2012). Ultra fast in situ x-ray micro-tomography: application to solidification of aluminium alloys. Mater. Sci. Forum 70, 1713–1718. doi: 10.4028/www.scientific.net/msf.706-709.1713
Setiawan, A., Suekane, T., Deguchi, Y., and Kusano, K. (2014). Three-dimensional imaging of pore-scale water flooding phenomena in water-wet and oil-wet porous media. J. Flow Control Measur. Vis. 02, 25–31. doi: 10.4236/jfcmv.2014.22005
Stampanoni, M., Groso, A., Isenegger, A., Mikuljan, G., Chen, Q., Bertrand, A., et al. (2006). “Trends in synchrotron-based tomographic imaging: the SLS experience,” in Developments in X-Ray Tomography V, ed. U. Bonse (Bellingham: Spie-Int Soc Optical Engineering), U199–U212.
Streun, A., Garvey, T., Rivkin, L., Schlott, V., Schmidt, T., Willmott, P., et al. (2018). SLS-2 – the upgrade of the Swiss Light Source. J. Sync. Radiat. 25, 631–641. doi: 10.1107/S1600577518002722
Van Eyndhoven, G., Batenburg, K. J., Kazantsev, D., Van Nieuwenhove, V., Lee, P. D., Dobson, K. J., et al. (2015). An Iterative CT reconstruction algorithm for fast fluid flow imaging. IEEE Trans. Image Proces. 24, 4446–4458. doi: 10.1109/TIP.2015.2466113
Vergés, J., Muñoz, J. A., and Martínez, A. (1992). “South Pyrenean fold and thrust belt: The role of foreland evaporitic levels in thrust geometry,” in Thrust Tectonics, ed. K. R. McClay (Dordrecht: Springer), 255–264. doi: 10.1007/978-94-011-3066-0_23
Voeten, D., Cubo, J., de Margerie, E., Roper, M., Beyrand, V., Bures, S., et al. (2018). Wing bone geometry reveals active flight in archaeopteryx. Nat. Commun. 9:923. doi: 10.1038/s41467-018-03296-3298
Voltolini, M., Barnard, H., Creux, P., and Ajo-Franklin, J. (2019). A new mini-triaxial cell for combined high-pressure and high-temperature in situ synchrotron X-ray microtomography experiments up to 400°C and 24 MPa. J. Synch. Radiat. 26, 238–243. doi: 10.1107/S1600577518015606
Wadsworth, F. B., Vasseur, J., Llewellin, E. W., Dobson, K. J., Colombier, M., von Aulock, F. W., et al. (2017). Topological inversions in coalescing granular media control fluid-flow regimes. Phys. Rev. 96:033113. doi: 10.1103/PhysRevE.96.033113
Wadsworth, F. B., Vasseur, J., Schauroth, J., Llewellin, E. W., Dobson, K. J., Havard, T., et al. (2019). A general model for welding of ash particles in volcanic systems validated using in situ X-ray tomography. Earth Planet. Sci. Lett. 525:115726. doi: 10.1016/j.epsl.2019.115726
Walker, S. M., Schwyn, D. A., Mokso, R., Wicklein, M., Müller, T., Doube, M., et al. (2014). In Vivo Time-Resolved Microtomography Reveals the Mechanics of the Blowfly Flight Motor. PLoS Biol. 12:e1001823. doi: 10.1371/journal.pbio.1001823
Williams, K. H., Kemna, A., Wilkins, M. J., Druhan, J., Arntzen, E., N’Guessan, A. L., et al. (2009). Geophysical monitoring of coupled microbial and geochemical processes during stimulated subsurface bioremediation. Environ. Sci. Technol. 43, 6717–6723. doi: 10.1021/es900855j
Willmann, M., Carrera, J., Sanchez-Vila, X., Silva, O., and Dentz, M. (2010). Coupling of mass transfer and reactive transport for nonlinear reactions in heterogeneous media. Water Resour. Res. 46:W07512. doi: 10.1029/2009WR007739
Winograd, I. J. (1981). Radioactive waste disposal in thick unsaturated zones. Science 212, 1457–1464. doi: 10.1126/science.212.4502.1457
Xu, L., Chen, R., Du, G., Yang, Y., Wang, F., Deng, B., et al. (2016). Anisotropic shrinkage of insect air sacs revealed in vivo by X-ray microtomography. Sci. Rep. 6:32380. doi: 10.1038/srep32380
Yashiro, W., Kamezawa, C., Noda, D., and Kajiwara, K. (2018). Millisecond-order X-ray phase tomography with a fringe-scanning method. Appl. Phys. Express 11:122501. doi: 10.7567/apex.11.122501
Keywords: synchrotron radiation, tomographic microscopy, time-resolved, in situ, high-temperature, high-pressure, fluid flow, volcanology
Citation: Marone F, Schlepütz CM, Marti S, Fusseis F, Velásquez-Parra A, Griffa M, Jiménez-Martínez J, Dobson KJ and Stampanoni M (2020) Time Resolved in situ X-Ray Tomographic Microscopy Unraveling Dynamic Processes in Geologic Systems. Front. Earth Sci. 7:346. doi: 10.3389/feart.2019.00346
Received: 09 September 2019; Accepted: 12 December 2019;
Published: 14 January 2020.
Edited by:
Marco Voltolini, Lawrence Berkeley National Laboratory, United StatesReviewed by:
Fabrizio Bardelli, Institute of Nanotechnology (NANOTEC), ItalyAlexander Rack, European Synchrotron Radiation Facility, France
Copyright © 2020 Marone, Schlepütz, Marti, Fusseis, Velásquez-Parra, Griffa, Jiménez-Martínez, Dobson and Stampanoni. This is an open-access article distributed under the terms of the Creative Commons Attribution License (CC BY). The use, distribution or reproduction in other forums is permitted, provided the original author(s) and the copyright owner(s) are credited and that the original publication in this journal is cited, in accordance with accepted academic practice. No use, distribution or reproduction is permitted which does not comply with these terms.
*Correspondence: Marco Stampanoni, c3RhbXBhbm9uaUBiaW9tZWQuZWUuZXRoei5jaA==
†These authors have contributed equally to this work