 Gauri Datar
 Geeta Vichare
 Anil Raghav
 Ankush Bhaskar
 A. K. Sinha1
- 1Indian Institute of Geomagnetism, Navi Mumbai, India
- 2Department of Physics, University of Mumbai, Mumbai, India
- 3Heliophysics Science Division, NASA/Goddard Space Flight Center, Greenbelt, MD, United States
- 4University Corporation for Atmospheric Research, Boulder, CO, United States
- 5Equatorial Geophysical Research Laboratory, Indian Institute of Geomagnetism, Tirunelveli, India
Cyclone Ockhi hit Sri Lanka and southern parts of India in Nov–Dec 2017 with a devastating social impact. The present paper reports that the cyclone had a significant effect on the γ-ray flux measured by NaI (Tl) detector. An overall decrease is observed in the γ-ray flux during the passage of cyclone; however, a detailed investigation revealed that different energies show varying results. In the energy range between 250 – 450 keV, a decrease up to ~14% is observed, whereas an increase up to ~45% is observed in the energy range between 600 keV – 2.7 MeV. The energies above 2.7 MeV do not show any change. This is the first-ever observation of the varying effects of the cyclone with the energy bands of the γ-ray spectrum. We found that the increase observed in the energy range of 600 keV – 2.7 MeV is primarily due to the increase in the terrestrial radioactivity (peaks of 222Rn daughters), which is brought over by the rainfall accompanied with the cyclone. The study indicates that the decrease in the lower energy range of the γ-ray flux could be due to the attenuation caused by the increased tropospheric air-mass associated with the cyclone over the observation site. The high energy γ-rays are not affected due to the cyclone.
1. Introduction
From 29 November to 6 December 2017, southern states of India (Kerala and Tamil Nadu) witnessed the tragedy caused by cyclone Ockhi and suffered great losses. Ockhi originated as a low-pressure area over southwest Bay of Bengal and adjoining areas of south Sri Lanka and the equatorial Indian Ocean on 28 November 2017. Favorable environmental conditions on 29 November transformed it into a deep depression. On 30 November, the deep depression in the south of Kanyakumari and west of Sri Lanka intensified and resulted in a very severe cyclonic storm [IMD scale (India Meteorological Department)] or Category 3 hurricane [SSHWS (Saffir-Simpson Hurricane Wind Scale)]. Consequently, the southern parts of India suffered from the cyclone on 30 November and 1 December. On 6 December, Ockhi dissipated near the south coast of Gujarat state (India). It caused heavy rains in the western states of India, viz. Maharashtra and Gujarat. It was the first severe cyclonic storm in almost 40 years in the Indian Ocean region to have traveled more than 2,000 km from the Bay of Bengal to as far as the Gujarat coast (PTI, 2018) (Figure 1). It intensified from deep depression into a cyclonic storm within 6 h. Thus, Ockhi was a rare cyclone characterized with rapid intensification in its genesis stage. Ockhi left behind a trail of death and massive destruction in its wake.

Figure 1. Track map of Ockhi cyclone; the red star indicates the location of the observation site, Tirunelveli; the red arrows show the direction of motion. (Modification of the original image from WWLLN).
As a cyclone creates significant perturbations in the atmospheric dynamics, various aspects of cyclones and their effects have been studied by several researchers (Rosenthal, 1970; Dvorak, 1984; Chen et al., 2006; Knight and Davis, 2007; Knutson et al., 2010). The present work aims to study the effects of a cyclone on γ-rays. The γ-rays present in the atmosphere can have a natural or anthropogenic origin. The natural sources of γ-rays can be further classified broadly in two categories depending on their terrestrial or extra-terrestrial origin. Radioactivity due to naturally occurring radionuclides, emissions from lightning, etc., are the sources of γ-rays of terrestrial origin. The energies of the background radioactivity due to standard radionuclides normally fall between 600 keV – 2.7 MeV. When cosmic rays (CR) interact with the atmospheric particles, secondary cosmic rays (SCR) consisting of soft (electromagnetic showers) and hard (hadronic showers) components are produced. γ-ray is one of the major components of SCR, thus CR is an extra-terrestrial source. In the present paper, we will be examining the effects of cyclone on the γ-ray flux measured by NaI (Tl) detector in different energy ranges. This can shed some light on the variations of the γ-ray flux emerging from different sources.
There have been a few reports in the past studying the effect of cyclones on the intensity of cosmic-rays, such as by Nishina et al. (1940b,c) in Japan using Steinke apparatus (which is an ionization chamber). Nishina et al. (1940c) described the results of the study of 11 typical cyclones and 25 anticyclones using the polar diagram representation method. They concluded that the intensity of hard component cosmic rays is increased by the arrival of a cold air mass, while it is decreased by warm air mass. A similar decrease is found during the passage of a warm front, but no effect was observed on the passage of a cold front. As Nishina et al. (1940b) have pointed out, the observation for a cold front conflicts with that of Loughridge and Gast (1939). Nishina et al. (1940a) noted that the observed decrease in cosmic ray intensities is expected because of the temperature effect of the cosmic rays, for the northwest passage of a typhoon. Recently, Styro et al. (2010) attempted to study the influence of cyclonic events on hard cosmic ray flux (HCRF) using NaI (Tl) scintillation detector for γ-ray spectroscopy.
A cyclone is basically an intense vortex or a whirl in the atmosphere. The distinctive feature of the tropical cyclone is the eye, center of the cyclone. In the eyewall region (~10–20 km away from the eye) of cyclones, there are a very large number of thunderstorm cells, which consist of thick bands of clouds and associated heavy precipitation, spiraling cyclonically (counter-clockwise manner) in the northern hemisphere around the eye (Barry and Chorley, 2009). Heavy rainfall is usually experienced in the areas nearby the passage of a cyclone. The presence of radioactive elements in the rainwater is known for a few decades now. There are several studies about the concentration of short-lived 222Rn decay products in rainwater. Damon and Kuroda (1954) used a Geiger-Müller detector to measure the concentration of 222Rn decay products in rainwater samples, while Bhandari (1963) used the NaI (Tl) scintillation detector, and Katase et al. (1982) and Horng and Jiang (2004) used Ge detectors to perform in-situ measurements of the environmental gamma-ray intensity associated with the rainfall. Models are proposed for the scavenging of 222Rn decay products in the air by rainfall (Takeuchi and Katase, 1982; Minato, 1983; Horng and Jiang, 2003; Gusev et al., 2015). The 222Rn daughter elements affecting environmental gamma-ray intensity are 214Pb and 214Bi. The previous studies mostly examined the total concentration of radon during the rainfall, rather than the concentrations of its individual decay products.
As discussed earlier, apart from the radioactive elements, such as 222Rn and its daughter elements, γ-rays can have other terrestrial origin, e.g., lightning. The generation and acceleration of γ-rays due to thunderstorm activity have been observed using scintillation detectors (Alexeenko et al., 2002; Chilingarian et al., 2015). A number of experiments have registered the bursts of γ emission during thunderstorms. Terrestrial gamma-ray flashes (TGFs) are brief bursts of energetic γ-rays produced in the atmosphere and observed by satellites in low-Earth orbit. TGFs were first discovered in 1994 (Fishman et al., 1994). Now it is known that these bursts are associated with lightning (Cummer et al., 2005; Inan and Lehtinen, 2005; Cohen et al., 2006, 2010; Inan et al., 2006). Further, it has been found that they are produced in the middle atmosphere and consist of photons with individual energies ranging from >10 keV to <40 MeV and the total energy released during a burst event is ~10 kJ (Carlson et al., 2009). The energetic photons in a TGF are known to be produced by energetic electrons. In a strong electric field, populations of relativistic electrons can grow like an avalanche. These runaway electrons produce γ-rays via the Bremsstrahlung mechanism. It suggests that an initial population of relativistic electrons in the presence of a strong electric field will be sufficient to produce a TGF. Recently, for the first time, Enoto et al. (2017) established the presence of photonuclear reaction 14N + γ → 13N + n (γ being a photon and n being neutron). The study shows that lightning and thunderclouds produce neutrons via this reaction, which further produces positrons via β+ decay.
Generally, heavy rainfall and major thunderstorm activity are observed to accompany with cyclone passage. The overall effect on γ-ray flux can be a combination of some/all the above-mentioned processes. Nishina et al. (1940b) explained the variations in the cosmic ray intensity based on the passage of the cold front and warm front, which intuitively seems justifiable because in the subtropical area, like Japan, weather fronts are the principal drivers of meteorological phenomena. Also, Styro et al. (2010) have studied HCRF in Vilnius, Lithuania, again in the subtropic zone. However, the effects of cyclones are not studied in detail in the tropical/equatorial region. Explanations provided till now, for the variations in the cosmic ray intensity during a cyclone do not provide a complete picture. This gives a scope to investigate how exactly the cyclonic storms affect the measured γ-ray flux which is also one of the major components in SCR. The motivation of the present work is to understand the effect of a cyclone on γ-ray flux measured using NaI (Tl) detector and to examine whether these effects vary in different energy bands. To study that, the authors got an opportunity during rather a tragic occurrence of the cyclone Ockhi that occurred in the Indian subcontinent.
2. Data and Observations
NaI (Tl) detector data are used from an experimental set-up at Equatorial Geophysical Research Laboratory (EGRL), Tirunelveli (Geographic Coordinates: 8.71°N, 77.76°E). Tirunelveli is located in the southern part of the Indian peninsula and mainly experiences North-East monsoon. The details about the geography and climatic condition of the location are described by Panneerselvam et al. (2007). NaI (Tl) scintillation detector is a rectangular cuboid of 10.16 × 10.16 × 40.64 cm (4″ × 4″ × 16″) size. The detector is surrounded by lead shielding from all sides except the top; the top is covered by plywood. The set-up is kept inside an isolated environment of a double-walled cabin, where the temperature is maintained irrespective of the atmospheric variations. This cabin is at a height of six feet from the ground (Figure 2A). Various levels of data acquisition using DPP-PHA (digital pulse processing for pulse height analysis) are depicted in Figure 2B. Comprehensive details of the experiment are given by Vichare et al. (2018). The set-up records a γ-ray spectrum (energy range ~ 150 keV–10 MeV) at every 1 min. The detector is calibrated using standard sources (60Co and 137Cs) and identified background radioactivity peaks (Table 2). Using the energy values corresponding to these known photopeaks, a second-order (non-linear) equation, calibrating channel number to energy, is obtained (shown in Figure 2C). To study the variations during the cyclone, a quiet weather day was used as a reference. Further, % variations were estimated using the following formula:
where x is the number of counts accumulated for each minute, and is the mean of counts on a quiet day (11 November 2017).
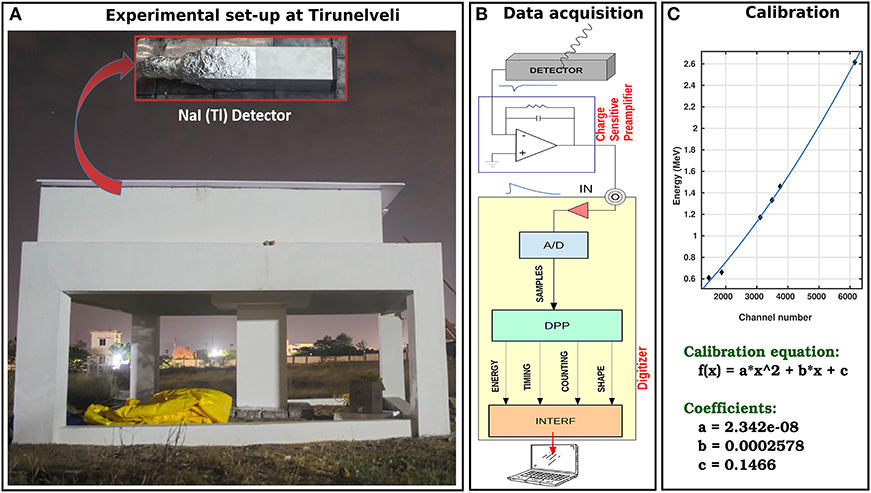
Figure 2. (A) Experimental set-up of NaI (Tl) detector at Tirunelveli, India; (B) Data acquisition system; (C) Energy calibration curve.
During cyclone Ockhi, γ-ray counts are compared with the changes in the atmospheric parameters (temperature, pressure, humidity, rainfall, wind), which are obtained from the India Meteorological Department (IMD). The time duration taken under consideration is from 28 November 2017 to 5 December 2017. The topmost panel of Figure 3A displays % change in γ-ray counts (energy >~150 keV) normalized with the quiet day. The atmospheric parameters recorded during the same period at Tirunelveli are shown in the bottom panels. The wind direction is measured in degrees from the North.
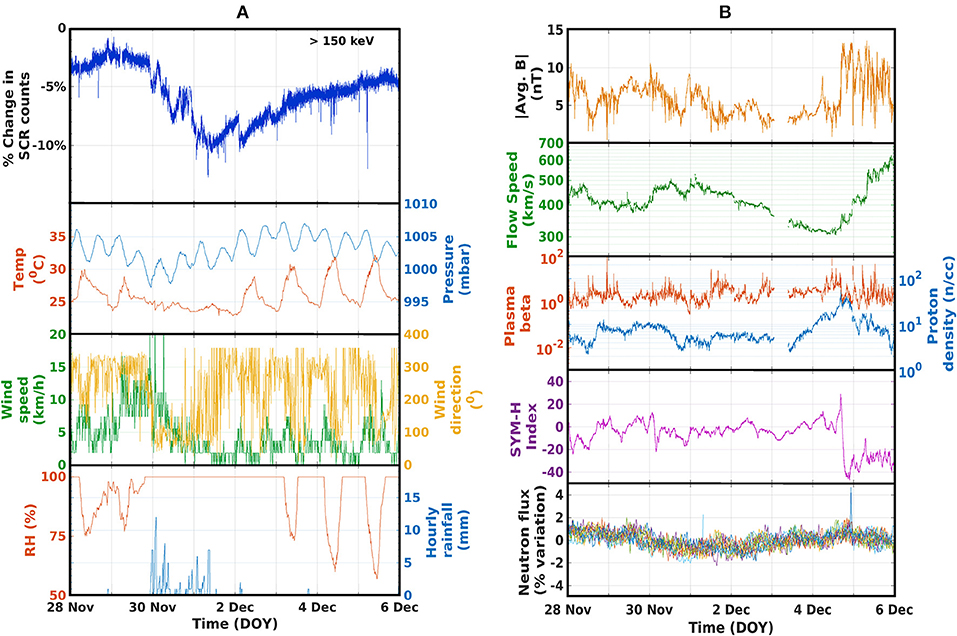
Figure 3. (A) Percentage variations in γ-ray counts observed at Tirunelveli along with various atmospheric parameters; (B) Interplanetary and solar wind parameters, Sym-H index, ground observations from NM network.
The wind speed had increased to 15 kmh−1 on 29 November 2017, 1 day prior to the onset of Ockhi at the observation site. At the same time pressure and the mean temperature also dropped below the normal values. Around ~21 UT on 29 November, wind direction showed a drastic shift from ~300 to ~40° which coincided with the rainfall and continued for the next one and a half day until the afternoon of 1 December. The temperature dropped below 25°C on 30 November and 1 December. It can be noted that on these days, the temperature did not exhibit the normal diurnal pattern. Relative humidity attained a maximum value (100%) from 30 November to 2 December. The wind direction showed a drastic change on 1 December, as the cyclone moved further on its path. The pressure, temperature, and humidity slowly recovered to follow their usual trends by the end of 2nd December.
As discussed earlier, γ-rays on the ground could have different origins including solar and galactic CR. To understand if the cyclone is the sole cause for the effects observed in the γ-ray spectrum, we look into the extraterrestrial components—galactic and interplanetary, as well as magnetospheric conditions near Earth. According to a gamma-ray burst (GRB) catalog based on Swift satellite data, it is found that there was no GRB event recorded between 24 November and 5 December 2017, which confirms the absence of a significant increase in the galactic gamma-flux during the period of cyclone Ockhi. The interplanetary parameters from ACE satellite and Sym-H data are obtained from the OMNI database. Sym-H is designed to measure the intensity of the geomagnetic storm-time ring current like Dst, but with the resolution of 1-min. Neutron monitor (NM) network has stations across the globe with neutron detectors. Their data-set is available at http://www.nmdb.eu/nest. For this study, stations within 100 m altitude are considered. The list of stations with corresponding geomagnetic cut-off rigidities is provided in Table 1. NM data is normalized using the same formula mentioned above for γ-ray variation. NM data, Sym-H index (WDC, Kyoto) and satellite data (OMNI) are under the public domain.
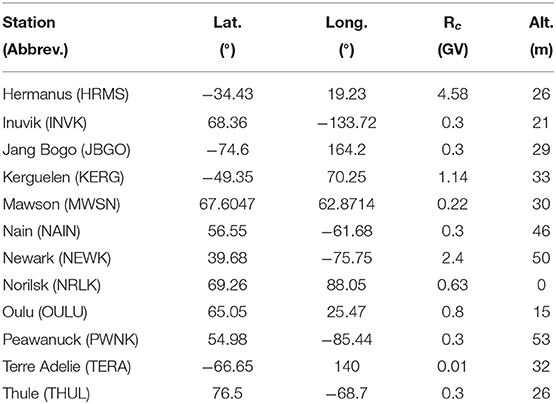
Table 1. Details of NMs used in the analysis (data obtained from NMDB Database, http://www.nmdb.eu/nest).
The bottom-most panel of Figure 3B shows ground observations from the global neutron monitor network. It shows a maximum ±2% variation in the targeted period, which is well within the normal variation range. During this period there is no significant increase or decrease observed in the interplanetary magnetic field, solar wind speed, plasma beta or solar wind density. Also, no significant variations are noticed in the Sym-H index.
Figure 4 shows satellite imagery at different times during the passage of cyclone Ockhi. The observation site is indicated by a red star symbol. The black circles show lightning strokes. The color contour shows water vapor content. Figure 4A shows that the observation site is located in the cyclone arm on 30 November. Figures 4B,C show the water vapor content in the vicinity of the station on 30 November. As the cyclone passes further away from the site, it can be seen in Figure 4D, the observation site is out of the region of high concentration of water vapor by the evening of 1 December 2017.
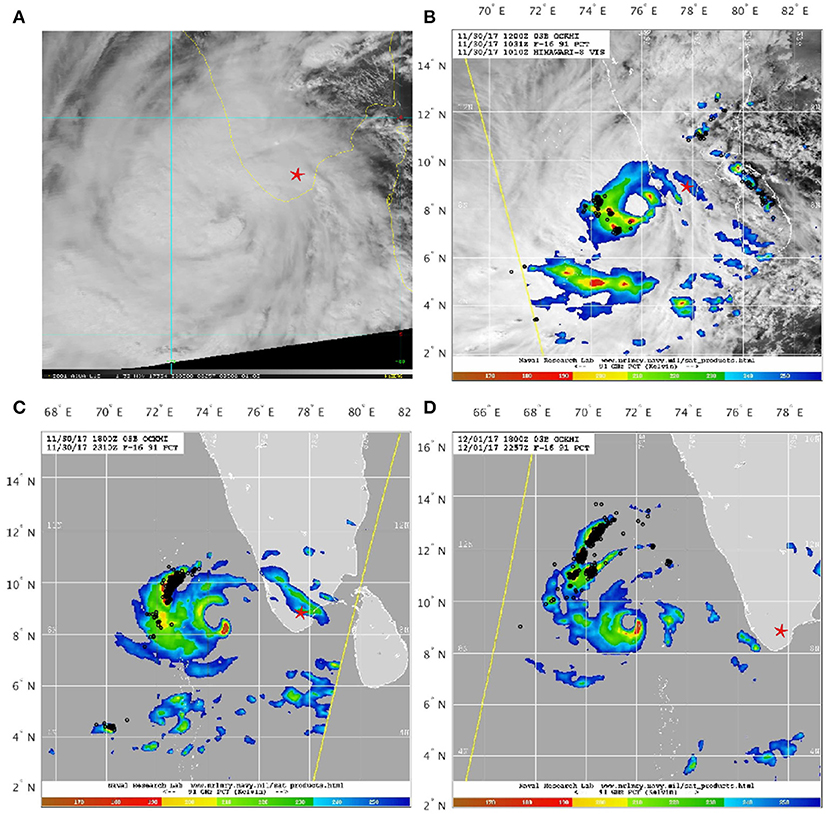
Figure 4. (A) Visible imagery in natural color on 30 November at 08:05 UT (Courtesy : NOAA Satellites and Information); (B–D) Satellite images from the Naval Research Lab overlaid with lightning strokes (shown as black circles) during ±15 min of satellite image time. The color contour shows the water vapor content. Image (B) is taken on 30 Nov, 10:31 UT; image (C) on 30 Nov, 18:00 UT; image (D) on 1 Dec, 18:00 UT (Courtesy: WWLLN); In all sub-images, a red star shows the location of the observation site, Tirunelveli.
Figure 5 examines the dependence of the γ-flux on the distance of the observation site from the eye of the cyclone Ockhi. The cyclone was nearest on 30 November 2017, at a distance of ~137 km. The γ-ray count depicted in Figure 5B shows a decreasing effect during that time; however, the maximum decrease does not coincide with the minimum distance. The intensity of the cyclone during its passage is also shown in Figure 5A. Here, it can be seen that at the time of the closest approach, the cyclone was still developing from deep depression (stage 2) to cyclonic storm (stage 3); thus, it was not at its maximum strength. The cyclone was classified as a very severe cyclonic storm (stage 5) on 1 December 2017. Thus, not only the distance but also the intensity of the cyclone plays an important role in influencing the γ-ray counts at the observation site.
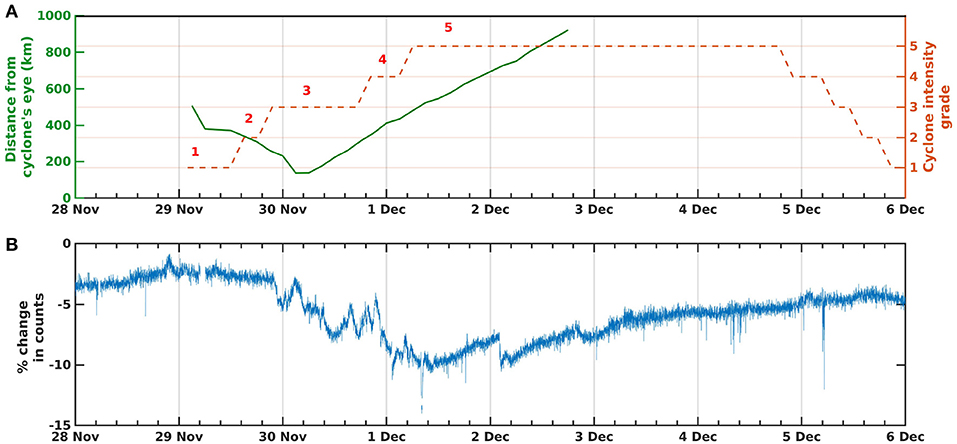
Figure 5. (A) Solid curve shows the distance of the observation site from the eye of the Cyclone Ockhi, and dashed line shows the intensity of the cyclone represented by various stages. Here, stages 1, 2, 3, 4, and 5 indicate depression, deep depression, cyclonic storm, severe cyclonic storm, and very severe cyclonic storm, respectively. (B) Total γ-ray counts detected by NaI at Tirunelveli.
3. Results
From Figure 3B, no anomalous behavior is observed in the galactic gamma-ray flux, the global signature of SCR flux from neutron monitors, the interplanetary and solar wind parameters, and geomagnetic activity index during the period of study. Evidently, cyclone Ockhi was passing by the observation site and caused perturbations in the atmosphere on the local scale. Thus, it can be concluded that the changes observed in γ-ray flux at Tirunelveli are caused as an effect of the exclusively local phenomenon and not of the solar, interplanetary, or galactic origin.
As observed from Figure 3A, there was moderate rainfall consistently over the observation site during 30 November and on the next half day of 1 December (~70 mm over 2 days period). Coincidently, the γ-ray flux showed a decrease of up to ~10% (Figure 3A) over the same time interval as rainfall. The rainfall occurred in the same duration when the satellite imagery shows high concentrations of water vapor over the observation site (Figures 4B,C).
To study the changes associated with the cyclone in different energy bands, γ-ray flux with nine different cut-off energies is examined. Cut-off energy is a filter in which counts from all the channels (energy bins) above that certain energy are summed up, which represents the counts above the desired cut-off energy. The γ-ray flux with different cut-off energies (150, 250, 450, 600 keV, 2.7, 3, 5, 7, 10 MeV) are shown in Figure 6. It can be observed that the variation of γ-ray flux differs for different energies, e.g., the first two subplots (cut-off energies 150 and 250 keV) show decrease during the cyclone period, while next two subplots (cut-off energies 450 and 600 keV) show increase. Cut-off energies above 2.7 MeV show statistical fluctuations of about ±20% of the measured counts. Thus, any change during the cyclone period (<20%) can not be observed above 2.7 MeV. Thus, it is observed that the trend varies drastically with cut-off energies. This indicates that the response to the cyclone observed in the γ-ray flux varies with energy.
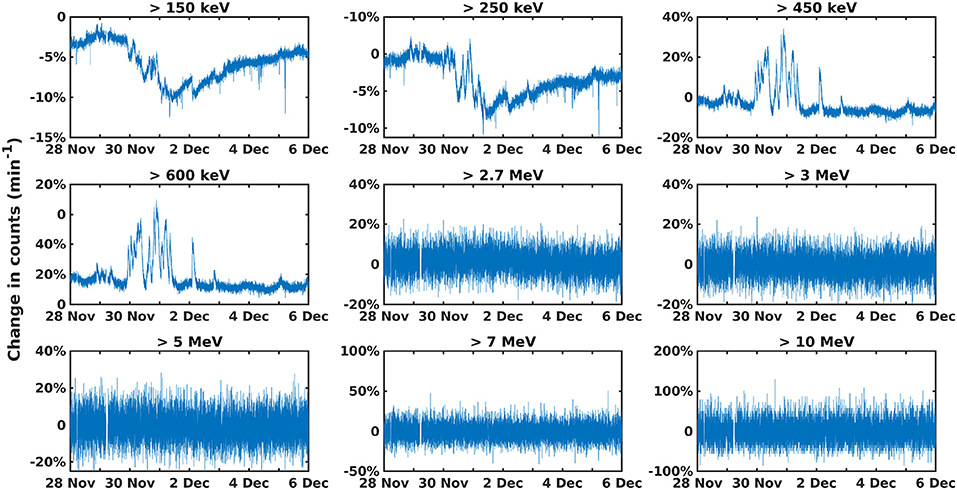
Figure 6. Total nine energy cut-off ranging from ~150 keV to ~10 MeV are plotted in subplots with energy indicated above the subplot. γ-ray data for the time duration from 28 November to 5 December 2017 is depicted. Percentage decrease/increase is indicated on y-axes.
To demonstrate this feature, we have examined the variations of γ-ray flux in three different energy bands (250–450 keV; 600 keV–2.7 MeV; 3–5 MeV), and shown in Figure 7. The selection of these particular bands is based on the observation of decrease and increase noticed in Figure 6, where a distinct enhancement from 450 keV up to 2.7 MeV and a distinct decrease below 450 keV is evident. In the first energy band (250–450 keV), a clear decrease (~14%) is observed during the cyclone period. In the medium energy band (600 keV–2.7 MeV), a distinct enhancement (~45%) is observed. However, the high energy range (3–5 MeV) does not show any change. After the cyclone moved further away from the observation site, the changes in the γ-ray flux drop to zero, regaining the normal values.
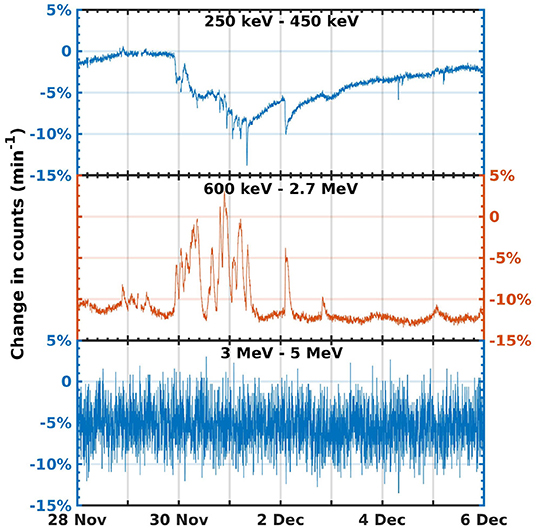
Figure 7. The three important energy bands' counts are represented separately. The decrease/increase is indicated in numbers on y-axes. 1st panel shows low-energy, 2nd panel shows mid-energy and the bottom panel shows the high-energy range trend during the Ockhi period.
4. Discussion
The energy spectrum obtained using NaI (Tl) detector shows the photopeaks (listed in Table 2) due to terrestrial radioactivity in addition to the γ-rays produced in the SCR cascade (Vichare et al., 2018). A typical one day accumulated energy spectrum (refer curves in the top panel of Figure 8), shows different background photopeaks due to the radioactive isotopes viz. 208Tl, 214Bi, 40K, and 214Pb. Different energy peaks are numbered and corresponding elements are listed in Table 2. In order to investigate the change in the background peaks, we have examined the changes in one day accumulated spectra during the cyclone time with respect to quiet weather conditions. We have eliminated the strong background trends in the 24 hr accumulated energy spectra by subtracting the exponential curves. Thus, partially linearized curves are obtained and presented in Figure 8.

Table 2. Natural radioactivity background: identified peaks.
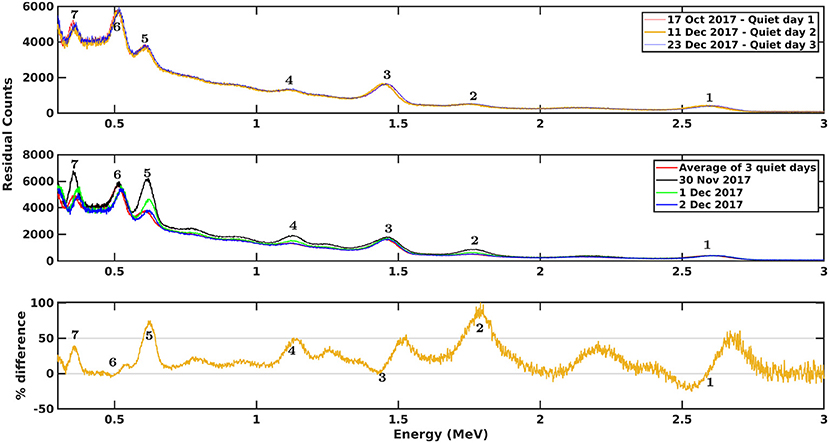
Figure 8. In the top panel, quiet weather spectra accumulated for a complete day are presented for three different days. In the middle panel, similar spectra on 30 November, 1 and 2 December 2017 are compared with quiet weather condition; the corresponding residual counts are shown on y-axis. In the bottom panel, % difference between quiet weather condition and 30 November 2017 with respect to the quiet time values is depicted (for energy of peaks, refer Table 2).
The top panel shows spectra for three separate quiet weather days viz. 17 October, 11 and 23 December 2017. In the middle panel, the light green color curve shows the average of three quiet day spectra along with 3 days during Ockhi cyclone, viz., 30 November (black curve), 1 December (blue curve), and 2 December 2017 (magenta curve). As seen in Figure 5, the minimum distance between the cyclone's eye and the observation site was on 30 November 2017, and also the rainfall at the site was maximum on that day (Figure 3A). The cyclone started receding on 1 December 2017, and the observation site experienced moderate rainfall for only a few hours, and the cyclone moved farther away on 2 December 2017 without much rainfall. It is observed from these plots that the effect of the cyclone was maximum on 30 November and subsequently reduced as the cyclone moved away. This progression of the cyclone and the effect of rainfall is clearly observed in Figure 8. The bottom panel shows the % difference between the average of three quiet days and 30 November 2017. From Figure 8, it is evident that all identified peaks of 214Bi and 214Pb show enhancement. However, peaks of 40K and 208Tl do not show any change. Note that these photopeaks are not associated with the 222Rn decay. The enhancement seen besides these photopeaks could be attributed to the Compton component of neighboring 214Bi peaks or it could be due to slight differences in the calibration. Katase et al. (1982) pointed out the slight decrease in 40K with the rainfall. They did not observe any significant variations in 208Tl, and attributed the absence of such variation to statistical errors (Katase et al., 1982).
As discussed earlier, it has been reported by previous studies that the 222Rn daughter products, such as 214Bi and 214Pb show enhancement with the rainfall. Therefore, we examine how the background spectrum changes with the rainfall. The half-life of 214Bi is 19.7 min (Table 2). Therefore, in order to check how the 214Bi radioactivity changes within 20 min interval during the rainfall, we have composed the background spectrum for every 20 min. We have set T0 as rain onset time and computed the spectrum on either side of the onset. The top panel of Figure 9 displays the spectra collected at various times, i.e., at the onset of rain (T0), before the rain (i.e., T0 − 20 min, T0 − 100 min), after the start of the rainfall (T0 + 20 min), and after continuous rainfall of 2 hr (T0 + 140 min, T0 + 160 min). The spectrum at (T0 − 100 min) can be considered as a calm/normal time spectrum, as the cyclone activity had not started by that time. Note that the photopeaks seen in the normal time spectrum (T0 − 100 min) collected over 20 min, are similar to those depicted in Figure 8 accumulated over 1 day period. Thus, the Figure 9 shows the spectra of 20 min accumulation during the rain event along with a normal (no cyclone) time spectrum. It should be noted that the spectrum corresponding to any time T is accumulated from the time (T − 10 min) to (T + 10 min), resulting in a total accumulation interval of 20 min. Also, note that for the presentation convenience, the spectra at various times are displayed with a vertical offset; however the spectrum at (T0 + 160 min) shows the actual counts. Even though the accumulation is performed for the duration of only 20 min, the spectrum depicts most of the background peaks enlisted in Table 2. It can be noticed that the amplitude of some of the peaks increases with the onset of the rain activity. The difference between the spectra at (T0 + 20 min) and (T0 − 100 min) is shown in the bottom panel of Figure 9, in which, enhancement in certain background peaks is evident. In particular, the large enhancement of ~65-130 % is observed at Peaks #2, 4, and 5, which corresponds to 214Bi. The % change (mentioned in green color) in the counts (presented on y-axis) is computed with respect to the counts in normal time spectrum (T0 − 100 min). These variations are larger than the statistical fluctuations. Therefore, the present analysis clearly shows the increased radioactivity associated with 214Bi just after the commencement of the rain activity within 20 min, which continues even beyond 2 h of the rainfall.
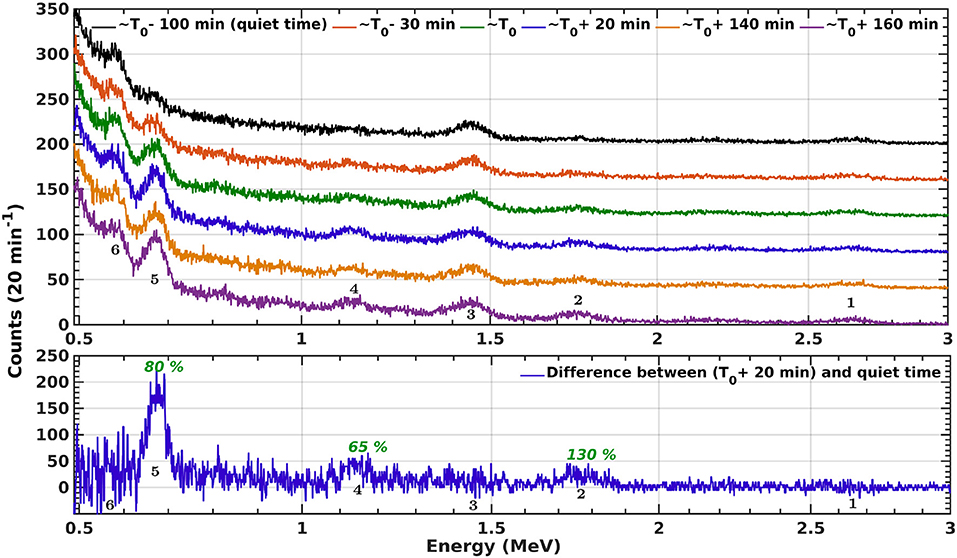
Figure 9. With rain onset time as T0, the 20 min accumulation spectra at various instances are depicted in the upper panel. The difference in counts of various photopeaks during the rainfall (T0 + 20min) is shown in the lower panel along with the respective value of % change relative to the calm (no-cyclone) time spectrum.
Previous studies have reported significant increase in 222Rn through 214Bi and 214Pb lines during the rainfall and they attributed this increase to the radioactivity in rainwater (Damon and Kuroda, 1954; Bhandari, 1963; Katase et al., 1982; Horng and Jiang, 2003; Gusev et al., 2015; Nayak et al., 2016). Our observation of the increase in 214Bi lines is in accordance with the earlier studies. Note that all these 214Bi lines fall in the energy range 0.6–2.7 MeV and hence the significant increase observed in this energy band can be ascribed to rainfall.
From Figure 7, it can be noticed that there are fluctuations in the enhancement observed in 600 keV–2.7 MeV energy band during 30 November and 1 December. At the same time, the amount of rainfall was also fluctuating. In order to inspect whether there exists any correlation between these two quantities, we studied a scatter plot of counts against hourly rain data, by considering values only above 2 mm of rainfall. Interestingly, there is no direct correlation between rainfall amount and counts (R = −0.0933). Takeyasu et al. (2006) had pointed out that the concentrations of 214Bi and 214Pb were negatively correlated with the rainfall rate in some rainfall events, while the correlation was not clearly apparent for many other rainfall events. The increase in radioactivity during rainfall has been explained in the literature on rainout and washout model. The daughter nuclei 214Bi and 214Pb of 222Rn are floating in the atmosphere in the form of free ions or aerosols (Katase et al., 1982). Rainout takes place in a cloud when free ions become nuclei for cloud droplets. Whereas, washout takes place under a cloud when free ions attach themselves to the falling droplets (Takeuchi and Katase, 1982). The radon or its daughter nuclei concentration in the atmosphere is usually not constant with time. When the rainfall continues for many hours, the enhancement due to washout process will eventually decrease, resulting into no one-to-one correlation, while that due to rainout will remain more or less same. This explains our result of a lack of significant correlation between the counts and rain.
As seen from Figure 4, there are lightning strokes in the same time interval as the rainfall, but about ~200 km away from our observation site, Tirunelveli. Also, normally the γ-rays emitted by the lightning processes have a wide energy range and hence the higher energy range, i.e., above 2.7 MeV should also show an increase (Celestin et al., 2012). The absence of any increase in the higher energy band indicates that the enhancement in our observations is solely due to the rainfall. Styro et al. (2010) showed that the variation of hard cosmic ray flux and atmospheric pressure has a strong inverse correlation. They observed that atmospheric pressure decreases when a cyclone is in motion over the observation site, resulting in the reduced air density and hence more cosmic particles can reach the ground surface (Styro et al., 2010). On the contrary, the present study indicates that when a cyclone is passing over the observation site, less particles reach the ground.
Although mid-range energies show an enhancement due to enhanced atmospheric radioactivity brought over by precipitation, the general trend of γ-ray flux during cyclone shows a decrease of around 10% overall (as seen in Figure 6 for 150 keV) and a decrease of up to 14% in the energy band 250–450 keV. This can be explained with the following possible mechanism. When a particle travels through the atmosphere, attenuation takes place due to atmospheric dense medium, in which particle loses a significant amount of energy during its propagation toward the ground. Low energy gamma rays get attenuated very easily due to the presence of dense cloud cover. Besides, other SCR particles, such as muons, which produces gamma rays in the cascade process at lower altitudes, also experience attenuation due to the presence of highly dense cyclonic cloud.
In a medium with density ρ and attenuation length Λ, the absorption coefficient (μ) is given by,
μ is expressed in m−1, when the density is in kgm−3 and the attenuation length has unit kgm−2. For muons, in the atmosphere, the standard value of Λ is 2,470 kgm−2 (Gosse and Phillips, 2001). As cosmic rays, particularly muons travel through the matter, their flux is attenuated exponentially (Lal, 1991). After traversing a distance x, the flux intensity is described by
where N0 is the flux before the attenuation start, i.e., at x = 0. According to Dunne et al. (1999), replacing the attenuation length with λ (= 1.3 Λ) reproduces the standard exponential decay very closely.
Considering that the cloud top layer is at 14 km during a cyclone, the secondary cosmic ray production process should be the same above 14 km on the quiet as well as cyclone day, provided the extra-terrestrial contribution to the SCR is constant. First, we calculated the attenuation due to different atmospheric densities at different heights during quiet weather conditions. Height profile of the atmospheric density is taken from Chandrasekar (2010) (US Standard Atmosphere). It is assumed that the number of muons N0 = 100 at 14 km altitude. After calculating attenuation at every km, it is found that after traversing 14 km in the atmosphere, during quiet weather situations, only 5.3617 number of muons (of 100 muons at 14 km) will reach to the ground. Along with the attenuation, the absorption coefficient (μ) at each km is also calculated using Equation (2) and replacing Λ with λ. Then considering the overall attenuation in Equation (3) from 14 km to ground, the effective absorption coefficient (μeff, quiet) is calculated. The effective density (ρeff, quiet) is obtained for quiet time atmosphere.
which gives
From the observations presented in Figure 7, there is a maximum decrease of 14% in the energy band 250–450 keV. This indicates that during the event time, the measured flux on the ground is 14% less than the quiet time flux. Therefore, during event time, for calculation of absorption coefficient and density, keeping attenuation length constant, N should be replaced by 14% less than the quiet time N value. Using the quiet time values obtained as explained above, effective μ and ρ during event time are as follows:
Thus, the maximum % increase in the effective atmospheric density over the observation site was 5.15% during the event.
Our calculations indicate that in 0–14 km, the effective density had become 5.15% more than that during quiet climatic conditions. This implies that there was an increase in the air mass over the observation site and cyclonic clouds caused an obstruction and helped to scatter/absorb more number of particles than quiet/normal time situation. It should be noted that the above calculations indicate an effective percentage change of air mass, however there could be a huge localized change in the air mass in a narrow layer of the atmosphere causing the observed attenuation, e.g., suppose there is a local obstruction due to a cloud of thickness of 1 km, at an altitude of 8 km, then a density change of around 88% from 0.53 to 1 kgm−3 at 8 km, would correspond to an effective increase of ~5% in the atmospheric column between 0 and 14 km. Thus, a 5% increase in the effective density can be associated with a larger localized changes (~88%) in the atmosphere.
We propose that the secondary particles' fluxes (as demonstrated mathematically for muon) get attenuated significantly during the cyclone due to the presence of high-density clouds. It is well-known that photons are produced in the cascade in the lower atmosphere via various nuclear reactions. Thus, theoretically, if high-density, thick clouds pose an obstruction in the path of secondary particles, and the attenuation in their fluxes can lead to a reduced flux of photons. This can explain the general decrease in γ-ray flux in the low and mid-energy bands. At the same time, high energy component of γ-ray, originating from SCR alone, that reaches the ground remains unaffected by this cloud. For higher energies, no significant change could be observed due to large statistical fluctuations.
5. Conclusions
The cyclone Ockhi, classified as a very severe cyclonic storm (IMD) or Category 3 hurricane (SSHWS), passed by the observation site in Nov–Dec 2017. By using data obtained from NaI (Tl) detector, we report that during the passage of the cyclone, an overall decrease was observed in the γ-ray spectrum. However, further in-depth investigation reveals varying effects in different energy bands. In the energy range between 250 – 450 keV, a decrease up to ~14% was observed. Whereas, in the energy range between 600 keV – 2.7 MeV, an increase up to ~45% was observed. The energies above 2.7 MeV did not show any change.
Usually, 40K, 208Tl, and 214Bi lines are clearly observed in the γ-ray spectrum of the present set-up, which fall in the energy range between 600 keV – 2.7 MeV. During the passage of Ockhi cyclone, all identified lines of 214Bi show clear enhancement. Since 214Bi falls in the decay chain of 222Rn, this increase in 214Bi lines indicate the increased amount of 222Rn, which is normally observed during rainfall. Thus, the increase in the energy range between 600 keV – 2.7 MeV is due to the rainfall brought over by the Ockhi cyclone.
The cyclonic clouds poses an obstruction to the passage of incoming SCR. The calculations presented in the paper show that the decrease observed in the lower energy range (<450 keV) of the γ-ray flux could be due to the attenuation caused by the increased air mass density associated with the cyclone. We estimate an overall increase of 5.15% in the air mass over the observation site, in the atmospheric column between 0 and 14 km, which corresponds to the observed decrease in the gamma ray flux during the Ockhi cyclone. The estimated increase in the air mass is larger (~88%) in case of a localized dense clouds at a particular altitude in the atmospheric column. High energy gamma rays are unaffected by this increased air mass.
Data Availability Statement
The NaI (Tl) data used for this study are available on request to the Director, Indian Institute of Geomagnetism (IIG). The datasets studied to support the findings of the current study are available in the NMDB repository [http://www.nmdb.eu/nest], OMNI database [http://cdaweb.gsfc.nasa.gov/], and satellite imagery at www.wwlln.net, www.noaa.gov. The atmospheric data was obtained from IMD [www.imd.gov.in/].
Author Contributions
GV and AR designed the study. GD carried out the data analysis. GD, GV, AR, and AB contributed to the analysis of the results, the discussion, and writing the manuscript. All authors participated in designing the experiment.
Conflict of Interest
The authors declare that the research was conducted in the absence of any commercial or financial relationships that could be construed as a potential conflict of interest.
Acknowledgments
The experimental set up at Tirunelveli is operated by the Indian Institute of Geomagnetism. Authors are grateful to corresponding authorities of NMDB, OMNI, WWLLN, NOAA, and IMD for providing respective data-sets.
This work is supported by the Department of Science and Technology, Government of India. AB acknowledges the support by the NASA Living With a Star Jack Eddy Post-doctoral Fellowship Program, administered by UCARs Cooperative Programs for the Advancement of Earth System Science (CPAESS).
References
Alexeenko, V., Khaerdinov, N., Lidvansky, A. A., and Petkov, V. (2002). Transient variations of secondary cosmic rays due to atmospheric electric field and evidence for pre-lightning particle acceleration. Phys. Lett. A 301, 299–306. doi: 10.1016/S0375-9601(02)00981-7
Bhandari, N. (1963). Study of atmospheric washout processes by means of radon decay products. J. Geophys. Res. 68, 3823–3826. doi: 10.1029/JZ068i013p03823
Carlson, B. E., Lehtinen, N. G., and Inan, U. S. (2009). Terrestrial gamma ray flash production by lightning current pulses. J. Geophys. Res. Space Phys. 114:A00E08. doi: 10.1029/2009JA014531
Celestin, S., Xu, W., and Pasko, V. P. (2012). Terrestrial gamma ray flashes with energies up to 100 mev produced by nonequilibrium acceleration of electrons in lightning. J. Geophys. Res. Space Phys. 117:A05315. doi: 10.1029/2012JA017535
Chen, S. S., Knaff, J. A., and Marks, F. D. Jr. (2006). Effects of vertical wind shear and storm motion on tropical cyclone rainfall asymmetries deduced from trmm. Monthly Weather Rev. 134, 3190–3208. doi: 10.1175/MWR3245.1
Chilingarian, A., Chilingaryan, S., and Reymers, A. (2015). Atmospheric discharges and particle fluxes. J. Geophys. Res. Space Phys. 120, 5845–5853. doi: 10.1002/2015JA021259
Cohen, M. B., Inan, U. S., and Fishman, G. (2006). Terrestrial gamma ray flashes observed aboard the compton gamma ray observatory/burst and transient source experiment and ELF/VLF radio atmospherics. J. Geophys. Res. Atmos. 111:D24109. doi: 10.1029/2005JD006987
Cohen, M. B., Inan, U. S., Said, R. K., and Gjestland, T. (2010). Geolocation of terrestrial gamma-ray flash source lightning. Geophys. Res. Lett. 37:L02801. doi: 10.1029/2009GL041753
Cummer, S. A., Zhai, Y., Hu, W., Smith, D. M., Lopez, L. I., and Stanley, M. A. (2005). Measurements and implications of the relationship between lightning and terrestrial gamma ray flashes. Geophys. Res. Lett. 32:L08811. doi: 10.1029/2005GL022778
Damon, P. E., and Kuroda, P. (1954). On the natural radioactivity of rainfall. EOS Trans. Am. Geophys. Union 35, 208–216. doi: 10.1029/TR035i002p00208
Dunne, J., Elmore, D., and Muzikar, P. (1999). Scaling factors for the rates of production of cosmogenic nuclides for geometric shielding and attenuation at depth on sloped surfaces. Geomorphology 27, 3–11. doi: 10.1016/S0169-555X(98)00086-5
Dvorak, V. F. (1984). Tropical Cyclone Intensity Analysis Using Satellite Data, Vol. 11. Maryland: US Department of Commerce, National Oceanic and Atmospheric Administration, National Environmental Satellite, Data, and Information Service.
Enoto, T., Wada, Y., Furuta, Y., Nakazawa, K., Yuasa, T., Okuda, K., et al. (2017). Photonuclear reactions triggered by lightning discharge. Nature 551:481. doi: 10.1038/nature24630
Fishman, G. J., Bhat, P., Mallozzi, R., Horack, J., Koshut, T., Kouveliotou, C., et al. (1994). Discovery of intense gamma-ray flashes of atmospheric origin. Science 264, 1313–1316. doi: 10.1126/science.264.5163.1313
Gosse, J. C., and Phillips, F. M. (2001). Terrestrial in situ cosmogenic nuclides: theory and application. Quater. Sci. Rev. 20, 1475–1560. doi: 10.1016/S0277-3791(00)00171-2
Gusev, A. A., Martin, I. M., Alves, M. A., and de Abreu, A. J. (2015). Simulation of the radiation fallout from gamma-ray measurements. Model. Earth Syst. Environ. 1:18. doi: 10.1007/s40808-015-0016-3
Horng, M.-C., and Jiang, S.-H. (2003). A rainout model for the study of the additional exposure rate due to rainfall. Radiat. Meas. 37, 603–608. doi: 10.1016/S1350-4487(03)00067-2
Horng, M.-C., and Jiang, S.-H. (2004). In situ measurements of gamma-ray intensity from radon progeny in rainwater. Radiat. Meas. 38, 23–30. doi: 10.1016/S1350-4487(03)00285-3
Inan, U. S., Cohen, M. B., Said, R. K., Smith, D. M., and Lopez, L. I. (2006). Terrestrial gamma ray flashes and lightning discharges. Geophys. Res. Lett. 33:L18802. doi: 10.1029/2006GL027085
Inan, U. S., and Lehtinen, N. G. (2005). Production of terrestrial gamma-ray flashes by an electromagnetic pulse from a lightning return stroke. Geophys. Res. Lett. 32:L19818. doi: 10.1029/2005GL023702
Katase, A., Narahara, Y., Ishihara, Y., Tanaka, K., and Matsuyama, H. (1982). Variation of intensity of environmental gamma-rays measured with Ge (Li) spectrometer. J. Nucl. Sci. Technol. 19, 918–927. doi: 10.1080/18811248.1982.9734237
Knight, D. B., and Davis, R. E. (2007). Climatology of tropical cyclone rainfall in the southeastern united states. Phys. Geogr. 28, 126–147. doi: 10.2747/0272-3646.28.2.126
Knutson, T. R., McBride, J. L., Chan, J., Emanuel, K., Holland, G., Landsea, C., et al. (2010). Tropical cyclones and climate change. Nat. Geosci. 3:157. doi: 10.1038/ngeo779
Lal, D. (1991). Cosmic ray labeling of erosion surfaces: in situ nuclide production rates and erosion models. Earth Planet. Sci. Lett. 104, 424–439. doi: 10.1016/0012-821X(91)90220-C
Loughridge, D. H., and Gast, P. (1939). Air mass effect on cosmic-ray intensity. Phys. Rev. 56:1169. doi: 10.1103/PhysRev.56.1169.2
Minato, S. (1983). Estimate of radon-222 concentrations in rainclouds from radioactivity of rainwater observed at ground level. J. Radioanal. Nucl. Chem. 78, 199–207. doi: 10.1007/BF02519765
Nayak, P., Gupta, S., Jain, A., Mazumdar, I., and Raha, S. (2016). Study of terrestrial γ-ray background in presence of variable radioactivity from rain water. Astropart. Phys. 72, 55–60. doi: 10.1016/j.astropartphys.2015.07.002
Nishina, Y., Arakawa, H., Sekido, Y., and Simamura, H. (1940a). Cosmic-ray intensities and typhoons. J. Meteorol. Soc. Jpn. Ser. II 18, 258–261. doi: 10.2151/jmsj1923.18.8_258
Nishina, Y., Sekido, Y., Simamura, H., and Arakawa, H. (1940b). Air mass effect on cosmic-ray intensity. Phys. Rev. 57:1050. doi: 10.1103/PhysRev.57.1050.2
Nishina, Y., Sekido, Y., Simamura, H., and Arakawa, H. (1940c). Cosmic ray intensities in relation to cyclones and anticyclones. Nature 146:95. doi: 10.1038/146095a0
Panneerselvam, C., Nair, K., Selvaraj, C., Jeeva, K., Kumar, C. A., and Gurubaran, S. (2007). Diurnal variation of atmospheric maxwell current over the low-latitude continental station, Tirunelveli, India (8.7 N, 77.8 E). Earth Planets Space 59, 429–435. doi: 10.1186/BF03352704
Rosenthal, S. L. (1970). Experiments with a numerical model of tropical cyclone development: some effects of radial resolution. Monthly Weather Rev. 98, 106–120. doi: 10.1175/1520-0493(1970)098<0106:EWANMO>2.3.CO;2
Styro, D., Damauskaite, J., and Kleiza, J. (2010). Estimation of seasonal variations of hard cosmic ray flux and atmospheric pressure in 2004–2005. J. Environ. Eng. Landsc. Manag. 18, 226–233. doi: 10.3846/jeelm.2010.26
Takeuchi, N., and Katase, A. (1982). Rainout-washout model for variation of environmental gamma-ray intensity by precipitation. J. Nucl. Sci. Technol. 19, 393–409. doi: 10.1080/18811248.1982.9734160
Takeyasu, M., Iida, T., Tsujimoto, T., Yamasaki, K., and Ogawa, Y. (2006). Concentrations and their ratio of 222rn decay products in rainwater measured by gamma-ray spectrometry using a low-background ge detector. J. Environ. Radioact. 88, 74–89. doi: 10.1016/j.jenvrad.2006.01.001
Keywords: gamma-rays, NaI (Tl) detector, cyclone Ockhi, 222Rn daughter elements, air mass
Citation: Datar G, Vichare G, Raghav A, Bhaskar A, Sinha AK and Nair KU (2020) Response of Gamma-Ray Spectrum During Ockhi Cyclone. Front. Earth Sci. 8:15. doi: 10.3389/feart.2020.00015
Received: 31 October 2019; Accepted: 20 January 2020;
Published: 07 February 2020.
Edited by:
Irina Alexandrovna Mironova, Saint Petersburg State University, RussiaReviewed by:
Abouzeid A. Thabet, Pharos University in Alexandria, EgyptAleksandra Nina, Institute of Physics, University of Belgrade, Serbia
Copyright © 2020 Datar, Vichare, Raghav, Bhaskar, Sinha and Nair. This is an open-access article distributed under the terms of the Creative Commons Attribution License (CC BY). The use, distribution or reproduction in other forums is permitted, provided the original author(s) and the copyright owner(s) are credited and that the original publication in this journal is cited, in accordance with accepted academic practice. No use, distribution or reproduction is permitted which does not comply with these terms.
*Correspondence: Gauri Datar, ZGF0YXIuZ291cmlAZ21haWwuY29t