 Song Song
 Zhifeng Wu1*
 Zhenyu He
 Yongsong Su
- 1School of Geographical Sciences, Guangzhou University, Guangzhou, China
- 2School of Geography and Tourism, Chongqing Normal University, Chongqing, China
- 3Southern Marine Science and Engineering Guangdong Laboratory, Guangzhou, China
Intertidal wetland, located at the interface of the continent and ocean, provides significant support to human society. With China being the largest developing country and the second-biggest economy in the world, the intertidal wetland along its coast has been exposed to climate change and over-exploitation for decades. Despite its ecological and economic significance, the distribution and variation of the intertidal wetland remains unknown. In this study, based on a multi-temporal remote sensing archive accumulated since the 1970s, we detected the dynamics of the intertidal wetland along China’s coast, at a spatial resolution of 30 m and a time interval of 20 years, over the course of four decades (1970s–2015). The main objectives of this study lie in (1) examining the distribution of and variation in intertidal wetland extent in temporal and spatial aspects; (2) identifying the main driving force of the intertidal wetland dynamics; and (3) making suggestions for future research and management. The results suggest that the extent of intertidal wetland declined substantially during the last four decades, from 7848 km2 in the 1970s, to 6017 km2 in 1995, and finally to 4895 km2 in 2015. On average, the intertidal wetland was 0.22 km in width along the coast, and about 40% of the extent of intertidal wetland was located along the Jiangsu and Shandong coast in 2015. Width shrinkage was detected to be primarily due to seaward migration of the intertidal wetland as a result of intensive land reclamation for tourism, communication, and transportation, as well as the fishery industry. This study improved our understanding of the vulnerable but valuable transition zone covered by intertidal wetland. A high priority should be given to intertidal wetland conservation and habitat reconstruction with a view to a sustainable future.
Introduction
Intertidal wetlands are environmentally significant coastal zones linking the freshwater river system and the salty oceanic system and serve as a buffer zone between the oceanic and terrestrial ecosystems that is characterized by diverse physicochemical, morphological, and hydrological conditions (Deegan et al., 2012; Murray et al., 2019). The combination of highly varying environmental parameters brings both valuable services (Airoldi and Beck, 2007; Barbier, 2015; Gabler et al., 2017) and ecological vulnerability (Vafeidis et al., 2008; Jankowski et al., 2017; Vázquez-González et al., 2019) to the intertidal wetlands. The services provided by intertidal wetlands include storm protection (Barbier, 2015), shoreline stabilization (Fujii, 2012; Kirwan and Megonigal, 2013), habitat support (Davidson, 2018), pollution purification (Nwipie et al., 2019), carbon sequestration (Ribaudo et al., 2016), and goods and energy generation (Murray et al., 2019; Paterson et al., 2019). Despite the invaluable environmental role and exceptional economic value of intertidal wetland (Costanza et al., 2014; Vázquez-González et al., 2019), intertidal wetland is being lost at an unprecedented rate due to the overwhelming stress caused by climate change, and human interference (Deegan et al., 2012; Murray et al., 2014; Davidson, 2018). Monitoring and management of intertidal flats toward a more sustainable pattern are consequently becoming crucial to prevent coastal erosion, degradation, and destruction of the inhabitants (Syvitski et al., 2009; Mason et al., 2010). Recent research shows the applicability of remote sensing data from earth observation satellites in coastline and coastal wetland tracking, especially at large spatial scale (Murray et al., 2014, 2019; Sagar et al., 2017). Extensive research on coastal flats at local and national scales has been implemented with various data sources, for example, IGBP-DISCover data (Loveland et al., 2000), 500-m MODIS information, the 30-m Landsat TM and ETM + images (Gong et al., 2010), LIDAR model output (Crowell et al., 2011), and the combination of aerial photographs and satellite imagery (Ford, 2013). The majority of studies have focused on coastal parameters, like the coastline, ecosystem, or coastal land use pattern, while the intertidal wetland has not received sufficient investigation. National-wide research on the intertidal zone in China highlighted the social-economic role of the coastal system and mainly focused on description and estimation of the ecological service, biodiversity, management strategy, and countermeasures for the degradation of the coastal wetland, based on statistical information and published reports (Ma et al., 2014; Cui et al., 2016; Gu et al., 2018). Estimation of Chinese intertidal flats and wetland based on remote sensing data has attracted a large amount of attention in recent years, especially at local scale (Wei et al., 2015; Chen et al., 2016; Wu X. et al., 2017). A recent national-wide study provided a glimpse of the intertidal flats from 1986 to 2016 based on the google earth engine (GEE) (Wang et al., 2018), but it missed the crucial time range since the Opening Up policy was put in place in 1976. In addition, the GEE results are advantageous for data acquisition efficiency but are relatively higher and might need further calibration to be compatible with the observed data (Murray et al., 2014).
The accelerating rate of intertidal wetland loss and deterioration, and its significance in coastal defense and ecological service supporting result in severe human-wetland conflicts. Dynamic intertidal wetland monitoring would fully investigate this valuable resource to a uniform standard and provide a database foundation for further evaluation, restoration, and protection analysis, especially in rapidly developing countries like China. Besides, only statistical data and paper maps were available as information sources in related research on coastal wetland. The difficulty of effective data acquisition impeded the survey, estimation, and assessment of the intertidal wetland at a large spatial scale. The accumulation of a long-term remote sensing archive with sufficient spatial resolution had enabled synoptic, integrated, and spatio-temporal perspectives in the comprehensive research of land-use change and natural resource management. Despite the widespread application of remote sensing data and its related techniques in intertidal flats and coastal resources all over the world, no systematic investigation of intertidal wetland along the entire Chinese coast has been carried out to our knowledge. In this study, we mapped the multi-temporal intertidal wetland patterns at national and provincial scales based on the high-resolution remoting sensing images in the 1970s, 1995, and 2015. Through the comparison of slices at two-decade intervals, the exceptional dynamics of the intertidal wetland are illustrated, the spatial and temporal variation of the intertidal wetland is analyzed, and the driving mechanisms of the variation are discussed.
Materials and Methods
Study Area
The continental coastline of China starts in Dandong, Liaoning Province, and ends in Zhushan, Guangxi Province, stretching over 18000 km; the remaining 14000 km is composed of island coastline (Figure 1A). The continental part stretches over nearly 20 latitudes and covers three climatic regions, namely warm temperate, subtropical, and tropical regions from north to south (Hou et al., 2016).
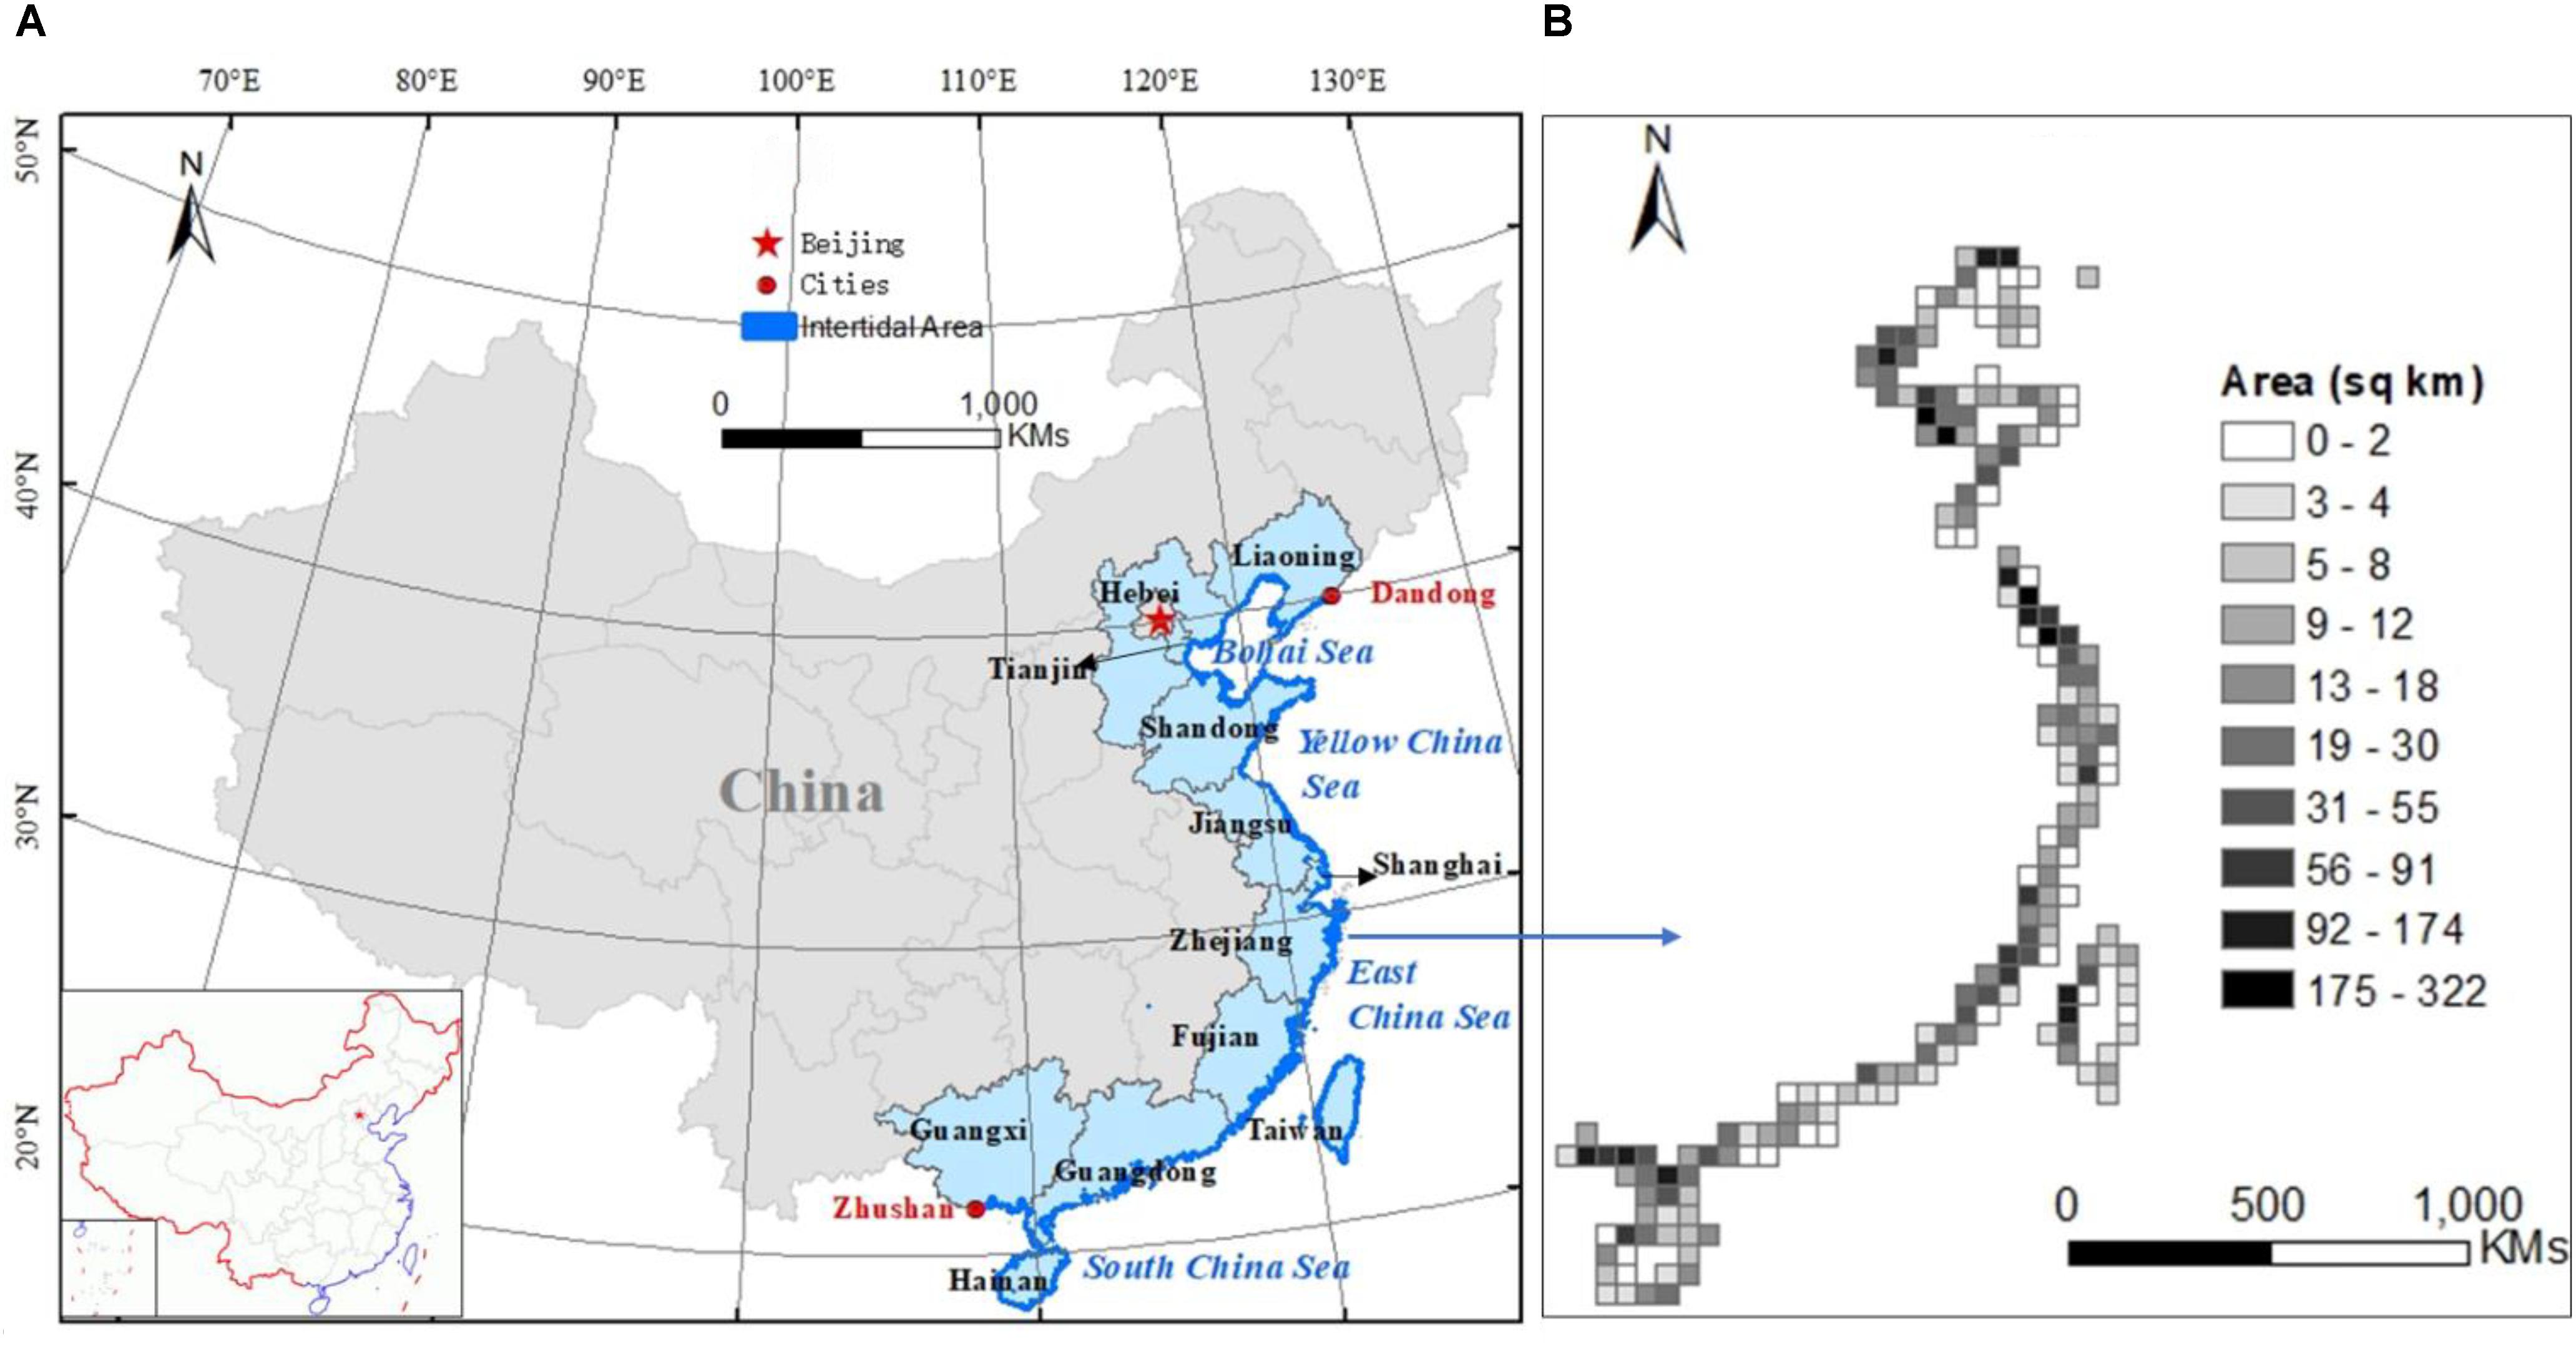
Figure 1. The location of the Chinese intertidal zone (A) and its area distribution at 50-km resolution (B). The location and distribution map are based on 2015 data.
A variety of coast types have been recognized, including bedrock, sandy, silty mud, artificial, and estuary. In total, 14 administrative areas with various economic strengths sit beside the coastline (Figure 1A and Table 1). To the east of the coastline are the Bohai Sea, Yellow Sea, East China Sea, and South China Sea from north to south, whose tidal fluctuations generate a strip of intertidal wetland along the coast. In 2015 documents, 4873 km2 of intertidal wetland was identified, spanning unevenly over the coast, and within the administrative regions (Figure 1B). The combination of the varied physical and economic environments results in multiple exploitation levels of the intertidal region.
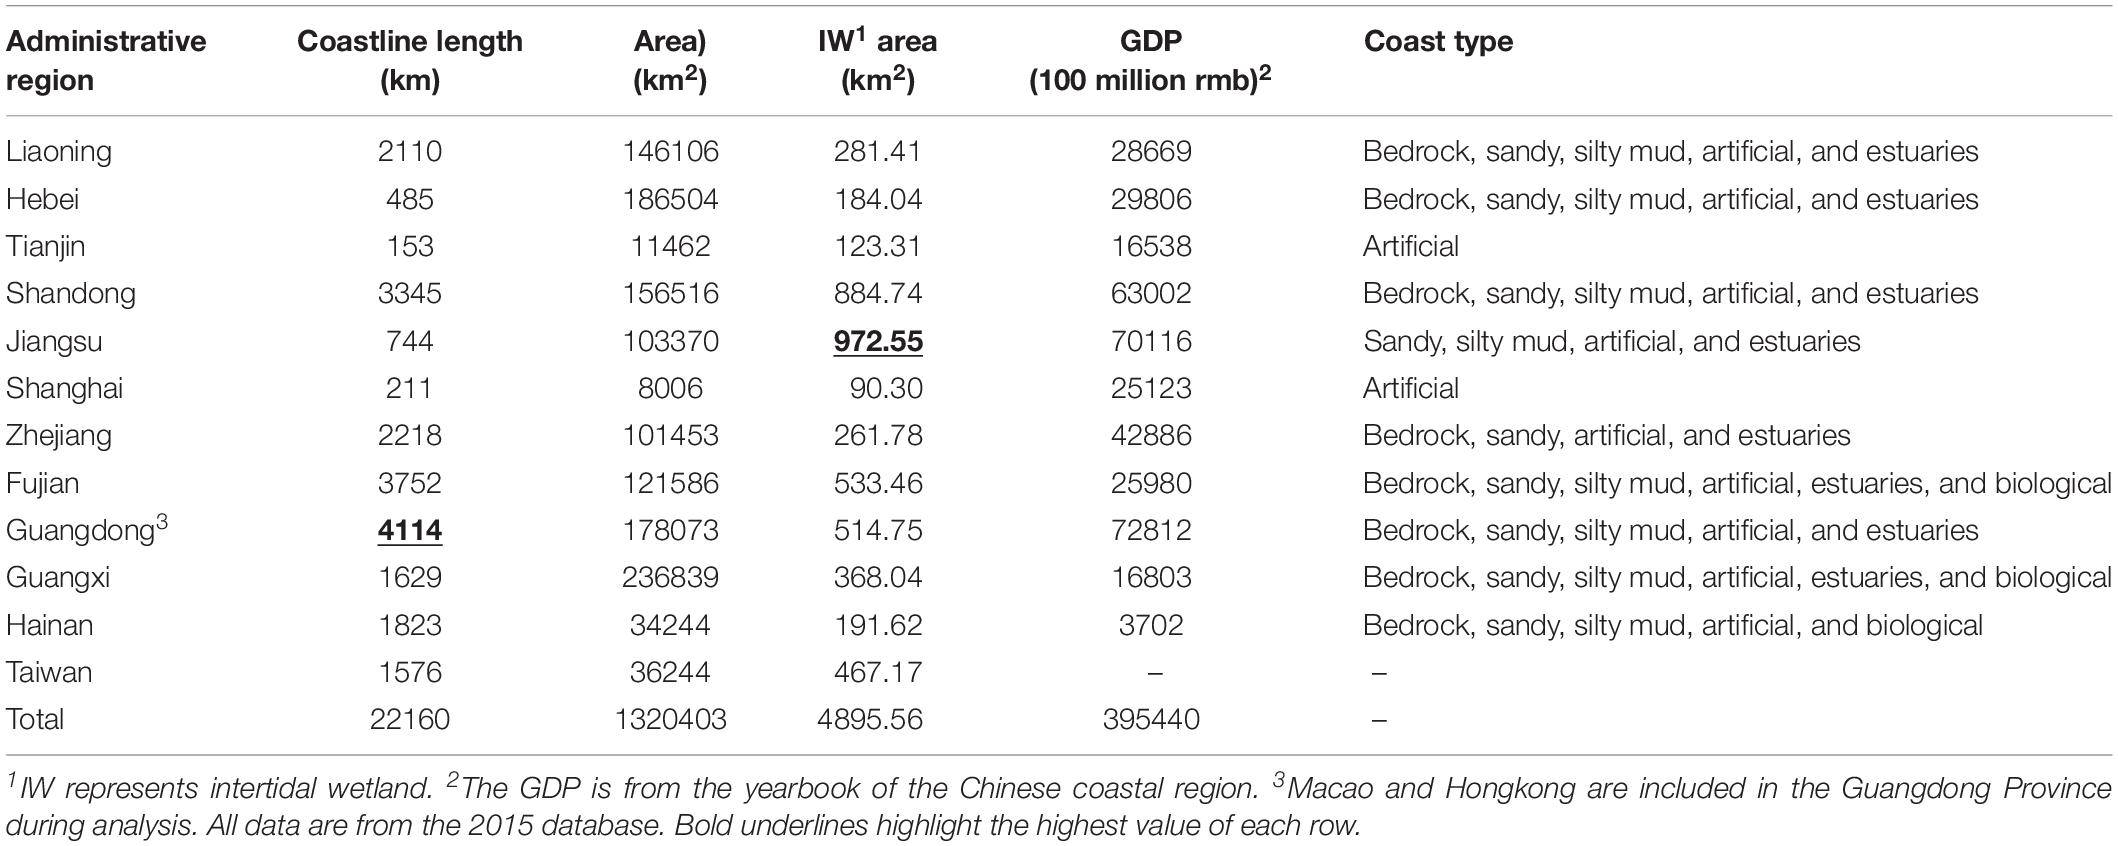
Table 1. Intertidal wetland distribution and coast type among provinces.
Data Acquisition and Processing
The term intertidal wetland refers to the region between the highest and lowest tide level, which is regularly submerged at high tide but exposed above sea level at low tide (Figure 2). Landsat-MSS/TM/8 multi-temporal satellite image data from the 1970s, 1995, and 2015 covering the study area were collected and interpreted with human-PC interactive technology (Table 2). The intertidal wetland can be clearly recognized from the false-color composited images of the remote-sensed data according to characteristic symbols. Unified interpretation symbols are essential for the participating experts. After discussion and literature study, the unified symbols were defined as a stripped or patched area along the visible shoreline, yellow-white, gray-white, or white in color with red-yellow stripes. Generally, the intertidal wetland exhibited a relatively even image structure compared with the part of the coastal region further inland.
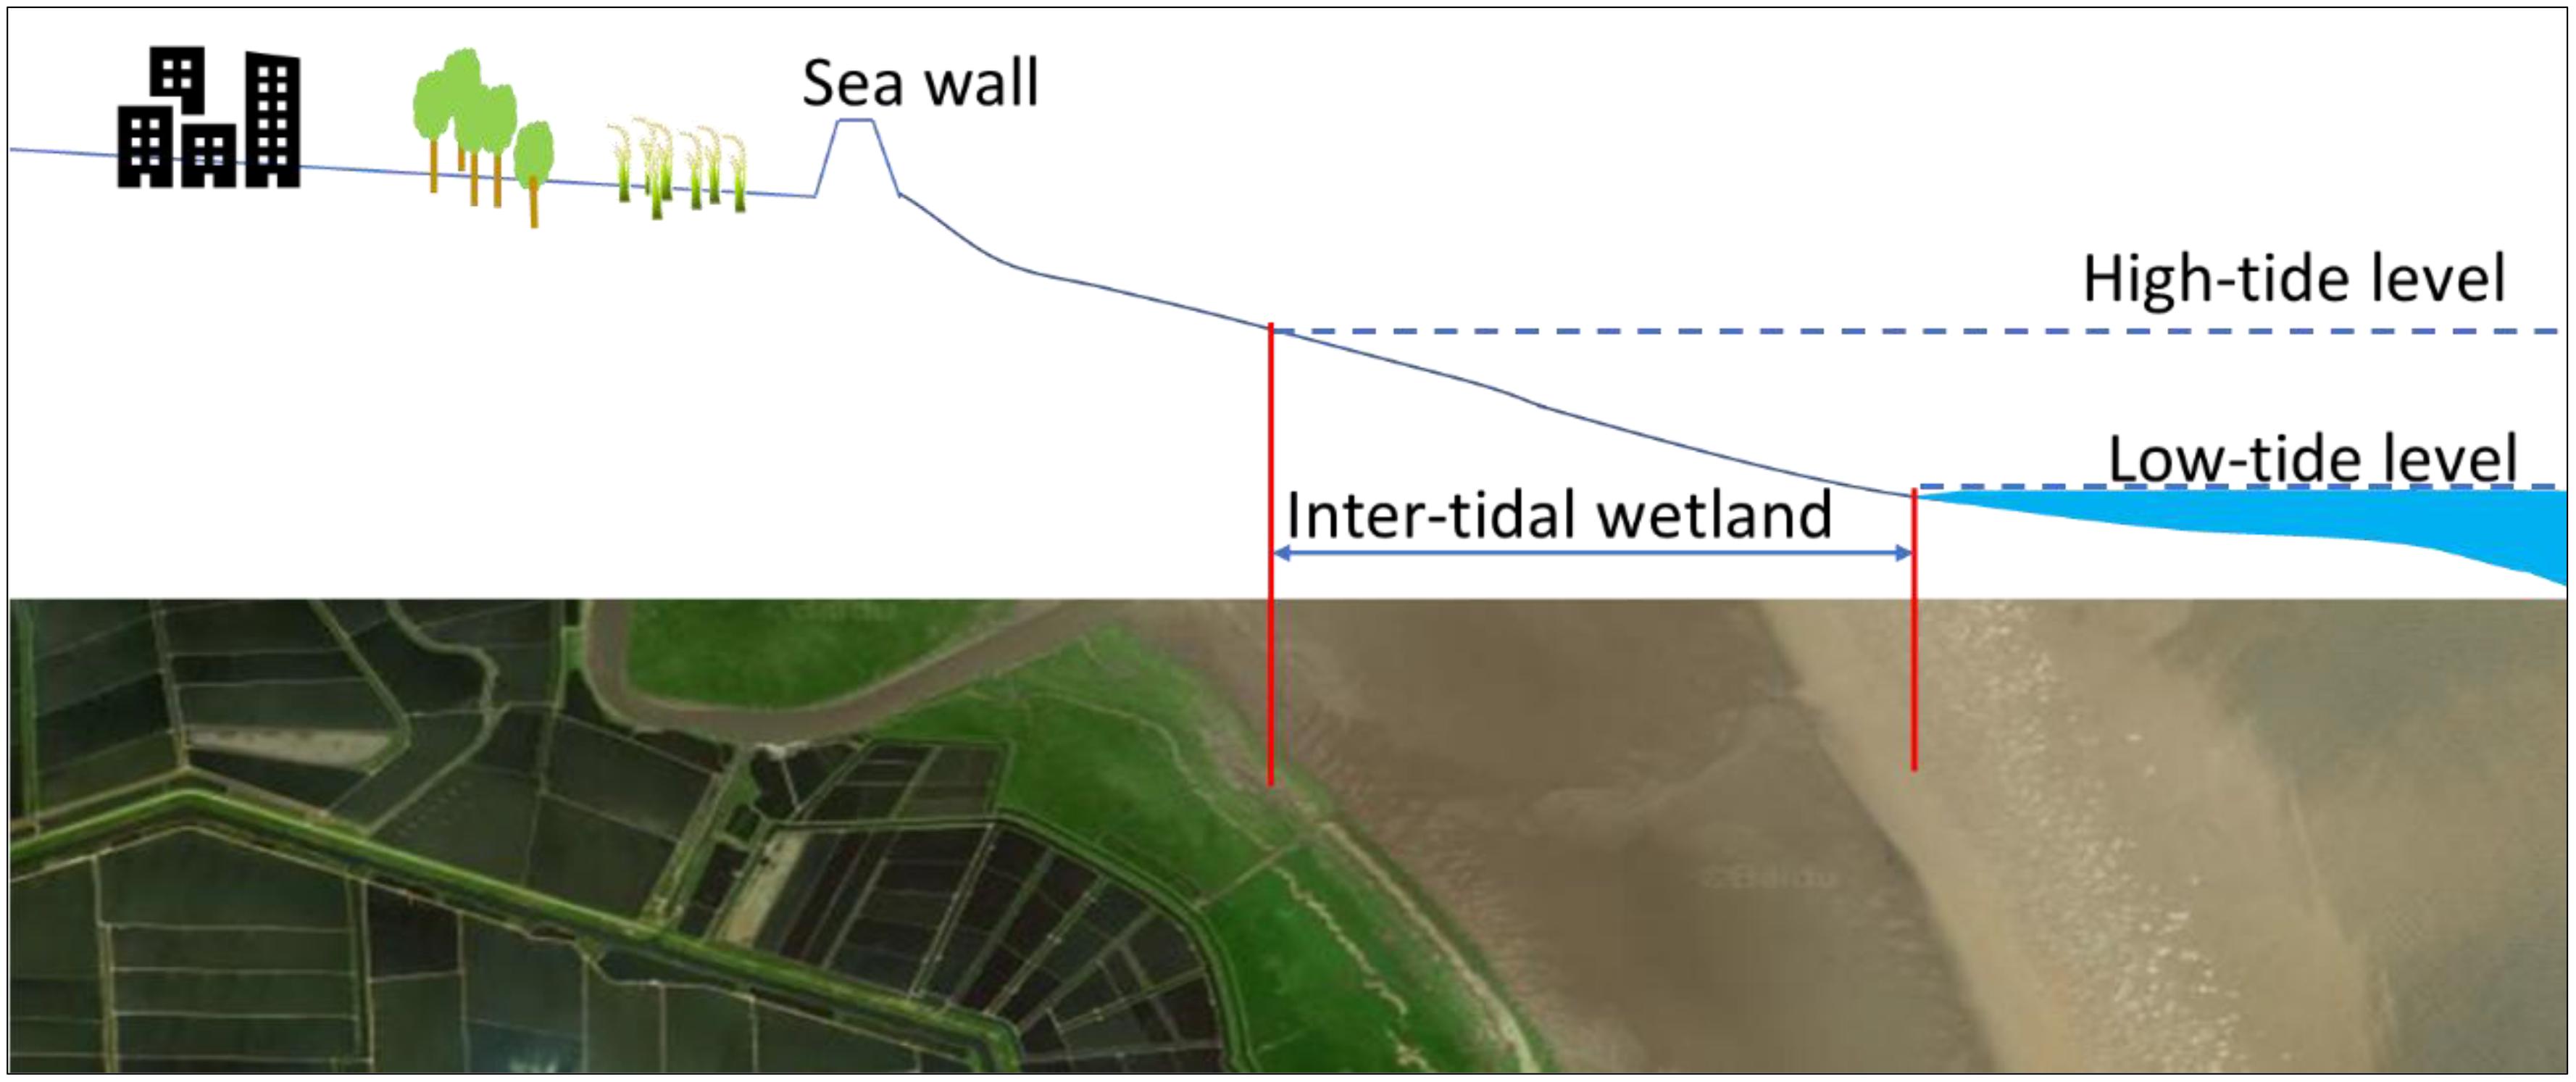
Figure 2. Selection and processing of a satellite image.

Table 2. Data sources for the intertidal wetland mapping.
The procedure of the image human-PC interpretation is shown in Figure 3. In order to improve the accuracy of the mapping, the national land use land cover thematic maps with a scale of 1:10 were integrated into the intertidal wetland classification. By carefully selecting images with a low amount of cloud and high visibility, the intertidal wetland extents in the 1970s, 1995, and 2015 were extracted. The national costal map of the corresponding time period was adopted to correct and improve the mapping quality.
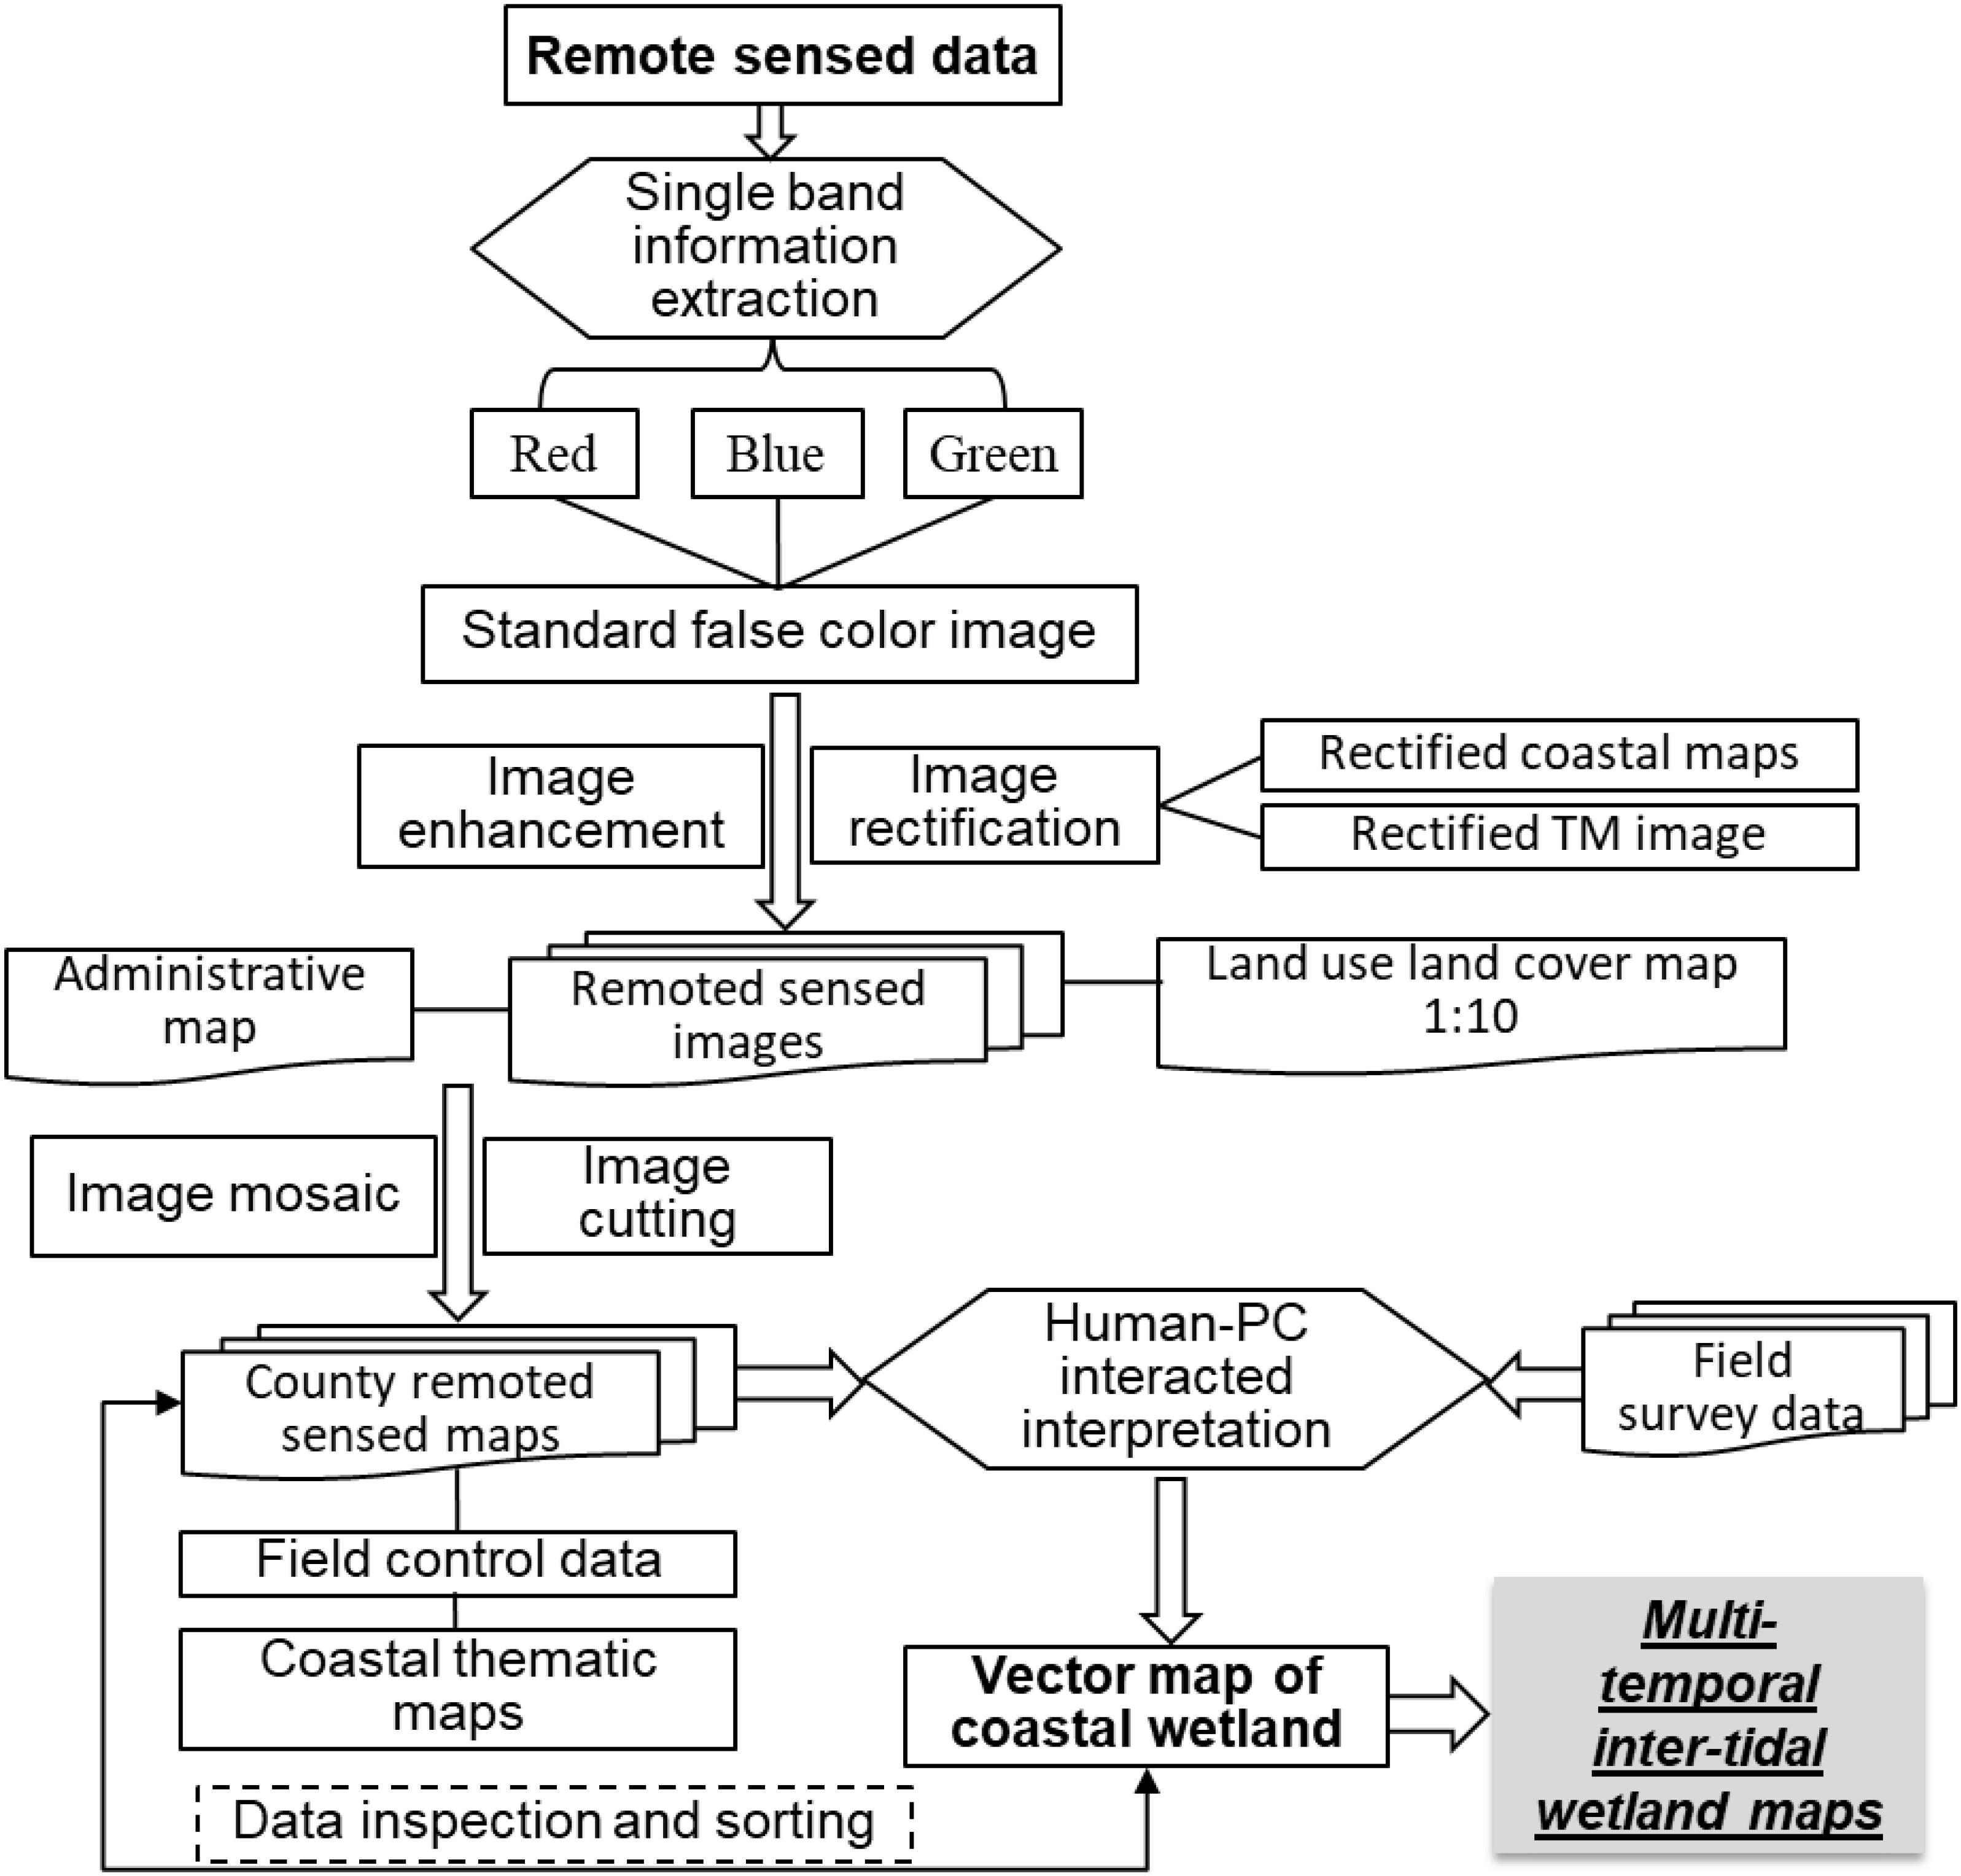
Figure 3. Image interpretation procedure.
Precision Validation
The error of patch location or interpretation was mainly caused by the image quality and human error. We adopted a random sampling inspection of field survey points to check the accuracy of the final inter-tidal wetland maps. The accuracy level was classified on a scale of 0 to 10, where 0 meant totally incorrect and 10 represented 100% correct. The overall precision was calculated as follows,
We sampled 653 patches of different coastal line types along the Bohai Sea, Yellow China Sea, East China Sea, and South China Sea and compared the field survey results and interpreted map of 2015 (Figure 4). The accuracy is related to the coast type (Table 3). Intertidal wetland located on an artificial coastal line showed the highest accuracy, while silty mud coastal wetland demonstrated relatively low accordance between the field surveyed and interpreted data. The overall precision of the intertidal wetland-identification reached 88.51% (Table 3).
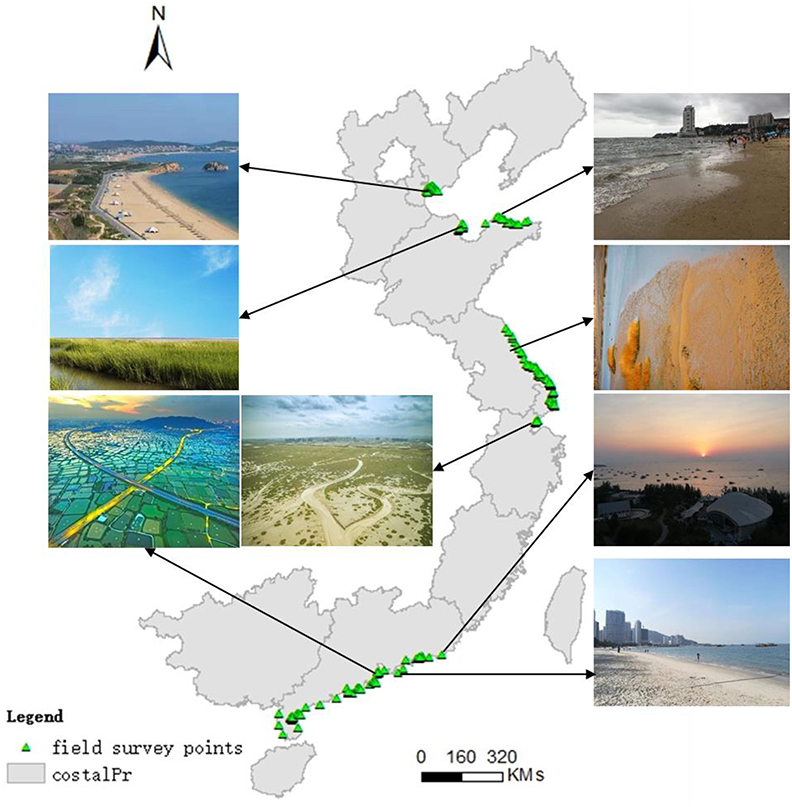
Figure 4. Distribution of the field survey points.
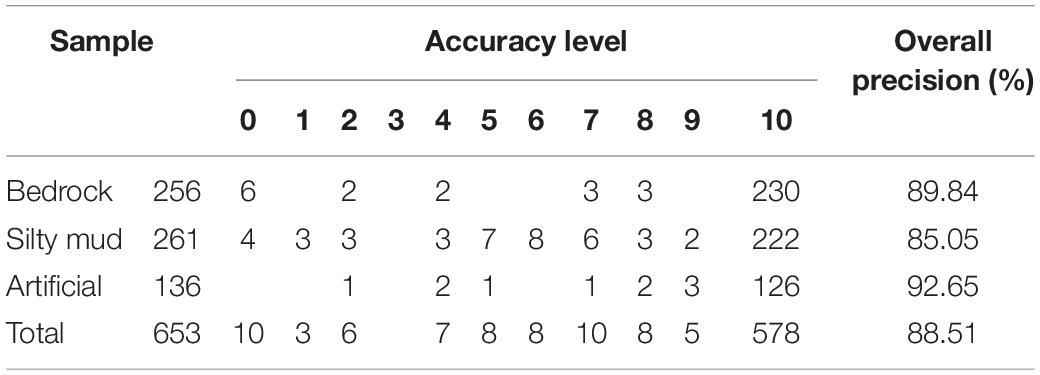
Table 3. Precision of the 2015 interpreted intertidal wetland validated by field survey.
Results
Current Distribution of the Intertidal Wetlands
Decline in the Intertidal Area
The areal extent of intertidal flats along China’s coast showed an extensive decline, from 7848.21 km2 in the 1970s, decaying to 6017 km2 in 1995, and, finally, to only 4895 km2 two decades later (Table 4). Almost 37.62% of the intertidal wetland has disappeared in the last 40 years, with a relatively higher decrease rate from the 1970s to 1995. In addition to the areal decrease, the patch number of the intertidal wetland has grown during the study period, implying increased fragmentation of the intertidal wetland. The average area of each wetland patch increased slightly from 1.27 to 1.49 km2 in the former period and reduced substantially to 0.51 km2 in the latter period.
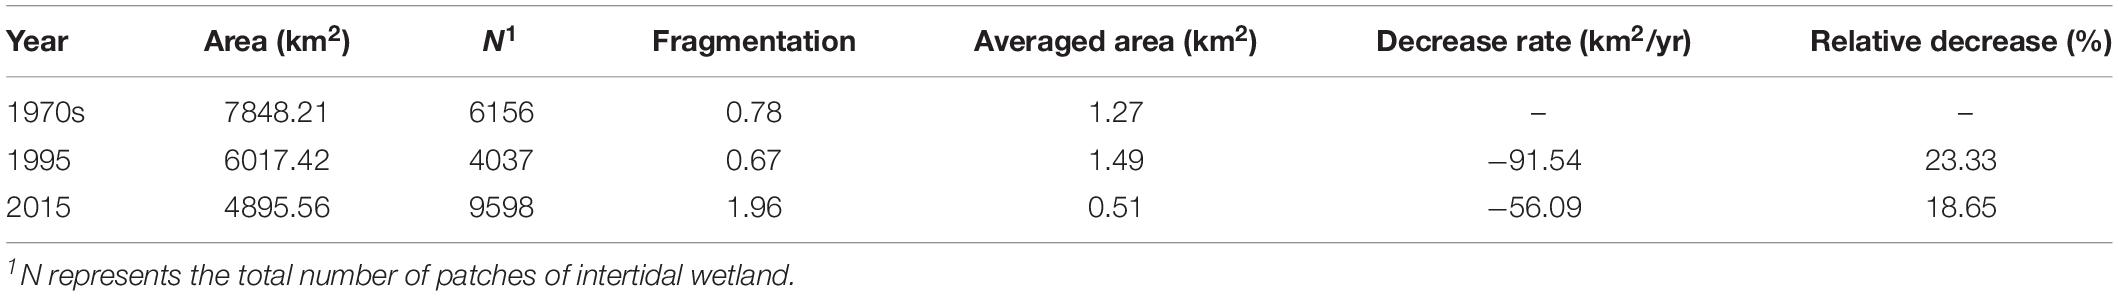
Table 4. Total intertidal wetland conditions in the 1970s, 1995, and 2015.
Provincial Distribution and Change
As shown in Table 1, the intertidal wetland was unevenly distributed along the administrative coast. Guangdong has the highest coastline length, while the most significant contributor of intertidal wetland area was Shandong during the 1970s to 1995, shifting to Jiangsu in 2015 (Figure 5A). Shandong and Jiangsu constituted nearly 40% of the total extent of intertidal wetland in 2015. Tianjin and Shanghai have relatively little intertidal wetland, due to their short coastlines and small administrative areas.
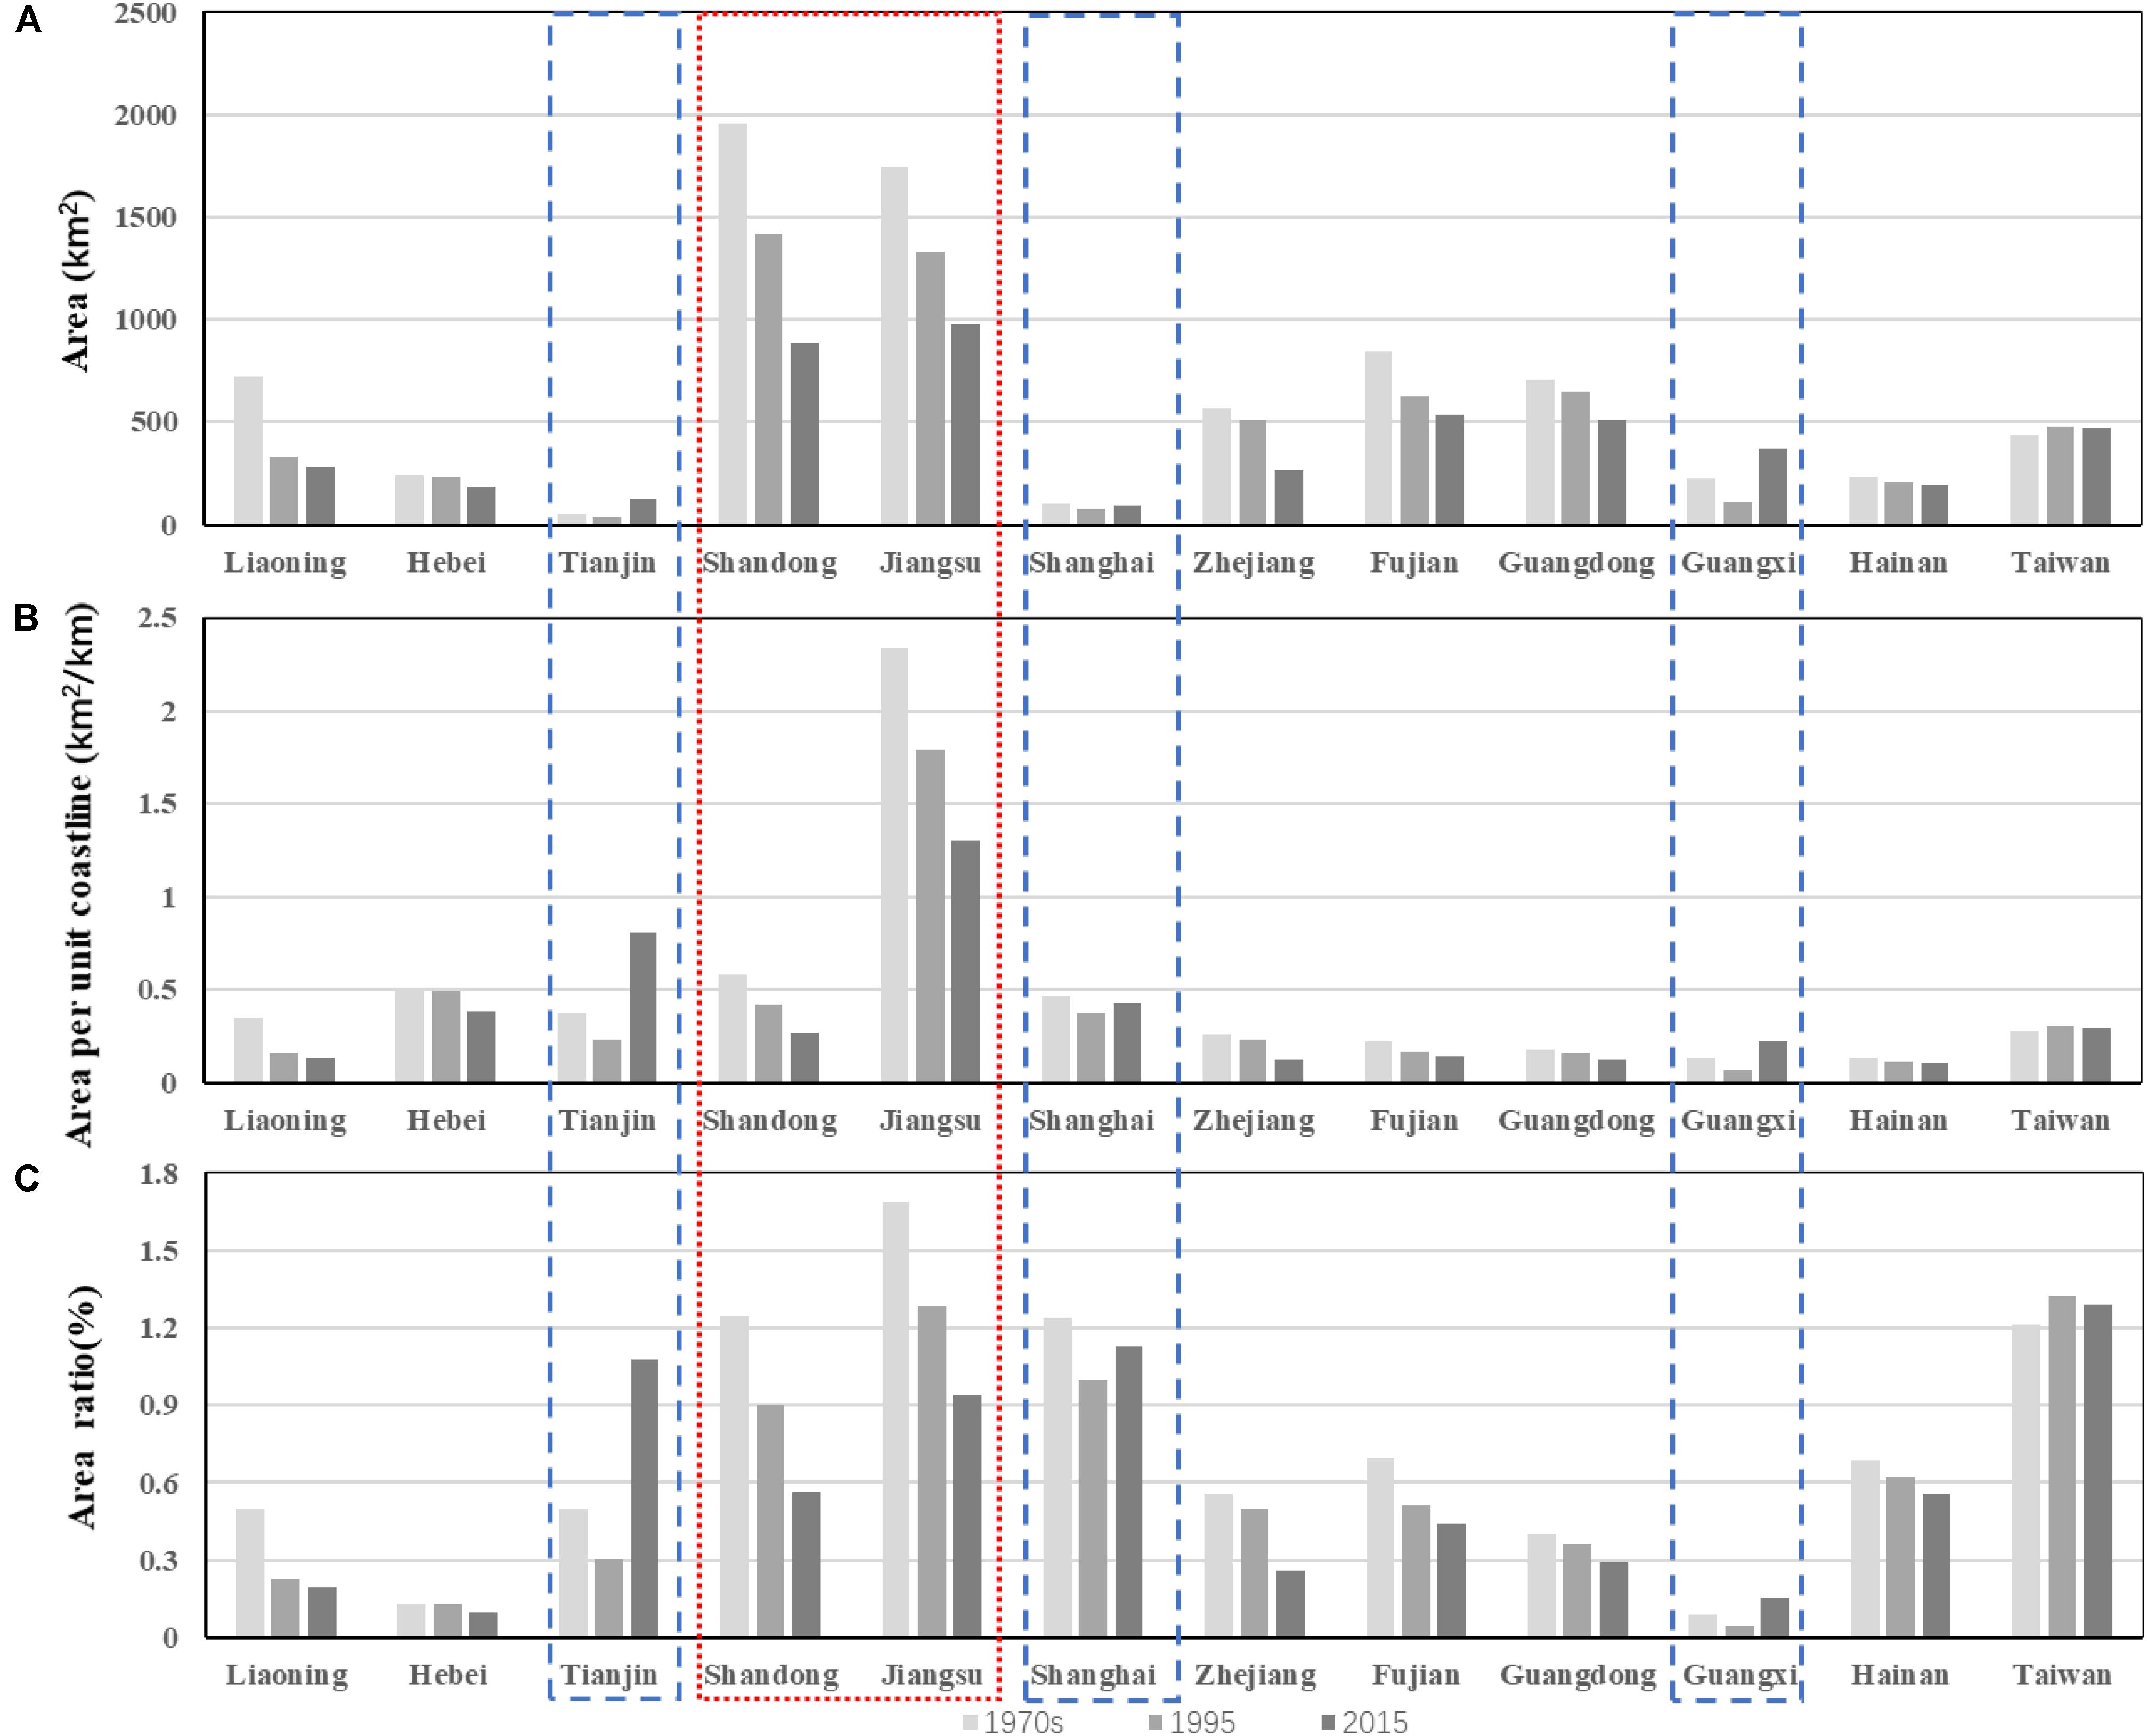
Figure 5. Decrease in the intertidal area of each administrative region, (A) total area, (B) area per coastal line, (C) intertidal area to provincial area ratio. The regions in the red dotted rectangule are the major contributor to the degradation of the intertidal wetland area, while those in blue dashed rectangles represent the areas that increased in the later period.
All administrative regions, except Taiwan, showed a decreasing trend in the intertidal wetland area from the 1970s to 1995. There was a slight increase in intertidal wetland area in Tianjin, Shanghai, and Guangxi from 1995 to 2015, while that in all the other administrative units illustrated a continuous decline in the same period (Figure 5A).
Similarly to the total area, the intertidal wetland area per unit coastline (A/L) in China has been on the decline in general, from 0.35 km2/km in the 1970s to 0.27 km2/km in 1995 and then to 0.22 km2/km in 2015. Jiangsu exhibited the highest absolute amount and decline range in intertidal wetland area per unit coastline, shrinking from 2.34 km2/km to 1.30 km2/km during the last 40 years, equating to an average reduction of 1.04 km in width along the coast (Figure 5B). The intertidal wetland area per unit coastline in nearly all other areas except Tianjin was lower than 0.5 km2/km in 2015.
The area ratio of intertidal wetland to administrative region (IWR) revealed distinct spatial and temporal variation (Figure 5C). On average, the IWR reduced from 0.59% to 0.45% in the earlier period and then declined to 0.37% in the latter period. In the 1970s, four regions had an IWR of over 1%: Shandong, Jiangsu, Shanghai, and Taiwan. With the loss of intertidal wetland, the IWR of Shandong decreased severely by 0.3% in 1990s, while those of the other three regions were still over 1%. Continuous degradation of intertidal wetland in Jiangsu and an abrupt area increase in new intertidal wetland in Tianjin occurred in the following period. Finally, the IWR values of Tianjin, Shanghai, and Taiwan were higher than 1% in 2015.
Change Rate of the Intertidal Wetland
The change rates of the intertidal wetland in the two periods studied are given in Table 5. The decline rate from the 1970s to 1995 was slightly higher than that between 1995 and 2015, with an annual average of 1.17% and 0.94%, respectively. Spatially, the highest rate of wetland loss in both periods was in Jiangsu, and Shandong ranked second in wetland loss rate in the previous period. In Tianjin and Guangxi, a fast growth rate of wetland area was revealed, and minor gains of wetland occurred in Shanghai from 1995 to 2015.
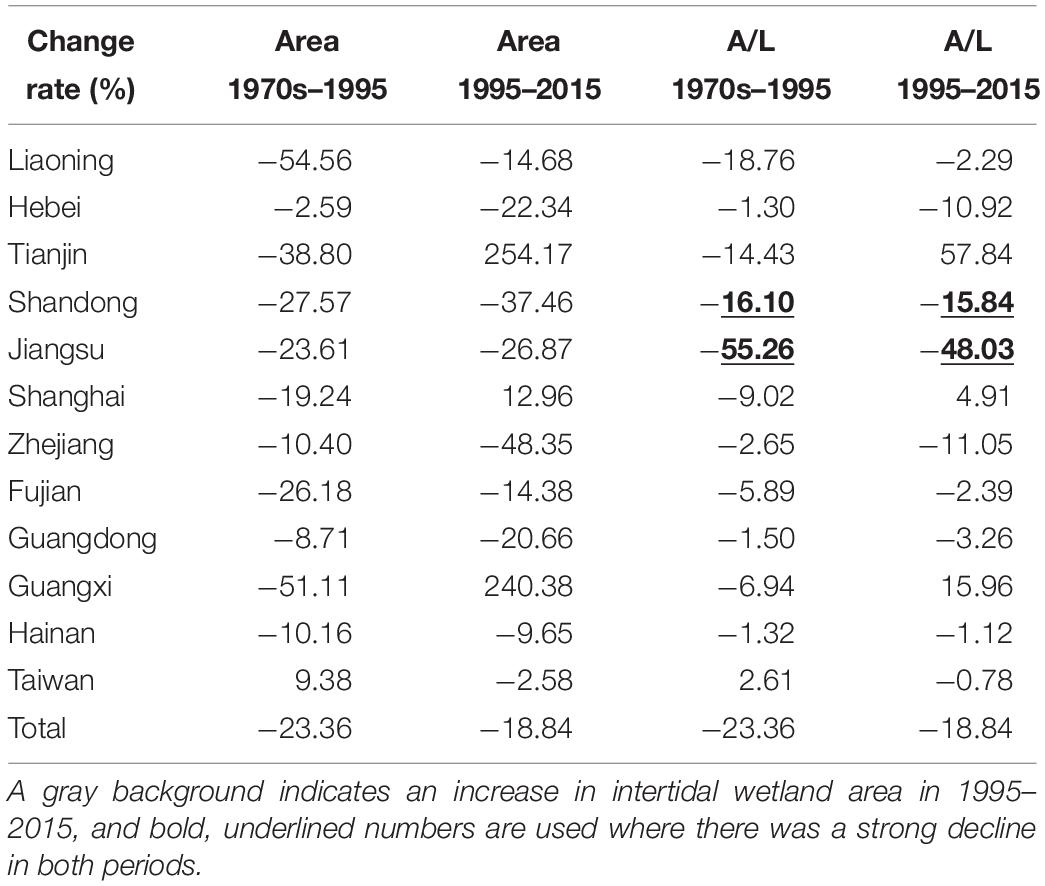
Table 5. Change rate of the area and A/L of intertidal wetland.
Temporal-Spatial Dynamics of the Intertidal Wetlands
Dynamic Spatial Variation
Intertidal wetland loss along China’s coast was spatially pervasive (Figure 6). From the 1970s to 1995, 60% of the grid squares suggested loss of intertidal wetland, with an average decline of 34.90 km2 in each, while the remaining 40% remained the same or indicated minor growth by 3.53 km2 each. By contrast, intertidal wetland degradation occurred in 67% of the grid squares, with a loss of 20.46 km2 per grid square from 1995 to 2015, and the remaining 33% showed a similar growth range to the previous period. This suggested even more widespread and fragmented intertidal wetland loss, with a smaller decline magnitude in the latter period.
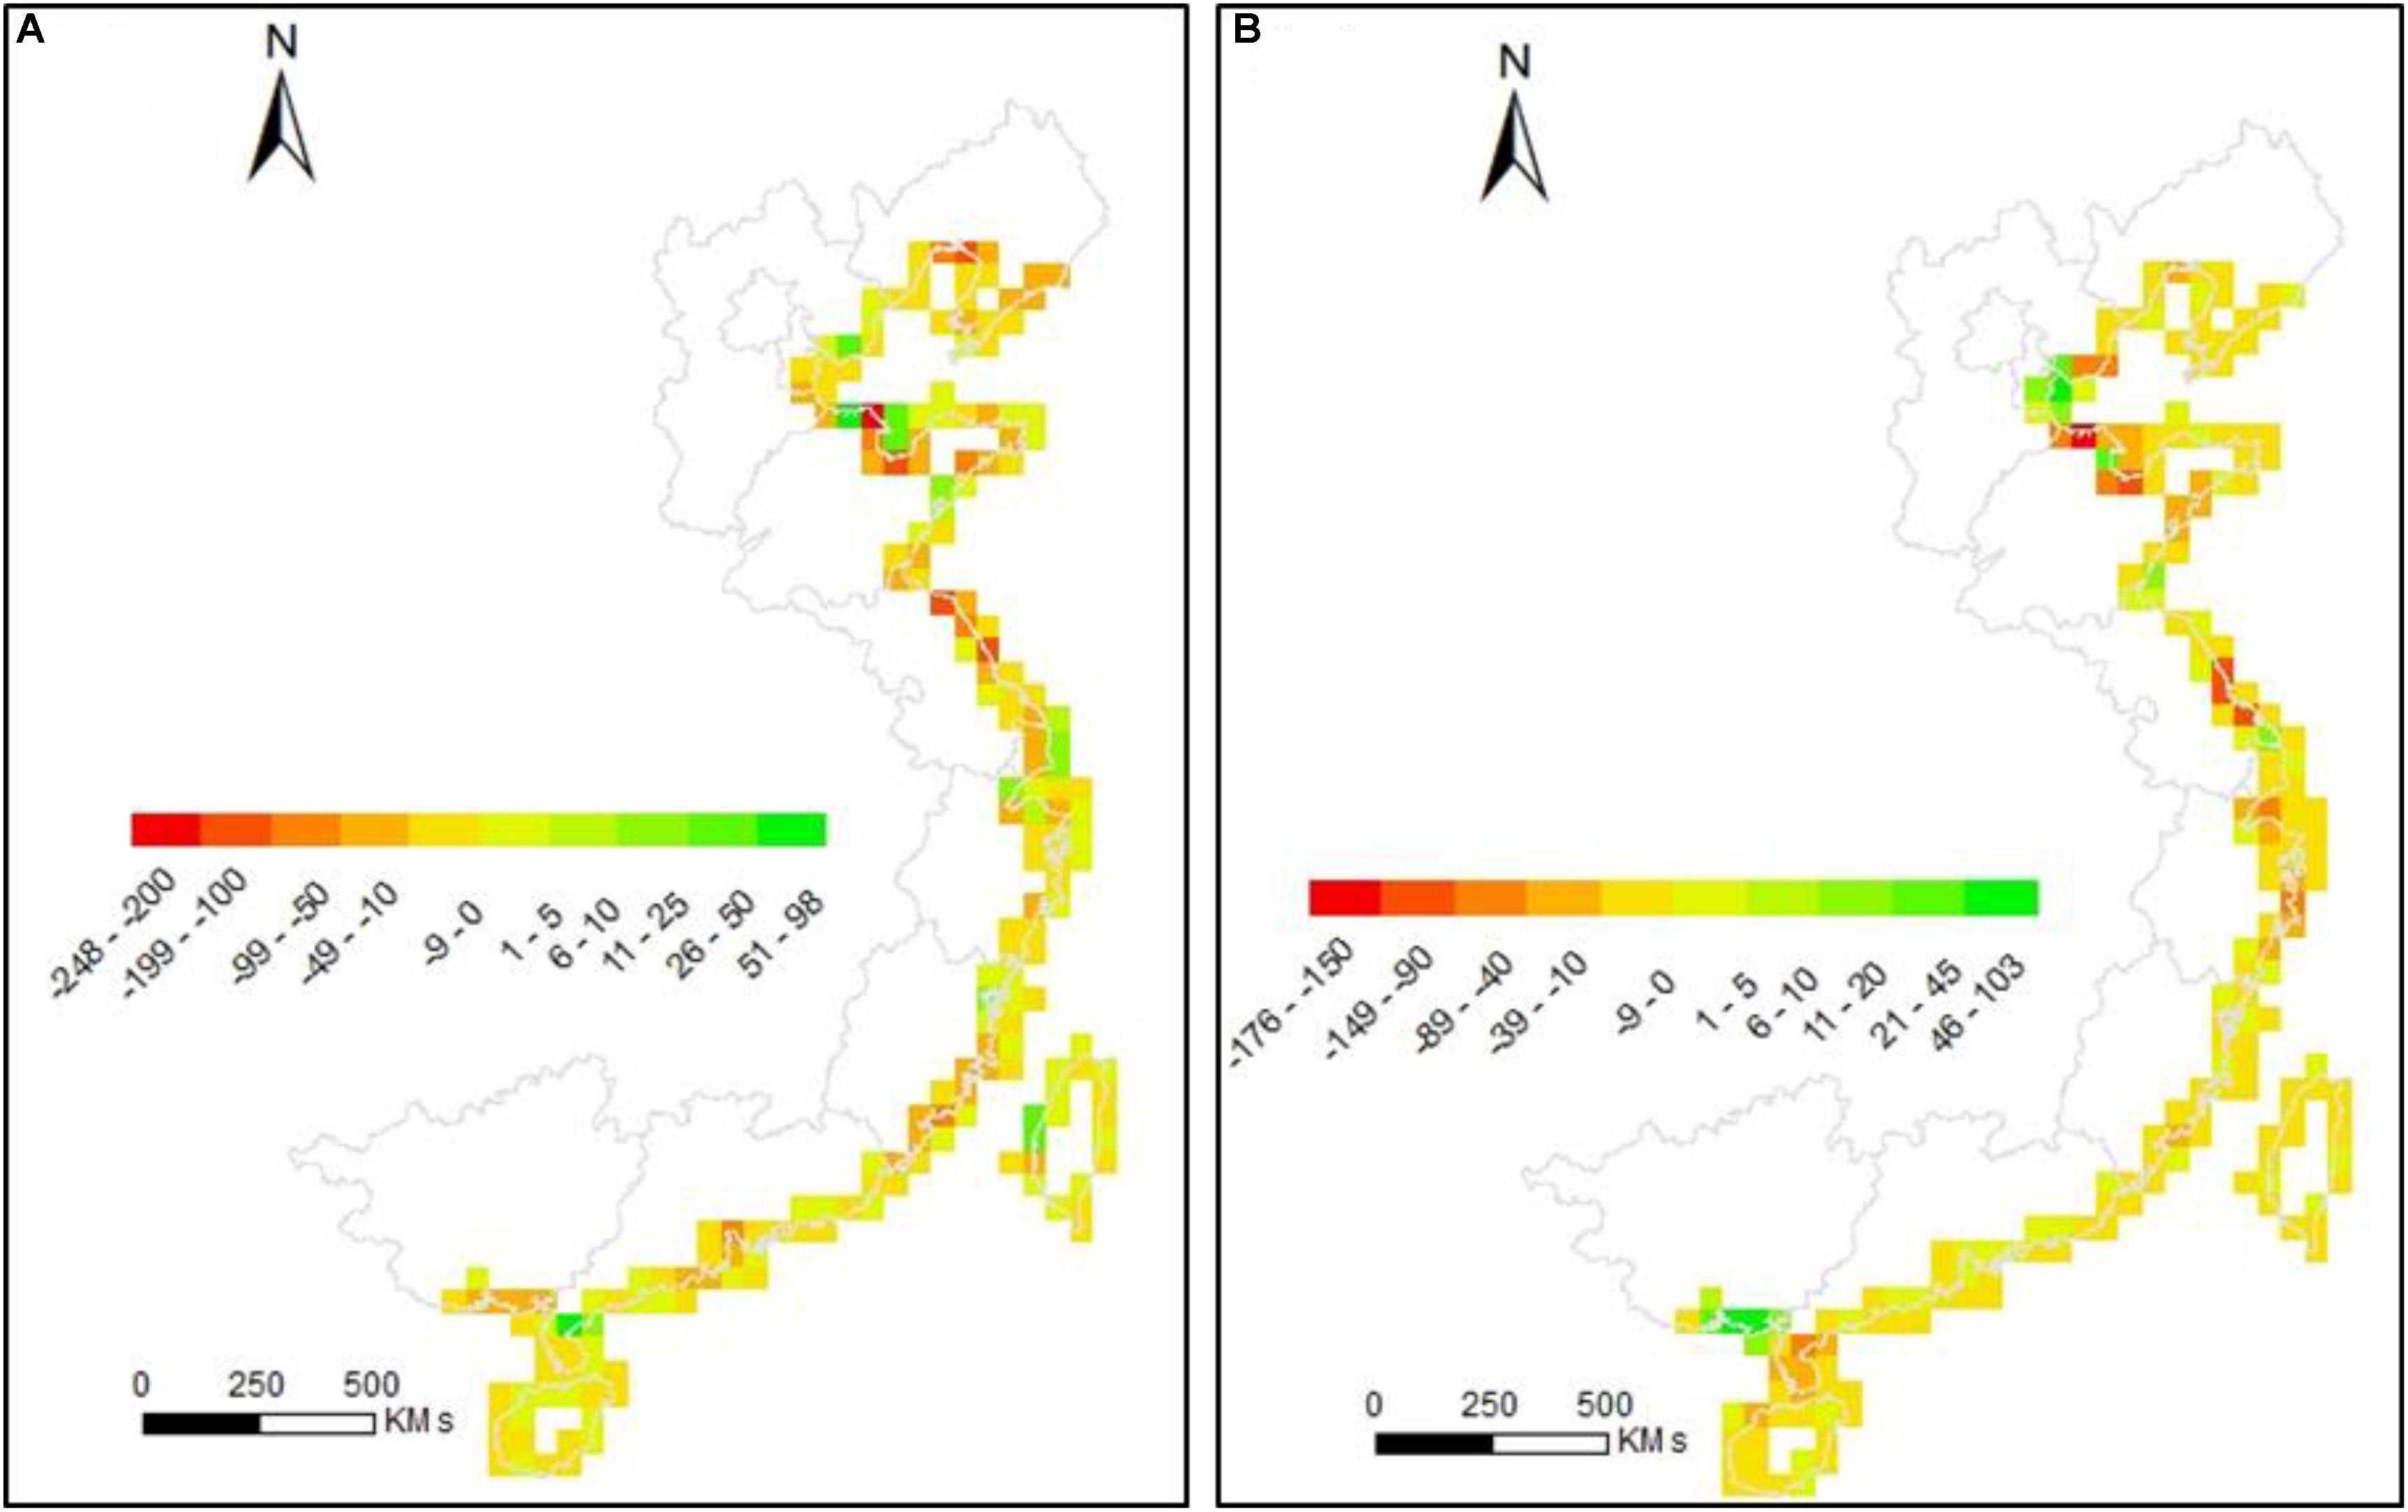
Figure 6. Area change of intertidal wetland from the 1970s to 1995 (A), and from 1995 to 2015 (B) at a spatial resolution of 50 km.
Reduction in Wetland Widths
The intertidal wetland edge on the continental side has been pushed rapidly seaward due to wetland occupation during the study period, according to the satellite archive. This correspondingly resulted in a reduction in the width of the intertidal wetland. We mapped the extent of the intertidal wetland across the northern Shandong and Jiangsu coastal region at three time periods, the 1970s, 1995, and 2015 (Figures 7A–H). In the northern Shandong coastal region, a vast extent of intertidal wetland disappeared on the continental side, especially from the 1970s to 1995 (Figure 7A). The average width of the intertidal wetland dropped from 4.52 km to 2.03 km and then to 0.91 km in the 20-year time intervals during the study period (Figures 7A–D). Due to the influence of the mouth of the Yellow River, slight gains in intertidal wetland happened around the mouth. Jiangsu possesses a straight coastline and a wide tidal flat with sufficient sediment supply, generating the widest stretches of intertidal wetland in China (Figures 7E–H). The irregular patches of intertidal wetland on the continental side were wiped out in the earlier period, causing a loss of 30% of the intertidal wetland (Figure 7E). The inner side of the intertidal wetland continued migrating seaward from 1995 to 2015, leading to another 35% decay of the intertidal wetland extent, equating to a shrinkage of 0.57 km in width. Approximately, the width of the intertidal wetland in Jiangsu has declined by 1.3 km in the last four decades.
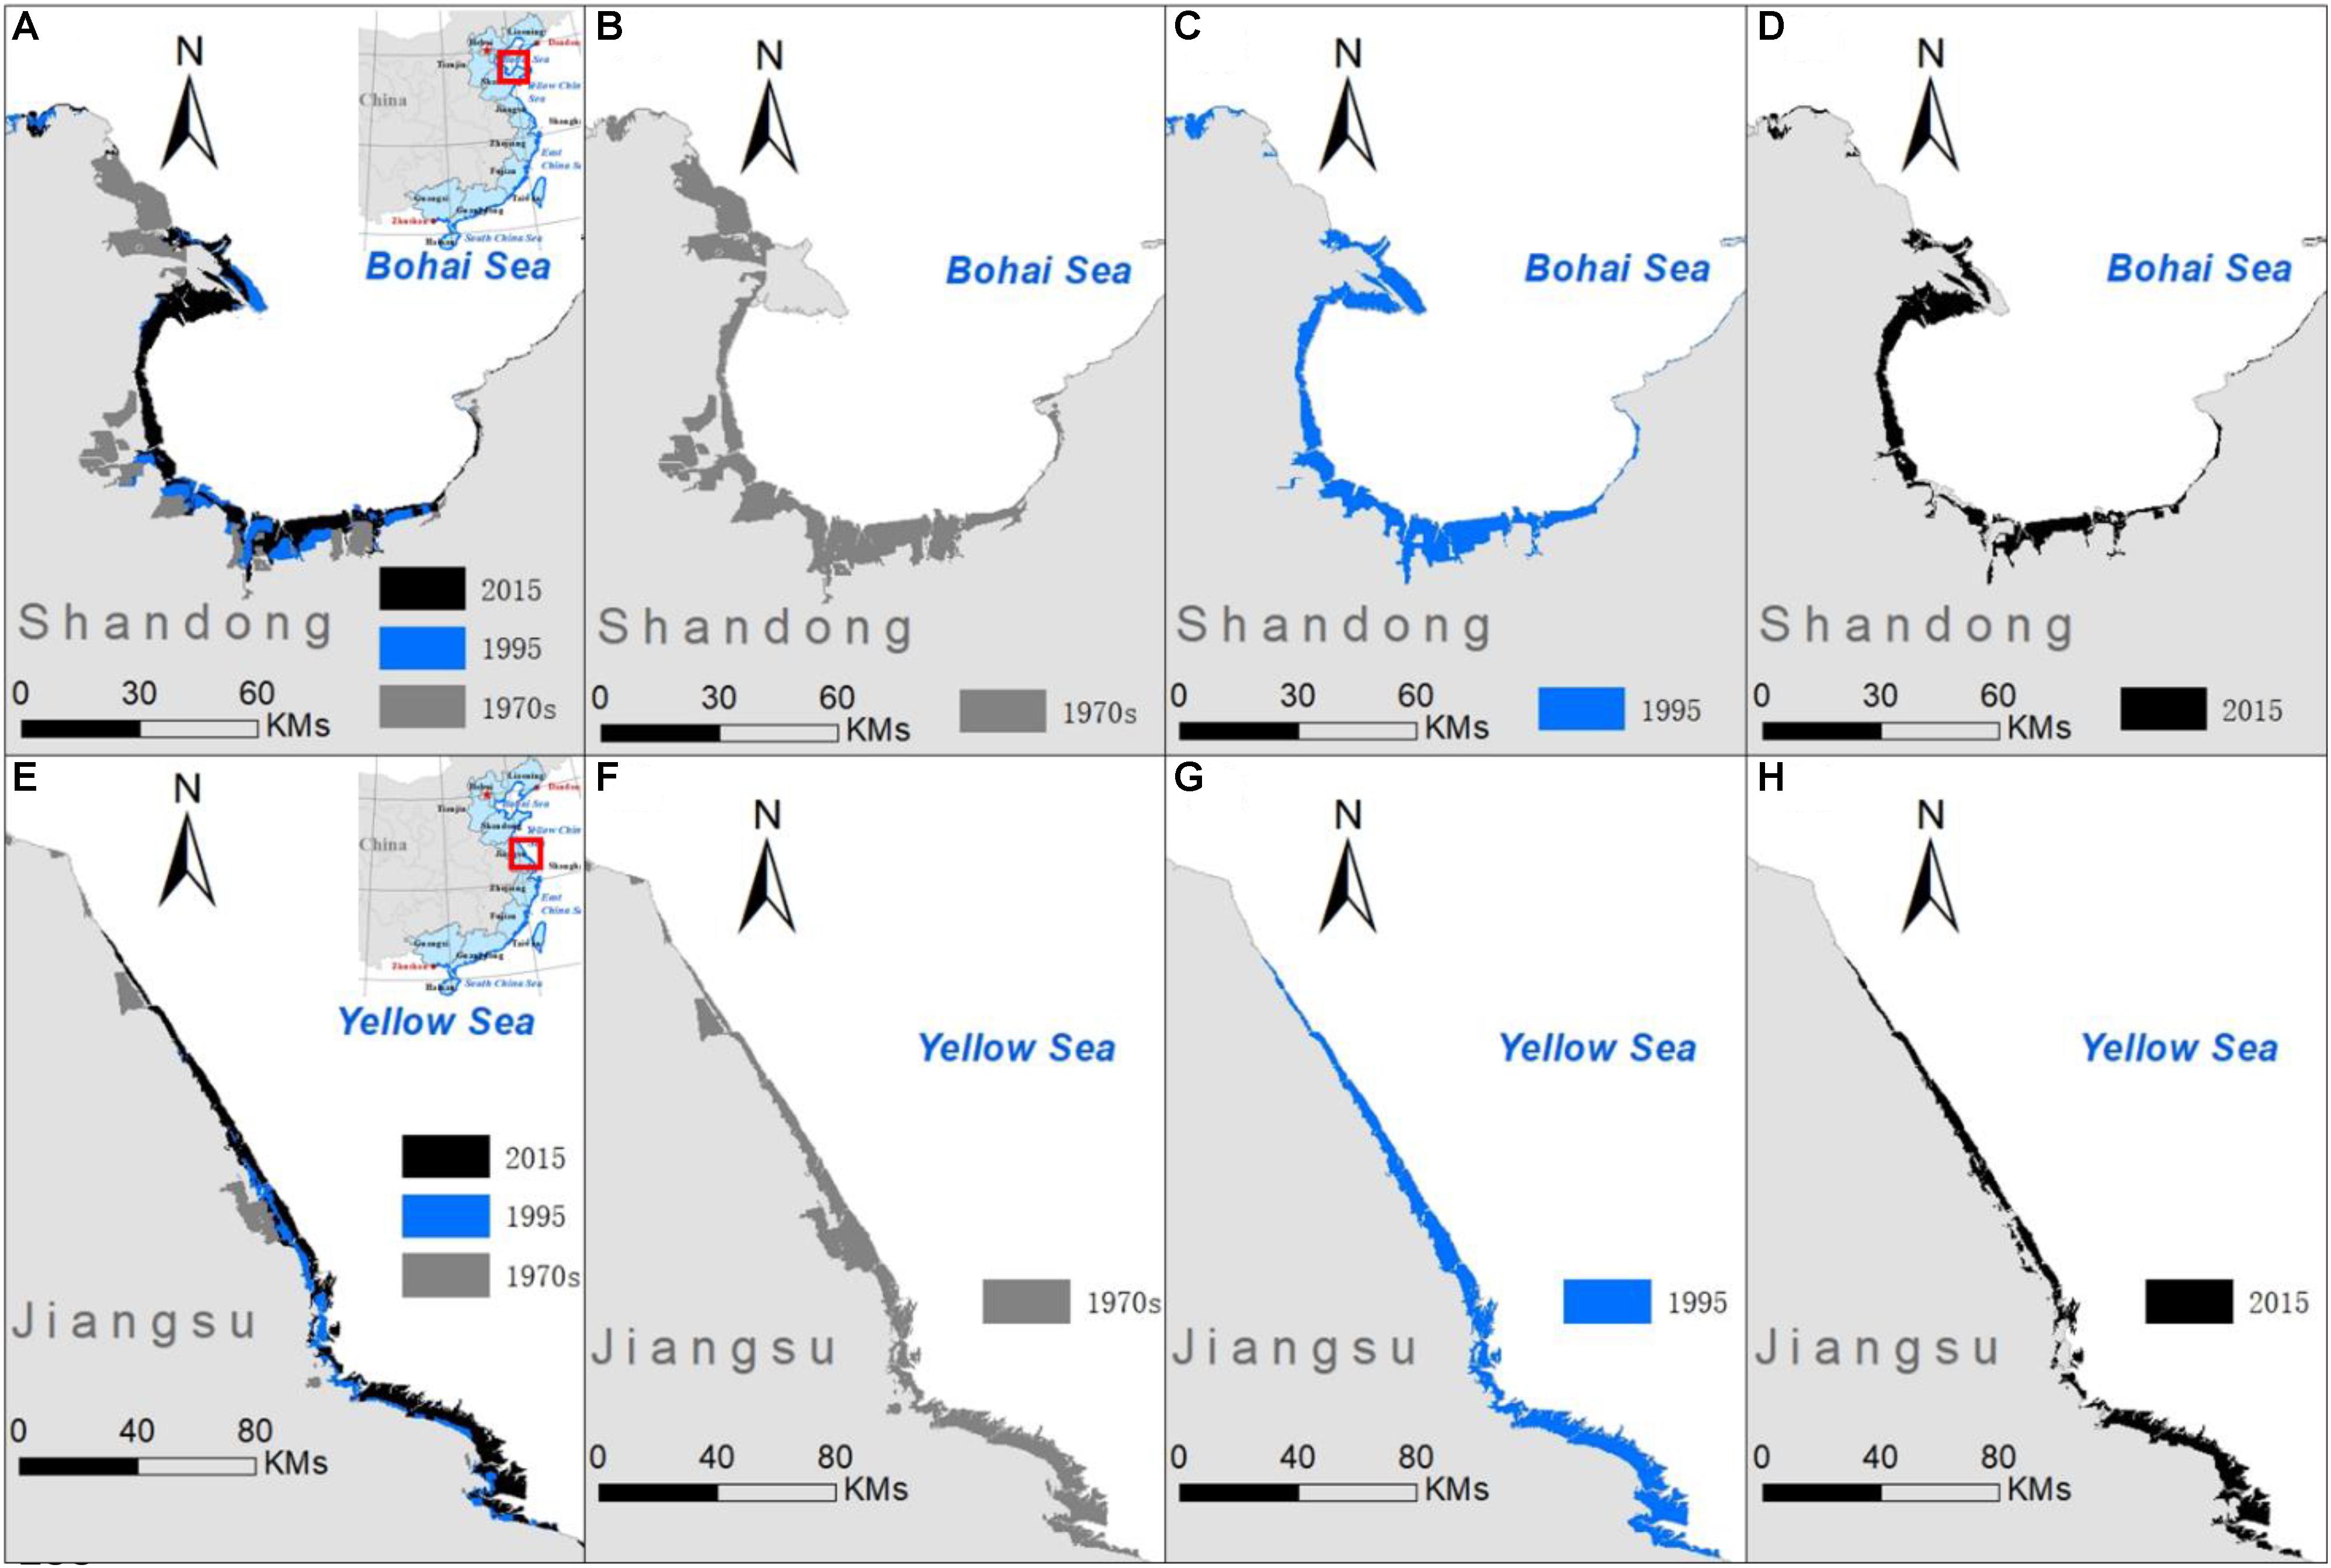
Figure 7. Reduction in the inter-tidal width of the Bohai Rim (A–D) and Yellow sea coast (E–H).
Hotspots of Wetland Gain
Compared with the losses, the gains in intertidal wetland were much more minor, both in number of spatial locations and extent. Intertidal wetland area increased in a few isolated locations, such as the Bohai Rim, Yangtze River mouth, and Guangxi coastal region, which were regarded as the hotspots of wetland gain (Figures 8A–L). Across the municipalities directly under the Central Government, Tianjin and Shanghai, newly constructed intertidal wetland contributed to the area gains. Along the Tianjin coastline, simultaneously with the loss of intertidal wetland on the continental side, the newly emerged wetlands with regular geometric shapes appeared, mainly located in the marine region (Figures 8A–D). The seaward growth of the intertidal wetland units suggested a strong impact from anthropogenic interference. Distinct loss of the intertidal wetland along the southern coast of Shanghai was witnessed (Figures 8E–H). In contrast, in the northern part, a few patches of intertidal wetland around the Yangtze River mouth enlarged from 1995 to 2015. Newly constructed island intertidal wetland was another source of the extent gains for Shanghai (Figures 8E–H). In comparison with Tianjin and Shanghai, the coast of Guangxi is more meandering and tortuous in shape, with two narrow and winding estuaries. A massive amount of intertidal wetland was created along the coast and estuaries (Figures 8I–L), equivalent to an amplification of 0.15 km in the width of the intertidal wetland.
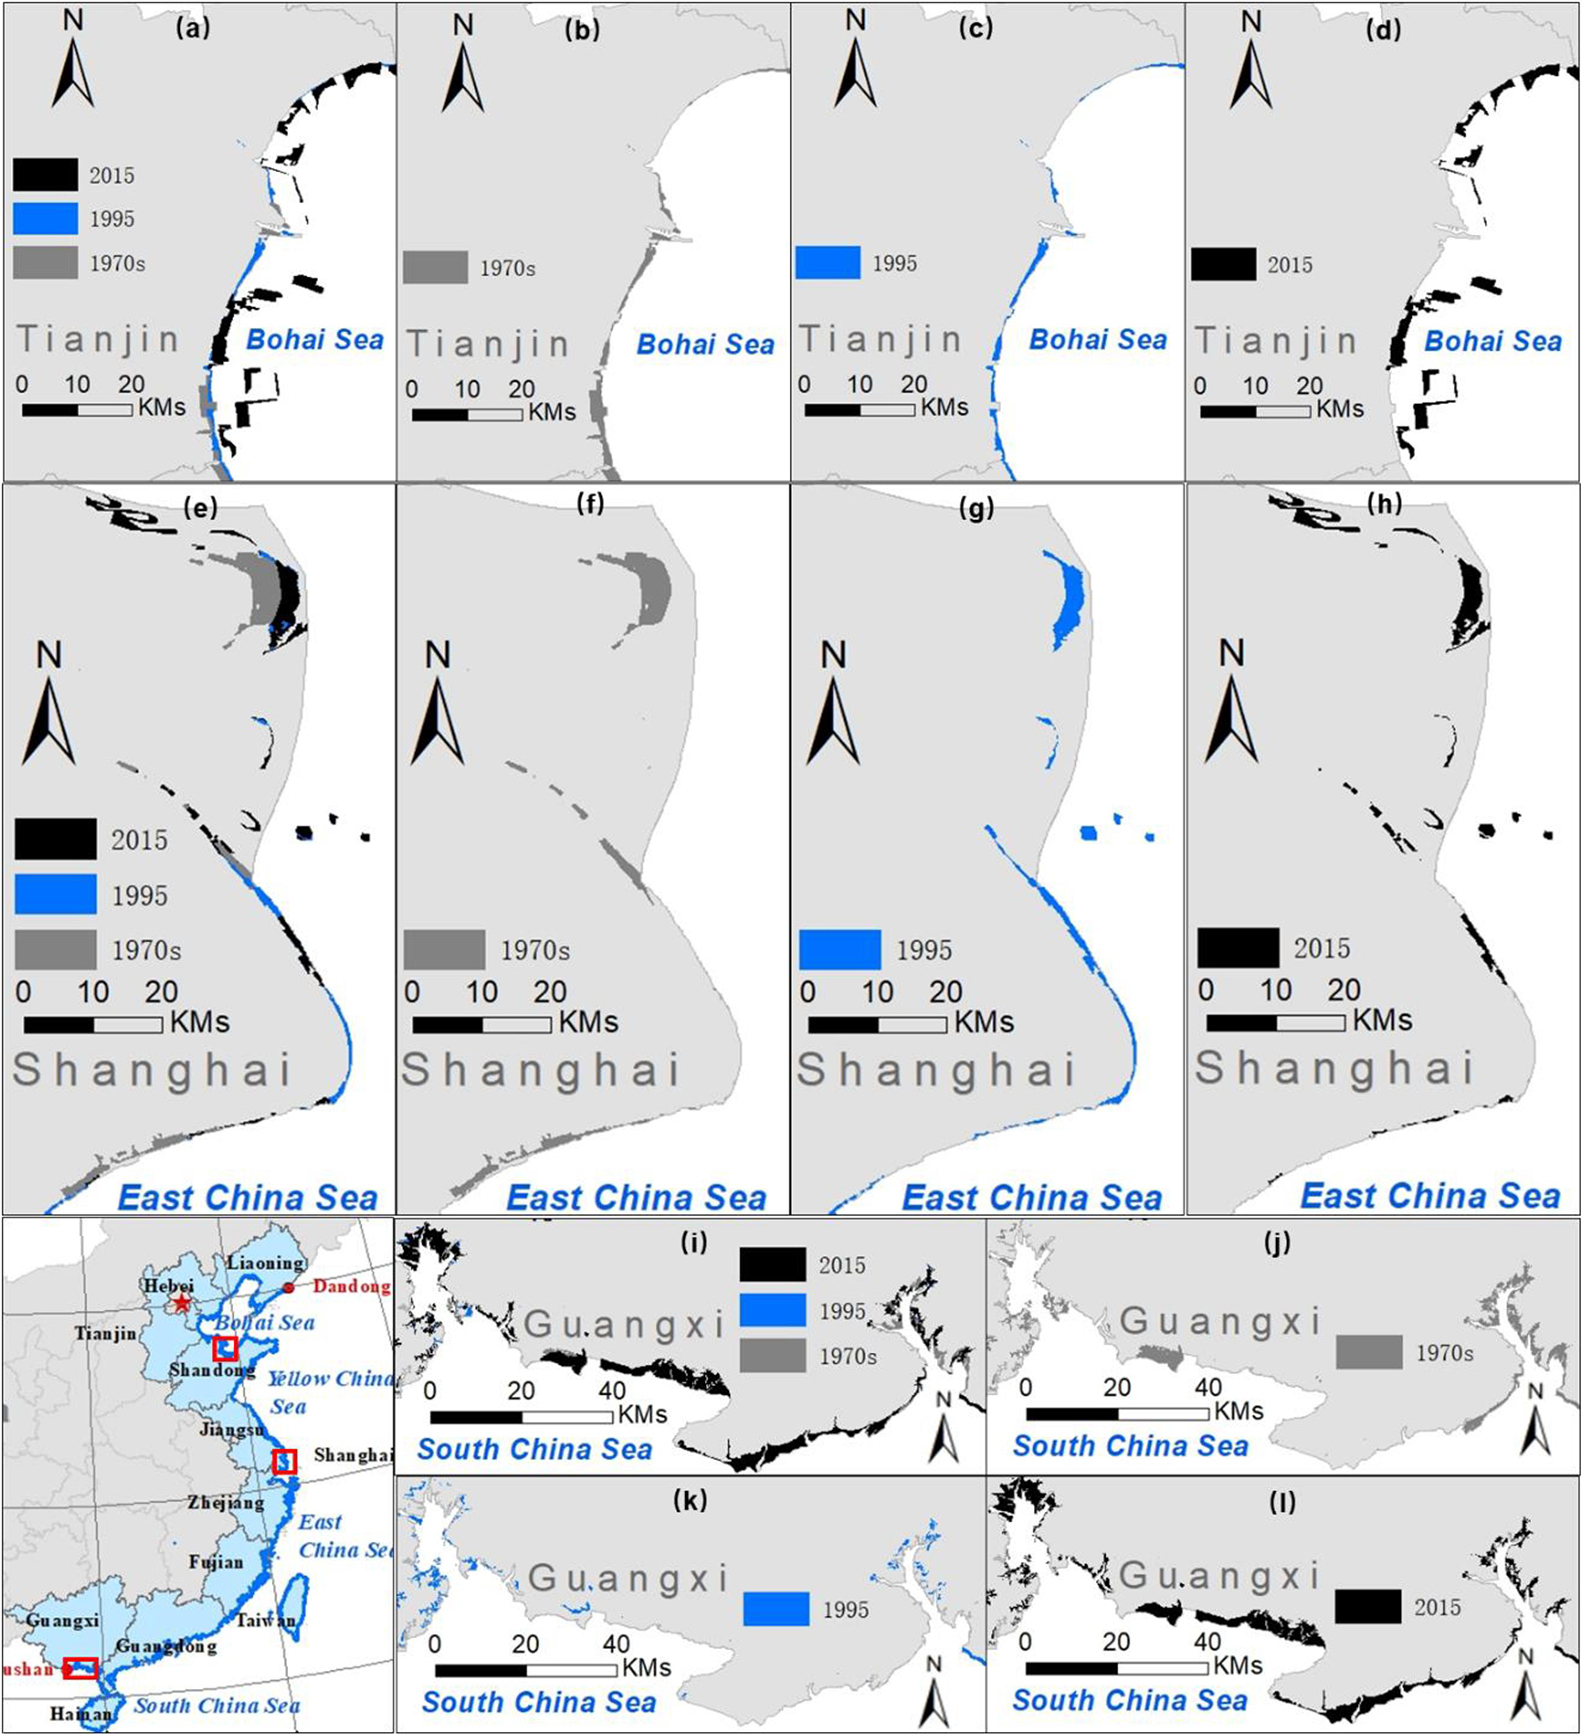
Figure 8. Increase in human-constructed intertidal wetland at the Bohai Rim (A–D), coastal Shanghai region (E–H), and coastal Guangxi region (I–L).
Discussion
Intertidal Wetland Loss Locally and Globally
China shares the second-highest portion of the tidal-flat extent, closely following Indonesia (Murray et al., 2019). Our results were broadly in accordance with other monitoring of intertidal flat or wetland dynamics (Table 6). Intertidal wetland loss tracking around the Yellow Sea reflected an extent of 2678 km2 and 1611 km2 in the 1980s and 2000s, with an annual loss rate of 1.8% (Murray et al., 2014), which were quite similar to our results both in extent and loss rate. Compared with the global reported estimation, the intertidal wetland in China has been lost at a much faster rate. Annually, 0.94–1.17% of intertidal wetland loss occurred in China, which was roughly twice the global average rate, 0.55% every year since 1984 (Murray et al., 2019). Although rates of loss are currently low or slowing down in some parts of the world (e.g., Europe and North America), high losses are continuing elsewhere, especially in Asia (Davidson, 2018). The intertidal wetland loss rate in China is expected to accelerate without adaption or regulation measures in the following decade.
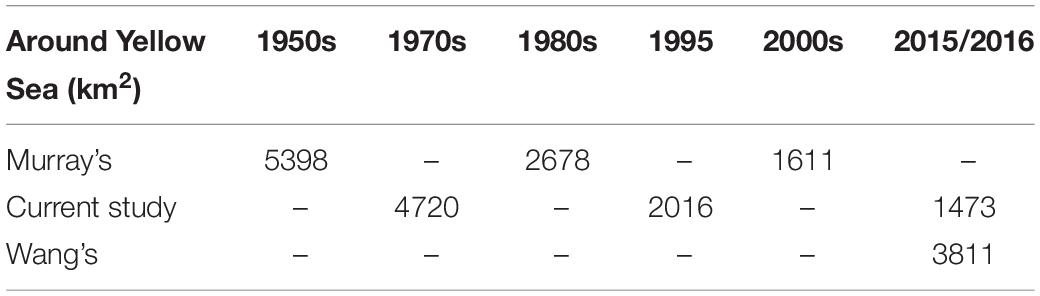
Table 6. Extent of intertidal wetlands around the Yellow sea from different studies.
Driving Forces of the Intertidal Wetland Dynamics
Substantial losses of intertidal wetland were mainly driven by the multiple stressors functioning at both local and national scales. The vast region along the Chinese coastline has been under intense pressure from anthropogenic interference. The explosive growth of the economy and population in the coastal region created intensified land use conflict, which then resulted in huge open-coast wetland reclamation for aquaculture, agriculture, tourism construction, and hydrologic engineering. China alone contributed over 60% of the global aquaculture volume and more than one-third of global aquaculture production (FAO, 2014; Zhao and Shen, 2016). The area devoted to fish farming doubled from 1990s to 2012, resulting in intensified exploitation of coastal ponds (Cao et al., 2015; Zhao and Shen, 2016).
Owing to the extensive land reclamation, seawall construction has been expanding at an unprecedented rate and is referred as the new Great Wall of China (Ma et al., 2014). The seawall serves as the boundary between coastal land use and the intertidal wetland, protecting the land resource inside from the invasion of tides and waves, and at the same time enclosing more wetlands for agricultural and industrial purposes (Lotze et al., 2006; Airoldi and Beck, 2007). The total length of such seawalls has escalated from 3240 km to 10980 km in the two decades since 1990s, covering 61% of the coastline length in 2010 (Guan, 2013). Accelerating seawall construction and land reclamation started in 1990s and had encroached over 950 km2 of the intertidal wetland extent by 2010 (Ma et al., 2014). With the current exploitation rate and development plans, another 580 km2 of intertidal wetland was expected to be occupied by 2020 (Chinese Oceanography Bureau, 2012). The combined pressure of land reclamation and seawall construction squeezed the extent of intertidal wetland to the coastline and finally resulted in the reduction in the intertidal wetland width (Figure 7).
According to the China Marine Statistical Yearbook of 2016, the growth in the marine economy in 2015 was mainly contributed by coastal tourism, followed by the marine communication and transportation industry and marine fishery industry (Figure 9; State Oceanic Administration People’s Republic of China, 2016). The top three contributors made up more than 77% of the marine economic growth. Coastal tourism, the communication and transportation industry, and the fishery industry are considered to be land consuming and occupied the coastal space, causing severe intertidal wetland loss.
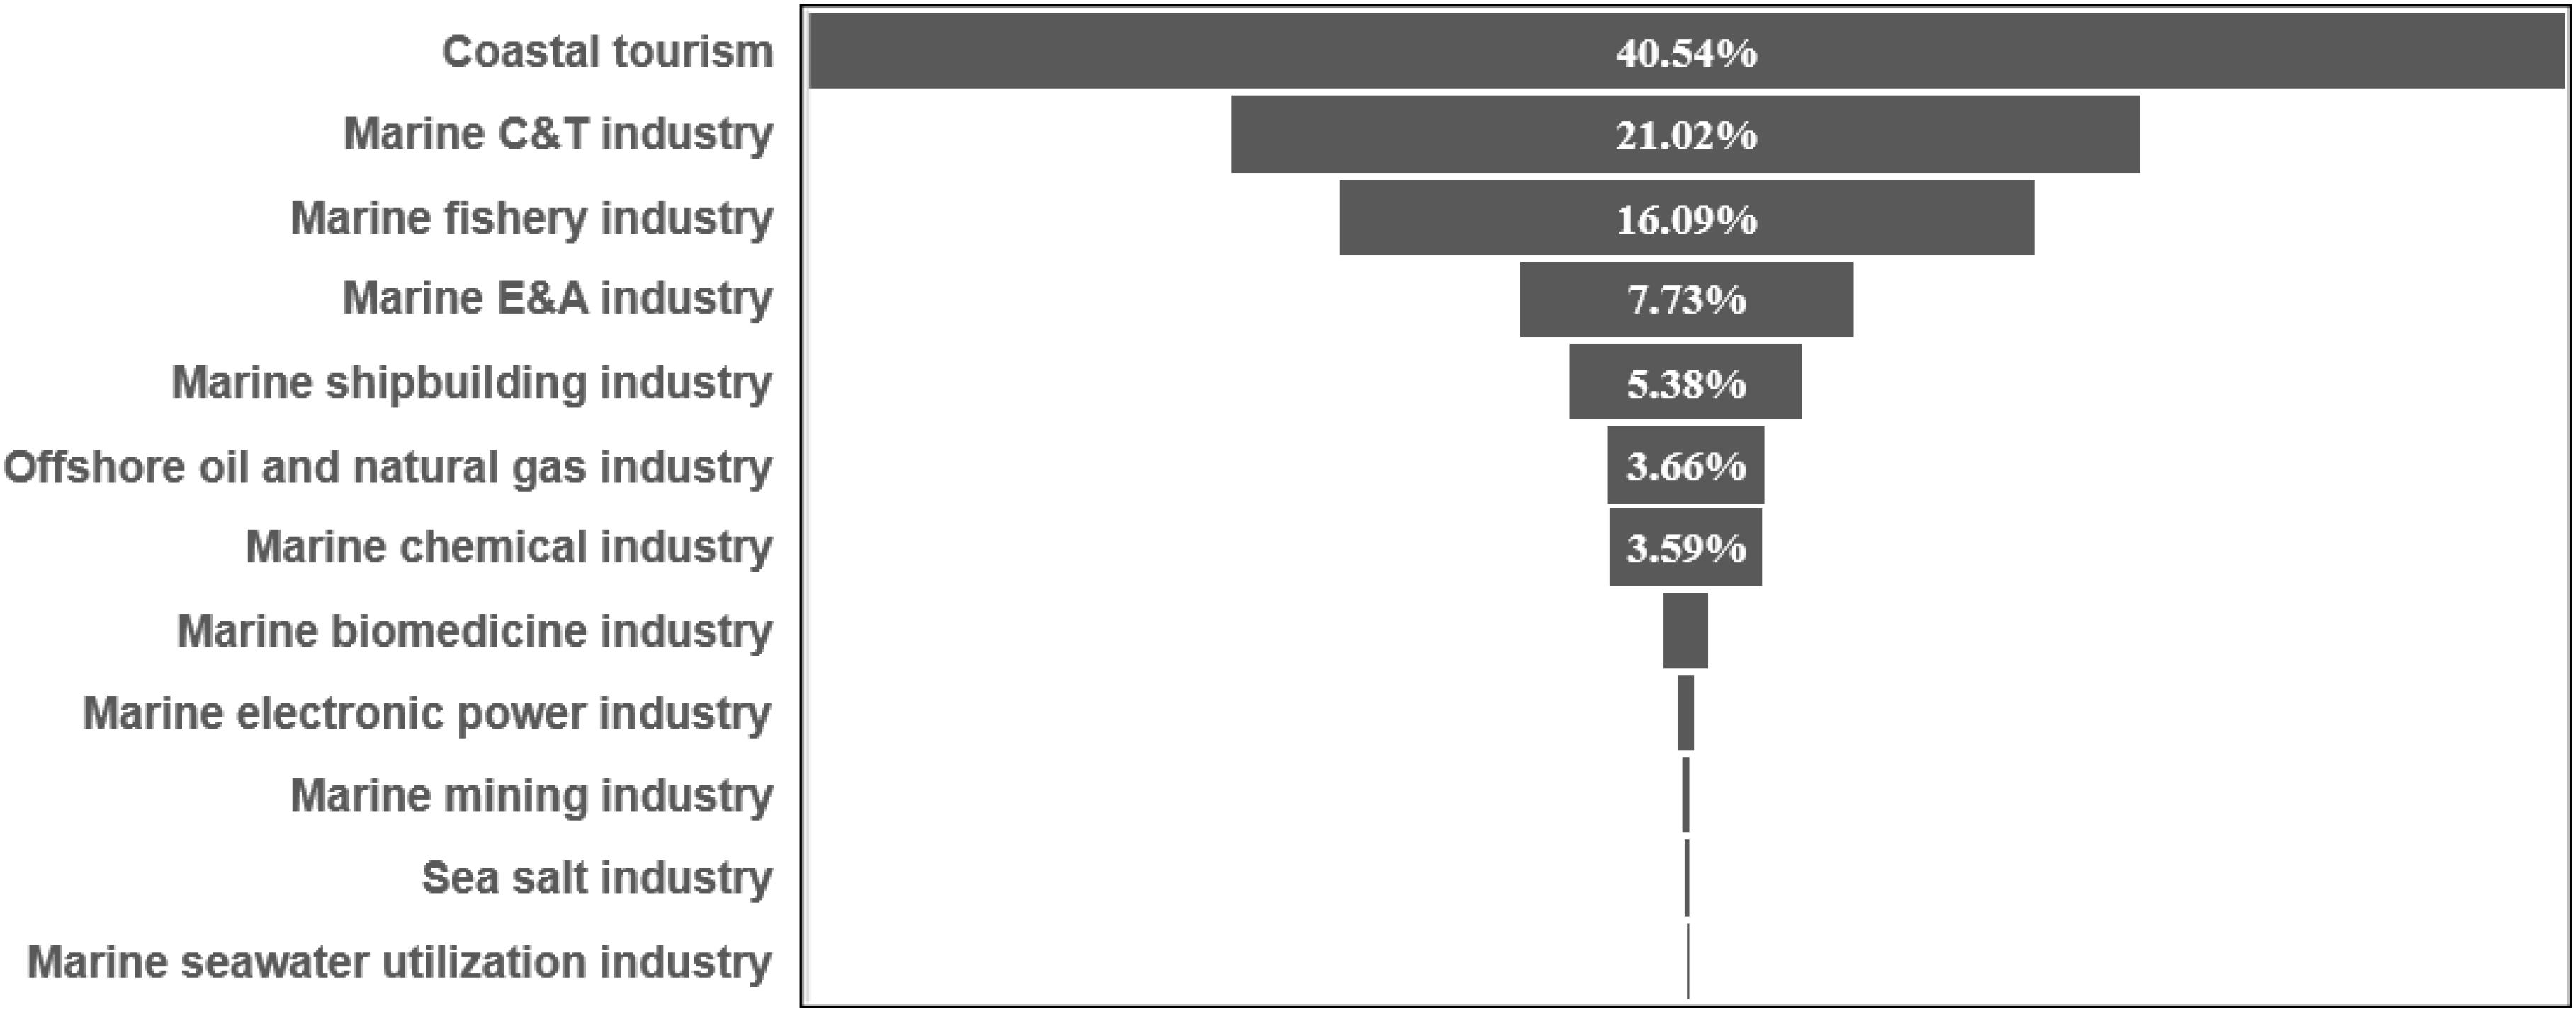
Figure 9. Composition of marine economy growth in 2015. C and T refers to communication and transportation, while E and A means engineering and architecture.
Landward and Seaward Migration of Intertidal Wetland
Previous research pointed out that unprecedented sea-level rise and continued coastal development have altered coastal landscapes substantially across the globe (Kirwan and Megonigal, 2013; Spencer et al., 2016; Parker and Boyer, 2017). Accelerated sea-level rise connected to climate change is estimated to have the largest impact on coastal wetlands because of the amplification of the inundation extent and salinity regime (Schuerch et al., 2018; Woodruff, 2018), which triggers coastal ecosystems to shift landward into newly sea-inundated areas. On the other hand, the intense economic development and population growth concentrated in the near-coast region have strongly constrained the wetland migration landward (Parker and Boyer, 2017), and oceanward land reclamation is still in high demand due to the sustained prosperity of the coastal regions. These two stressors intertwined at the land-sea margin and jointly determined how and where the wetland would migrate (Wu W. et al., 2017). For example, in one of the wetland rich regions of the world, the northern Gulf of Mexico, landward migration of the intertidal wetland along the coast was detected (Enwright et al., 2016), suggesting the sea-level rise sensitivity of this region. In a developing country like China, notably, coastal wetlands have been increasingly lost to numerous anthropologic activities, especially reclamation (Murray et al., 2014; Cui et al., 2016). In our analysis, we found that the intertidal wetlands were primarily squeezed seaward by anthropogenic interference (Figures 5A–H). The exception occurred along the Guangxi coast (Figures 6I–L), where the intertidal wetland invaded further into the continent, revealing the dominant influence of local sea-level rise and the relatively weak pressure from humans. In addition to the wetland migration landward, sea-level rise drove tides and waves further upstream and generated striped intertidal wetland along the tidal river estuary (Figures 6E–L). In general, seaward migrations of the intertidal wetland have been documented globally. The historical loss of coastal wetlands worldwide has been dominated by the direct conversion of wetlands to space for agriculture and aquaculture instead of climate change (Kirwan and Megonigal, 2013). However, given the prediction of increasing sea-level rise and the limited spatial extent for inundation in the near future, robust protection of the coastal infrastructure from higher flood and storm surge risk is required in the long run.
Impact of Intertidal Wetland Loss
Apart from hydrological disasters such as floods, seawater backwash, storm surge, etc., which have been discussed extensively in previous research, intertidal wetland loss will also result in tremendous environmental, ecological, and biological impacts due to the destruction of the habitat (Musseau et al., 2017; Spivak et al., 2019). A recent forecast estimates a net loss of intertidal wetland coverage ranging from 28% to 57% by the year 2100 (McLachlan, 2018). Artificial restoration of intertidal wetland might reduce the intertidal wetland loss ratio and rebuild the buffer zone for hydrological disaster but can only make a limited contribution to the natural biotic assemblages due to the difficulty of restoring the hydrological connectivity with the ocean and the complicated habitat (Wu et al., 2019). A study related to the shorebirds of Austria pointed out that population declines are occurring despite high levels of intertidal habitat protection (Dhanjal-Adams et al., 2016). These findings highlight the immediate and concerted effort needed both nationally and internationally to effectively habitat conservation.
Conclusion and Outlook
The mapping and dynamic detection of intertidal wetland, especially at a large spatial scale and with a long time course, remains a difficult task, mainly due to the scarcity of accurate data. This is particularly the case in rapidly developing China, where the coastal regions were undergoing co-evolution with intense human development and have strong dynamics in temporal and spatial pattern. Multi-temporal remote sensed images and related techniques provide access to a long-term monitor of these living systems. In the face of over-reclamation of coastal land, a huge loss of intertidal wetland has been documented by the high-resolution satellite images, as follows.
(1) An overall decline trend of the intertidal wetland was witnessed along China’s coast, especially in Shandong and Jiangsu, which contributed the highest portion to the total extent. Slight gains of intertidal wetland occurred in isolated regions, mainly in Shanghai, Tianjin, and Guangxi.
(2) The extent of intertidal wetland declined by from 7848 km2 to 6017 km2 from the 1970s to 1995 and then to 4895 km2 in 2015, equaling losses of 23.33% and 18.65% in the former and latter period, respectively.
(3) Squeezed by the over-reclamation of coastal land, the intertidal wetland exhibited seaward migration and severe width shrinkage, stretching 0.35 km, 0.27 km, and 0.22 km in the direction perpendicular to the coast in the three periods, respectively.
The fundamental importance of coastal ecosystems is becoming recognized by government and the public. In the short term, human activities through direct exploitation will continuously dominate the landscape pattern of the coastal region. In the long run, however, accelerated sea-level rise will play a major role in the narrowing and landward migration of the intertidal wetland. Strict legislation for intertidal wetlands, outreach education of ecosystem services, and more active participation by local communities will effectively promote the protection of wetland from over-exploitation. Intrinsic linkages among government and scientists are strongly encouraged to formulate a better strategy for the conservation of the intertidal wetland from the long-term sea-level rise scenario.
Data Availability Statement
The datasets generated in this article are not publicly available. Requests to access the datasets should be directed to Z2Vvc3NvbmdAZ3podS5lZHUuY24=.
Author Contributions
SS wrote the draft of this manuscript. ZW designed the research and guided the analysis process. YW contributed to the image processing, data collection, and analysis. ZC made contribution in language revision and data validation. ZH and YS helped in data collection and background information collection.
Funding
This research was supported by the National Natural Science Foundation of China (Grant No. 41601018), the Guangdong Province Universities and Colleges Pearl River Scholar Funded Scheme (2019), the Key Special Project for Introduced Talents Team of Southern Marine Science and Engineering Guangdong Laboratory (Guangzhou) (GML2019ZD0301), and the NSFC-Guangdong Joint Fund Key Project (U1901219).
Conflict of Interest
The authors declare that the research was conducted in the absence of any commercial or financial relationships that could be construed as a potential conflict of interest.
References
Airoldi, L., and Beck, M. W. (2007). Loss, status and trends for coastal marine habitats of Europe. Oceanogr. Mar. Biol. Annu. Rev. 45, 345–405. doi: 10.1201/9781420050943.ch7
Barbier, E. B. (2015). Valuing the storm protection service of estuarine and coastal ecosystems. Ecosyst. Serv. 11, 32–38. doi: 10.1016/j.ecoser.2014.06.010
Cao, L., Naylor, R., Henriksson, P., Leadbitter, D., Metian, M., Troell, M., et al. (2015). China’s aquaculture and the world’s wild fisheries. Science 347, 133–135. doi: 10.1126/science.1260149
Chen, Y., Dong, J., Xiao, X., Zhang, M., Tian, B., Zhou, Y., et al. (2016). Land claim and loss of tidal flats in the Yangtze Estuary. Sci. Rep. 6:24018. doi: 10.1038/srep24018
Chinese Oceanography Bureau (2012). Marine Function Zoning Plans (2011–2020) of Coastal Provinces [in Chinese]. Beijing: Chinese Oceanography Bureau.
Costanza, R., de Groot, R., Sutton, P., van der Ploeg, S., Anderson, S. J., Kubiszewski, I., et al. (2014). Changes in the global value of ecosystem services. Glob. Environ. Change 26, 152–158. doi: 10.1016/j.gloenvcha.2014.04.002
Crowell, N., Webster, T., and O’Driscoll, N. J. (2011). GIS modelling of intertidal wetland exposure characteristics. J Coast. Res. 27, 44–51. doi: 10.2112/JCOASTRES-D-10-00187.1
Cui, B., He, Q., Gu, B., Bai, J., and Liu, X. (2016). China’s coastal wetlands: understanding environmental changes and human impacts for management and conservation. Wetlands 36, 1–9. doi: 10.1007/s13157-016-0737-8
Davidson, N. C. (2018). “Wetland losses and the status of wetland-dependent species,” in The Wetland Book: II: Distribution, Description, and Conservation, eds M. C. Finlayson, G. R. Milton, R. C. Prentice, and N. C. Davidson, (Dordrecht: Springer).
Deegan, L. A., Johnson, D. S., Warren, R. S., Peterson, B. J., Fleeger, J. W., Fagherazzi, S., et al. (2012). Coastal eutrophication as a driver of salt marsh loss. Nature 490, 388–392. doi: 10.1038/nature11533
Dhanjal-Adams, K. L., Hanson, J. O., Murray, N. J., Phinn, S. R., Wingate, V. R., Mustin, K., et al. (2016). The distribution and protection of intertidal habitats in Australia. EMU Austral Ornithol. 116, 208–214. doi: 10.1071/MU15046
Enwright, N. M., Griffith, K. T., and Osland, M. J. (2016). Barriers to and opportunities for landward migration of coastal wetlands with sea-level rise. Front. Ecol. Environ. 14, 307–316. doi: 10.1002/fee.1282
FAO, (2014). The State of World Fisheries and Aquaculture.Rome: Food and Agriculture Organization of the United Nations.
Ford, M. (2013). Shoreline changes interpreted from multi-temporal aerial photographs and high resolution satellite images: Wotje Atoll, Marshall Islands. Remote Sens. Environ. 135, 130–140. doi: 10.1016/j.rse.2013.03.027
Fujii, T. (2012). Climate change, sea-level rise and implications for coastal and estuarine shoreline management with particular reference to the ecology of intertidal benthic macrofauna in NW Europe. Biology 1, 597–616. doi: 10.3390/biology1030597
Gabler, C. A., Osland, M. J., Grace, J. B., Stagg, C. L., Day, R. H., Hartley, S. B., et al. (2017). Macroclimatic change expected to transform coastal wetland ecosystems this century. Nat. Clim. Change 7, 142–147. doi: 10.1038/nclimate3203
Gong, P., Niu, Z., Cheng, X., Zhao, K., Zhou, D., Guo, J., et al. (2010). China’s wetland change (1990–2000) determined by remote sensing. Sci. China Earth Sci. 53, 1036–1042. doi: 10.1007/s11430-010-4002-3
Gu, J., Luo, M., Zhang, X., Christakos, G., Agusti, S., Duarte, C. M., et al. (2018). Losses of salt marsh in China: trends, threats and management. Estuar. Coast. Shelf Sci. 214, 98–109. doi: 10.1016/j.ecss.2018.09.015
Hou, X., Wu, T., Hou, W., Chen, Q., Wang, Y., and Yu, L. (2016). Characteristics of coastline changes in mainland China since the early 1940s. Sci. China Earth Sci. 59, 1791–1802. doi: 10.1007/s11430-016-5317-5
Jankowski, K. L., Törnqvist, T. E., and Fernandes, A. M. (2017). Vulnerability of Louisiana’s coastal wetlands to present-day rates of relative sea-level rise. Nat. Commun. 8:14792. doi: 10.1038/ncomms14792
Kirwan, M. L., and Megonigal, J. P. (2013). Tidal wetland stability in the face of human impacts and sea-level rise. Nature 504, 53–60. doi: 10.1038/nature12856
Lotze, H. K., Lenihan, H. S., Bourque, B. J., Bradbury, R. H., Cooke, R. G., Kay, M. C., et al. (2006). Depletion, degradation, and recovery potential of estuaries and coastal seas. Science 312, 1806–1809. doi: 10.1126/science.1128035
Loveland, T. R., Reed, B. C., Brown, J. F., Ohlen, D. O., Zhu, Z., Yang, L., et al. (2000). Development of a global land cover characteristics database and IGBP DISCover from 1 km AVHRR data. Int. J. Remote Sens. 21, 1303–1330. doi: 10.1080/014311600210191
Ma, Z., Melville, D. S., Liu, J., Chen, Y., Yang, H., Ren, W., et al. (2014). Rethinking China’s new great wall. Science 346, 912–914. doi: 10.1126/science.1257258
Mason, D. C., Scott, T. R., and Dance, S. L. (2010). Remote sensing of intertidal morphological change in Morecambe Bay, U.K., between 1991 and 2007. Estuar. Coast. Shelf Sci. 87, 487–496. doi: 10.1016/j.ecss.2010.01.015
McLachlan, J. R. (2018). Highnet loss of intertidal Wetland coverage in a maine Estuary by year 2100. J. Conserv. Sustain. 2. doi: 10.13140/RG.2.2.36748.56962
Murray, N. J., Clemens, R. S., Phinn, S. R., Possingham, H. P., and Fuller, R. A. (2014). Tracking the rapid loss of tidal wetlands in the Yellow Sea. Front. Ecol. Environ. 12, 267–272. doi: 10.1890/130260
Murray, N. J., Phinn, S. R., DeWitt, M., Ferrari, R., Johnston, R., Lyons, M. B., et al. (2019). The global distribution and trajectory of tidal flats. Nature 565:222. doi: 10.1038/s41586-018-0805-8
Musseau, R., Beslic, S., and Kerbiriou, C. (2017). Importance of intertidal wetlands for the French coastal endemic Bluethroat Cyanecula svecica namnetum and conservation implications in the context of global changes. Ardeola 64, 325–345. doi: 10.13157/arla.64.2.2017.ra3
Nwipie, G. N., Hart, A. I., Zabbey, N., Sam, K., Prpich, G., and Kika, P. E. (2019). Recovery of infauna macrobenthic invertebrates in oil-polluted tropical soft-bottom tidal flats: 7 years post spill. Environ. Sci. Pollut. Res. 26, 22407–22420. doi: 10.1007/s11356-019-05352-2
Parker, V. T., and Boyer, K. E. (2017). Sea-level rise and climate change impacts on an urbanized Pacific Coast estuary. Wetlands 1–14. doi: 10.1007/s13157-017-0980-7
Paterson, D. M., Fortune, I., Aspden, R. J., and Black, K. S. (2019). “Chapter 11 – Intertidal flats: form and function,” in Coastal Wetlands, eds G. M. E Perillo, E. Wolanski, D. R. Cahoon, and C. S Hopkinson, (Amsterdam: Elsevier), 383–406. doi: 10.1016/B978-0-444-63893-9.00011-3
Ribaudo, C., Plus, M., Ganthy, F., and Auby, I. (2016). Carbon sequestration loss following Zostera noltei decline in the Arcachon Bay (France). Estuar. Coast. Shelf Sci. 179, 4–11. doi: 10.1016/j.ecss.2016.01.024
Sagar, S., Roberts, D., Bala, B., and Lymburner, L. (2017). Extracting the intertidal extent and topography of the Australian coastline from a 28year time series of landsat observations. Remote Sens. Environ. 195, 153–169. doi: 10.1016/j.rse.2017.04.009
Schuerch, M., Spencer, T., Temmerman, S., Kirwan, M. L., Wolff, C., Lincke, D., et al. (2018). Future response of global coastal wetlands to sea-level rise. Nature 561, 231–234. doi: 10.1038/s41586-018-0476-5
Spencer, T., Schuerch, M., Nicholls, R. J., Hinkel, J., Lincke, D., Vafeidis, A. T., et al. (2016). Global coastal wetland change under sea-level rise and related stresses: the DIVA wetland change model. Glob. Planet. Change 139, 15–30. doi: 10.1016/j.gloplacha.2015.12.018
Spivak, A. C., Sanderman, J., Bowen, J. L., Canuel, E. A., and Hopkinson, C. S. (2019). Global-change controls on soil-carbon accumulation and loss in coastal vegetated ecosystems. Nat. Geosci. 12, 685–692. doi: 10.1038/s41561-019-0435-2
State Oceanic Administration People’s Republic of China (2016). China Marine Statistical Yearbook 2016. Beijing: Ocean Press.
Syvitski, J. P. M., Kettner, A. J., Overeem, I., Hutton, E. W. H., Hannon, M. T., Brakenridge, G. R., et al. (2009). Sinking deltas due to human activities. Nat. Geosci. 2, 681–686. doi: 10.1038/ngeo629
Vafeidis, A. T., Nicholls, R. J., McFadden, L., Tol, R. S. J., Hinkel, J., Spencer, T., et al. (2008). A new global coastal database for impact and vulnerability analysis to sea-level rise. J. Coast. Res. 24, 917–924. doi: 10.2112/06-0725.1
Vázquez-González, C., Moreno-Casasola, P., Peralta Peláez, L. A., Monroy, R., and Espejel, I. (2019). The value of coastal wetland flood prevention lost to urbanization on the coastal plain of the Gulf of Mexico: an analysis of flood damage by hurricane impacts. Int. J. Disaster Risk Reduct. 37:101180. doi: 10.1016/j.ijdrr.2019.101180
Wang, X., Xiao, X., Zou, Z., Chen, B., Ma, J., Dong, J., et al. (2018). Tracking annual changes of coastal tidal flats in China during 1986–2016 through analyses of landsat images with google earth engine. Remote Sens. Environ. 238:110987. doi: 10.1016/j.rse.2018.11.030
Wei, W., Tang, Z., Dai, Z., Lin, Y., Ge, Z., and Gao, J. (2015). Variations in tidal flats of the Changjiang (Yangtze) estuary during 1950s–2010s: future crisis and policy implication. Ocean Coast. Manag. 108, 89–96. doi: 10.1016/j.ocecoaman.2014.05.018
Woodruff, J. D. (2018). Future of tidal wetlands depends on coastal management. Nature 561, 183–185. doi: 10.1038/d41586-018-06190-x
Wu, H., Guan, Q., Lu, K., Han, G., Li, B., and Yang, M. (2019). Effects of hydrological connectivity on snail assemblages in the intertidal zone of coastal wetlands. Wetlands 1–8. doi: 10.1007/s13157-019-01241-z
Wu, W., Zhou, Y., and Tian, B. (2017). Coastal wetlands facing climate change and anthropogenic activities: a remote sensing analysis and modelling application. Ocean Coast Manag. 138, 1–10. doi: 10.1016/j.ocecoaman.2017.01.005
Wu, X., Bi, N., Xu, J., Nittrouer, J. A., Yang, Z., Saito, Y., et al. (2017). Stepwise morphological evolution of the active Yellow River (Huanghe) delta lobe (1976–2013): dominant roles of riverine discharge and sediment grain size. Geomorphology 292, 115–127. doi: 10.1016/j.geomorph.2017.04.042
Keywords: intertidal wetland loss, land reclamation, seaward migration, China, anthropogenic activity
Citation: Song S, Wu Z, Wang Y, Cao Z, He Z and Su Y (2020) Mapping the Rapid Decline of the Intertidal Wetlands of China Over the Past Half Century Based on Remote Sensing. Front. Earth Sci. 8:16. doi: 10.3389/feart.2020.00016
Received: 12 November 2019; Accepted: 20 January 2020;
Published: 14 February 2020.
Edited by:
Xingcai Liu, Institute of Geographic Sciences and Natural Resources Research (CAS), ChinaReviewed by:
Guy Jean-Pierre Schumann, University of Bristol, United KingdomJike Chen, Nanjing University of Information Science and Technology, China
Deirdre McKay, Keele University, United Kingdom
Copyright © 2020 Song, Wu, Wang, Cao, He and Su. This is an open-access article distributed under the terms of the Creative Commons Attribution License (CC BY). The use, distribution or reproduction in other forums is permitted, provided the original author(s) and the copyright owner(s) are credited and that the original publication in this journal is cited, in accordance with accepted academic practice. No use, distribution or reproduction is permitted which does not comply with these terms.
*Correspondence: Zhifeng Wu, emZ3dUBnemh1LmVkdS5jbg==; Yuefeng Wang, eXVlZmVuZ193YW5nQGNxbnUuZWR1LmNu