 Zoe R. Courville1*
 Ross M. Lieblappen1,2
 Alison K. Thurston1
 Robyn A. Barbato1
 John M. Fegyveresi1,3
 Lauren B. Farnsworth1
 Jeff Derry4R. M. Jones1
 Stacey J. Doherty1Shelby A. Rosten1
- 1US Army Corps of Engineers Engineer Research and Development Center, Cold Regions Research and Engineering Laboratory, Hanover, NH, United States
- 2Department of Science, Vermont Technical College, Randolph Center, VT, United States
- 3School of Earth and Sustainability, Northern Arizona University, Flagstaff, AZ, United States
- 4Center for Snow and Avalanche Studies, Silverton, CO, United States
We investigated snow microstructure and microbial composition from snow samples collected from western Colorado, a region that experiences frequent dust-on-snow deposition events. We developed a methodology to quantify the amount, size, and location of dust particles within the snow matrix through analysis of X-ray micro-computed tomography data. Concurrently, we determined the microbial composition in sampled dust layers through DNA sequencing. We found that dust particles were generally embedded in the snow grains, with a small fraction of the dust particles' surface area exposed to air. Microbial community composition varied more by alpine site rather than residence time of the dust within the snowpack, with the recently deposited dust layer harboring both the highest diversity and highest concentration of dust particles. The presence of microbiota in the dust-impacted snowpack has important implications for snowpack stability, melting, and biogeochemistry.
Introduction
Dust deposition on a snow surface accelerates snow melt primarily by causing the snow surface to become darker and secondarily through dry and wet snow metamorphic processes and snow grain growth that occur before the onset of melt (Conway et al., 1996; Skiles et al., 2018). Our study site, the Senator Beck Basin Study Area in the San Juan Mountains has been extensively studied (Painter et al., 2007, 2012; Skiles et al., 2015) with a focus on the radiative impacts on snowpacks due to dust deposition. Evidence including particle size, isotopic analysis, and remote sensing imagery points to the Colorado Plateau, and possibly the Mojave Desert, as the source regions for the dust deposited in this area (Lawrence et al., 2010; Skiles et al., 2015). The focus of our study was to investigate dust-associated microbial deposition on snowpack and structure and to examine aerosolized microbial communities through dust transport, including dust provenance within a larger project examining the ultimate contribution of dust deposition, and microbial component, to the timing and onset of melt within our study area. Our hypothesis driving this focused area of the larger work is that microbiota present on dust particles deposited on the snow could be linked to source regions.
The global estimate of dust lofting is 2–5 million metric tons per year (Perkins, 2001), providing a significantly large substrate for the transport of dust-associated microorganisms. During lofting events (short and long range) the microorganisms attached to dust can experience a wide range of stressors including UV radiation and dessication, resulting in variable viability (Meola et al., 2015; Schuerger et al., 2018). However, aerosolized dust particulates have been accepted as a major source of microbes, particularly to remote regions (Harding et al., 2011). Bacteria attached to dust particles can be found deposited anywhere in the world (Miteva et al., 2009; Yamaguchi et al., 2012; Favet et al., 2013). For instance, microorganisms originating from the Saharan Desert have been found thousands of kilometers away in the Caribbean and European Alps (Kellogg and Griffin, 2006; Meola et al., 2015). This global transport of microorganisms has important implications for human-health, ecology, nutrient cycling, and melt (Weir-Brush et al., 2004; Comrie, 2005; Weil et al., 2017).
Of interest to this work was the deposition of microorganisms on snow, which seasonally accounts for 50% of the Earth's surface (Sevruk, 1992). In snow covered environments, once the dust is deposited, its associated microbes are in contact with other microbes inhabiting the snow and ice. In fact, snow and ice microbial communities have been described in the Canadian High Arctic, Iceland, Greenland, and European Alps (Harding et al., 2011; Lutz et al., 2014, 2015; Meola et al., 2015), with ~103-104 cells detected per milliliter of melted snow (Maccario et al., 2015; Wunderlin et al., 2016). The remote detection and impact of algae on the albedo of snow has been studied by Painter et al. (2001) and Dial et al. (2018) and modeled by Cook et al. (2017a,b).
One pressing question in the field is how geographically diverse dust-associated microbial populations are (Kellogg and Griffin, 2006; Grantham et al., 2015). A review by Anesio et al. (2017) highlighted that primary producers (e.g., photoautotrophs) found in snow and ice are much more similar across global glacial regions than heterotrophic bacterial communities. They note that limitations in molecular techniques for discriminating eukaryotic organisms may contribute to the lack of reported diversity (Anesio et al., 2017). Dust deposited on snow can be from local, regional or global sources. Therefore, there could be a small subset of microorganisms, which have adapted to the snow environment and are dispersed globally. Conversely, the microbial communities may be influenced more by dust origin and instead exhibit similar functions/processes, which allow for adaptation to snow environments (Kellogg and Griffin, 2006). Comparing the dust collected during dust deposition events to possible dust origins will shed light on this question. For example, it is predicted that a substantial amount of the dust deposited on snow in the San Juan Mountains is from Mojave Desert and the Colorado Plateau (Lawrence et al., 2010). The mechanisms responsible for microbial adaptability to desert conditions (sporulation and pigment production) have been suggested to enable adaptability to the challenging conditions in snow environments (Meola et al., 2015). Dust-associated microorganisms may have different metabolic requirements (Anesio et al., 2017), pigmentation production (Lutz et al., 2014, 2015) and growth rates when compared to microbiota that is native to the snow and ice environment.
Methods
We investigated the identity of dust-associated microorganisms and their influence on the snow matrix immediately prior to the onset of melt season including microstructural analysis of dust and snow via X-ray micro-computed tomography (micro-CT), meteorological analysis and microbiology.
Alpine snow samples were aseptically collected using sterile gloves and bags in collaboration with the Center for Snow and Avalanche Studies during multiple dust events in the late winter and early spring of 2017 for microbial studies. Coincident snow samples for microstructural analysis were collected for micro-CT investigations non-aseptically. The samples were collected from two different locations: the Berthoud Pass Colorado Dust-on-Snow study site near Winter Park, Colorado and the Swamp Angel Study Plot in Senator Beck Basin near Silverton, Colorado (Figure 1). Microbial community composition was measured from the snow samples; coincident snow microstructural analysis and the meteorology of the dust deposition events were examined in order to determine potential impacts to the snow structure and to determine the dust source location. We collected dust-impacted snow samples both immediately following dust deposition events as well as merged snow layers formed at the end of the snow season to examine subsequent post-depositional processes. We sought to discern the aggregated effect of multiple dust deposition events on the snow structure and microbial taxa present.
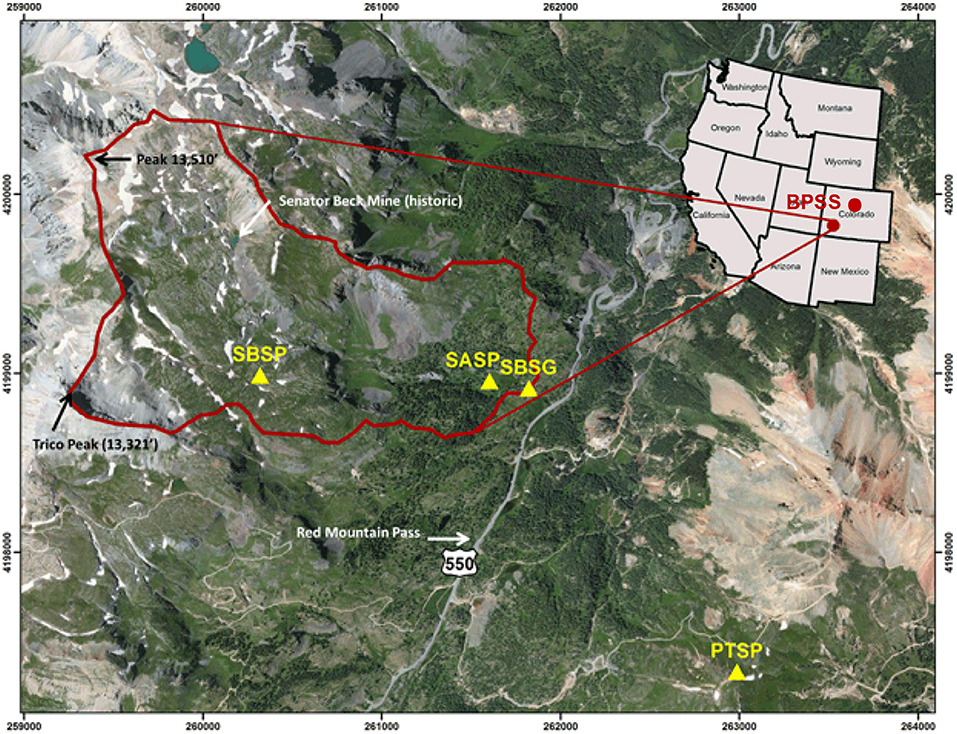
Figure 1. Map from the Center for Snow and Avalanche Studies indicating sample site locations in Colorado, USA (http://snowstudies.org/sbbsa1.html). The Senator Beck Study Plot (SBSP), Swamp Angel Study Plot (SASP), and associated Senator Beck Stream Gauge (SBSG) and Putney Study Plot (PTSP) are indicated by yellow triangles within the Senator Beck Basin (SBB). Samples were collected at the Swamp Angel Study Plot and at the top of Berthoud Pass, in the northwest portion of the state, denoted by BPSS.
Snow Sampling
Samples were collected from Berthoud Pass in the central Rocky Mountains near Winter Park, Colorado (39°47′52“N, 105°46′37″W, 3,446 m asl) and the Swamp Angel Study Plot, located in the Senator Beck Basin in the San Juan Mountains, near Silverton, Colorado (37°54′25“N, 107°42′40″W, 3,371 m asl) (Figure 1). These study sites are both flat, relatively open areas located within forested regions. For microbial characterization, three separate samples of each dust layer in the snow pack were collected ~50–100 cm apart (Table 1) using sterile bags and collection equipment. Each individual sample consisted of an ~3 L volume collected aseptically from surface snow immediately following new dust events and in snow pits, after the individual dust layers had merged. For sample collection immediately following dust deposition events, surface samples of the dust layer from the top 5 cm of the snow pack were collected. These samples are denoted as IDL (Individual Dust Layers). Over the course of the late-spring, individual dust deposition layers in the snow typically merge into single layers due to snow processes including melt, grain growth due to temperature gradients within the snowpack, and sublimation/condensation. We collected a snow sample of the buried, merged dust layers by collecting the same volume from the 4 cm thick merged dust layer at the Swamp Angel Study Site and the 3 cm thick merged dust layer at Berthoud Pass. We denote these samples as ALM (All Layers Merged).
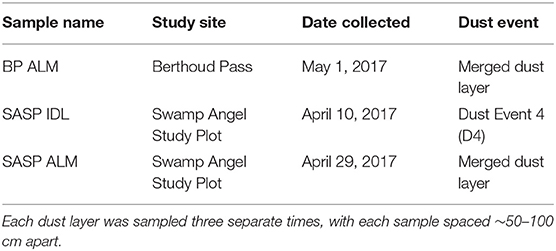
Table 1. Samples collected in spring 2017 from Berthoud Pass (near Fraser, Colorado), and the Swamp Angel Study Plot in Senator Beck Basin.
Sampling was undertaken for microstructural characterization at the same time as microbial sampling, and included measurements of snow temperature, stratigraphy (via traditional means as well as recorded in near infrared (NIR) photography) and density. Snow samples for microstructural analysis were collected in large, 3,000 cm3 volumes, 20 × 15 × 10 cm, placed in individual rigid samples containers, packaged securely to minimize movement, and shipped back to the lab in coolers packed in dry ice and eutectic packs. The outer edges of the samples were sacrificed so that the center sub volume of 5 × 2 × 2 cm of the sample was imaged. A volume of interest inside the imaged sample was further defined to remove edge effects caused by sample preparation.
Snow Microstructure
In order to determine the location of dust particles within the 3D snow matrix, we imaged snow samples using a Bruker Skyscan 1173 micro-CT scanner housed in a −10°C cold room. We focused on samples collected during the late spring from a merged layer at the Swamp Angel Study Plot, samples collected immediately after a dust event (D4) at Swamp Angeland a sample from a merged dust layer from a snow pit at Berthoud Pass. We examined three separate sub-samples for the individual dust event layer sample. Each sample was scanned with 40 kV X-rays at 200 mA and a nominal resolution of ~15 μm as the sample was rotated 180° in 0.4° steps with an exposure time of 300–350 ms. X-rays were detected using a 5 Mp (2,240 × 2,240) flat panel sensor utilizing 2 × 2 binning, and projection radiographs were averaged over four frames. The resulting 1,120 × 1,120 radiographs were then reconstructed into 2-D gray-scale horizontal slices using the software package NRecon (Bruker), which utilizes a modified Feldkamp cone-beam algorithm. Image reconstruction processing included sample-specific post alignment, Gaussian smoothing using a kernel size of two, sample-specific ring artifact correction of dead pixels, beam hardening correction, and X-ray source thermal drift correction.
Grayscale images were segmented into three phases: air (lowest x-ray absorption), dust (highest x-ray absorption), and snow (intermediate x-ray absorption). Segmenting thresholds for each of the phases were determined by finding the local minimum between peaks on the histogram showing all grayscale values. Dust and snow microstructural parameterizations were analyzed using the software package CTAn (Bruker's proprietary CT Analysis program). Microstructural parameters that we calculated using CTAn include the total porosity of the samples, the number of particles or objects of each phase, the surface to volume ratio (S/V) of each phase (which is inversely related to the grain size), and structure thickness, which provides an estimate of particle/pore size depending on the phase that is being examined. Theoretically, assuming the snow grains are spherical particles, S/V is related to the specific surface area (SSA) of snow by the relationship SSA = S/ρiV, where ρi is the density of ice. The SSA is in turn related to the optical grain size of ice (D0), according to the relationship D0 = 6/(ρSSA).
Meteorology
We compiled meteorological data from Swamp Angel Study Plot located within the Silverton Beck Basin near Silverton, Colorado, which was installed and maintained by the Center for Snow and Avalanche Studies, and a second weather station located near the summit of Berthoud Pass. Data captured at these stations include ambient air temperature, humidity, wind direction and wind speed. These measurements were used to evaluate wind direction and wind speed associated with a number of depositional events to better constrain the provenance of the deposited dust. Times reported are in Mountain Standard Time (ignoring Daylight Savings Time).
The Swamp Angel Study Plot is located in a sheltered clearing at the lower end of the Senator Beck Basin Study Area, at ~3,371 m, below tree-line and surrounded by sub-alpine forest, and is the primary study location for snow sampling. This protected location provided an excellent location for measuring precipitation and snowpack accumulation, where wind speeds are very low (winter hourly average was <1 m/s), and wind redistribution of snow-cover is negligible. Because the site sits in a sheltered pocket at the lower end of the Senator Beck Basin watershed, air temperature and humidity data from the Swamp Angel Study Plot are strongly influenced by the surrounding terrain. The site consists of a 6-m pipe mast with an extensive array of instruments, a stand-alone precipitation gauge, and a surrounding 30 × 30 m snow profile plot. The site is generally level, sloping 3 degrees east-north-east. Air temperature (°C) and relative humidity (%) were measured every 5 s at a fixed height on the tower. Incoming short- and long-wave radiation values are measured (W m−2) every 5 s by individual sensors at the top of the tower. Wind speed data for back trajectory modeling was collected from the Putney Study Plot, a nearby high alpine site, in order to represent basin-wide wind conditions, as opposed to the Swamp Angel Study Plot wind data, which reflects the relatively sheltered study site.
The weather station at Berthoud Pass is maintained by the US Department of Agriculture Natural Resources Conservation Service as part of the National Water and Climate Center (NWCC) at ~3,446 m elevation. It is a sub-alpine site located below tree-line. Measurements were made hourly and included snow-water equivalent (Sensotec 100″ Transducer), air temperature (YSI extended range), snow depth, soil moisture (Hydraprobe Analog), soil temperature (Hydroprobe Analog), salinity, real dielectric constant, wind direction and speed, and solar radiation. Near real-time data are available on the NWCC website. A second, higher elevation met station is also located near Berthoud Pass, a Meteorological Terminal Aviation Routine (METAR) station, located at an elevation of 3,807 m. We used the wind data from the METAR station, which is the higher site, for back trajectory modeling.
We ran several transport and dispersion simulations using the Hybrid Single Particle Lagrangian Integrated Trajectory (HYSPLIT) model provided by the National Oceanic and Atmospheric Administration (Stein et al., 2015). The HYSPLIT model calculation method is a hybrid between a Lagrangian approach, using a moving frame of reference for the advection and diffusion calculations as the trajectories or air parcels move from their initial location, and an Eulerian approach, which uses a fixed three-dimensional grid as a frame of reference to compute pollutant air concentrations. In order to determine the storm trajectories of the dust deposition events, we ran back trajectory simulations for Senator Beck Basin using a grid-point statistical interpretation archive method, the Global Data Assimilation System, within HYSPLIT.
DNA Sequencing
To examine which microorganisms were associated with the dust deposited on snow, DNA was extracted using the MoBio PowerWater DNA Isolation Kit (MoBio, Carlsbad, California). Samples were prepared for DNA extraction in a −16°C cold room using sterile technique to limit any contamination. Samples were thawed at 4°C over a 3–5 days period and processed within 48 h of melting. Due to the low dust concentration in the samples, the extraction protocol was modified as follows: melted samples were filtered onto two sterile filters (MoBio Water Filters, 0.22 μM), and the resulting DNA was pooled after extraction. Care was taken to ensure the filter was not folded onto itself to maximize the exposure of dust to the beads in the bead tube. After filtration, samples were incubated at 65°C for 10 min and subjected to 30 min of vigorous vortexing (Luhung et al., 2015). DNA extraction controls were carried out in parallel with snow samples. Extraction controls consisted of 10 mL of sterile water undergoing the same protocol as the collected snow samples including the filtration step.
The V1-V2 region of the 16S rRNA gene was sequenced for bacteria and archaea using a Thermofisher Ion Torrent Personal Genome Machine sequencer at the Microbiome Analysis Center (MBAC) at George Mason University based on the manufacturer's protocols. Bioinformatic analysis and visualization of the 16S rRNA amplicon data was conducted using the R packages dada2, phyloseq, and ggplot2 package in R (McMurdie and Holmes, 2013; Callahan et al., 2016; Wickham, 2016; R Core Team, 2018). In brief, Bam files were converted to FastQ files and demultiplexed prior to importing into R, resulting in 173,084 raw reads in nine samples. Adapter removal and barcode trimming were done in R prior to running the forward reads through the dada2 (version 1.10.1) pipeline. Standard filtering parameters were used to filter out low quality reads, and the forward reads were trimmed to a consistent length (300 base pairs) and estimated errors were calculated. After dereplication, an amplicon sequence variant (ASV) table was created and chimeras were removed. Taxonomy was assigned using RDP trainset 16 (doi: 10.5281/zenodo.801828) In phyloseq ASVs identified as chloroplast at the class level were removed. Additionally, the phylum Fusobacteria was removed because it had an ASV count of one, and genus Propionibacterium was removed as it is a published human contaminant (Sheik et al., 2018). Relative abundance was calculated and log transformed for normal distribution. Alpha diversity was calculated from the ASV counts using the Shannon diversity index (Shannon, 1948).
Statistical differences in the relative abundance of tested taxa and the Shannon diversity index values were determined using analysis of variance (ANOVA) and the Tukey multiple comparison test. To visualize differences is microbial taxonomy between sample types, Principal Coordinate Analysis (PCoA) dissimilarity plots were created using Bray-Curtis distances (Bray and Curtis, 1957).
After filtering 134,521 reads, nine samples (not including controls) remained. The extraction controls contained only 4% of the number of reads as the samples and had a significantly lower Shannon diversity index (Figure 2). Therefore, they were not included in the rest of the analysis.
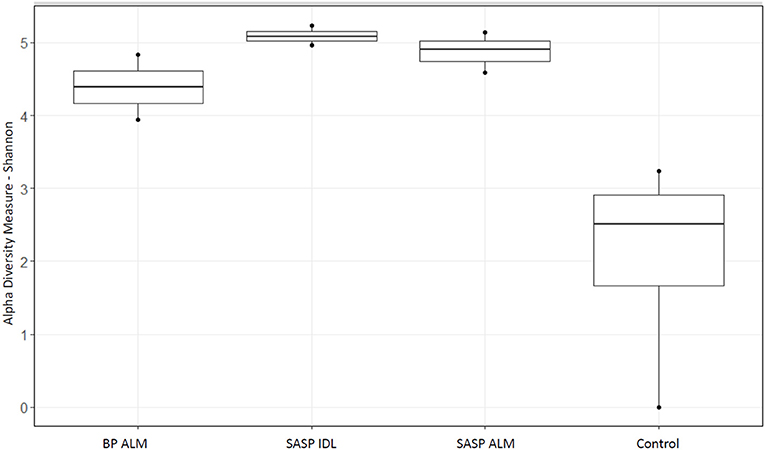
Figure 2. Shannon diversity index of extraction controls vs. dust-impacted snow samples, with Berthoud Pass merged layer (BP ALM) showing less diversity than the Swamp Angel Study Plot individual dust event layer and merged layer (SASP IDL and ALM, respectively), vs. the control.
To determine the dominant ASVs in our samples, the relative abundance for a unique ASV was averaged across site replicates. The top 10 ASVs, after averaging, for each sample were then referred to as dominant. To determine a closely related species, the dominant ASV DNA sequences were compared to sequences in the National Center for Biotechnology Information Basic Local Alignment Search Tool Nucleotide (blastn) suite (https://blast.ncbi.nlm.nih.gov/Blast.cgi) (Altschul et al., 1990). Default parameters were used for the inquiry except the 16S ribosomal RNA sequence (Bacteria and Archaea) database was selected for comparison with a max target sequences of 10. Only the top ranking alignment from a search was used for discussion and listed in Supplement Table 1.
Results
Snow Microstructure
The snow microstructural data obtained via micro-CT imaging was examined with the primary objective of determining where, within the snow matrix, the dust particles reside. Dust was most clearly identified on samples from the merged layer from Berthoud Pass, immediately after dust event D4 at the Swamp Angel Study Plot, and from the merged layer at Swamp Angel Study Plot, collected during the late spring. We examined three separate sub-samples for the individual dust event layer sample. After segmenting the snow, dust, and air phases (Figure 3), we quantified the microstructural parameters for each phase in 2-dimensional cross-sections (2D) and in bulk three dimensions (3D).
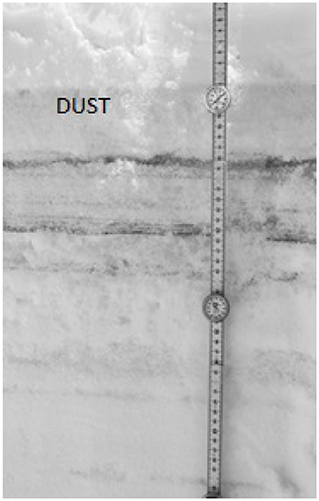
Figure 3. Near infrared image of the snow pit sampled on May 1, 2017 at Swamp Angel Study Plot highlight the merged (ALM) layer at 11 cm depth, denoted by “dust” label.
Dust layers were generally visible in snow pits excavated at the study sites, and can be readily seen in NIR images of the snow pit walls (Figure 3). The microstructural characteristics of the dust particles within the dust layer from the merged Berthoud Pass sample, post-dust event samples and the merged Swamp Angel samples are shown in Figure 4. The merged layer from Swamp Angel had the highest number of dust particles contained within the scanned sample, while merged layer from Berthoud Pass had the lowest number of dust particles. The structure thickness and surface to volume (S/V) ratio of the dust particles was relatively similar for all samples, which indicates that the dust grain sizes are consistent between both the dust event D4 from Swamp Angeland the merged layers from both Swamp Angel and Berthoud Pass. This consistency suggests that dust grains remain relatively isolated from one another in the snow matrix and do not group together as the late-season merged layer forms, which would be exhibited as differences between the microstructure of the samples from the individual dust event layer and all layers merged. Finally, we calculated the degree of anisotropy, where 0 indicates perfectly isotropic shapes and 1 indicates the theoretical completely anisotropic. Although there was some anisotropy in the shape of the grains observed, the lack of a temporal trend suggests that the dust grains do not rotate or shift in a consistent manner over time.
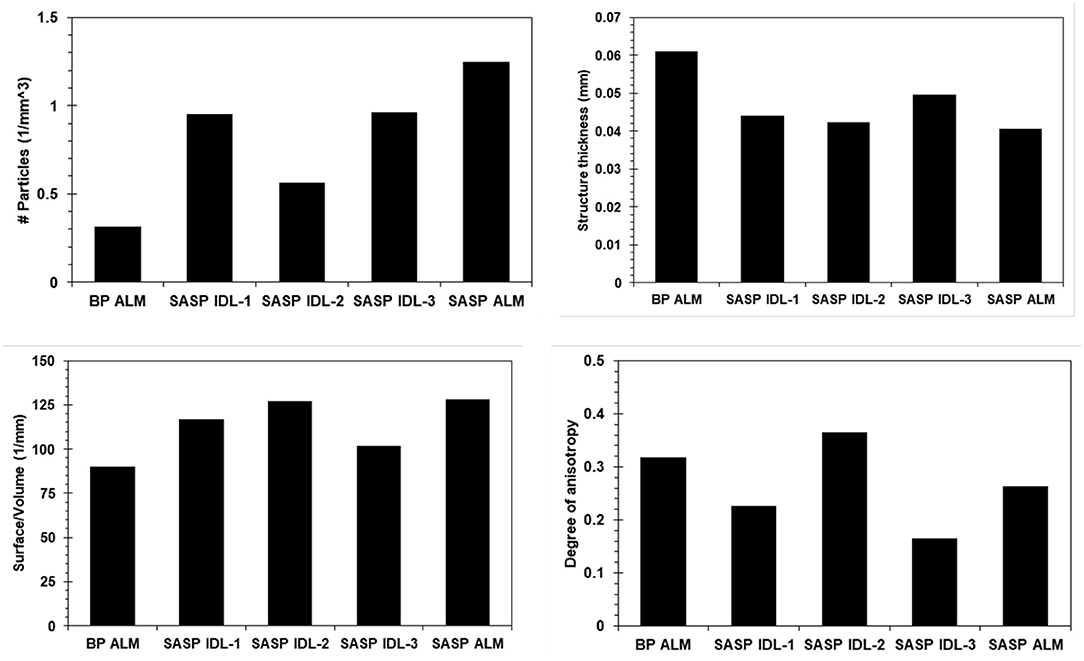
Figure 4. Microstructural characterization of the dust particles in snow samples from Berthoud Pass and Swamp Angel Study Plot BP ALM (Berthoud Pass, all layers merged), SASP IDL (Swamp Angel Study Plot individual dust event layer, subsamples 1–3), and SASP ALM (Swamp Angel Study Plot all layers merged). The top panels show the number of particles per cubic millimeter and average thickness of the particles for all five samples containing noticeable quantities of dust. The bottom panels show the surface to volume ratio and degree of anisotropy.
We note that the number of dust particles per unit volume is an inherently noisy number due to the size of the dust particles and the fact that some of the dust particles were similar in size to detector noise. For this reason, we were not able to despeckle the image beyond a low level Gaussian smoothing filter during image reconstruction. Therefore, the numerical value for dust particle density carries less validity than the relative number when comparing across samples. The Berthoud Pass sample of merged dust layers clearly had a much lower amount of dust particles compared to the merged dust layer sample from the Swamp Angel Study Plot. There is also a higher concentration of dust particles within the merged layer from Swamp Angel vs. the recently deposited snow sample collected just after the dust event D4.
We found that snow characteristics varied with sample, particularly with snow porosity. The Swamp Angel Study plot individual dust event layer snow sample had very low porosity, 5–20%, which is nearly the value of ice, while merged layers from Swamp Angel and Berthoud Passhad porosities of 54 and 62%, respectively. The Swamp Angel Study Plot merged layer sample had the highest concentration of dust particles according to the microstructural analysis, as well as the largest surface to volume ratio (S/V) value (Figure 5). The S/V values reported in Figure 5 correspond to SSA values of 9.89 and 19.7 m2/kg for the merged layers from Berthoud Pass and the Swamp Angel Study Plot, respectively, and an average of 3.00 m2/kg for the Swamp Angel Study Plot individual samples. The merged dust layers from Swamp Angel and Berthoud Pass taken at the end of the season (April 29 and May 1, respectively) have higher S/V ratios and SSA values, and corresponding smaller snow grain sizes, than the snow collected April 10 from the D4 dust event at Swamp Angel. The small variability between samples examined from the same layer compared to layers merged after deposition shows consistency among snow samples of similar history.
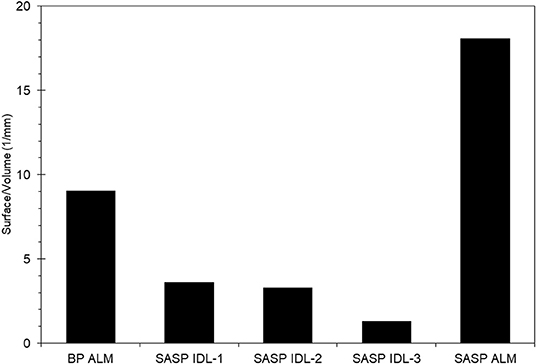
Figure 5. Surface to volume ratios of the snow phase in the Berthoud Pass merged layer sample, and the Swamp Angel Study Plot individual dust layer and Swamp Angel Study Plot merged layer samples, denoted by BP ALM, SASP IDL, and SASP ALM, respectively. Subsamples of SASP IDL samples are denoted 1–3.
Dust was generally observed to be located toward the exterior of the snow grains (Figure 6) in micro-CT data. The percentage of dust particle surface embedded within the snow matrix was calculated by dividing the total surface area of the dust particles in contact with the air by the total surface area of the dust particles. A dust particle completely embedded in snow would have 0% exposure. Any value above 0% indicates the dust is on the surface of the snow grain. We note that there is an upper limit as it is impossible for a dust particle to be 100% exposed (i.e., free floating). Percentage of surface area exposed for various deposition events is shown in Figure 7. Although the percentages of the dust surface area exposed are small, they are above 0, indicating that a small portion of dust particle surface area resides on the surface of the snow grain.
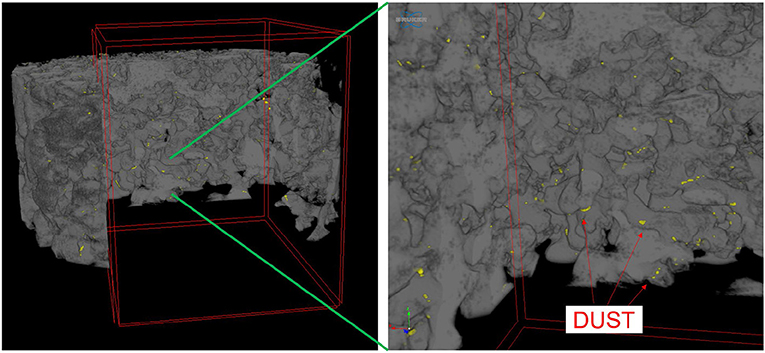
Figure 6. Three-dimensional micro-CT image of dust particles within snow matrix, showing the dust located on the surface of snow grains. In the figure, dust is yellow and the snow grains are gray.
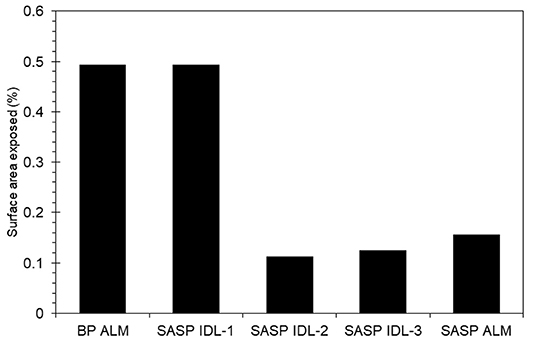
Figure 7. Dust surface area exposed to air relative to embedded in the snow grain for samples from Berthoud Pass (merged layer, BP ALM), and the Swamp Angel Study Plot (both merged layer, SASP ALM, and individual dust event layer SASP IDL, with subsamples denoted 1–3).
Meteorological Data
In the Spring of 2017, four separate depositional events occurred within Senator Beck Basin, as evidenced by visible dust layers on the snow surface (Table 2). For each event, we examined the meteorological data captured in Senator Beck Basin as well as Berthoud Pass. Specifically, we evaluated wind direction and speed to better constrain the provenance of the deposited dust (Figure 8). In each plot, the highlighted areas indicate the four events noted in Table 2. Wind speeds are shown as 1-hr average resultant wind speeds (m s−1).
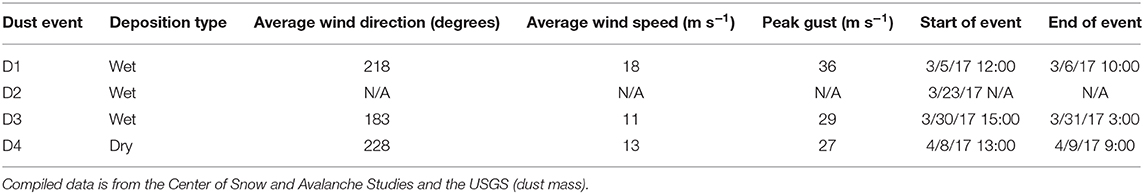
Table 2. Description of weather events in which a dust deposition event occurred and snow samples were collected.
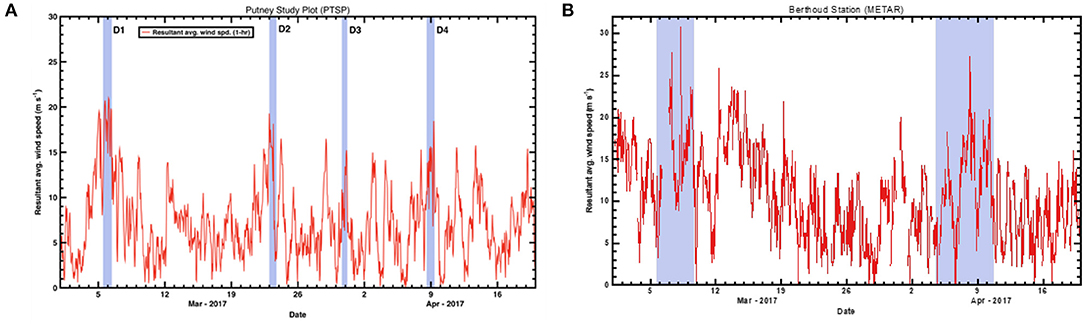
Figure 8. Resultant average wind speeds during spring 2017 at the three study plot stations. (A) shows the 1-h average wind speeds (m s−1) for Senator Beck Basin. Highlighted areas indicate four depositional events noted in Table 2. (B) shows wind data from Berthoud Pass METAR (Meteorological Terminal Aviation Routine) station collected during spring 2017. Highlighted areas indicate possible dust deposition events at Berthoud Pass.
HYSPLIT simulations were run for each of the dust events D1–D4 at Senator Beck Basin, which contributed to the merged layer in sample at the Swamp Angel Study Plot, and similarly the high wind events at Berthoud Pass. Unlike Senator Beck Basin, Berthoud Pass is not monitored regularly by on-site personnel, with dust events inferred based on depth of dust deposition layer and subsequent meteorology. The back trajectory results for each event in the Senator Beck Basin region and Berthoud Pass are shown in Figure 9. The results agree well with the average wind directions observed at the stations near Senator Beck Basin for each deposition event. In the majority of the events for the Senator Beck Basin site, the trajectories' highest frequency was found over the Four Corners region. Dust event 3 (D3) had the highest frequency of trajectories centered at the Swamp Angel Study Site. This is indicative of a weak event for which wind sources are difficult to identify accurately. Further evidence for this is reflected in low peak wind gust for D3. The back trajectory modeling for the Berthoud Pass area does not locate a specific source site as well, with the trajectories being more diffuse, particularly for the first dust deposition event (Figure 9E). Source regions are south-west of the study site, with storms originating further west than in the case of Senator Beck Basin.
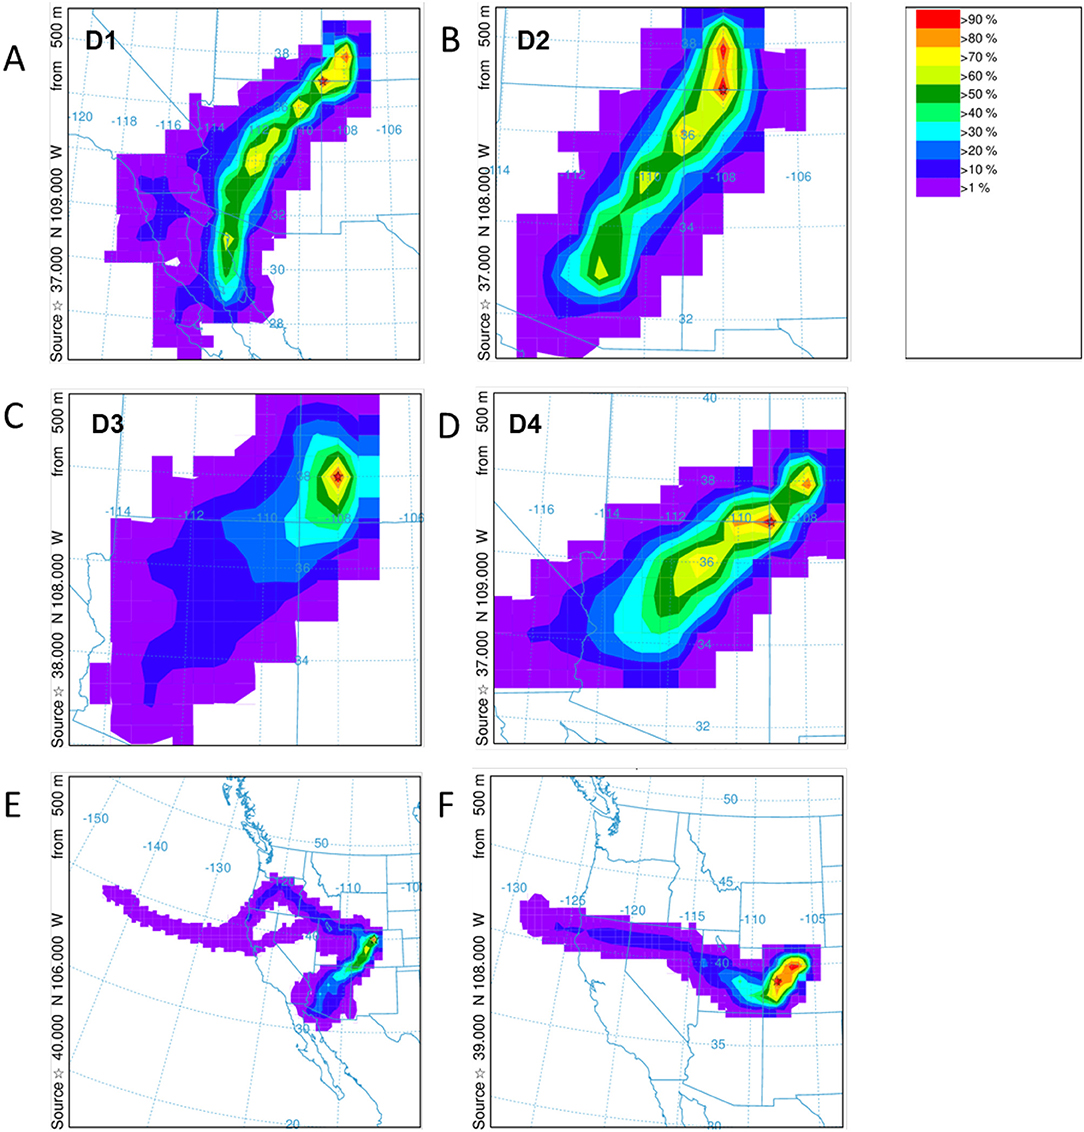
Figure 9. HYSPLIT frequency backward trajectories for the dust deposition events D1–D4 for Swamp Angel Study Plot are shown in (A–D) and Berthoud Pass (E,F). The storm systems for the identified Berthoud Pass dust events are more diffuse. Note the differences in area between panels.
DNA Sequencing
Our aim was to investigate whether there were differences in microbial community structure between locations. Using the Shannon diversity index, samples collected from the Swamp Angel Study Plot individual dust event layer had the highest diversity, while the Berthod Pass merged layer had the lowest diversity (Figure 2). Though the alpha diversity between samples was not significantly different (Figure 2), differences of beta diversity between locations were observed (Figure 10). The PCoA plot accounted for 55.7% of the variation in the dataset (Figure 10). In ordination space, samples that are closer together have similar microbial communities. The snow samples collected from the merged dust layer at Berthoud Pass cluster away from those collected from Swamp Angel Study Plot along PCoA axis 1, indicating that the microbial communities in the snow were different based on location (Figure 10). The microbial communities within the two Swamp Angel Study Plot samples cluster together. This was expected as the microbial communities from Swamp Angel Study Plot individual dust event layer contributed to the merged microbial community present in the Swamp Angel study plot merged layer samples. Interestingly, one of the Swamp Angel Study Plot merged layer replicates separated from the others along the PCoA axis 2 (Figure 10). Possible causes for a disparate microbial community in the replicate include the presence of microbes from other dusting events, community proliferation, or a combination of the two.
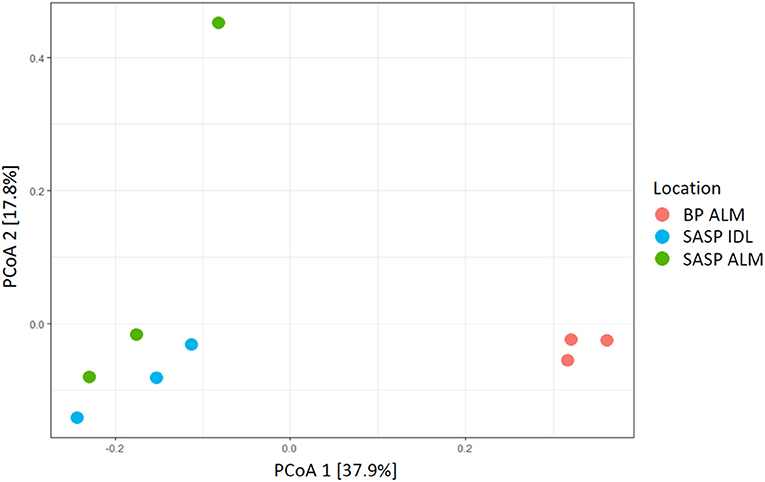
Figure 10. PCoA plot of microbial communities from three snow samples (Bray-Curtis distances). The first principal coordinate accounts for differences in microbial communities based on location. The Samples Swamp Angel merged layer (SASP ALM) and Swamp Angel individual dust event layer (SASP IDL)–are more similar to one another than to the Berthoud Pass merged layer sample (BP ALM).
Investigation of microbial taxonomy revealed 14 phyla identified in the snow samples (Figure 11). Proteobacteria, Actinobacteria, Bacteriodetes, and Acidobacteria encompassed almost 98% of the identified taxa (Figure 11). Firmicutes and Cyanobacteria encompassed ~1.0 and 0.7%, respectively (Figure 11). The abundance of Acidobacteria (P < 0.001) and Actinobacteria (P = 0.009) were significantly different between the Berthoud Pass merged layer and both Swamp Angel Study Plot samples, including the individual dust event layer and the merged dust layer. Additionally, the abundance of Bacteriodetes was significantly lower in the Berthoud Pass merged layer (P = 0.018). Further investigation at the class level revealed that the most abundant taxa were Alphaproteobacteria, Actinobacteria, Acidobacteria_Gp1, Betaproteobacteria, Cytophagia Sphingobacteriia, and Gammaproteobacteria (Figure 12). Actinobacteria were significantly more abundant in the Swamp Angel Study Plot snow samples (P = 0.009), whereas Acidobacteria (P < 0.001) were significantly more abundant in the Berthoud Pass samples (Figure 12). Cytophagia (P = 0.008) were significantly more abundant in the Swamp Angel Study Plot individual dust event layer samples when compared to the other samples tested (Figure 12). At the phylum or class taxonomic level, no significant differences were observed between the individual and merged dust event at the Swamp Angel Study Plot.
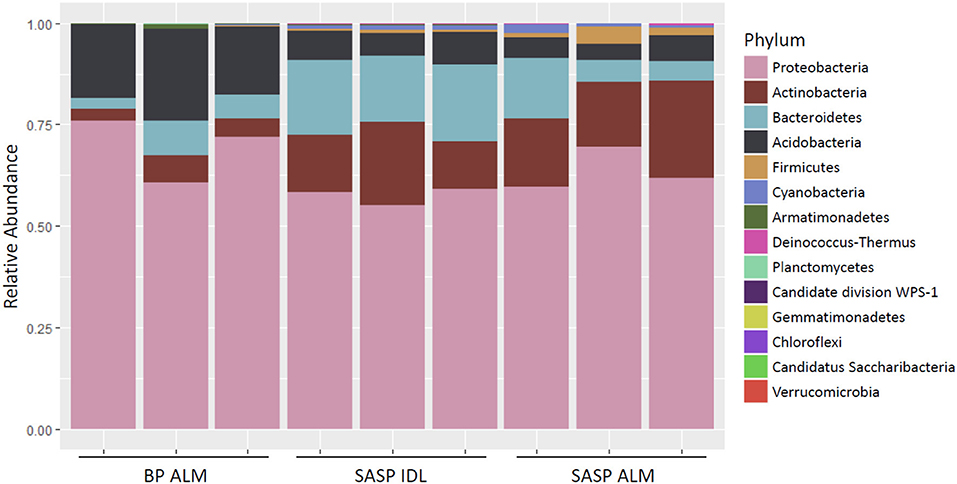
Figure 11. Relative abundance of microorganism in each replicate at the phylum level. for samples from Berthoud Pass (merged layer BP ALM), and Swamp Angel Study Plot (SASP, individual deposited layers, IDL and all layers merged, ALM).
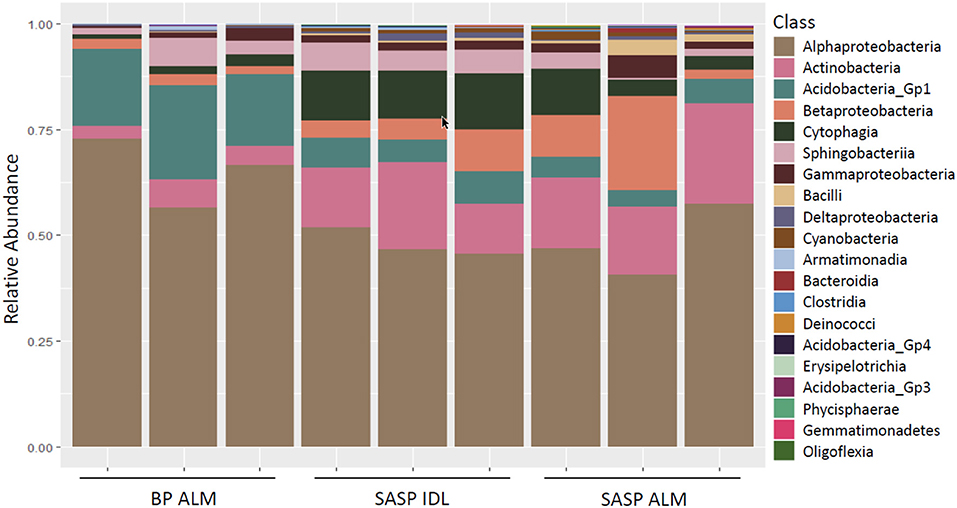
Figure 12. Relative abundance of microorganism in each replicate at the class level for samples from Berthoud Pass (BP, all layers merged, ALM), and Swamp Angel Study Plot (SASP, individual deposited layers, IDL and all layers merged, ALM).
Of the 2,799 unique amplicon sequence variants (ASVs) in our dataset, we examined the top ten dominant (based on the average relative abundance across sample replicates) detected per sampling event (Supplemental Table 1). The majority of these dominant ASVs were Proteobacteria with a few occurrences of Actinobacteria, Bacteroidetes and Acidobacteria (Supplemental Table 1). Of the four dominant ASVs that were present in all three samples, two belong to the family Acetobacteraceae and two belong to the family of Beijerinckiaceae. Additionally, three ASVs were dominant in both Swamp Angel Study Plot samples from the individual dust event and the merged dust layer, but not in the Berthoud Pass merged layer; these belong to the families Propionibacteriaceae, Cytophagaceae and Sphingomonadaceae (Supplemental Table 1). The dominant ASV nucleotide sequences were compared against sequences in the NCBI 16S ribosomal RNA sequences (Bacteria and Archaea) nucleotide database using nBLAST (Altschul et al., 1990) and GenBank (Benson et al., 2017).
Discussion
Our study provides some of the first analyses of coupled snowpack microbial and microstructural characteristics of deposited dust events and subsequent fate within the snowpack. We found that the dust particles embedded toward the outside of snow grains have a low percentage of surface area exposed to air. Microstructural analysis of the dust within the snow matrix suggests that dust particles reside at the snow/pore interface (and not the interior of the snow grains) so that a small portion of the dust particle surface is exposed to air, resulting in potential interactions between the dust particles and the microbes present in the pore space. Facilitation of these interactions could have important implications for activity and metabolism of snowpack microbes.
The increase in S/V, and corresponding SSA, of the Swamp Angel Study Plot merged layer collected April 29 when compared to the snow sample from the dust event at the same location, collected April 10, is not expected, as the typical predicted trend for snow entails the SSA decreasing over time due to temperature gradient-induced grain growth (Colbeck, 1982). Much more work is warranted, but our results do provide preliminary evidence that in some specific instances grain growth can be suppressed in the presence of dust—particularly on the micro-scale. In this instance, the formation of a melt-freeze layer shortly after dust event D4, as evidenced by the low porosities of the Swamp Angel Study Plot individual dust event layer samples, likely lead to the further formation of a crust layer then impacted by metamorphic processes. This suppression of grain growth is counterintuitive, but has been noted anecdotally by field observers at the study site. Other instances of decreases in SSA over time have been noted by Domine et al. (2009) for the case of melt-freeze layers being metamorphosed into hoar layers, and in the case of wind-induced reduction of snow grain sizes through mechanical processes.
Meteorology and subsequent back trajectory modeling suggests that the dust we examined for the Senator Beck region originated in the southern Colorado Plateau; with the wind trajectory coming from the southwest (Figure 9, top). The source region for the Berthoud Pass area is less clear (Figure 9, bottom) with two separate, and diffuse source areas, but the back trajectory modeling suggests dust originates in the Four Corners region for the first event and in central-west Colorado for the second event. These differences in dust origin may play a critical role in the microbial communities detected in the snowpack, with the differences in microbial composition being greater between sampling sites vs. in temporal differences.
Because the resolution of the micro-CT does not capture the small size of bacteria, we used a DNA sequencing approach to understand microbial community structure in the dust-impacted snow. Alpha diversity ranged from 4 to 5, which is consistent with a median diversity index of 4.15 from surface snow microbes in the Australian Alps and Swiss Alps (Wunderlin et al., 2016). Our results that location was a strong driver in microbial community composition align with other studies in the Australian and Swiss Alps (Wunderlin et al., 2016) and in the USA in the mountains in Utah (Dastrup et al., 2018).
Proteobacteria, Actinobacteria, Bacteroidetes, and Acidobacteria accounted for the majority of the detected phyla in all samples. The same top four phyla also accounted for 72–98% of the total relative abundance from Australian and Swiss Alps (Wunderlin et al., 2016). This deviates slightly from the notion of a core snow microbiome of Proteobacteria, Bacteroidetes, Firmicutes, and Cyanobacteria (Hell et al., 2013; Hauptmann et al., 2014; Wunderlin et al., 2016). Proteobacteria was the most abundant phylum found in the Colorado snowpack from this study and from the Fennoscandian and Colorado snowpack in Brown and Jumpponen (2019). There, Acidobacteria_Gp1 and Actinobacteria were also detected (Brown and Jumpponen, 2019). Proteobacteria were also found in the Greenland Ice Sheet (Perini et al., 2019a) as well as clear ice and subglacial ice in Svalbard (Perini et al., 2019b). Cytophagia were detected in snow collected from Greenland, Iceland, Svalbard, and Sweden (Lutz et al., 2016). Interestingly, the abundance of Cyanobacteria was low in all samples, though they have been found in other cryosphere environments such as glaciers in west Greenland (Uetake et al., 2010) and snow in the Canadian High Arctic (Harding et al., 2011) and the Sierra Nevada, California (Carey et al., 2016).
Considering the top ten sequence amplicon variants per site, the most closely matched organisms were detected in a variety of environments, including arid areas such as the Colorado Plateau (Sphingomonas desiccabilis) (Gundlapally and Garcia-Pichel, 2006) and Saudi Arabia (Microvirga arabica) (Veyisoglu et al., 2015). Others were detected in cold regions such as Arctic ecosystems (Huanghella arctica and Terriglobus saanensis SP1PR4) (Rawat et al., 2012; Jiang et al., 2013), Antarctic soil (Mucilaginibacter terrae) (Sedláček et al., 2017), and permafrost (Polymorphobacter fuscus) (Jia et al., 2015). Those from more extreme environments may be better adapted to survive in the alpine environment of the Colorado Rockies throughout the winter.
Of important consideration is how the physical environment of the snowpack during melt either enhances or deters microbial growth and function. In this study, we evaluated a cold, young snow, which may be more influenced by source material. It is very likely that the composition of the soil microbial community will be dictated by dominant microbes capable of replicating at the onset of melt.
Our work leads to many further important questions for consideration, namely in the linked evolution of snow grains in the presense of dust particles and the implications for the microbiota present on the dust particles. The onset of melt will lead to a dramatically altered environment for those communities present in the snowpack, both in terms of temperature and moisture content. These effects will vary spatially depending on the persistence of snowcover and the residence times of deposited dust particles and the microbiomes they contain.
Conclusions
This work offers the link between snow microstructure and the microbial communities present in dust-laden snow. The presence of these microbes has important implications for ecosystem services such as nutrient release. A fundamental understanding of microbial location and activity combined with knowledge of how they contribute to melt would provide key data to more accurately project the stability of the snow pack. Furthermore, an assessment of environmental factors affecting microbial growth is critical to understand how microbial dust transport influences snow packs. Additionally, it serves as a way to characterize microorganisms that can survive and grow once deposited onto snow packs. Combining these data with specific microbial signatures could provide a robust tool to better understand the origin and fate of dust on snow. Our data set, while limited in temporal and spatial sampling, provides preliminary examination into coupled dust and microbial impacts on snowpack characteristics. On-going work seeks to extend our observations into the full melt season impacts of microbial and microstructure co-evolution, including clean vs. dusty snow evolution.
Data Availability Statement
The raw sequences of the 16S rRNA genes generated for this study can be found in the NCBI SRA database (www.ncbi.nlm.nih.gov/sra) under the BioProject accession number PRJNA602710.
Author Contributions
This project was conceived by ZC and RB in close collaboration, who both contributed to the overall manuscript, which was equally contributed to by numerous individuals. JD collected all of the microbial samples immediately following dust events and collected all of the meteorological data. ZC and LF conducted physical property field sampling. RL conducted the micro-CT analysis, including dust analysis, and wrote much of the methodology section and the microstructural analysis sections. AT and SR processed the snow and carried out the DNA extractions. AT, SR, SD, and RJ conducted the microbial analysis. AT and RB wrote the majority of the microbial section, with contributions from SD. JF completed the back trajectory modeling and met data analysis, and wrote the majority of those sections.
Conflict of Interest
The authors declare that the research was conducted in the absence of any commercial or financial relationships that could be construed as a potential conflict of interest.
Acknowledgments
The authors wish to acknowledge funding from the Army Basic Research Funding ASSALT 6.1 program, Geospatial Research and Engineering (GRE) “Dark materials in snow and their impacts on preferential sublimation and surface roughness,” the 6.2 program Geospatial Research and Engineering (GRE) Army Terrestrial-Environmental Modeling and Intelligence System Science Technology Objective-Research (ARTEMIS STO-R) “Dynamic Undisturbed Soils Testbed to Characterize Local Origins and Uncertainties of Dust (DUST-CLOUD),” and the Engineering Research and Development Center Future Investment Funding project “Environmental forensics for reverse point sourcing and attribution.” The authors also wish to thank the Center for Snow and Avalanche Study for field support and a huge degree of help throughout this project and three reviewers whose comments and suggestions helped to greatly improve the manuscript.
Supplementary Material
The Supplementary Material for this article can be found online at: https://www.frontiersin.org/articles/10.3389/feart.2020.00122/full#supplementary-material
Supplemental Table 1. Summary of the top 10 most abundant amplicon sequence variants per site/condition. Sample BP ALM refers to the Berthoud Pass merged layer, SASP ALM refers to the Swamp Angel Study Plot merged layer, and SASP IDL refers to the Swamp Angel Study Plot individual dust layer from dust event D4.
References
Altschul, S. F., Warren, G., Webb, M., Myers, E. W., and David, J., L. (1990). Basic local alignment search tool. J. Mol. Biol. 215, 403–410. doi: 10.1016/S0022-2836(05)80360-2
Anesio, A. M., Lutz, S., Chrismas, N. A., and Benning, L. G. (2017). The microbiome of glaciers and ice sheets. NPJ Biofilms Microbi. 3:10. doi: 10.1038/S41522-017-0019-0
Benson, D. A., Mark, C., Karen, C., Karsch-Mizrachi, I., Lipman, D. J., James, O., et al. (2017). “GenBank.” Nucleic Acids Res. 45, D37–D42. doi: 10.1093/nar/gkw1070
Bray, J. R., and Curtis, J. T. (1957). An ordination of the upland forest communities of Southern Wisconsin. Ecol. Monogr. 27, 325–349. doi: 10.2307/1942268
Brown, S. P., and Jumpponen, A. (2019). Microbial ecology of snow reveals taxa-specific biogeographical structure. Microb. Ecol. 77, 946–958. doi: 10.1007/s00248-019-01357-z
Callahan, B. J., Sankaran, K., Fukuyama, J. A., McMurdie, P. J., and Holmes, S. P. (2016). Bioconductor workflow for microbiome data analysis: from raw reads to community analyses. F1000 Res. 5:1492. doi: 10.12688/f1000research.8986.2
Carey, C. J., Hart, S. C., Aciego, S. M., Riebe, C. S., Blakowski, M. A., and Aronson, E. L. (2016). Microbial community structure of subalpine snow in the Sierra Nevada, California. Arct. Antarct. Alp. Res. 48, 685–701. doi: 10.1657/AAAR0015-062
Colbeck, S. (1982). An overview of seasonal snow metamorphism. Rev. Geophys. Space GE. 20, 45–61. doi: 10.1029/RG020i001p00045
Comrie, A. C. (2005). Climate factors influencing coccidioidomycosis seasonality and outbreaks. Environ. Health Persp. 113:688. doi: 10.1289/ehp.7786
Conway, H., Gades, A., and Raymond, C. F. (1996). Albedo of dirty snow during conditions of melt. Water Resour. Res. 32, 1713–1718. doi: 10.1029/96WR007212
Cook, J. M., Hodson, A. J., Gardner, A. S., Flanner, M., Tedstone, A., Williamson, C., et al. (2017b). Quantifying bioalbedo: a new physically based model and discussions of empirical methods for characterising biological influence on ice and snow albedo. Cryosphere 11, 2611–2632. doi: 10.5194/tc-2017-73
Cook, J. M., Hodson, A. J., Taggart, A. J., Mernild, S. H., and Tranter, M. (2017a). A predictive model for the spectral “bioalbedo” of snow. J. Geophys. Res. Earth Surf. 122, 434–454. doi: 10.1002/2016JF003932
Dastrup, D. B., Carling, G. T., Collins, S. A., Nelson, S. T., Fernandez, D. P., Tingey, D. G., et al. (2018). Aeolian dust chemistry and bacterial communities in snow are unique to airshed locations across northern Utah, USA. Atmos. Environ. 193, 251–261. doi: 10.1016/j.atmosenv.2018.09.016
Dial, R. J., Ganey, G. Q., and Skiles, S. M. (2018). What color should glacier algae be? An ecological role for red carbon in the cryosphere. FEMS Microbiol. Ecol. 94:fiy007. doi: 10.1093/femsec/fiy007
Domine, F., Taillandier, A.-S., Cabanes, A., Douglas, T. A., and Sturm, M. (2009). Three examples where the specific surface area of snow increased over time. Cryosphere 3, 31–39. doi: 10.5194/tc-3-31-2009
Favet, J., Lapanje, A., Giongo, A., Kennedy, S., Aung, Y. Y., Cattaneo, A., et al. (2013). Microbial hitchhikers on intercontinental dust: catching a lift in Chad. ISME J. 7, 850–867. doi: 10.1038/ismej.2012.152
Grantham, N. S., Reich, B. J., Pacifici, K., Laber, E. B., Menninger, H. L., Henley, J. B., et al. (2015). Fungi identify the geographic origin of dust samples. PLoS ONE. 10:e0122605. doi: 10.1371/journal.pone.0122605
Gundlapally, S. R., and Garcia-Pichel, F. (2006). The community and phylogenetic diversity of biological soil crusts in the colorado plateau studied by molecular fingerprinting and intensive cultivation. Microb. Ecol. 52, 345–57. doi: 10.1007/s00248-006-9011-6
Harding, T., Jungblut, A. D., Lovejoy, C., and Vincent, W. F. (2011). Microbes in high arctic snow and implications for the cold biosphere. Appl. Environ. Microb. 77, 3234–3243. doi: 10.1128/AEM.02611-10
Hauptmann, A. L., Stibal, M., Bælum, J., Sicheritz-Pontén, T., Brunak, S., Bowman, J. S., et al. (2014). Bacterial diversity in snow on North Pole ice floes. Extremophiles 18, 945–951. doi: 10.1007/s00792-014-0660-y
Hell, K., Edwards, A., Zarsky, J., Podmirseg, S. M., Girdwood, S., Pachebat, J. A., et al. (2013). The dynamic bacterial communities of a melting high Arctic glacier snowpack. ISME J. 7, 1814–1826. doi: 10.1038/ismej.2013.51
Jia, L., Xiaomin, F., Zhong, Z., Lu, H., Xiaocui, H., Zhenquan, L., and Jie, L. V. (2015). “Polymorphobacter fuscus sp. nov., isolated from permafrost soil, and emended description of the genus polymorphobacter.” J. Syst. Evol. Micr. 65, 3920–3925. doi: 10.1099/ijsem.0.000514
Jiang, F., Mengchen, X., Lu, C., Wenjing, K., Fang, P., Jun, D., et al. (2013). Huanghella arctica gen. nov., sp. nov., a bacterium of the family cytophagaceae isolated from arctic tundra soil. Int J. Syst. Evol. Micr. 63, 696–702. doi: 10.1099/ijs.0.041533-0
Kellogg, C. A., and Griffin, D. W. (2006). Aerobiology and the global transport of desert dust. Trends Ecol. Evol. 21, 638–644. doi: 10.1016/j.tree.2006.07.004
Lawrence, C. R., Painter, T. H., Landry, C. C., and Neff, J. C. (2010). Contemporary geochemical composition and flux of aeolian dust to the San Juan Mountains, Colorado, United States. J. Geophys. Res. Biogeo. 115, 1–15. doi: 10.1029/2009JG001077
Luhung, I., Wu, Y., Ng, C. K., Miller, D., Cao, B., and Chang, V. W. C. (2015). Protocol improvements for low concentration DNA-based bioaerosol sampling and analysis. PLoS ONE 10:e0141158. doi: 10.1371/journal.pone.0141158
Lutz, S., Anesio, A. M., Edwards, A., and Benning, L. G. (2015). Microbial diversity on Icelandic glaciers and ice caps. Front. Microbiol. 6:307. doi: 10.3389/fmicb.2015.00307
Lutz, S., Anesio, A. M., Jorge Villar, S. E., and Benning, L. G. (2014). Variations of algal communities cause darkening of a Greenland glacier. FEMS Microbiol. Ecol. 89, 402–414. doi: 10.1111/1574-6941.12351
Lutz, S., Anesio, A. M., Raiswell, R., Edwards, A., Newton, R. J., Gill, F., et al. (2016). The biogeography of red snow microbiomes and their role in melting arctic glaciers. Nat. Commun. 7:11968. doi: 10.1038/ncomms11968
Maccario, L., Sanguino, L., Vogel, T. M., and Larose, C. (2015). Snow and ice ecosystems: not so extreme. Res. Microbiol. 166, 782–795. doi: 10.1016/j.resmic.2015.09.002
McMurdie, P. J., and Holmes, S. (2013). Phyloseq: an R package for reproducible interactive analysis and graphics of microbiome census data. PLoS ONE 8:e61217. doi: 10.1371/journal.pone.0061217
Meola, M., Lazzaro, A., and Zeyer, J. (2015). Bacterial composition and survival on Sahara dust particles transported to the European Alps. Front. Microbiol. 6:1454. doi: 10.3389/fmicb.2015.01454
Miteva, V., Teacher, C., Sowers, T., and Brenchley, J. (2009). Comparison of the microbial diversity at different depths of the GISP2 Greenland ice core in relationship to deposition climates. Environ. Microbiol. 11, 640–656. doi: 10.1111/j.1462-2920.2008.01835.x
Painter, T. H., Barrett, A. P., Landry, C. C., Neff, J. C., Cassidy, M. P., Lawrence, C. R., et al. (2007). Impact of disturbed desert soils on duration of mountain snow cover. Geophys. Res. Lett. 34, 1–6. doi: 10.1029/2007GL030284
Painter, T. H., Duval, B., Thomas, W. H., Mendez, M., Heintzelman, S., and Dozier, J. (2001). Detection and quantification of snow algaei with an airborne imaging spectrometer. Appl. Environ. Microbiol. 67, 5267–5272. doi: 10.1128/AEM.67.11.5267-5272.2001
Painter, T. H., Skiles, S. M., Deems, J. S., Bryant, A. C., and Landry, C. C. (2012). Dust radiative forcing in snow of the Upper Colorado River Basin: 1. A 6 year record of energy balance, radiation, and dust concentrations. Water Resour. Res. 48:7521. doi: 10.1029/2012WR011985
Perini, L., Gostinčar, C., Anesio, A. M., Williamson, C., Tranter, M., and Gunde-Cimerman, N. (2019b). Darkening of the greenland ice sheet: fungal abundance and diversity are associated with algal bloom. Front. Microbiol. 10:557. doi: 10.3389/fmicb.2019.00557
Perini, L., Gostinčar, C., and Gunde-Cimerman, N. (2019a). Fungal and bacterial diversity of Svalbard subglacial ice. Sci. Rep. 9:20230. doi: 10.1038/s41598-019-56290-5
Perkins, S. (2001). Dust, the thermostat: how tiny airborne particles manipulate global climate. Sci. News. 160, 2000–2002. doi: 10.2307/4012776
R Core Team (2018). R: A Language and Environment for Statistical Computing (version R 3.5.2). Vienna: R Foundation for Statistical Computing.
Rawat, S. R., Minna, K., Männist, Ö., Valentin, S., Lynne, G., Matt, N., et al. (2012). Complete genome sequence of terriglobus saanensis type strain SP1PR4T, an acidobacteria from tundra soil. Stand. Genomic. Sci. 7, 59–69. doi: 10.4056/sigs.3036810
Schuerger, A. C., Smith, D. J., Griffin, D. W., Jaffe, D. A., Wawrik, B., Burrows, S. M., et al. (2018). Science questions and knowledge gaps to study microbial transport and survival in Asian and African dust plumes reaching North America. Aerobiologia. 34, 425–435. doi: 10.1007/s10453-018-9541-7
Sedláček, I., Roman, P., Stanislava, K., Ivana, M., Pavla, H., Eva, S., et al. (2017). Mucilaginibacter terrae sp. nov., isolated from antarctic soil. Int. J. Syst. Evol. Microbiol. 67, 4002–4007. doi: 10.1099/ijsem.0.002240
Sevruk, B. (ed.). (1992). Snow Cover Measurements and Areal Assessment of Precipitation And Soil Moisture. Geneva: Secretariat of the World Meteorological Organization. p. 283.
Shannon, C. E. (1948). A mathematical theory of communication. Bell Syst. Tech. J. 27, 379–423. doi: 10.1002/j.1538-7305.1948.tb01338.x
Sheik, C. S., Reese, B. K., Twing, K. I., Sylvan, J. B., Grim, S. L., Schrenk, M. O., et al. (2018). Identification and removal of contaminant sequences from ribosomal gene databases: lessons from the census of deep life. Front. Microbiol. 9:840. doi: 10.3389/fmicb.2018.00840
Skiles, S. M., Flanner, M., Cook, J. M., Dumont, M., and Painter, T. H. (2018). Radiative forcing by light-absorbing particles in snow. Nat. Clim. Change 8, 964–971. doi: 10.1038/s41558-018-0296-5
Skiles, S. M., Painter, T. H., Belnap, J., Holland, L., Reynolds, R. L., Goldstein, H. L., et al. (2015). Regional variability in dust-on-snow processes and impacts in the Upper Colorado River Basin. Hydrol. Process. 29, 5397–5413. doi: 10.1002/hyp.10569
Stein, A. F., Draxler, R. R., Rolph, G. D., Stunder, B. J. B., Cohen, M. D., and Ngan, F. (2015). NOAA's HYSPLIT atmospheric transport and dispersion modeling system. B. Am. Meteorol. Soc. 96, 2059–2077. doi: 10.1175/BAMS-D-14-00110.1
Uetake, J., Naganuma, T., Hebsgaard, M. B., Kanda, H., and Kohshima, S. (2010). Communities of algae and cyanobacteria on glaciers in west Greenland. Polar Sci. 4, 71–80. doi: 10.1016/j.polar.2010.03.002
Veyisoglu, A., Tatar, D., Saygin, H., Inan, K., Cetin, D., Guven, K., et al. (2015). Microvirga makkahensis sp. nov., and Microvirga arabica sp. nov., isolated from sandy arid soil. Antonie van Leeuwenhoek. 109, 287–296. doi: 10.1007/s10482-015-0631-z
Weil, T., De Filippo, C., Albanese, D., Donati, C., Pindo, M., Pavarini, L., et al. (2017). Legal immigrants: invasion of alien microbial communities during winter occurring desert dust storms. Microbiome 5:32. doi: 10.1186/s40168-017-0249-7
Weir-Brush, J. R., Garrison, V. H., Smith, G. W., and Shinn, E. A. (2004). The relationship between gorgonian coral (Cnidaria: Gorgonacea) diseases and African dust storms. Aerobiologia 20, 119–126. doi: 10.1023/B:AERO.0000032949.14023.3a
Wunderlin, T., Ferrari, B., and Power, M. (2016). Global and local-scale variation in bacterial community structure of snow from the Swiss and Australian Alps. FEMS Microbiol. Ecol. 92, 1–12. doi: 10.1093/femsec/fiw132
Keywords: dust, microbes, snow, micro-computed tomography, microstructure
Citation: Courville ZR, Lieblappen RM, Thurston AK, Barbato RA, Fegyveresi JM, Farnsworth LB, Derry J, Jones RM, Doherty SJ and Rosten SA (2020) Microorganisms Associated With Dust on Alpine Snow. Front. Earth Sci. 8:122. doi: 10.3389/feart.2020.00122
Received: 29 July 2019; Accepted: 31 March 2020;
Published: 29 April 2020.
Edited by:
Melody Sandells, Northumbria University, United KingdomReviewed by:
Arwyn Edwards, Aberystwyth University, United KingdomAndrew Jonathan Hodson, The University Centre in Svalbard, Norway
Copyright © 2020 Courville, Lieblappen, Thurston, Barbato, Fegyveresi, Farnsworth, Derry, Jones, Doherty and Rosten. This is an open-access article distributed under the terms of the Creative Commons Attribution License (CC BY). The use, distribution or reproduction in other forums is permitted, provided the original author(s) and the copyright owner(s) are credited and that the original publication in this journal is cited, in accordance with accepted academic practice. No use, distribution or reproduction is permitted which does not comply with these terms.
*Correspondence: Zoe R. Courville, em9lLnIuY291cnZpbGxlQHVzYWNlLmFybXkubWls