 R. D. Moore
 Ben Pelto
 Brian Menounos
 David Hutchinson
- 1Department of Geography, University of British Columbia, Vancouver, BC, Canada
- 2Geography Program and Natural Resources and Environmental Studies Institute, Prince George, BC, Canada
- 3Environment and Climate Change Canada, Vancouver, QC, Canada
This study focused on the effects of glacier wastage on streamflow in the Canadian portion of the Columbia River headwaters over the period 1977 to 2017. Between 1985 and 2013, glacier coverage decreased by up to 2% of catchment area for the 35 study catchments. The mean wastage flux contribution to streamflow had a positive relation with fractional glacier coverage and an inverse relation with catchment water yield. Glacier mass change estimates suggest that wastage flux contributions declined between 1985–1999 and 2000–2018, but the estimates are subject to substantial uncertainty. Annual wastage flux contributions over a four-year period for two study catchments ranged from 8 to 13% of annual water yield for a catchment with 17% glacier cover, with glaciers extending below treeline, and 9–19% for a smaller alpine catchment with 57% glacier cover. After accounting statistically for climatic forcing and non-glacial contributions to streamflow, August runoff from glacierized catchments decreased through time at a rate that was linearly related to loss of glacier cover. The analyses suggest that glacier-melt contributions to August runoff have already have passed peak water, and that these reductions have exacerbated a regional climate-driven trend to decreased August streamflow contributions from unglacierized areas.
1. Introduction
Glaciers make significant contributions to streamflow and water resources in many parts of the world (Barnett et al., 2005; Kaser et al., 2010). Contributions of glaciers to streamflow are particularly important during periods of warm, dry weather, and have been detected even for glacier cover as low as about 1 or 2% (Stahl and Moore, 2006; Huss, 2011). Glaciers in many regions are experiencing sustained negative mass balance conditions, which are expressed to varying degrees by thinning and/or terminal retreat (Zemp et al., 2015; IPCC, 2019), and the hydrological consequences are of interest for both scientific and practical reasons.
It is generally accepted that glacier contributions to streamflow in the presence of climatic warming should follow a trajectory that begins with an initially increasing phase associated with rising snowlines and loss of firn, with streamflow eventually peaking and then declining as glaciers retreat either until they disappear or reach a new glacio-climatic equilibrium (Jansson et al., 2003; Moore et al., 2009; Baraer et al., 2012). An important question relates to the duration of the various phases, particularly when using historical hydrological records to plan for future land use, water allocation or infrastructure development. Based on a review of 15 studies from around the world, Casassa et al. (2009) observed that increasing trends tended to be found in high-elevation catchments or those with high glacier coverage, while decreasing trends tended to be found in low-elevation catchments or those with low glacier coverage. In simulations using future climate projections, Huss and Hock (2018) found that peak water occurs later in basins with larger glaciers and higher ice-cover fractions. Carnahan et al. (2019) developed a numerical model using idealized glacier geometry and climatic forcing to explore the time scale of the peak water cycle, including the effect of vegetation succession on deglaciated forelands. Their study suggests that the duration of the rising phase can last from a few decades to over a century and scales with glacier response time, which they found to vary with climatic conditions and basin slope.
The modeling domains of Huss and Hock (2018) and Carnahan et al. (2019) focused on the drainage area associated with the outlet of the glacier at the start of the simulation period, although their simulations did include the effects of runoff generation from the deglaciated areas exposed by glacier retreat. However, neither study explored how glacier changes, in conjunction with trends in streamflow production from pre-existing non-glacier areas, would be expressed as streamflow variability at the outlets of partially glacierized catchments.
Recent studies that applied detailed process-based numerical models with dynamic glacier routines and realistic boundary conditions (e.g., vegetation, topography, and atmospheric forcing) to partially glacierized catchments suggest that the response of streamflow to climate-forced glacier changes may be more complex than the simplified “peak water cycle” outlined by Jansson et al. (2003) and Moore et al. (2009). Frans et al. (2016) and Frans et al. (2018) demonstrated that decadal-scale climatic variability can generate secondary cycles superimposed on that generated by a longer-term climatic trend. They also demonstrated that there can be substantial variation among catchments within a region.
Model-based approaches, such as applied by Frans et al. (2018), explicitly resolve effects of both glacier retreat and trends in streamflow production from unglacierized parts of a catchment. However, they involve substantial investments in time and expert resources, and are also subject to a range of uncertainties related to model structure, model parameterization, and input data. Unfortunately, due to the significant computing time required to run process-based, spatially distributed models, it is not feasible to conduct comprehensive multi-objective testing and uncertainty analyses as is possible with simpler models (Schaefli and Huss, 2011; Jost et al., 2012; Finger et al., 2015).
While empirical approaches may be, in some ways, easier to apply than model-based analyses for studying the glacier-driven peak water cycle, a complication in trying to use empirical approaches is that measured streamflow represents the integrated contributions from both the glaciers and the unglacierized portions of a catchment. While it is possible to separate these contributions using tracers, as done by Nolin et al. (2010), such information is not widely available, especially for regional scales and multi-decadal time series. Another complication with empirical studies is that trends associated with glacier changes can be confounded by trends in climatic forcing. Therefore, any interpretation of empirical trend analyses must explicitly address both these sources of variability.
The objective of this study was to determine the current status of streamflow trends in glacier-fed catchments in the Canadian portion of the Columbia River headwaters, which have glacier-cover fractions from 0 to almost 0.2, and which have experienced widespread glacier retreat over the last four decades (Bolch et al., 2010). This study uses a regional statistical approach to gain insights into the effect of glacier changes relative to the effects of streamflow contributions from the unglacierized portions of the catchments. However, unlike the regional studies by Fleming et al. (2006) and Stahl and Moore (2006), who only drew upon streamflow and climatic data, we also draw upon information on glacier area and mass changes during the study period to help inform the interpretation of streamflow trends.
2. Data and Methods
2.1. Study Area
This study focused on the Canadian portion of the upper Columbia River basin, located in southeastern British Columbia, Canada (Figure 1). The topography of the Columbia River headwaters is dominated by the Columbia Mountains, which comprise the Monashee, Selkirk, and Purcell Mountains (in order from west to east), with the western slope of the Rocky Mountains defining the eastern boundary. Elevations range from below 1,000 m above sea level (masl) in the main valley bottoms to over 3,000 masl on the mountain peaks.
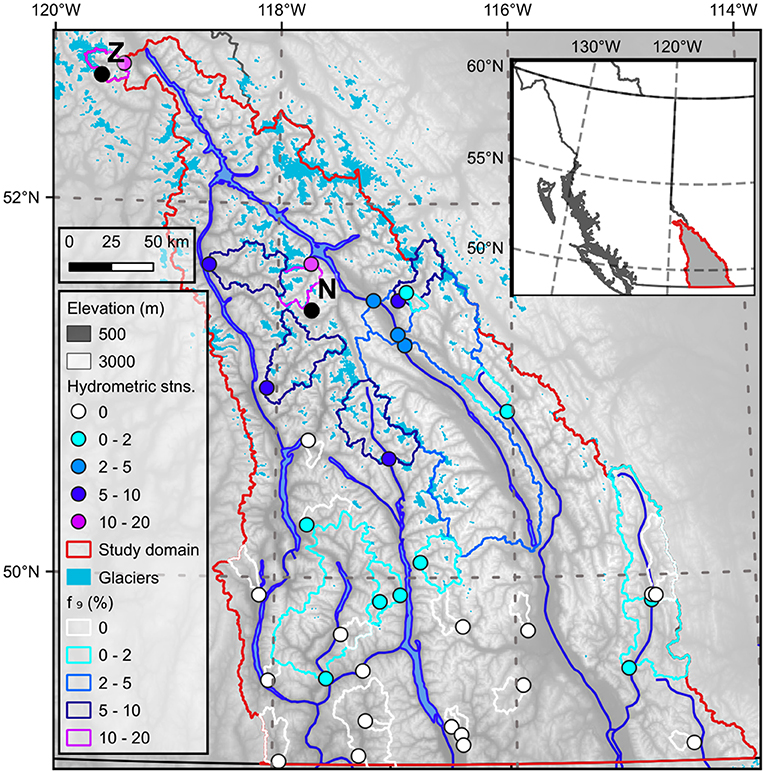
Figure 1. The study area showing hydrometric stations used in this analysis, including gauge locations and associated catchment divides along with major rivers, lakes, and reservoirs (blue lines and polygons), glaciers (blue filled polygons), and the boundary of the study domain (red polygon). Symbols for gauging station locations and catchment divides are colour-coded based on the percent glacier cover in the catchment. The inset map shows the study area located within British Columbia, Canada. The letters “Z” and “N” indicate the locations of Zillmer Glacier (within the Canoe River catchment) and Nordic Glacier.
The regional climate is dominated in autumn and winter by the passage of frontal-cyclonic weather systems that travel eastward across the north Pacific before traversing southern BC. In summer, anticyclonic systems tend to dominate, leading to extended spells of clear, dry weather (Moore et al., 2010). The mountain chains are oriented roughly perpendicular to the dominant westerly circulation. The Monashees, Selkirks, and the west slope of the Purcells are dominated by cool to cold, moderately wet winters and warm, moderately dry summers (Chilton, 1981). The east slope of the Purcells and the Rocky Mountains tend to be drier with colder winters than the western part of the catchment.
Based on outlines from 2005, there were 2,078 glaciers in the Columbia River basin covering 1,750 km2 (Bolch et al., 2010). These glaciers ranged from 1,300 to 3,140 m a.s.l. with a mean elevation range of 2,290–2,700 m a.s.l. Glacier areas ranged from the minimum mapped area of 0.05 km2 to a maximum of 44 km2, with an average of 0.84 km2. Using the ice thickness estimates of Farinotti et al. (2019), estimated ice volume for year 2000 in the upper Columbia River basin was 103 km3.
The dominant vegetation cover is coniferous forest that extends up to about 1,800 masl. Forest cover characteristics reflect the effects of disturbances associated with mining and forest harvesting, which extend back over a century, as well as fires and, over the last two decades, mortality associated with Mountain Pine Beetle.
2.2. Streamflow Data
This study was based on records of streamflow at gauges operated by the Water Survey of Canada (WSC), which were obtained through Environment and Climate Change Canada's National Water Archive (Environment Climate Change Canada, 2018). Hydrometric data were accessed using the R package tidyhydat.
Analyses focused on the period from 1977 to present to avoid potential complications associated with the 1976–1977 shift in the Pacific Decadal Oscillation, which influenced streamflow throughout western North America (Whitfield et al., 2010). The period from 1977 to present has been dominated by persistently negative mass balance throughout western North America (Moore et al., 2009; Naz et al., 2014; Pelto, 2018; O'Neel et al., 2019). Use of a common period of record within a region helps to ensure that all catchments experienced similar climatic variability.
Stations were selected from the WSC network based on the following criteria: (1) currently active, (2) established prior to 1977, (3) unregulated flow, (4) drainage area less than 10,000 km2, and (5) at least 36 years of record from 1977 to present to maximize statistical power and ensure the stations represent a common period of record. In addition, this record length permits the application of multiple regression models with three predictor variables. A total of n = 35 stations met all the criteria (Figure 1).
The subset of hydrometric gauges selected for analysis monitor varying contributions from glaciers, from non-glacierized to a maximum of 19% glacier cover in 1985 (for Canoe River, WSC station number 08NC004) (Figure 2). Generally, gauges on non-glacierized catchments are located in the southwestern portion of the Columbia Basin and have lower median elevations (Figures 1, 2). Catchments with glacier cover are generally greater than 100 km2 in area and have median elevations above 1,600 masl (Figure 2). Further information on the catchments is provided in the file “cbt_metadata.xlsx,” which has been posted on the zenodo.org repository (see data availability statement for the URL).
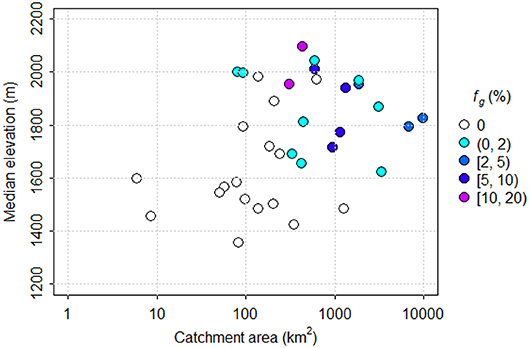
Figure 2. Scatterplot of median catchment elevation vs. drainage area for the subset of catchments used in this analysis. Symbol color indicates catchment glacier cover.
2.3. Climate Data
Time series of monthly mean air temperature and total monthly precipitation for each gauging station were extracted from the ClimateWNA application for locations corresponding to the gauging stations (Hamann et al., 2013). ClimateWNA is based on the PRISM gridded climate product (Daley et al., 2008), and can generate monthly time series for 1899 to near present for air temperature, precipitation, and several derived variables for specified point locations via interpolation from the baseline grid. Because these values were used only as indices of the interannual variability of climatic conditions rather than as representative values for the catchment area, it was deemed not necessary to correct for elevation differences.
2.4. Glacier Extent
The earliest glacier extents and elevations used in this analysis were based on photogrammetric analysis by the BC Government through the Terrain Resource Information Management (TRIM) program (Schiefer et al., 2007). The aerial photographs spanned the period 1982–1988, with a median date weighted by mapped area of 1985. Bolch et al. (2010) corrected these glacier polygons for gross errors and used them with additional polygons derived from Landsat imagery to yield glacier extents for the period 1985 and 2005. We updated extents determined by Bolch et al. (2010) using the same methods (ratio of Landsat bands 5 and 7). The uncertainties will be similar to those described in Bolch et al. (2010).
Fractional glacier cover within the study catchments was calculated by intersecting the glacier polygons with catchment polygons, which were accessed via Government of Canada (2019). All spatial analyses were conducted within R using the raster and sf packages. In some of the analyses described below, we used an approximate mean glacier cover over the period, computed as the average of the values for 1985 and 2013.
2.5. Glacier Mass Change
Glacier mass change for gauged catchments within the Columbia River headwaters was derived through differencing of sequential digital elevation models (DEMs) for two periods, 1985–1999 and 2000–2018. For both periods, height changes were converted to mass changes per unit area by multiplying by an assumed glacier density of 850 kg·m−3 (Huss, 2013).
For the 2000–2018, we used repeat stereo imagery from the Advanced Spaceborne Thermal Emission and Reflection Radiometer (ASTER) visible and near infrared instrument for the period of 2000–2018 and trend analyses from them (Menounos et al., 2019). For 1985–1999, we used results derived by Schiefer et al. (2007). For 1985, Schiefer et al. (2007) used the TRIM DEM, which was derived from aerial photography with a horizontal resolution of 25 m. The reported horizontal and vertical accuracies of TRIM elevation data are ± 10 and ± 5 m, respectively (British Columbia Ministry of Environment, Land and Parks, 1992). For 1999, Schiefer et al. (2007) used the Shuttle Radar Topography Mission (SRTM) DEM. As described in Schiefer et al. (2007), the SRTM DEM likely reflects the elevation of the glaciers at the end of the 1999 ablation season. Height changes derived by Schiefer et al. (2007) were converted to mass changes per unit area by multiplying by an assumed glacier density of 850 kg·m−3 (Huss, 2013).
Radar penetration associated with the STRM DEM could cause an overestimate in mass loss from the 1985 to 1999 period estimated by Schiefer et al. (2007), as penetration up to 10 m may have occurred in the accumulation zones (Rignot et al., 2001). Schiefer et al. (2007) bias-corrected the SRTM elevations by removing elevation trends off glaciers, but there remains the possibility that some positive bias exists in the estimates of mass loss in regions of substantial radar penetration.
Annual geodetic balance for the Nordic Creek and Canoe River catchments was calculated from 2015 to 2018 using coregistered late summer DEMs derived from Lidar and distributed estimates of density based on surface classification of ice, snow, and firn surfaces. See Pelto et al. (2019) for details of the methods.
2.6. Wastage Flux Contribution to Streamflow
When glaciers experience a net mass loss at the catchment scale, the lost glacier storage represents a net contribution to catchment outflow. Some of this glacier wastage may be lost to evaporation (e.g., from lakes downstream of the glaciers), and some may exit a catchment as groundwater. If evaporation of glacial meltwater and losses via groundwater are negligible, then the wastage flux contribution to streamflow, Qwf, can be assumed to equal −ΔSg, where ΔSg is the net mass change from glaciers over some time interval. When viewed as a streamflow contribution, ΔSg is commonly expressed as an average depth of water over the catchment area.
Wastage flux contributions were computed from glacier storage changes determined for the periods 1985–1999 and 2000–2018, as described in the preceding section. The value of the wastage flux contribution to streamflow for each catchment was then converted to a fraction of the total outflow from the catchment for each period, Q, computed from streamflow data and expressed as an average depth of water.
To explore the interannual variability of wastage flux contributions, they were also calculated on an annual time step using geodetic mass balance for the Canoe River and Nordic Creek catchments (Table 1). In this analysis, catchment-scale glacier storage change was computed as
where fg is the fractional glacier coverage in the catchment and Ba is the annual specific glacier net balance (mm) derived by Pelto et al. (2019).
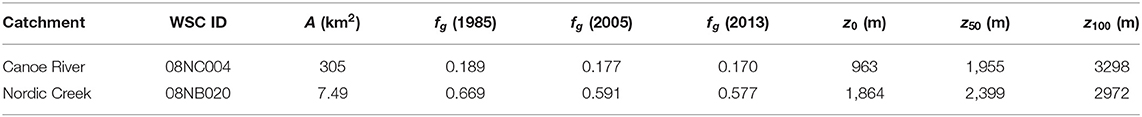
Table 1. Catchment characteristics for Canoe River and Nordic Creek, including Water Survey of Canada station number, catchment area, fractional glacier coverage and the minimum (z0), median (z50) and maximum (z100) elevations.
2.7. Regression Analysis of August Streamflow
This analysis broadly followed the approach applied to all of BC by Stahl and Moore (2006). However, whereas Stahl and Moore (2006) standardized monthly streamflow data and predictor variables, we converted each monthly streamflow value from a mean discharge in m3s−1 to a runoff depth in mm, and retained the predictor variables in their original units.
Following Stahl and Moore (2006), we focused on August streamflow for two reasons. First, glacier-melt contributions to streamflow generally peak in August due to the combination of relatively high energy supply and high snowlines. Earlier in the year (May–July), seasonal snowmelt is a major cause of streamflow variability from year to year, and can obscure the role of glacier-melt contributions. Later in the year (September and October), energy supply declines and the influence of precipitation (both rain and snow) increases in the study region. Second, August is often a period of low flows and high water temperatures in unglacierized catchments, so that glacier-melt contributions can become critical in terms of water supply and fish habitat, particularly for cold- and cool-water species such as salmon (Moore, 2006; Moore et al., 2013; Parkinson et al., 2016).
Regression analysis was used to understand the drivers of interannual variability in August runoff (QAug) (mm) by relating it to the following predictor variables: runoff in the preceding month (QJul) (mm), mean August air temperature (TAug) (°C), and total August precipitation (PAug) (mm). The underlying logic is that the inclusion of July runoff helps to account for effects of carry-over storage, air temperature is an index of the magnitude of snow and ice melt as well as evapotranspiration from non-glacierized surfaces, and August precipitation represents the streamflow contribution from rainfall.
The regression model is:
where ai are the estimated coefficients, t indicates year, and e(t) is the residual from the regression.
Drawing on the degree-day melt model concept as an analogy, the sensitivity of glacier melt runoff to air temperature can be expressed as follows:
where MAug is the glacier meltwater contribution to streamflow in August (mm), km is an apparent degree-day factor (mm · d−1 °C-1), and nd is the number of days in August (31), and T0 is a base temperature, below which there is no glacier melt (oC). Based on the assumption that the air temperature term in Equation (2) represents the contribution of glacier melt, and if the value of km is assumed to be approximately constant across glaciers, we can equate the coefficient a2 with km·nd·fg to compute an apparent degree-day factor by combining Equations (2) and (3) and differentiating with respect to fg:
where da2/dfg is the slope of a linear relation between a2 and fg. We acknowledge that the analogy is not perfect when using monthly mean temperatures because the effect of daily temperatures lower than T0 is not explicitly accounted for. In addition, the value of km will reflect the combination of both snow and ice melt in proportions that vary from year to year.
2.8. Trend Analyses
Trend analyses for the August runoff time series were conducted by computing the Spearman correlation coefficient between August runoff and year, which requires no assumptions about data distributions or linearity of trends. The test has similar power to the Mann–Kendall test (Yue et al., 2002). Trend magnitudes were estimated using the Theil–Sen slope estimator, which is robust to outliers and lack of normality of the residuals (Helsel and Hirsch, 2002).
A trend analysis was also performed for the residuals from the regression model. The logic underlying this analysis is that the three predictors account for external hydroclimatic influences and non-glacial storage influences, and that the residuals should contain information about any effects caused by internal changes in the catchment, particularly glacier retreat.
3. Results
3.1. Hydroclimatic Variability Over the Study Period
Variations in August air temperature and precipitation display a high degree of regional coherence, especially for air temperature, while July and August runoff are somewhat less consistent among stations (Figure 3). August air temperature exhibited positive trends ranging from 0.022 to 0.032oC · yr−1, with a median value of 0.025oC · yr−1. These trends represent an increase of about 1oC over the 41-year study period. However, none of the trends is significant at p < 0.05.
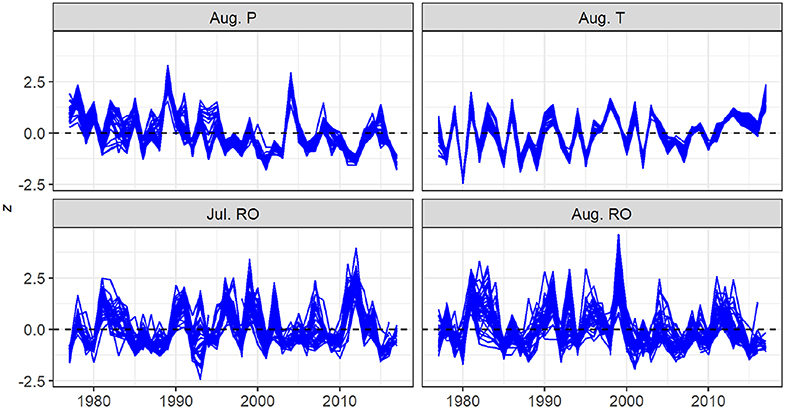
Figure 3. Time series of August precipitation, August air temperature, and July and August runoff from 1977 to 2017. Each trace represents a station. Time series for each station were standardized prior to plotting by subtracting the mean and dividing by the standard deviation.
Trends for August precipitation ranged from −1.09 mm · yr−1 to −0.43 mm · yr−1 with a median value of −0.78 mm · yr−1, equivalent to a decrease of about 30 mm over the study period. Of these trends, 31 of 35 were significant at p < 0.05.
3.2. Changes in Glacier Extent and Volume
In 1985, fractional glacier cover ranged among catchments from 0 to 0.19. Figure 4 presents the magnitude of the change in glacier cover in 2005 and 2013, relative to 1985. Although glaciers in one catchment appeared to advance slightly from 1985 to 2005 (Δfg > 0), the rest exhibited retreat of up to about 0.02. However, the apparent increase in glacier cover is probably a reflection of measurement uncertainty, given that there is no evidence that any glaciers advanced during the study period. By 2013, all glaciers retreated, with all showing a net negative change relative to 1985. With the exception of the heavily glacierized Canoe River catchment, the amount of change in glacier cover generally varied linearly with the glacier cover in 1985, representing about a 20% decrease in glacier coverage between 1985 and 2013. Between 1985 and 1999, mass changes derived from the digital elevation models indicate a mean rate of glacier storage loss that varied among catchments from about 0.1–0.9 m w.e. a−1, with a mean of 0.55 ± 0.13 m w.e. a−1.
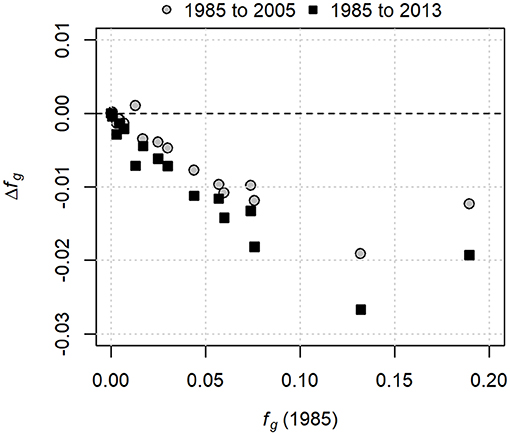
Figure 4. Changes in glacier cover between 1985 and 2005, and 1985 and 2013, plotted against glacier cover in 1985.
3.3. Glacier Contributions to Streamflow
Figure 5 illustrates daily streamflow responses for 2 years with contrasting climatic conditions. For both years, catchments with and without glacier cover track reasonable well during the snowmelt freshet up to about the time of the freshet peak flow. Following the peak, streamflow for the glacier-fed catchments diverges from that for the unglacierized catchments and eventually converges in October. These composite hydrographs suggest that glaciers make substantial contributions to streamflow beginning some time in June and extending through September. However, some of the apparent contribution represents the extended snowmelt from the high-elevation portions of the glacier-fed catchments, as well as orographically enhanced rainfall. The contribution from glaciers is least complicated by rainfall and carry-over storage from the preceding month in August. Only a portion of the apparent contributions from glaciers constitutes a non-sustainable wastage flux; the remainder represents a lag in response to precipitation associated with transient glacier storage on seasonal to interannual scales.
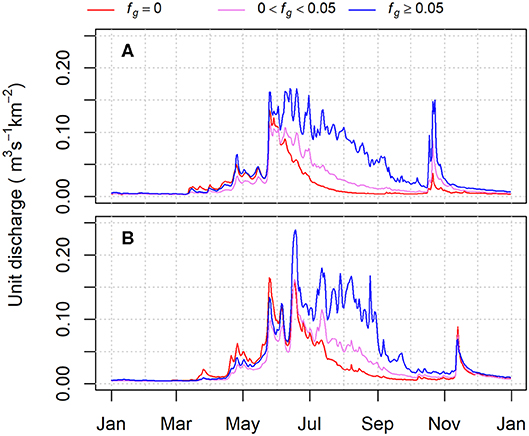
Figure 5. Composite daily hydrographs of unit discharge for catchments with and without glacier cover. (A) is for 2003, a year dominated by summer drought conditions; (B) is for 1999, a year with heavy winter snow accumulation and more frequent summer rainfall.
Glacier mass loss between the mid-1980s and 1999 translates into wastage flux contributions that range up to just over 0.06 as a fraction of annual water yield (Figure 6). The distribution of points above and below the best-fit relation indicates that the fractional contribution to streamflow by glacier wastage is inversely related to annual water yield.
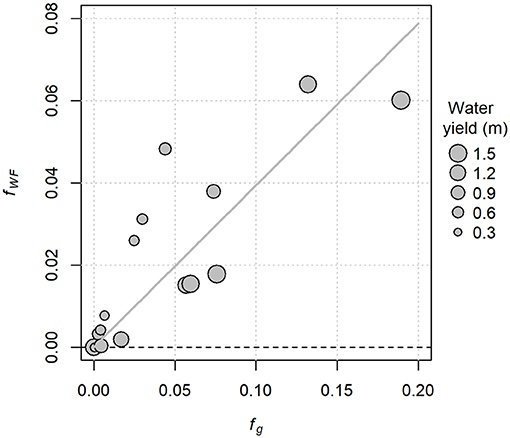
Figure 6. Computed contributions of glacier wastage to streamflow as a fraction of annual water yield (fWF), plotted against the glacier coverage in 1985. The trend line is a linear fit through the origin.
The relative wastage flux contributions to streamflow among catchments were consistent between 1985–1999 and 2000–2018 (Figure 7). It appears that the contributions were lower during the second period, which would be consistent with a post-peak-water scenario. However, we acknowledge that there is substantial uncertainty in geodetic estimates of mass loss. In particular, the effect of radar penetration on the SRTM DEM could cause an overestimate of mass loss for the early period, potentially accounting for the apparent discrepancy in wastage flux between the two periods. Therefore, it is not appropriate to draw a firm conclusion from this analysis.
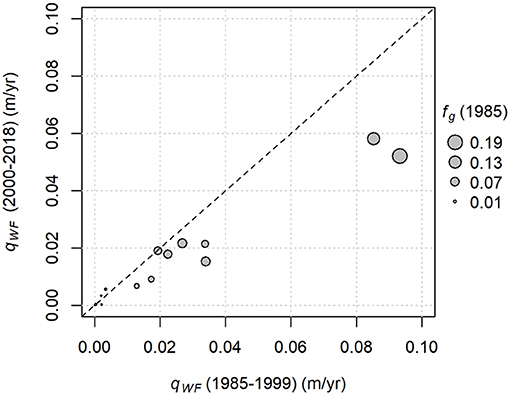
Figure 7. Comparison of wastage flux contributions to streamflow (qWF) on a mean annual basis for two periods. Wastage is expressed as an average depth of water over the catchment area. Symbol sizes are scaled to fractional glacier coverage in 1985. The dashed line indicates perfect agreement.
Wastage flux contributions to Canoe River streamflow ranged from 8 to 13% of annual water yield (Table 2), higher than the long-term estimate for the mid-1980s to 1999 period (Figure 6), in which Canoe River corresponds to the point with fg = 0.19. Wastage flux contributions in the more heavily glacierized, higher-elevation Nordic Creek catchment ranged from 9 to 19% of annual water yield. The coefficient of variation for annual flow for the 4 years was 0.09 for Canoe River and 0.18 for Nordic Creek. Although the coefficient of variation based on only 4 years of data will be subject to substantial sampling variability, the relative difference between the two catchments should be reasonable considering the use of a common period of record.
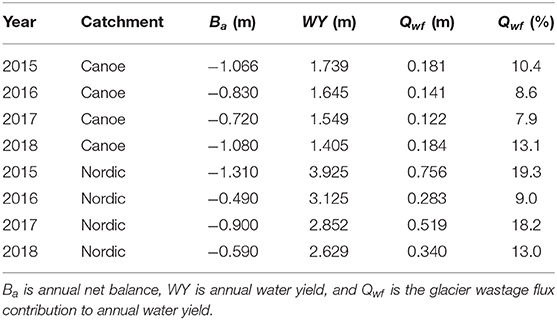
Table 2. Glacier contributions to streamflow for Nordic Creek and Canoe River.
3.4. Multiple Regression Analysis of August Streamflow
The regression model provided reasonable fits for the catchments with no or minimal (fg < 0.01) glacier cover; adjusted R2 ranges from 0.50 to 0.86, with a median of 0.70. The regression fits are less strong for the catchments with fg ≥ 0.01, with a range from 0.37 to 0.56 and a median of 0.49. It appears that a model including measures of climatic forcing and non-glacial storage explains more variability for the catchments with minimal glacier cover.
The fitted regression coefficients exhibit varying relations with fractional glacier cover (Figure 8). Coefficient a1, which represents the effect of carry-over storage and is analogous to a recession constant, averages roughly 0.3 for most catchments, but appears to decline for catchments with greater glacier coverage. This result is consistent with our process understanding, in that high flows in July would be associated, in many years, with heavy snow accumulation and a late disappearance of snow. In unglacierized catchments, late disappearance of snow would be associated with enhanced streamflow in July and August. On the other hand, persistence of snow on glaciers would reduce glacier melt runoff in August due to the higher albedo of snow relative to exposed glacier ice. Another possible cause of the nonlinear relation is that higher-elevation, more heavily glacierized catchments may have less storage potential due to shallower soils and lack of extensive aquifers.
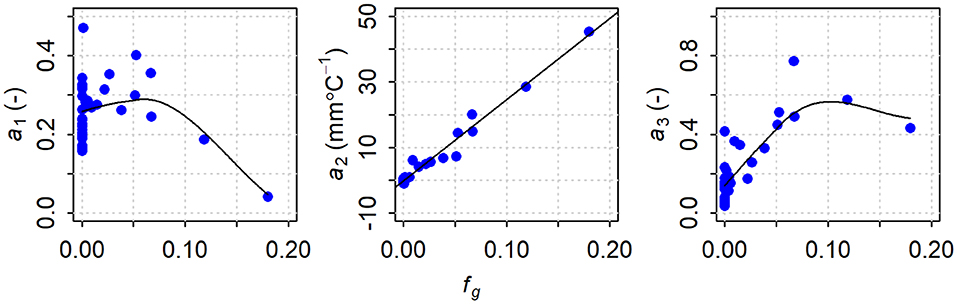
Figure 8. Plot of fitted regression coefficients (ai) against fractional glacier cover (fg), computed as the average of the values for 1985 and 2013. The coefficients a1 to a3 correspond to July runoff, August air temperature and August precipitation, respectively. The trend lines for a1 and a3 were generated using the loess algorithm (span = 1, degree = 1); the trend line for a2 is a linear regression fit.
Coefficient a3, which reflects the effects of rainfall-runoff in August, tends to increase with glacier cover. This relation is consistent with the tendency for more heavily glacierized catchments to have higher elevations, and thus a greater orographic enhancement of precipitation. Note that the relation appears to flatten out for higher fractional glacier coverages. This pattern might reflect a nonlinear relation between precipitation and elevation or the tendency for higher-elevation areas to receive precipitation as snow, which would suppress glacier melt.
Coefficient a2 displays a linear relation with fractional glacier coverage with a slope of 247 mm ·oC−1. That is, the sensitivity of August water yield to August air temperature increases linearly with fractional glacier coverage, consistent with the conceptual model based on a degree-day melt model (Equation 3).
3.5. Trend Analyses
Most stations exhibited negative trends for August streamflow, although only five are significant at p < 0.05 (Figure 9). There is a general tendency to increasingly negative trend with increasing glacier cover, except for the most heavily glacierized catchment (Canoe River).
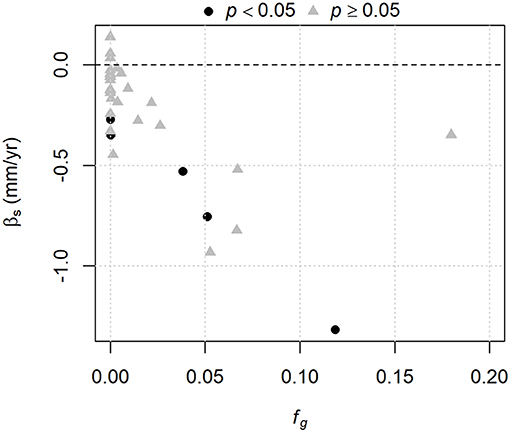
Figure 9. Relation between the Sen slope estimator for August streamflow (βs) and the mean fractional glacier cover from 1985 to 2013. Significance is based on the Spearman correlation test for each series.
When the August runoff trends are plotted against the change in glacier cover (Figure 10, left panel), there is a more consistent relation than shown in Figure 9. The model has adjusted R2 = 0.69, and the intercept and slope are −0.093 and 38.2 mm · yr−1, respectively, both significant at p < 0.05. When considering trends for the residuals from the regression model (Equation 2), there is less scatter about the regression line (adjusted R2 = 0.93), and the trends are significant for 11 of the 35 catchments (Figure 10, right panel). The intercept, −0.031 mm·yr-1, is not significantly different from 0 (p = 0.12), while the slope, 51.8 mm·yr−1, is significant at well less than p < 0.001.
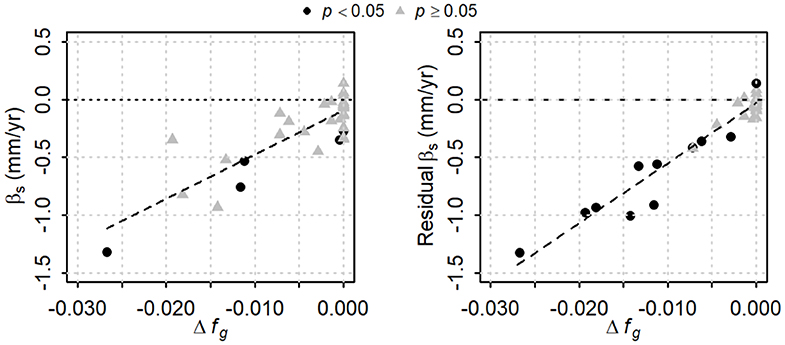
Figure 10. Trend magnitudes as a function of the change in fractional glacier cover from 1985 to 2013. The Sen slope estimator (βs) is shown for August streamflow in the left panel, and for the residuals from the multiple regression model in the right panel. Significance is based on the Spearman correlation test for each series. Dashed lines are fitted regressions.
4. Discussion
On a decadal time scale, the fractional contribution of glacier wastage had a positive relation with fractional glacier coverage and an inverse relation with annual water yield. The maximum contributions were about 6 % of annual water yield for the mid-1980s to 1999 period (Figure 6), and were somewhat lower for the 2000–2018 period (Figure 7). While the fractional contribution may seem minor on an annual time scale, the contributions during August would be higher. Based on simulations with and without glacier cover, Jost et al. (2012) concluded that ice melt contributed up to 6% of annual streamflow and up to 25% of August streamflow in the Mica Basin of the Columbia River headwaters, which has about 5% glacier cover.
The annual mass balances for 2015–2018 for the Nordic Creek and Canoe River catchments indicate higher losses than for the two longer-term periods, but this difference likely relates to the fact that August tended to be warmer and drier in recent years compared to longer term conditions (Figure 3). Indeed, results presented by Menounos et al. (2019) suggested that mass loss on a per-unit-area basis in the Columbia headwaters (Region 5 in their Figure 4) was higher in 2009–2018 than in either 1985–1999 or 2000–2009, consistent with the climatic trends shown in Figure 3.
Wastage flux contributions on an annual scale were less variable for Canoe River than for Nordic Creek. This difference likely reflects the fact that glaciers in the Canoe River catchment extend below treeline, such that a substantial portion of bare ice is exposed each summer regardless of the final snowline elevation. At Nordic Creek, on the other hand, where the glacier is entirely above treeline, there is likely to be greater relative interannual variation in the amount of bare ice exposed during the ablation season. This contrasting behavior between alpine glaciers and those extending to lower elevations contributes to inter-catchment variation in the glacier compensation effect, over and above the effect of fractional glacier coverage. The coefficient of variation for Nordic Creek was double that for Canoe River. This contrast is consistent with the high coefficient of variation of annual streamflow for the alpine-glacier-fed Vernagtbach catchment as compared to other catchments in the European Alps, which have glaciers extending to lower elevations (Tiel et al., 2020).
Based on the relation between the a2 coefficient and fractional glacier cover, it appears that fractional glacier coverage of only about 0.01 is required to shift a catchment in this region from being relatively insensitive to August air temperature to having a positive response. This temperature-sensitivity for catchments with low glacier coverage could be partially due to melting of late-lying snow at high elevations, given that catchments with even low levels of glacier coverage tend to be at higher elevations than unglacierized catchments. However, late-lying snow would also reduce melt from the glaciers, so it is difficult to make a definitive statement about its role in the temperature sensitivity of streamflow.
The slope of the relation between a2 and fractional glacier coverage corresponds to an apparent melt factor of km = 7.97 mm · day−1·°C−1. This value is higher than melt factors for ice derived for glaciers in western Canada by Shea et al. (2009), which averaged 4.6 mm · day−1·°C−1. However, the values derived by Shea et al. (2009) were for the entire ablation season, whereas the value of km derived here is based only on August. Also, the temperature-dependence could be higher because, in terms of streamflow production, glacier cover not only provides an ice surface available for melt, but also reduces losses by evapotranspiration that would occur from unglacierized areas (Carnahan et al., 2019).
All but three of the 35 catchments exhibited negative trends in August streamflow (although only five were significant), and the trend magnitudes have a significant linear relation with the change in glacier cover from 1985 to 2013. The intercept of the relation is negative and significantly different from 0, suggesting that there was a climate-driven negative trend in August streamflow for the unglacierized catchments, consistent with the dominance of significant negative trends in precipitation and widespread but not significant positive trends in air temperature. The relation between trend magnitude and Δfg indicates stronger trends for catchments with greater loss of glacier cover, suggesting that decreases in glacier-melt contributions to streamflow augmented the climate-driven decreases from unglacierized portions of the catchments.
After accounting for the effects of external hydroclimatic forcing and non-glacial storage change through the regression model, the residuals had significant trends for 11 of the 35 stations, including most of the catchments that experienced a decrease in fractional glacier coverage of 0.002 or more. The intercept of the relation is not significantly different from zero, suggesting that the regression model has effectively accounted for climate-driven trends for unglacierized catchments.
Projections by Clarke et al. (2015) indicated that peak water in the Columbia River headwaters may occur around 2020 or later, depending on the climate scenario. The pattern of points in Figure 9 suggests that, for all but the most heavily glacierized catchment, declining trends in glacier-melt contributions to streamflow added to the climate-driven negative trend in August runoff for unglacierized portions of the catchments. The most heavily glacierized catchment appears to have experienced a weaker negative trend than the lesser-glacierized catchments. This pattern is broadly consistent with the observations by Casassa et al. (2009) and Huss and Hock (2018) that more heavily glacierized catchments should have a longer rising phase. Overall, it appears that the Columbia River headwaters region is already in the process of beginning a post-peak-water decline, and the magnitude and significance of the declines may get stronger over the coming decades, unless there is an increase in summer rainfall to compensate for reduced glacier melt.
The residual trends indicate that there has been a decrease in what Moyer et al. (2016) called “realized streamflow”; that is, observed streamflow has been declining relative to the streamflow that would have been recorded if glaciers had not been retreating. There are two important implications in relation to a decrease in realized streamflow caused by glacier retreat. The first is that hydrological models based on out-of-date glacier information would tend to over-predict summer streamflow. Therefore, agencies tasked with making streamflow forecasts for glacier-fed catchments should ensure that they use up-to-date glacier cover information when setting up their models, which should be updated on a regular basis. The second is that periods with high air temperature would be accompanied by reduced streamflow, which would likely lead to higher stream temperatures considering that stream temperature response to surface energy exchange is inversely related to discharge (Gu et al., 1998; Webb et al., 2003).
5. Conclusions
The glacier wastage flux contribution to annual water yield had a positive relation with fractional glacier coverage and an inverse relation with catchment water yield. For catchments with over 10% glacier cover, glacier wastage contributed about 6% of the annual water yield over the period from the mid-1980s to 1999. For the heavily glacierized Nordic Creek and Canoe River catchments, the glacier wastage flux contributed on the order of 10 and 15% of annual water yield, on average, for the period 2015–2019. The fractional contribution varied from year to year, particularly for the high-elevation, highly glacierized Nordic Creek catchment.
Trend analyses suggest that glacier-melt contributions to streamflow have already passed peak water in the Columbia River headwaters. The trend analysis of the residuals from the regression with climate-related variables indicates that there is a clear declining trend in realized streamflow—that is, the streamflow that would have been observed if glaciers had not retreated—which can have implications for streamflow forecasting and summer water temperature response during hot, dry weather.
The study design employed here focused on a set of stations with a range of glacier cover, but with all catchments experiencing similar patterns of climatic variability over a common period of record. This design, along with consideration of climatic variability and changes in glacier cover, facilitated the partitioning of observed streamflow trends into components associated with climate-driven trends from unglacierized areas and those associated with glacier changes. This approach should be useful for application to other regions.
It would be valuable to complement this empirical study with the application of a process-based model, similar to the approach taken by Frans et al. (2018). While the empirical analysis provides robust information about the spatio-temporal patterns of response and permits inferences regarding the roles of glaciers and glacier retreat in those patterns, interrogation of model output and sensitivity analyses could generate more detailed understanding of the hydrological interactions underlying the response and provide a basis for making projections under varying climatic scenarios.
Data Availability Statement
Data and code used in the execution of this study are publicly available via http://doi.org/10.5281/zenodo.3779279.
Author Contributions
All authors contributed to the development of the research question and general conceptual approach. RM developed and applied the statistical analysis and led the writing and production of the manuscript. DH assisted with access to hydrological data and generated summaries of catchment characteristics. BM developed the glacier-cover outlines and mass change calculations. BP provided annual mass-balance data for Nordic Creek and Canoe River catchments. All authors reviewed and edited the manuscript.
Conflict of Interest
The authors declare that the research was conducted in the absence of any commercial or financial relationships that could be construed as a potential conflict of interest.
Acknowledgments
This research was supported by the Natural Sciences and Engineering Research Council of Canada, the Canada Research Chair Program, the Columbia Basin Trust, and the Tula Foundation. We acknowledge the developers of open source software tools used for data wrangling and analysis, including the R programming language (R Core Team, 2019) and the following packages: tidyverse (Wickham, 2017), sf (Pebesma, 2018), raster (Hijmans, 2019), bcmaps (Teucher et al., 2019) and tidyhydat (Albers, 2017).
References
Albers, S. (2017). tidyhydat: Extract and tidy Canadian hydrometric data. J. Open Source Softw. 2:511. doi: 10.21105/joss.00511
Baraer, M., Mark, B. G., McKenzie, J. M., Condom, T., Bury, J., Huh, K.-I., et al. (2012). Glacier recession and water resources in Peru's Cordillera Blanca. J. Glaciol. 58, 134–150. doi: 10.3189/2012JoG11J186
Barnett, T. P., Adam, J. C., and Lettenmaier, D. P. (2005). Potential impacts of a warming climate on water availability in snow-dominated regions. Nature 438, 303–309. doi: 10.1038/nature04141
Bolch, T., Menounos, B., and Wheate, R. (2010). Landsat-based inventory of glaciers in western Canada, 1985–2005. Remote Sens. Environ. 114, 127–137. doi: 10.1016/j.rse.2009.08.015
British Columbia Ministry of Environment Land and Parks. (1992). British Columbia Specifications and Guidelines for Geomatics, Release 2.0 Victoria, BC: British Columbia Ministry of Environment, Land and Parks.
Carnahan, E., Amundson, J. M., and Hood, E. (2019). Impact of glacier loss and vegetation succession on annual basin runoff. Hydrol. Earth Syst. Sci. 23, 1667–1681. doi: 10.5194/hess-23-1667-2019
Casassa, G., Löpez, P., Pouyaud, B., and Escobar, F. (2009). Detection of changes in glacial run-off in alpine basins: examples from North America, the Alps, central Asia and the Andes. Hydrol. Process. 23, 31–41. doi: 10.1002/hyp.7194
Chilton, R. H. (1981). A Summary of Climate Regimes of British Columbia. Victoria, BC: B.C. Ministry of Environment.
Clarke, G. K. C., Jarosch, A. H., Anslow, F. S., Radić, V., and Menounos, B. (2015). Projected deglaciation of western Canada in the twenty-first century. Nat. Geosci. 8, 372–377. doi: 10.1038/ngeo2407
Daley, C., Halbleib, M., Smith, J. I., Gibson, D. W. P, and Curtis, J. (2008). Physiographically sensitive mapping of temperature and precipitation across the conterminous United States. Int. J. Climatol. 28, 2031–2064. doi: 10.1002/joc.1688
Environment Climate Change Canada (2018). National Water Data Archive: HYDAT. Available online at: https://www.canada.ca/en/environment-climate-change/services/water-overview/quantity/monitoring/survey/data-products-services/national-archive-hydat.html.
Farinotti, D., Huss, M., Fürst, J. J., Landmann, J., Machguth, H., Maussion, F., et al. (2019). A consensus estimate for the ice thickness distribution of all glaciers on Earth. Nat. Geosci. 12, 168–173. doi: 10.1038/s41561-019-0300-3
Finger, D., Vis, M., Huss, M., and Seibert, J. (2015). The value of multiple data set calibration versus model complexity for improving the performance of hydrological models in mountain catchments. Water Resour. Res. 51, 1939–1958. doi: 10.1002/2014WR015712
Fleming, S. W., Moore, R. D., and Clarke, G. K. C. (2006). Glacier-mediated streamflow teleconnections to the Arctic Oscillation. Int. J. Climatol. 26, 619–636. doi: 10.1002/joc.1273
Frans, C., Istanbulluoglu, E., Lettenmaier, D. P., Clarke, G., Bohn, T. J., and Stumbaugh, M. (2016). Implications of decadal to century scale glacio-hydrological change for water resources of the Hood River basin, OR, USA. Hydrol. Process. 30, 4314–4329. doi: 10.1002/hyp.10872
Frans, C., Istanbulluoglu, E., Lettenmaier, D. P., Fountain, A. G., and Riedel, J. (2018). Glacier recession and the response of summer streamflow in the Pacific Northwest United States, 1960–2099. Water Resour. Res. 54, 6202–6225. doi: 10.1029/2017WR021764
Government of Canada (2019). National Hydrometric Network Basin Polygons. Available online at: https://open.canada.ca/data/en/dataset/0c121878-ac23-46f5-95df-eb9960753375 (accessed January 14, 2019).
Gu, R., Montgomery, S., and Austin, T. A. (1998). Quantifying the effects of stream discharge on summer river temperature. Hydrol. Sci. J. 43, 885–904.
Hamann, A., Wang, T., Spittlehouse, D. L., and Murdock, T. Q. (2013). A comprehensive, high-resolution database of historical and projected climate surfaces for western North America. Bull. Am. Meteorol. Soc. 94, 1307–1309. doi: 10.1175/BAMS-D-12-00145.1
Helsel, D. R., and Hirsch, R. M. (2002). Statistical Methods in Water Resources, Techniques of Water Resources Investigations, Book 4, Chapter A3. U.S. Geological Survey. doi: 10.13140/RG.2.2.36048.10248
Hijmans, R. J. (2019). raster: Geographic Data Analysis and Modeling. Available online at: https://CRAN.R-project.org/package=raster.
Huss, M. (2011). Present and future contribution of glacier storage change to runoff from macroscale drainage basins in Europe. Water Resour. Res. 47:W07511. doi: 10.1029/2010WR010299
Huss, M. (2013). Density assumptions for converting geodetic glacier volume change to mass change. Cryosphere 7, 877–887. doi: 10.5194/tc-7-877-2013
Huss, M., and Hock, R. (2018). Global-scale hydrological response to future glacier mass loss. Nat. Clim. Change 8, 135–140. doi: 10.1038/s41558-017-0049-x
IPCC (2019). “Summary for policymakers,” in International Governmental Panel on Climate Change Special Report on the Ocean and Cryosphere in a Changing Climate, eds H. O. Pörtner, D. C. Roberts, V. Masson-Delmotte, P. Zhai, M. Tignor, E. Poloczanska, et al. (IPCC).
Jansson, P., Hock, R., and Schneider, T. (2003). The concept of glacier storage: a review. J. Hydrol. 282, 116–129. doi: 10.1016/S0022-1694(03)00258-0
Jost, G., Moore, R. D., Menounos, B., and Wheate, R. (2012). Quantifying the contribution of glacier runoff to streamflow in the upper Columbia River Basin, Canada. Hydrol. Earth Syst. Sci. 16, 849–860. doi: 10.5194/hess-16-849-2012
Kaser, G., Großhauser, M., and Marzeion, B. (2010). Contribution potential of glaciers to water availability in different climate regimes. Proc. Natl. Acad. Sci. U.S.A. 107, 20223–20227. doi: 10.1073/pnas.1008162107
Menounos, B., Hugonnet, R., Shean, D., Gardner, A., Howat, I., Berthier, E., et al. (2019). Heterogeneous changes in western North American glaciers linked to decadal variability in zonal wind strength. Geophys. Res. Lett. 46, 200–209. doi: 10.1029/2018GL080942
Moore, R. D. (2006). Stream temperature patterns in British Columbia, Canada, based on routine spot measurements. Can. Water Resour. J. 31, 41–56. doi: 10.4296/cwrj3101041
Moore, R. D., Fleming, S. W., Menounos, B., Wheate, R., Fountain, A., Stahl, K., et al. (2009). Glacier change in western North America: implications for hydrology, geomorphic hazards and water quality. Hydrol. Process. 23, 42–61. doi: 10.1002/hyp.7162
Moore, R. D., Nelitz, M., and Parkinson, E. (2013). Empirical modelling of maximum weekly average stream temperature in British Columbia, Canada, to support assessment of fish habitat suitability. Can. Water Resour. J. 38, 135–147. doi: 10.1080/07011784.2013.794992
Moore, R. D., Spittlehouse, D. L., Whitfield, P. H., and Stahl, K. (2010). “Weather and climate,” in Land Management Handbook 66, eds R. Pike, T. E. Redding, R. D. Moore, R. D. Winkler, and K. D. Bladon (Kamloops, BC; Victoria, BC: B.C. Ministry of Forest; Range, Forest Science Program; FORREX Forum for Research; Extension in Natural Resources), 47–84.
Moyer, A. N., Moore, R. D., and Koppes, M. N. (2016). Streamflow response to the rapid retreat of a lake-calving glacier. Hydrol. Process. 30, 3650–3665. doi: 10.1002/hyp.10890
Naz, B. S., Frans, C. D., Clarke, G. K. C., Burns, P., and Lettenmaier, D. P. (2014). Modeling the effect of glacier recession on streamflow response using a coupled glacio-hydrological model. Hydrol. Earth Syst. Sci. 18, 787–802. doi: 10.5194/hess-18-787-2014
Nolin, A. W., Phillippe, J., Jefferson, A., and Lewis, S. L. (2010). Present-day and future contributions of glacier runoff to summertime flows in a Pacific Northwest watershed: implications for water resources. Water Resour. Res. 46:W12509. doi: 10.1029/2009WR008968
O'Neel, S., McNeil, C., Sass, L. C., Florentine, C., Baker, E. H., Peitzsch, E., et al. (2019). Reanalysis of the US Geological Survey Benchmark Glaciers: long-term insight into climate forcing of glacier mass balance. J. Glaciol. 65, 850–866. doi: 10.1017/jog.2019.66
Parkinson, E., Lea, E. V., Nelitz, M., Knudson, J. M., and Moore, R. D. (2016). Identifying temperature thresholds associated with fish community changes in British Columbia, Canada, to support identification of temperature sensitive streams. River Res. Appl. 32, 330–347. doi: 10.1002/rra.2867
Pebesma, E. (2018). Simple Features for R: standardized support for spatial vector data. R J. 10, 439–446. doi: 10.32614/RJ-2018-009
Pelto, B. M., Menounos, B., and Marshall, S. J. (2019). Multi-year evaluation of airborne geodetic surveys to estimate seasonal mass balance, Columbia and Rocky Mountains, Canada. Cryosphere 13, 1709–1727. doi: 10.5194/tc-13-1709-2019
Pelto, M. S. (2018). How unusual was 2015 in the 1984-2015 period of the North Cascade Glacier annual mass balance? Water 10:543. doi: 10.5194/tc-2017-62
R Core Team (2019). R: A Language and Environment for Statistical Computing. Vienna: R Foundation for Statistical Computing Available online at: https://www.R-project.org/.
Rignot, E., Echelmeyer, K., and Krabill, W. (2001). Penetration depth of interferometric synthetic-aperture radar signals in snow and ice. Geophys. Res. Lett. 28, 3501–3504. doi: 10.1029/2000GL012484
Schaefli, B., and Huss, M. (2011). Integrating point glacier mass balance observations into hydrologic model identification. Hydrol. Earth Syst. Sci. 15, 1227–1241. doi: 10.5194/hess-15-1227-2011
Schiefer, E., Menounos, B., and Wheate, R. (2007). Recent volume loss of British Columbian glaciers, Canada. Geophys. Res. Lett. 34, 1–6. doi: 10.1029/2007GL030780
Shea, J. M., Stahl, K., and Moore, R. D. (2009). Derivation of melt factors from glacier mass-balance records in western Canada. J. Glaciol. 55, 123–130. doi: 10.3189/002214309788608886
Stahl, K., and Moore, R. D. (2006). Influence of watershed glacier coverage on summer streamflow in British Columbia, Canada. Water Resour. Res. 42:W06201. doi: 10.1029/2006WR005022
Teucher, A., Hazlitt, S., and Albers, S. (2019). Bcmaps: Map Layers and Spatial Utilities for British Columbia. Available online at: https://CRAN.R-project.org/package=bcmaps
Tiel, M. van, Kohn, I., Van Loon, A. F., and Stahl, K. (2020). The compensating effect of glaciers: Characterizing the relation between interannual streamflow variability and glacier cover. Hydrol. Process. 34, 553–568. doi: 10.1002/hyp.13603
Webb, B. W., Clack, P. D., and Walling, D. E. (2003). Water–air temperature relationships in a Devon river system and the role of flow. Hydrol. Process. 17, 3069–3084. doi: 10.1002/hyp.1280
Whitfield, P. H., Moore, R., Fleming, S. W., and Zawadski, A. (2010). Pacific Decadal Oscillation and the hydroclimatology of Western Canada - review and prospects. Can. Water Resour. J. 35, 1–28. doi: 10.4296/cwrj3501001
Wickham, H. (2017). Tidyverse: Easily Install and Load the 'Tidyverse'. Available online at: https://CRAN.R-project.org/package=tidyverse
Yue, S., Pilon, P., and Cavadias, G. (2002). Power of the Mann-Kendall and Spearman's rho test for detecting monotonic trends in hydrological series. J. Hydrol. 259, 254–271. doi: 10.1016/S0022-1694(01)00594-7
Keywords: glacier retreat, glacier cover, streamflow, peak water, trend analysis, Columbia River
Citation: Moore RD, Pelto B, Menounos B and Hutchinson D (2020) Detecting the Effects of Sustained Glacier Wastage on Streamflow in Variably Glacierized Catchments. Front. Earth Sci. 8:136. doi: 10.3389/feart.2020.00136
Received: 24 October 2019; Accepted: 14 April 2020;
Published: 12 May 2020.
Edited by:
Bryan G. Mark, The Ohio State University, United StatesReviewed by:
Matthias Huss, ETH Zürich, SwitzerlandFeiteng Wang, Chinese Academy of Sciences, China
Copyright © 2020 Moore, Pelto, Menounos and Hutchinson. This is an open-access article distributed under the terms of the Creative Commons Attribution License (CC BY). The use, distribution or reproduction in other forums is permitted, provided the original author(s) and the copyright owner(s) are credited and that the original publication in this journal is cited, in accordance with accepted academic practice. No use, distribution or reproduction is permitted which does not comply with these terms.
*Correspondence: R. D. Moore, ZGFuLm1vb3JlQHViYy5jYQ==