 Nellore Manoj Kumar
 Kannan Venkatramanan
- Department of Physics, Sri Chandrasekharendra Saraswathi Viswa Mahavidyalaya (SCSVMV Deemed University), Kanchipuram, India
The presence of cirrus cloud has its impact on the earth’s radiation budget. In order to study the effect of cirrus clouds in the tropical regions, it is essential to understand, and characterize their optical properties. The optical properties of high altitude cirrus clouds are obtained using the polarization diversity ground based Mie lidar instrument at a tropical latitude station in the Indian subcontinent. Lidar measurements are taken for one year (2013) at National Atmospheric Research Laboratory (NARL), located at Gadanki (13.5°North, 79.2°East; 375 m AMSL), India and are used for the present investigation. Altitude variations of optical depth and depolarization ratio are discussed. In the altitude range of 10–17 km, the range of the optical depth and depolarization ratio of cirrus cloud was found to be 0.01–0.4 and 0.1–0.4, respectively. The interdependence of optical depth as a function of depolarization ratio is analyzed and a positive correlation is observed (0.3950). From the measured optical depth values, it is categorized that 8, 77, and 14% of the cirrus clouds are sub-visual, thin, and thick clouds. The monthly and seasonal variations of optical properties of cirrus clouds were analyzed. Summary of cirrus cloud layer statistics and the statistical variation (seasonal) of the optical properties of cirrus clouds is presented for the period of study.
Introduction
High altitude cirrus clouds (cold clouds) are thin and wispy, mainly composed of ice crystals (Lynch et al., 2002) of dissimilar shape and size. Cirrus clouds cover 16.7% of the earth’s surface with the highest fraction of occurrence in the tropics (Sassen et al., 2008, 2009). Studies of these clouds are important to understand the climatic nature and to predict the future (Nazaryan et al., 2008). It plays a crucial role in earth’s radiation budget (Liou, 1986; Mc Farquhar et al., 2000; Campbell et al., 2016; Lolli et al., 2017) as well as in the climate and weather studies. The impact of cirrus clouds (ice phase clouds) on the earth’s climate system based on two radiative effects are explained by Stephens et al. (2004). A positive radiative effect known as green house effect (traps the outgoing long-wave radiation emitted by the earth and the atmosphere) and a negative radiative effect also known as albedo effect (reflects the incoming solar radiation). Both lead to warming and cooling of the earth’s atmospheric system (Lolli et al., 2017), whose significance depends on the thickness of the cloud. At the Top Of the Atmosphere (TOA) if the cirrus cloud is optically thin (0.03> cloud optical depth <0.3), then its albedo is low which causes positive radiative forcing and the greenhouse effect warms the atmosphere. If the cirrus cloud is optically thick (cloud optical depth >0.3), then its albedo is high which produces negative radiative forcing, and the albedo effect cools the atmosphere (Fu and Liou, 1993; Fahey and Schumann, 1999). The significant roles of these two competitive effects typically depend on the optical properties of cirrus clouds (Zerefos et al., 2003). Hence the radiative balance strongly depends on optical properties of cirrus clouds. Their optical properties control the radiative forcing of the earth’s atmospheric system and hence the detailed measurements of cirrus clouds are important at different geographical locations. Optical properties of cirrus clouds vary during different seasons causing cooling or warming of the earth’s atmospheric climate system (Ramanathan and Collins, 1991). In order to estimate the role of optical properties of cirrus clouds at the TOA, it is required to study their optical properties in terms of optical depth, depolarization ratio, and their seasonal variations.
Light Detection And Ranging (Lidar), a remote sensing tool that provides information on vertical distribution of various types of cirrus clouds like sub visual, thin and thick (or dense or opaque), and multi-layered clouds, rain and evaporation (Lolli et al., 2020), aerosols (Lolli et al., 2019), gas concentration (Foth et al., 2015), and wind speed (Lolli et al., 2013), etc. It also provides region wise information on geometrical and optical properties with high spatial and temporal resolutions. Generally, Lidar detects clouds with their back scattering signal, and provides an excellent way to obtain the optical properties of cirrus clouds. Both of these are derived by inverting lidar backscattering signals from cirrus clouds. Over tropics (Sassen and Cho, 1992; Heymsfield and McFarquehar, 1996). it is reported that the distribution of optical properties of cirrus clouds play a key role in radiative effects. Various studies are done at different seasons to analyze the variations of geometrical and optical properties of cirrus clouds using ground-based lidar over Gadanki region (Krishnakumar et al., 2014; Pandit et al., 2015; Manoj Kumar et al., 2019). Ground based lidar observations for the climatology of cirrus clouds over a fixed single location cannot be considered globally as uncertainties in the properties of the cloud vary from one region to other.
The optical properties of cirrus clouds would be highly useful in the calculation of radiative effects of climate system which greatly affects the earth’s radiation budget. Also, it is essential in understanding the interaction of cloud-radiation effects. Studies related to optical properties of cirrus clouds (depolarization ratio and optical depth) and their dependence on atmospheric parameters (temperature, pressure, and relative humidity, etc.) are of great importance in cloud research. Studies on optical properties of cirrus clouds at various seasons over Gadanki region will have an immense value in playing a vital role and will help to reduce global climate model uncertainty in forecasting temperature change at the end of the century. In the present work, ground-based lidar measurements (January 2013 to December 2013) are used to investigate the optical properties of cirrus clouds at tropical latitude Gadanki, India.
Instrumentation and Data Analysis
The present research work is carried out using Mie LIDAR situated at National Atmospheric Research Laboratory (NARL), Gadanki, a tropical rural station located at 13.5°North, 79.2°East in a height of 375 m Above Mean Sea Level (AMSL) in southern India. The lidar system is a monostatic, pulsed, biaxial, and dual polarization system. To study the properties of cirrus clouds, the lidar system usually operates for about three to 5 h during night time. This constraint in observation is due to the appearance of thick clouds at low altitudes and rain. Since 2007, the lidar transmitter uses an Nd:YAG (model : PL8050) pulsed laser operating at its wavelength (s) of 532 nm with average pulse energy of 600 mJ, pulse width of 7 ns, and Pulse Repetition Frequency (PRF) of 50 Hz (Pandit et al., 2015).
The receiver system employs two independent telescopes, one to cover middle and upper atmosphere altitudes (30 to 80 km) termed as Rayleigh receiver and another to cover Upper Troposphere and Lower Stratosphere (UTLS) altitudes (4 to 40 km) termed as Mie receiver. Data related to backscattered photon count collected from Mie receiver [consisting of 35.5 cm diameter, Schmidt–Cassegrain type, and Field of View (FOV) 1 mrad], in the altitude range of 8–20 km is used in the present study. From that data depolarization measurements can be calculated. Beam splitter is used to split the beam into cross polarized (perpendicular) and co-polarized (parallel) signal components. These parallel (designated as P-channel) and perpendicular (designated as S-channel) signal components are individually recorded through two identical and orthogonally aligned Photo Multiplier Tubes (PMT’s). For Mie receiver channel, an MCS-Plus (EG and G ORTEC) multi channel photon counter is used for recording the photon counting signals as a function of time (altitude). The dwell time is 2 μs for the photon counting system, which corresponds to an altitude resolution of 300 m and the backscattered returns are summed for 250 s. The returns of backscatter signal from the cirrus clouds are received as photon counts and are analyzed by employing lidar inversion methods (Fernald, 1984; Klett, 1985). The backscattered signals in terms of photon counts are corrected with the molecular profile obtained from the co-located radiosonde measurements. In this present research work, the optical properties of cirrus clouds such as optical depth, and depolarization ratio are determined using Klett inversion algorithm. To perform this, the reference altitude should be considered as 35 km at which the backscattering contribution is mainly from the air molecules and the aerosol scattering can be neglected. Further it is used to calculate the back scattering ratio, which is defined as the ratio of total backscattering coefficient to the molecular backscattering coefficient.
The back Scatter Ratio (SR) is estimated based on the aerosol and molecular backscattering coefficients [βa(r) and βm(r)] and is defined as the ratio of sum of the aerosol and molecular backscattering coefficients divided by the molecular backscatter coefficient can be written as
where SRcirrus is the cirrus clouds back SR, βa(r), and βm(r) are the backscattering coefficients of aerosols and molecules with respect to the altitude r. Throughout the analysis, a threshold value of SR > 1.5 is maintained for the determination of cirrus clouds (Sandhya et al., 2015). It can be noted that the presence of cirrus can be in the altitude region 10–18 km on many days during January-December 2013.
The lidar backscattering signals are processed separately for the co-and cross polarization channels in order to obtain the SR profile. Using the appropriate molecular density profiles (by Rayleigh theory), the molecular backscattering values (Gadanki station) at each altitude for the P and S channels were calculated. The molecular air density profile can be obtained from the co-located balloon (radiosonde) measurements. The linear depolarization ratio (LDR) is allied with the backscattering coefficients and is estimated using lidar signals from the scattering ratios of P and S channels. The LDR, denoted as δ(r), is obtained from the scattering ratios of cross polarized S-channel S⊥,SR(r) to the co polarized P-channel P∥,SR(r) from the lidar backscatter returns, with respect to the altitude r and is estimated as
The depolarization measurements provide an insight to the distribution of ice and water within the clouds. The presence of water droplets and ice crystals with different shapes in the cloud can be distinguished based on the LDR values. It is a function of the cloud altitude, temperature, and the distribution of humidity within the cloud.
The extinction coefficient α(r) can be calculated in terms of backscattering ratio and molecular backscattering coefficient (Klett, 1981) and is given by
where LR is the Lidar Ratio (LR) generally known as extinction-to-backscatter ratio, which is a key factor to study the nature of cloud particles. The LR values (range dependent) are then calculated from the method explained by Satyanarayana et al. (2010). The LR value of 25 sr is used for the present study.
Cloud Optical Depth (COD) denoted as τcirrus, is obtained from the integral of cloud extinction profile α(r) of cloud base (rbase) to the cloud top (rtop), respectively, and is expressed as
The threshold value of COD was first proposed by Sassen and Cho (1992) and classified based on the following criteria; τcirrus < 0.03 for Sub Visual Cirrus (SVC) clouds 0.03 < τcirrus < 0.3 for Thin Cirrus (TC) clouds and 0.3 < τcirrus < 3 for thick or opaque or Dense Cirrus (DC) clouds. These values are obtained from their visual appearance and the same is utilized in the present study.
Results and Discussion
Lidar dataset for the year 2013 (January 2013 to December 2013) was used to study the altitude dependence, distribution, monthly, and seasonal variations of the optical properties of cirrus clouds. In order to analyze the optical properties of cirrus clouds, the annual prominent seasons at this site are categorized as winter (December–January–February), pre–monsoon (March–April–May), monsoon or South–West monsoon (June–July–August), and post–monsoon or North–East monsoon (September–October–November). The ground based lidar observations were made for 122 different nights, out of which cirrus clouds were detected during 98 nights. Even though seasonal behavior could not be attributed with this limited lidar data, a general tendency shall be observed. In the present analysis, Mie lidar dataset was used up to 40 km for measuring the vertical profiles of optical depth and depolarization ratio for the period of observation.
Optical Properties of Cirrus Clouds
Optical Depth and Depolarization Ratio
Optical depth (or thickness) is defined as the opacity of the cloud and it is a measurable quantity of extinction coefficient within the boundaries of the cloud. COD gives information about the radiative behavior and determines whether the cloud can cause positive or negative radiative effect. It significantly depends on geometrical thickness and composition of the clouds. LDR is related to the ice-crystal habits that are largely unknown for a specific type of crystal (Chen et al., 2002). Over the tropics, all cirrus clouds are formed by non-spherical ice particles and hence these particles will cause significant depolarization to the backscattered radiation. The observed LDR values range from 0.1–0.6 for non spherical ice particles of cirrus clouds and nearly zero for spherical water droplets of non cirrus clouds (Sassen, 1995; Chen et al., 2002; Manoj Kumar et al., 2019). LDR is sensitive to shape ratios (Noel et al., 2002) and crystal shape (Dai et al., 2019). The LDR values associated with the cirrus clouds indicate the presence of ice crystals with different compositions (Sassen, 1995) and help in the study of cloud formation and dynamics (Sassen and Cho, 1992).
Figures 1A,B represents the pseudo color plots (2D histograms) of variations in optical depth and depolarization ratio as a function of altitude of cirrus cloud (ranging from 9 to 19 km) for the year 2013. Colorbar from figure represent the percentage of COD and LDR cases. The lower altitude clouds below 9 km have low depolarization values suggesting that these clouds do not contain ice particles, which may be attributed due to temperature threshold (Campbell et al., 2016). It can been seen that from Figure 1A the majority of the cirrus clouds in the altitude ranging from 10 to 17 km shows the optical depth values ranging from 0.01–0.4, but few clouds with higher values of optical depth are also seen. Similarly at the same altitude range (Figure 1B) the depolarization ratio values ranging from 0.1–0.4, but quite a few higher values are also seen. It was observed that at the altitude above 12 km the LDR values are high ranging from 0.3–0.6, which shows good agreement with the values reported in literature (Sassen and Dodd, 1988; Sassen et al., 2001; Radhakrishnan et al., 2010). At higher altitudes, the ice clouds (cirrus) have larger ice crystals due to low temperature range resulting in high depolarization values (Chen et al., 2002). The lower depolarization values around 8 km indicate the presence of large water droplets which is associated with high temperature of the clouds, suggesting that the clouds at lower altitudes (<8 km) may be stratus type of clouds consisting of mixed phase due to weak ice crystal scattering.
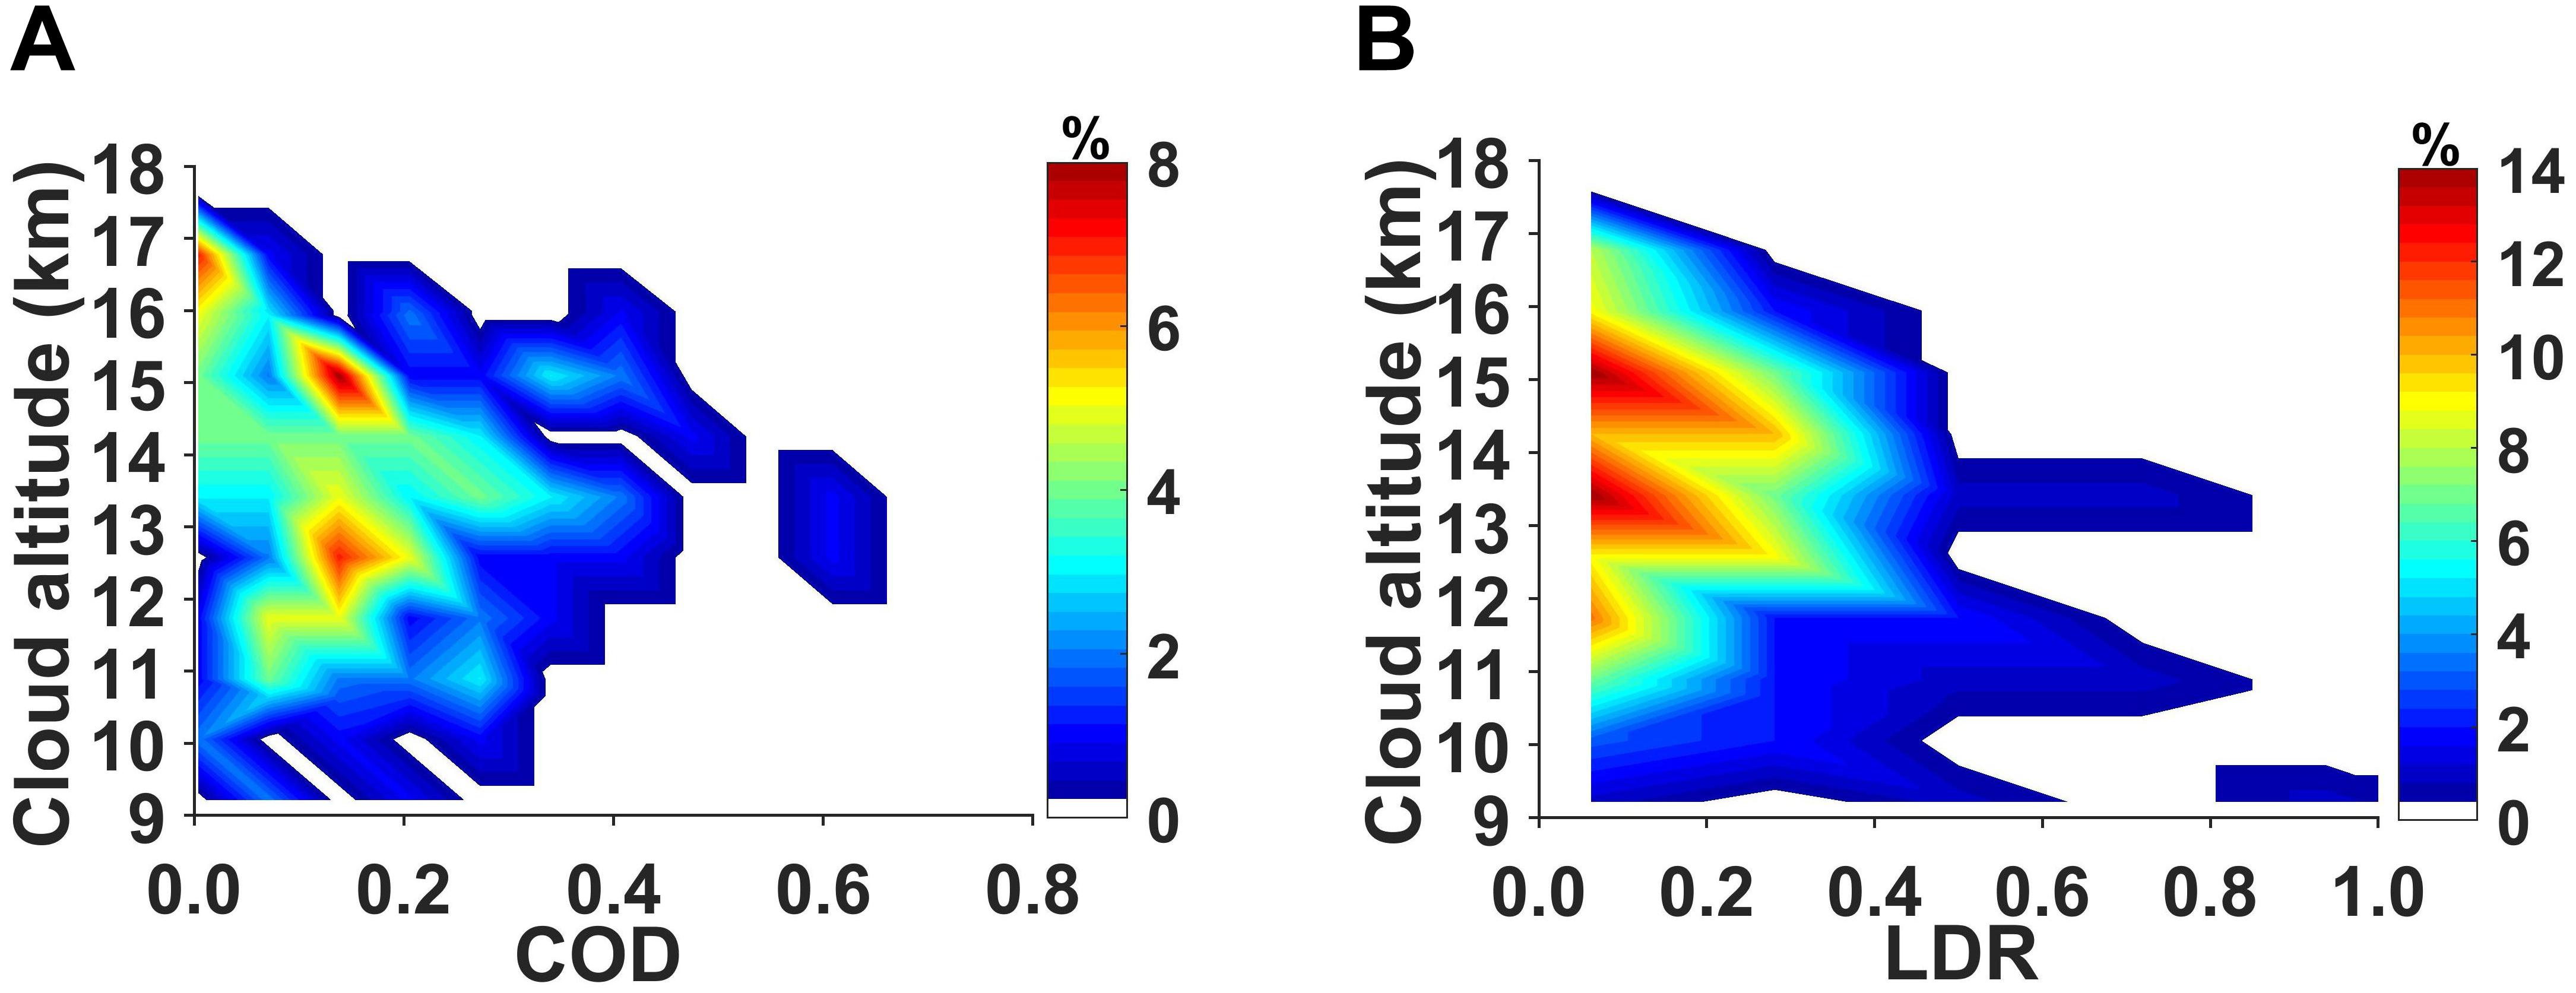
Figure 1. Altitude variations of (A) optical depth and (B) depolarization ratio.
It can be seen that the optical depth and LDR increase with cloud altitude in the range 10–14 km and above that they decrease. Above 14 km, optical depth values range from 0.1–0.3, and LDR ranges from 0.15–0.3. Almost thin cirrus clouds whose optical depth values above 0.03 and below 0.3 occur in the altitudes between 11 and 17 km. Generally, the high altitude cirrus clouds with depolarization ratios >0.3 indicate the existence of hexagonal shaped and <0.3 indicate the presence of thin plates or horizontally oriented ice crystals (Sassen, 1995). As shown in Figure 1B, in the altitude range between 11 and 17 km, the cirrus clouds have higher values of depolarization with the corresponding LR (25 sr) which signifies the presence of hexagonal ice crystals (Radhakrishnan et al., 2010) during the period of study. The variations in the optical depth and depolarization ratio mainly depend upon the altitudes at which cloud occurs.
Scatter plot in Figure 2 represent the interdependence of measured optical depth of cirrus clouds categorized with depolarization ratio for the year 2013. A positive correlation (0.3950) between optical depth and the depolarization ratio is observed. The scatter plot classifies the cirrus layers into SVC clouds, TC clouds, and DC clouds. SVC clouds show lower values of depolarization which indicate that the clouds may consist of plate to column (or) aggregate type of ice crystals (Radhakrishnan et al., 2010). TC shows higher values of depolarization and DC shows moderate values of depolarization indicating the presence of randomly oriented crystals in ice clouds.
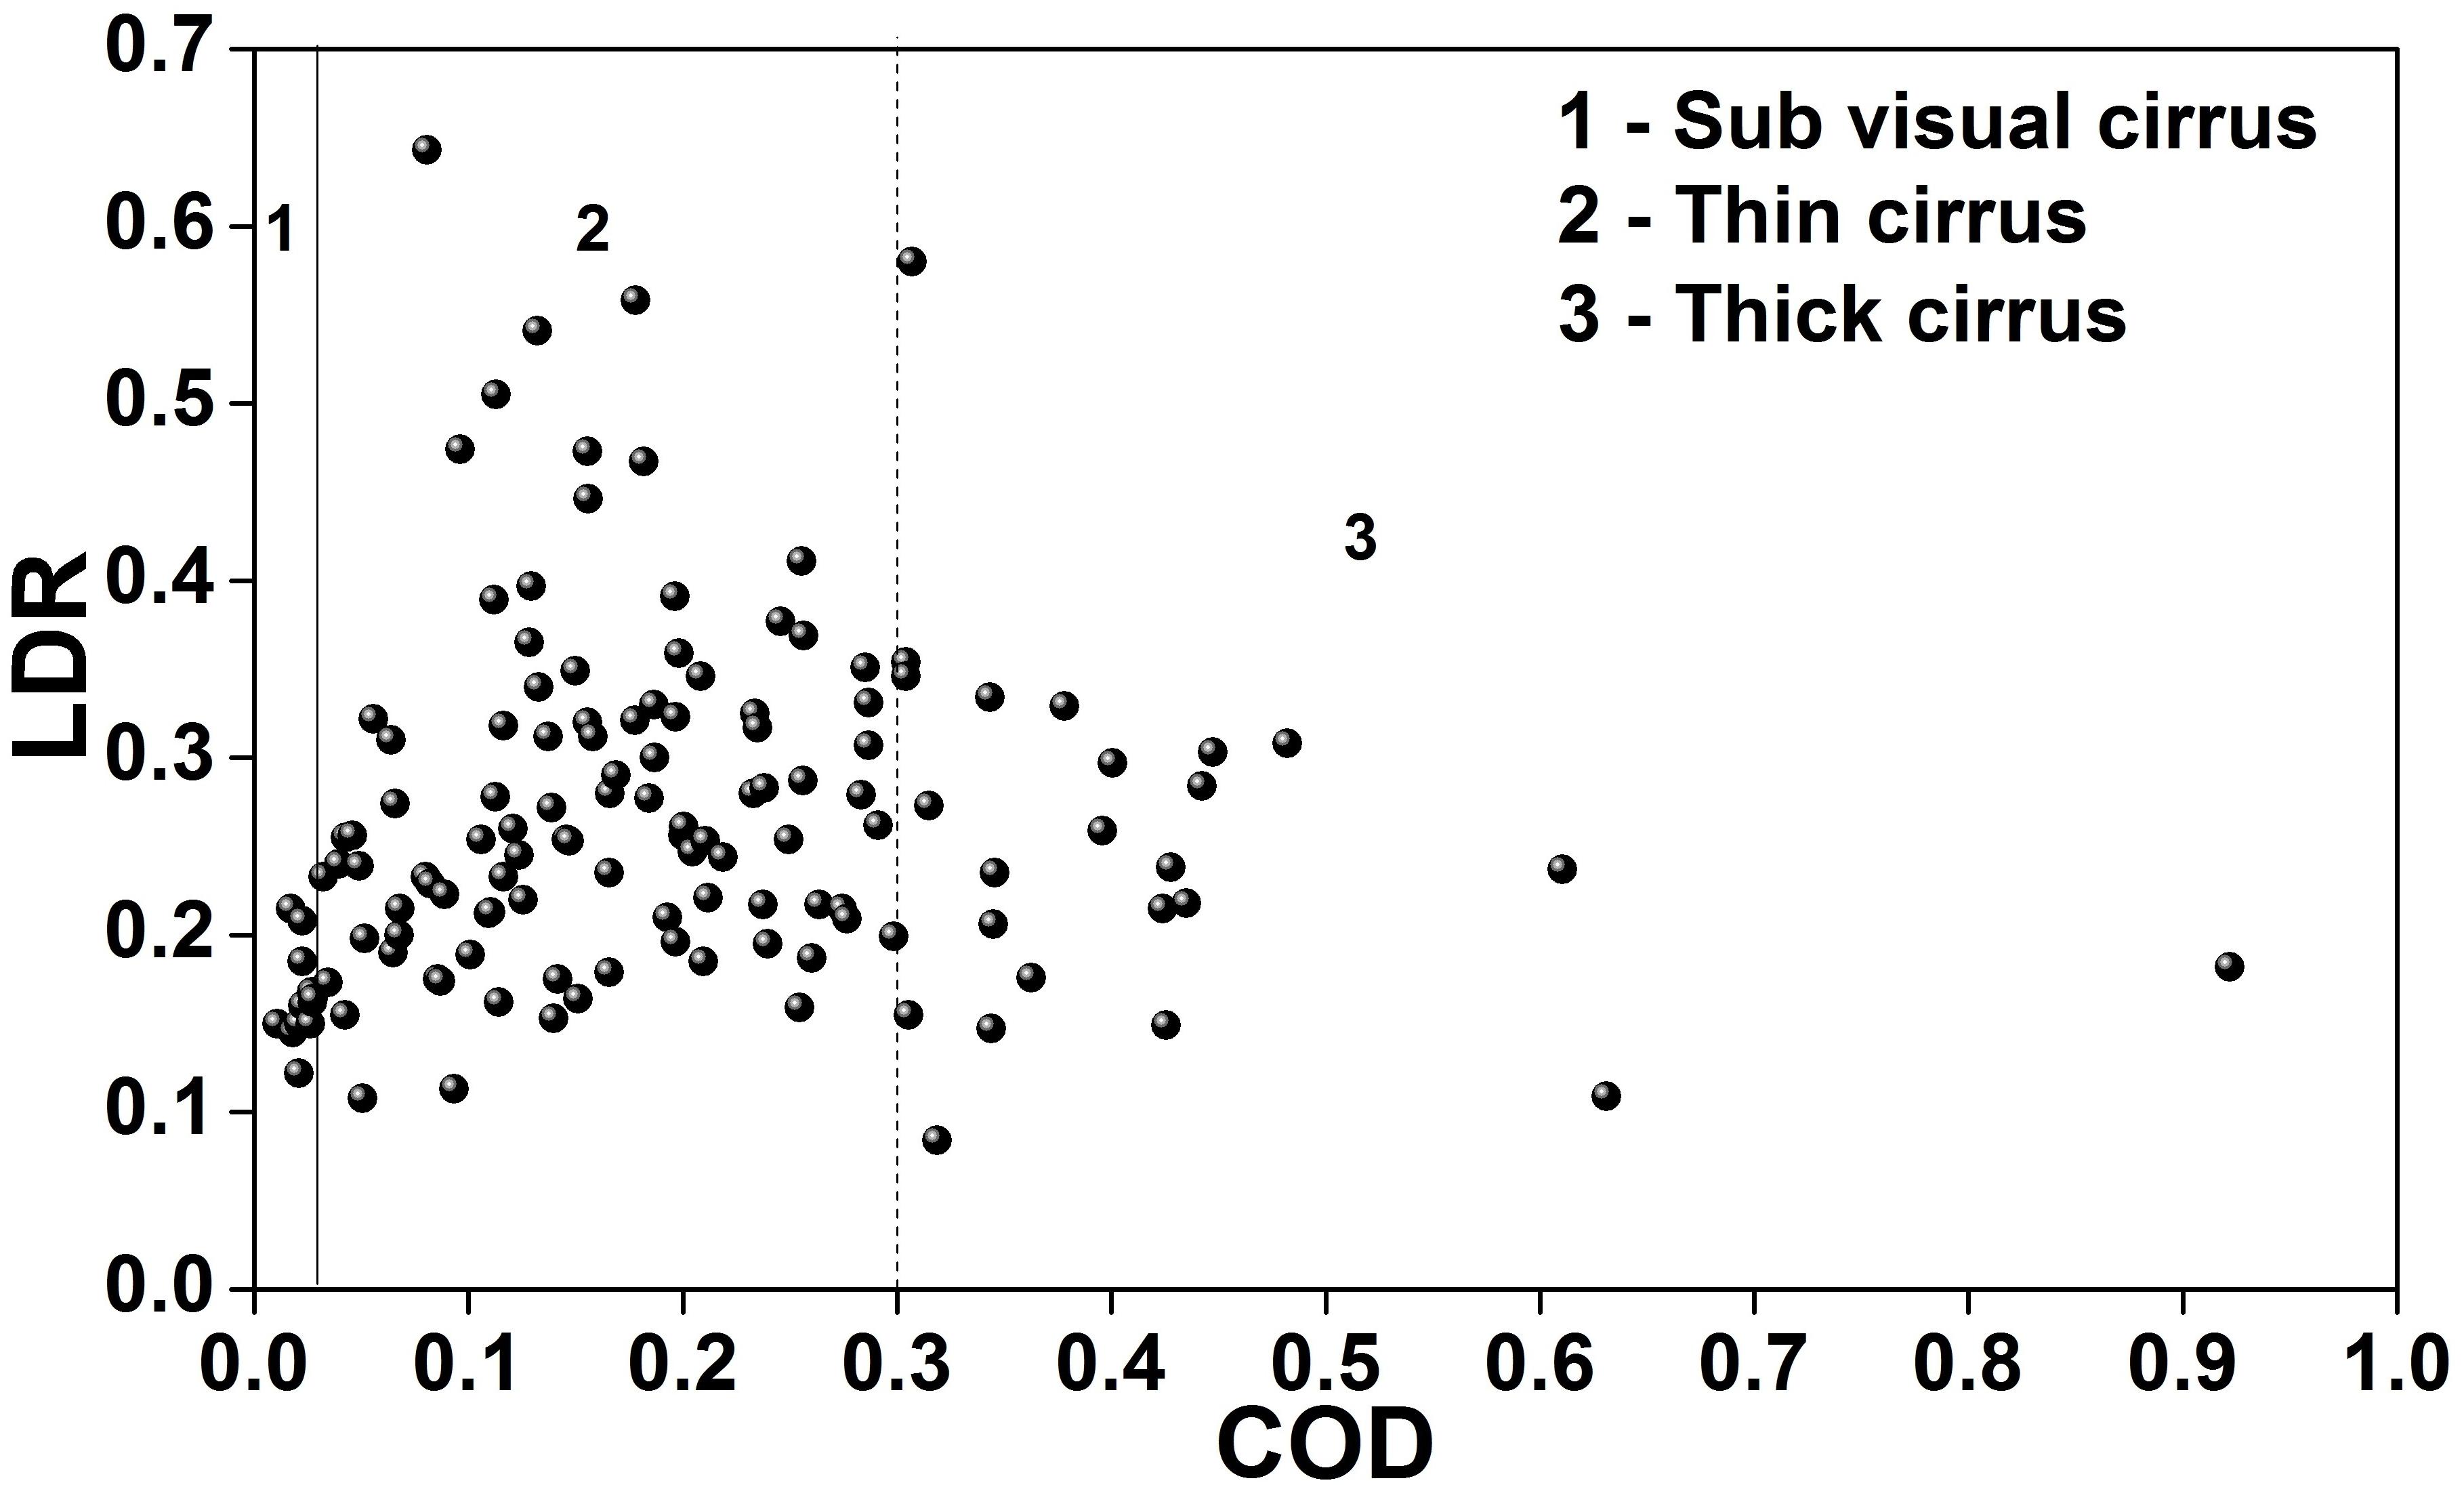
Figure 2. Interdependence of measured cloud optical depth and linear depolarization ratio.
In case of thin cirrus clouds, it is observed that optical depth increases with depolarization ratio. The moderate values of depolarization ratio with higher values of optical depth show the occurrence of thick cirrus clouds. Lower values of depolarization ratio indicate the presence of super cooled water droplets in cirrus clouds (year 2013). In the present analysis, it is found that 8% of the observed cirrus clouds are sub visual (τcirrus < 0.03; Campbell et al., 2016), 77% of the observed cirrus clouds are thin (0.03 > τcirrus < 0.3), and 14% of the observed cirrus clouds are thick (τcirrus > 0.3) over the Gadanki station (Figure 2). The values obtained for thin clouds are in good agreement with the values reported (Manoj Kumar et al., 2019) for the years 2014 and 2015. Hence, for the year 2013, the occurrence frequency of optical depth (figure not shown) reveals that most of the observed cirrus clouds over this region are thin clouds only. The observed values vary due to the difference in period of observation. Lidar data are collected only during night time because of the high presence of low level clouds during day time. Hence its impact may be negligible. The quality of Lidar profiles are rigorously checked based on their signal to noise ratio before using them for analysis. The data is considered mainly because of the strong backscattered signal received from the cloud. Also, the signal is corrected by the molecular contribution using ancillary computed values, i.e., the atmospheric model. Satellite observations are not analyzed because of satellite long revisit time over the site taken for study. Thus ground based observations are predominantly significant and hence they are used in the present analysis. Table 1 gives the statistical summary of cirrus cloud layers for the period of observation. Mean optical properties of cirrus clouds and their standard deviation (in parentheses) are calculated from the mean values for the year 2013.
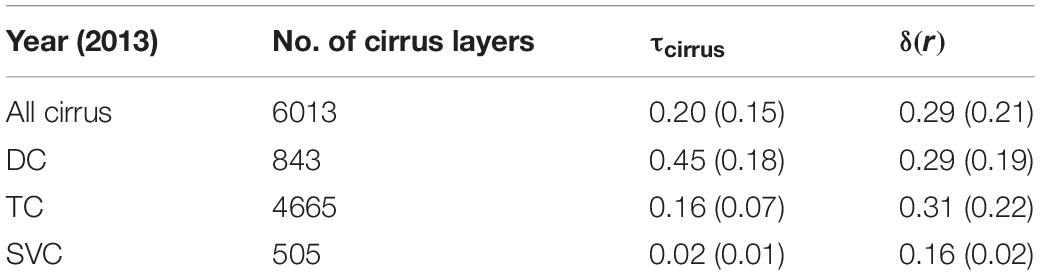
Table 1. Statistical details of mean optical properties of cirrus cloud.
Monthly Variations of the Optical Properties of Cirrus
Figure 3 shows the total number of observations of lidar and cirrus clouds during the year 2013. The lidar dataset could not be obtained during February and March 2013 which may be due to unforeseen circumstances. The lidar and cirrus observations are maximum in the month of December (winter season) and minimum in the month of July (monsoon season). In general, during the monsoon period, the convective activity is high at the tropical regions. The occurrence of cirrus clouds is found to be more prominent during the monsoon period.
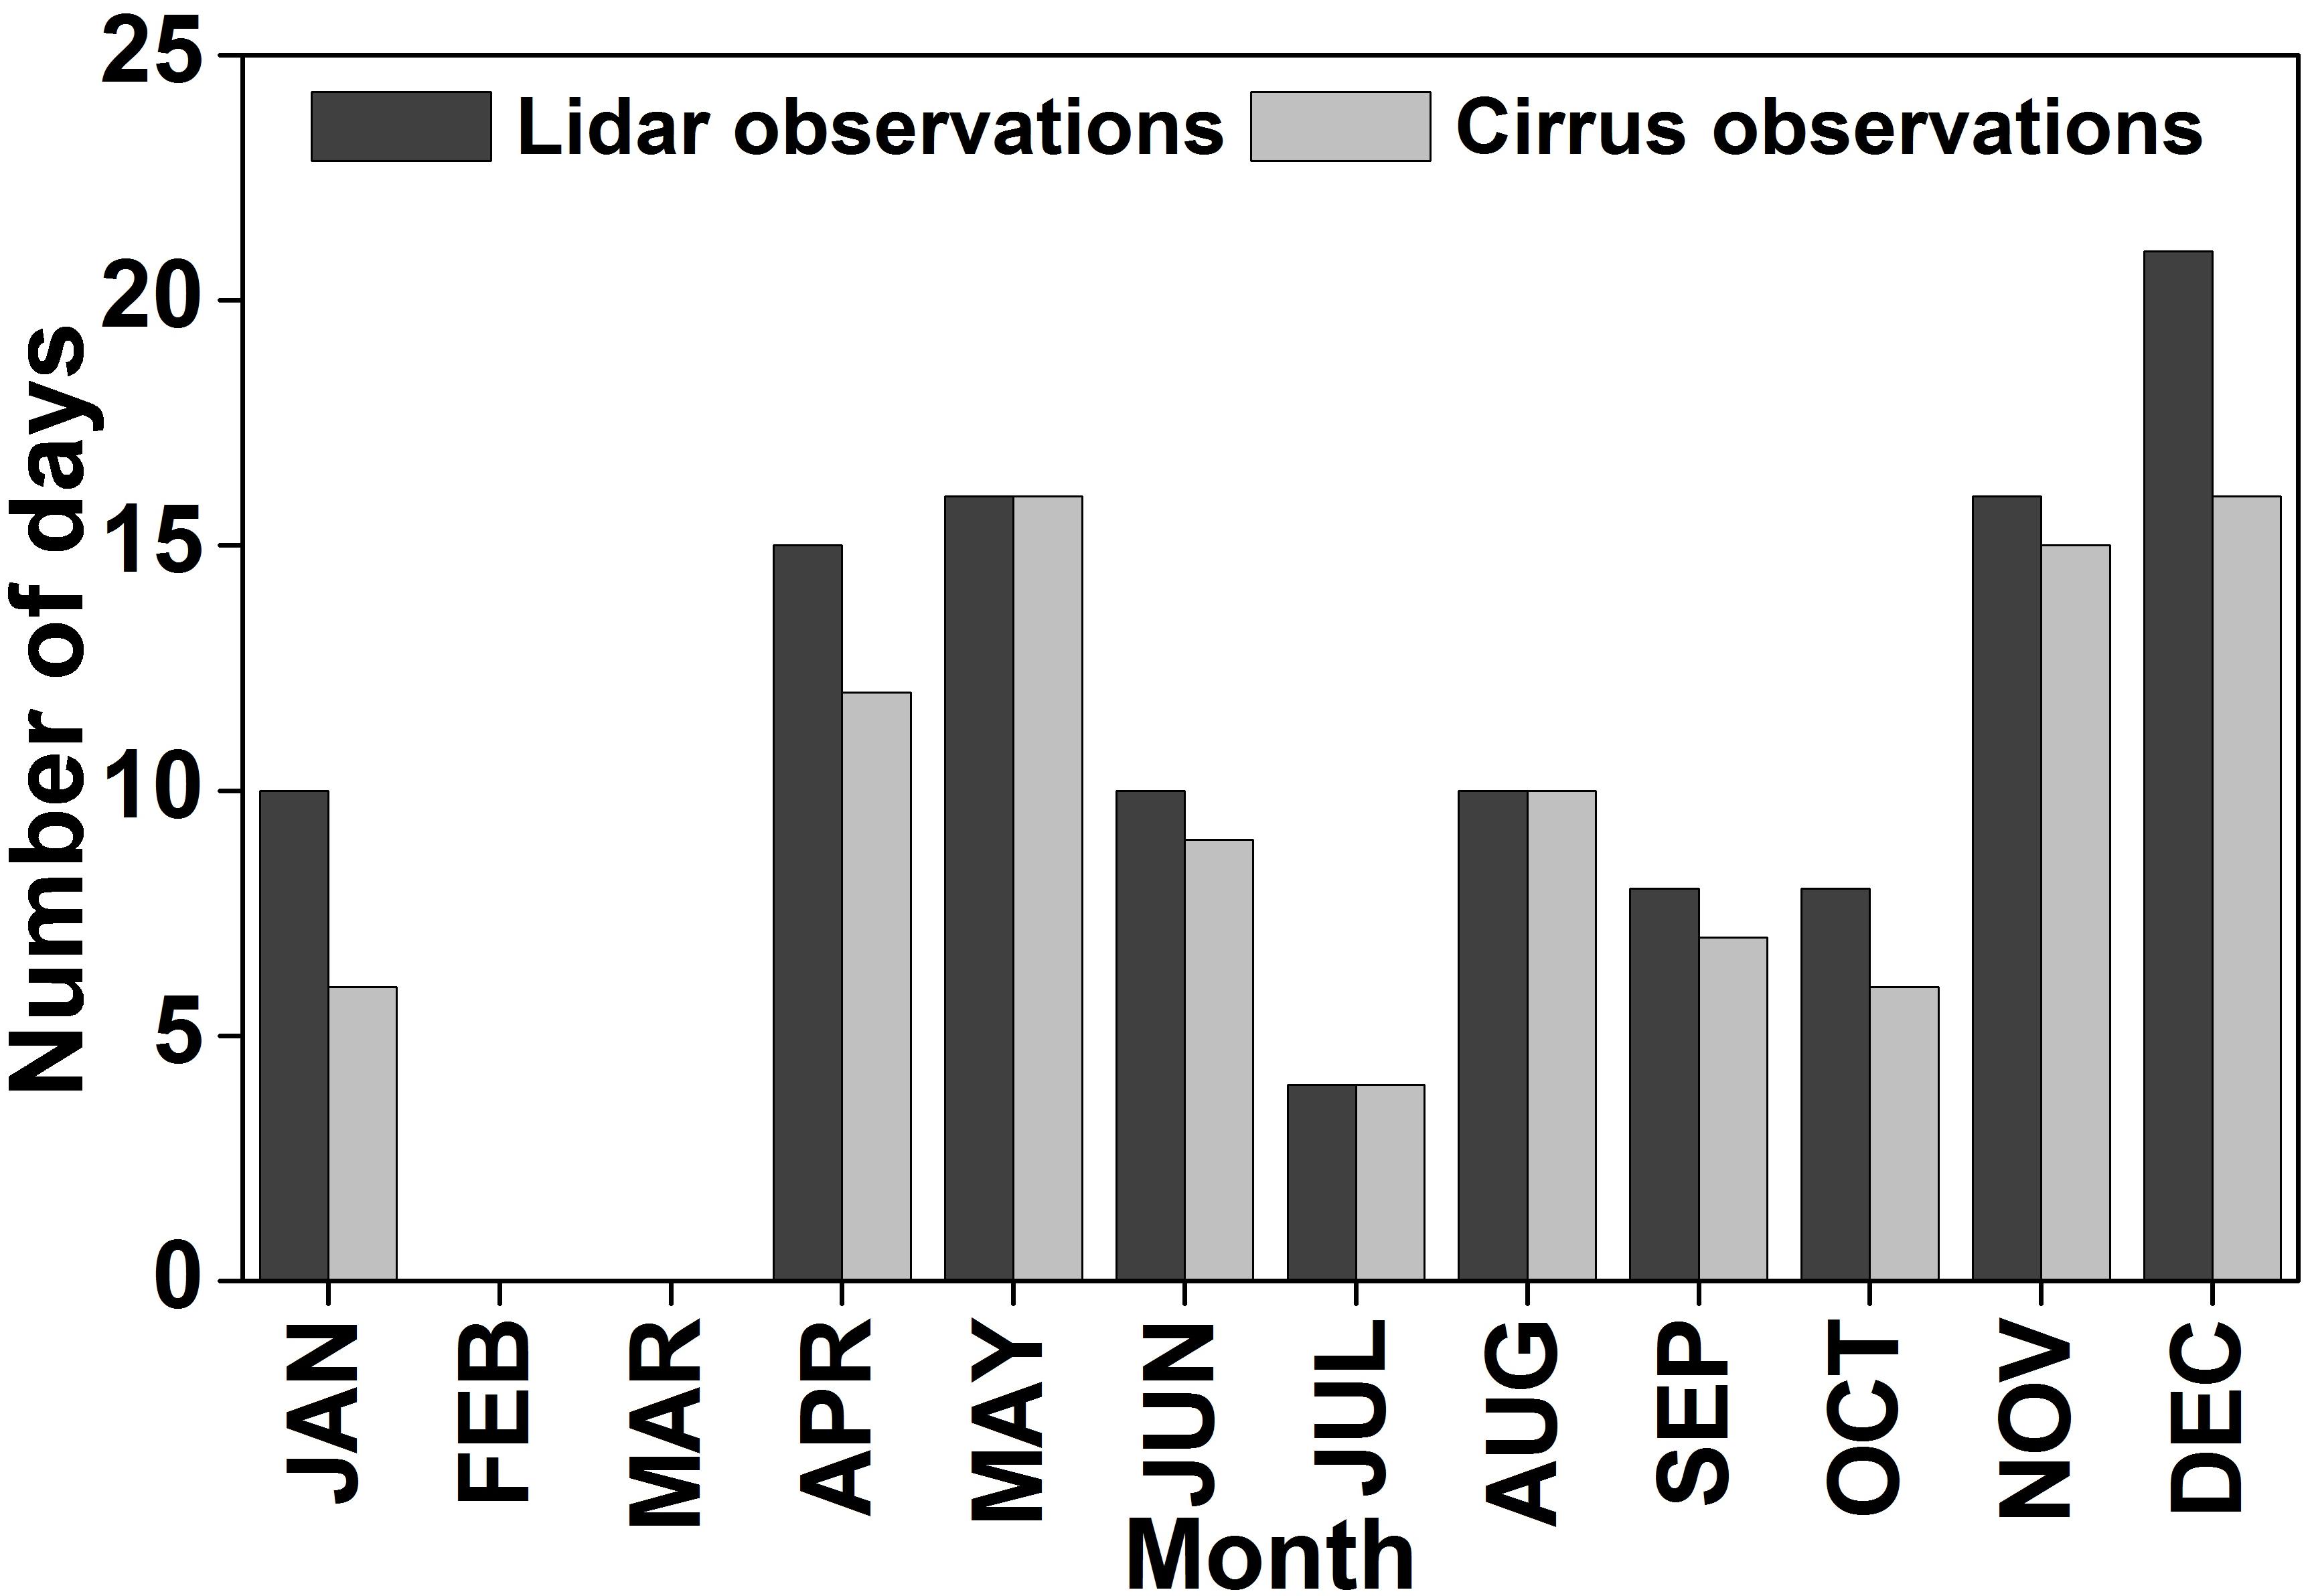
Figure 3. Lidar and cirrus clouds observations during 2013.
The monthly mean variation of optical properties of cirrus clouds are depicted in Figures 4A,B during the period of observation. The symbolized vertical bars in both the cases represent the standard deviation from their calculated values. In this study, only single scattering effects are considered. Higher values of optical depth and depolarization ratio are observed during the post-monsoon season and lower values are observed during August (monsoon season) and January (winter season). Higher values of optical depth refer to the maximum thickness of the cloud and its variability mainly depends upon the thickness and composition of the cloud. The observed monthly mean variation in the optical depth is due to the thickness of the largely available cloud which also results in the change in microphysical properties of clouds (Motty et al., 2015).
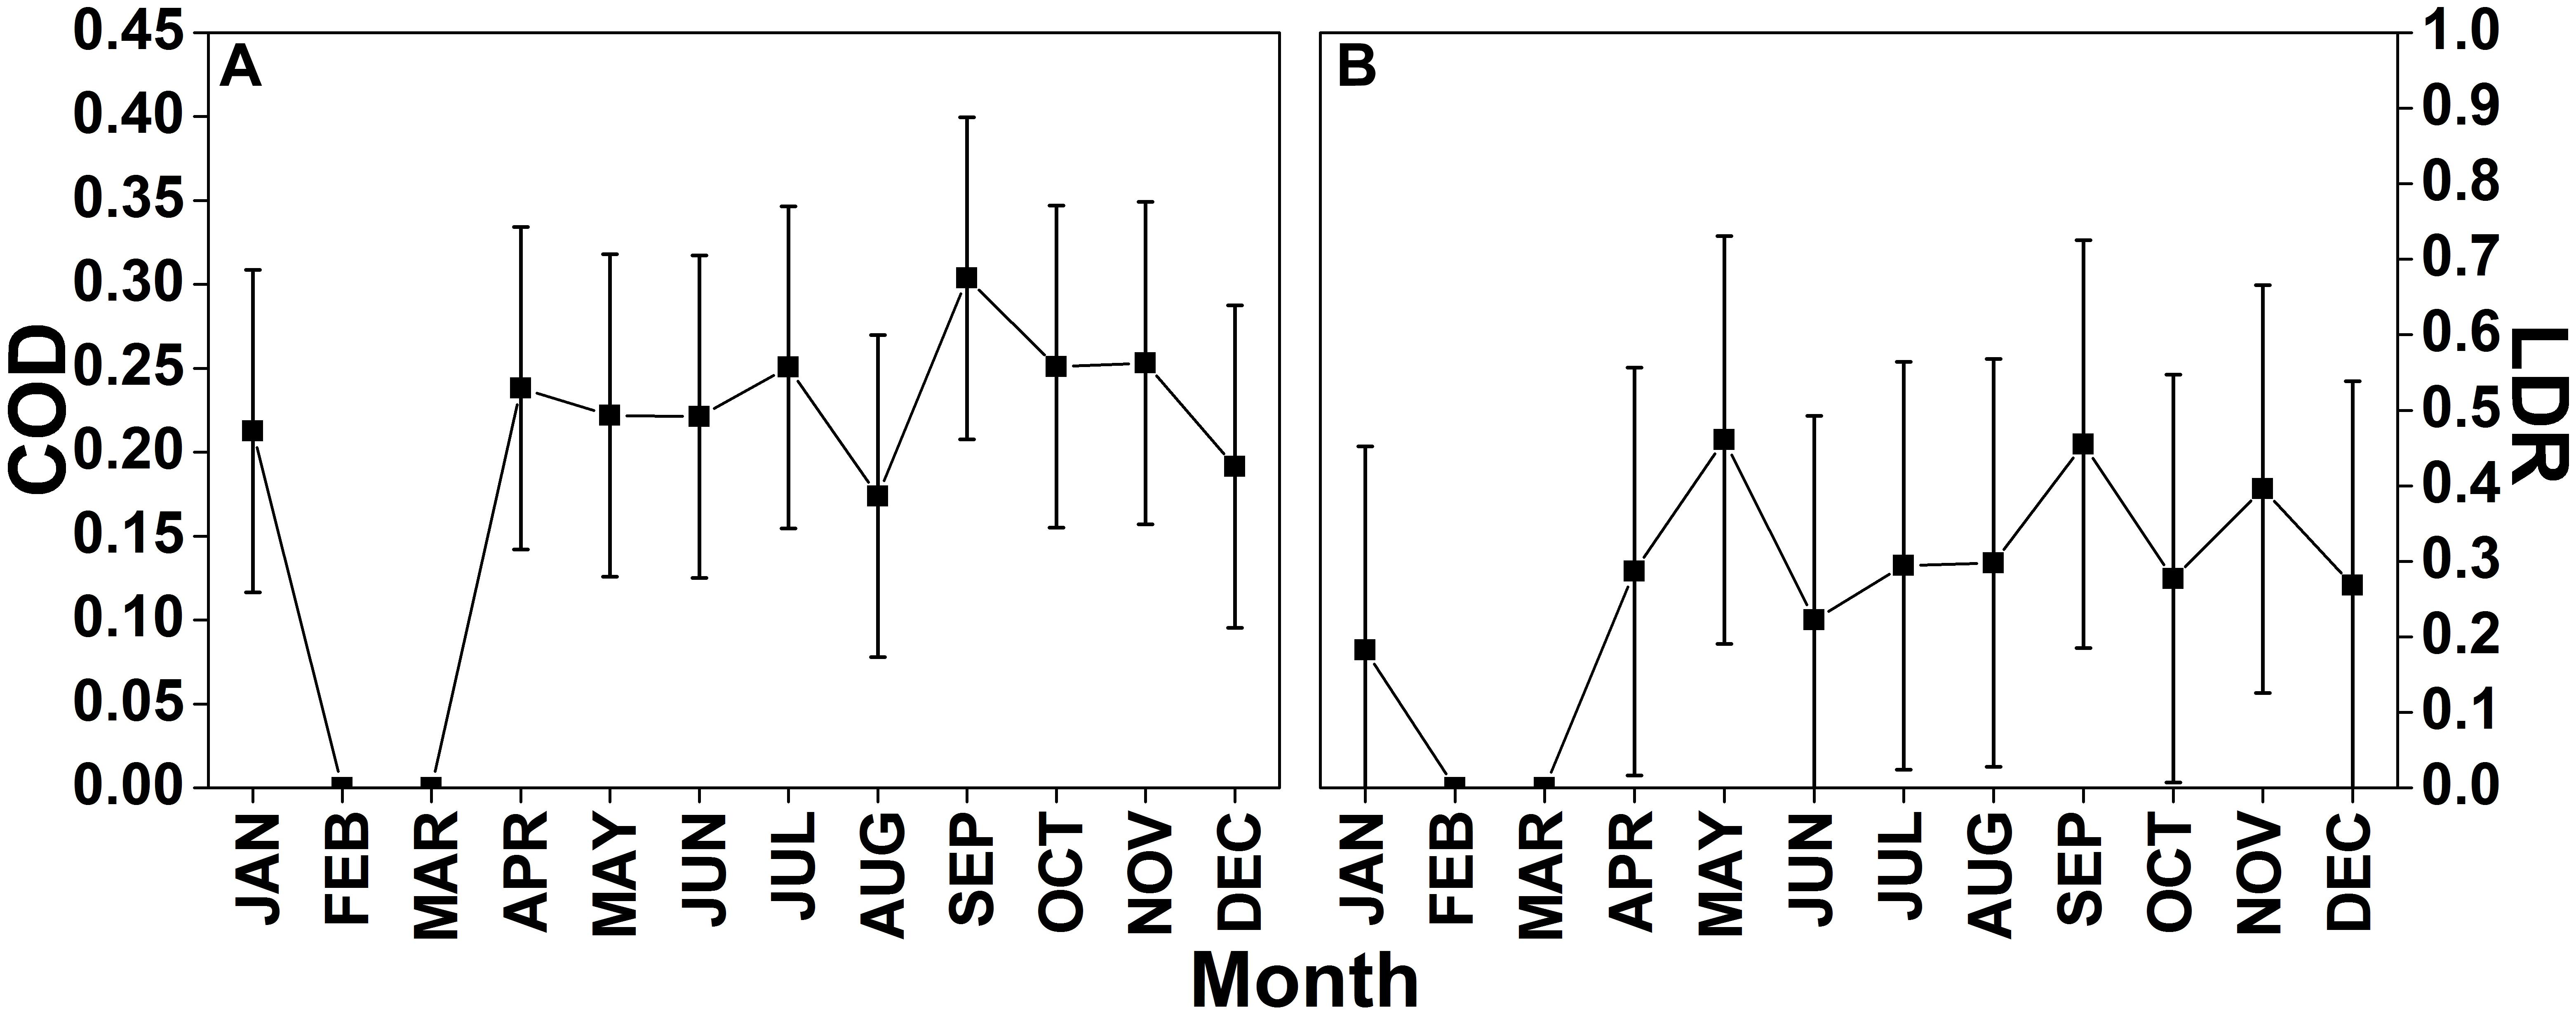
Figure 4. (A) Monthly mean variation of optical depth and (B) depolarization ratio of cirrus clouds. Vertical bars represent standard deviation.
Higher values of COD and LDR are observed due of the presence of ice crystals inside the cloud. It is observed that (Figure 4A) the average value of optical depth ranges between 0.15 and 0.3 which indicate the presence of optically thin clouds over this site. Similarly, from Figure 4B the depolarization ratio values are found to be between 0.2 and 0.45 indicating the presence of ice crystals inside the cirrus clouds. However, most of the cirrus clouds seen over Gadanki are optically thin clouds. Sassen and Campbell (2001) identified the structure of clouds as column crystals, thick plate and hexagonal (randomly oriented) thin plate based on the values of depolarization ratio. The typical mean value of optical depth and depolarization ratio of cirrus clouds occurred during different nights of corresponding months as a function of observed cloud altitude are depicted in Figures 5A,B. The days corresponding to the months of observations of cirrus clouds in terms of optical depth and LDR are shown in symbol square (blue) and upward pointing triangle (blue), respectively. The cloud altitude is shown as red colored circle in both the cases.
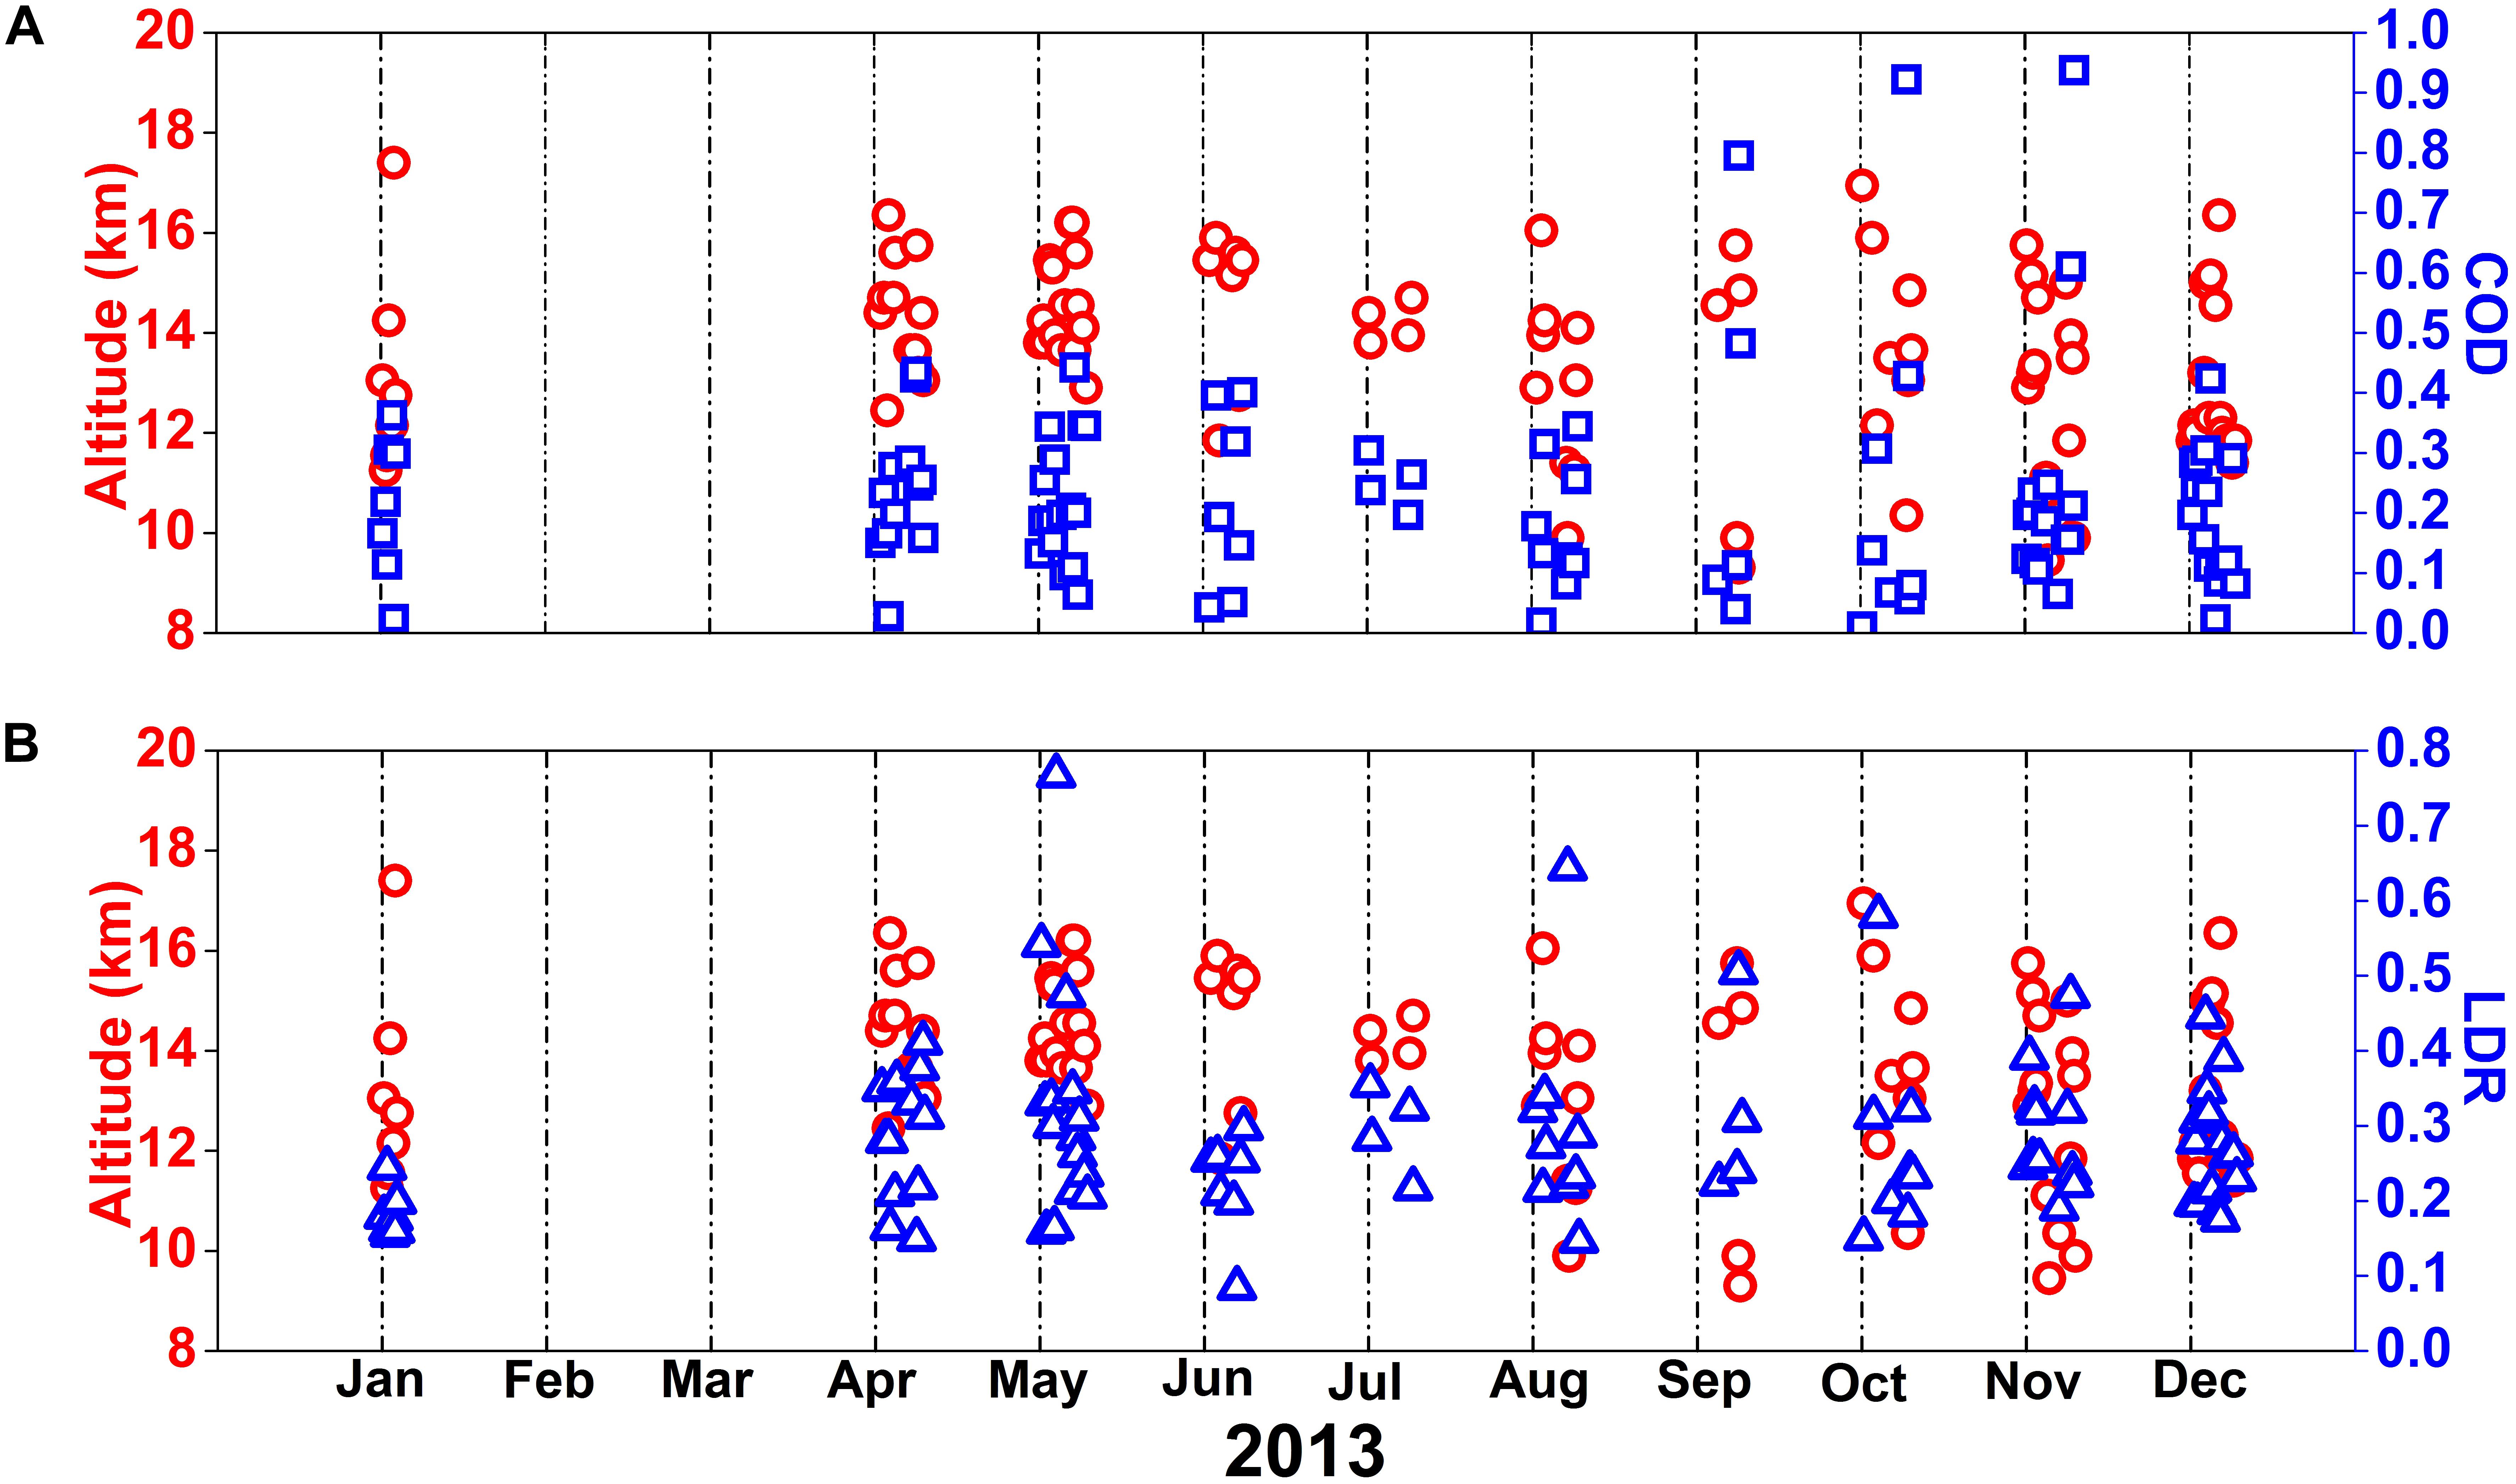
Figure 5. (A) Optical depth and (B) linear depolarization ratio values of cirrus clouds for each case in a month with respect to cloud altitude.
Seasonal Variation of the Optical Properties of Cirrus
The variation of optical depth as a function of depolarization ratio for the four prominent seasons of a year such as winter, pre-monsoon, monsoon, and post-monsoon are illustrated (pseudo colored plots) in Figures 6A–D. The colorbar denotes the number of LDR cases. It is observed that majority of cirrus clouds formed over Gadanki are optically thin having depolarization ratio ranging from 0.1 to 0.6 (Sassen and Cho, 1992). It also shows the presence of moderate thick cirrus clouds and minority SVC clouds based on their optical depth values for all seasons during 2013. Table 2 illustrates the statistics of optical properties of cirrus clouds for the four prominent seasons along with all seasons. During each season, different numbers of cases together with all seasons are found in a year over the tropical rural site Gadanki for the year 2013.
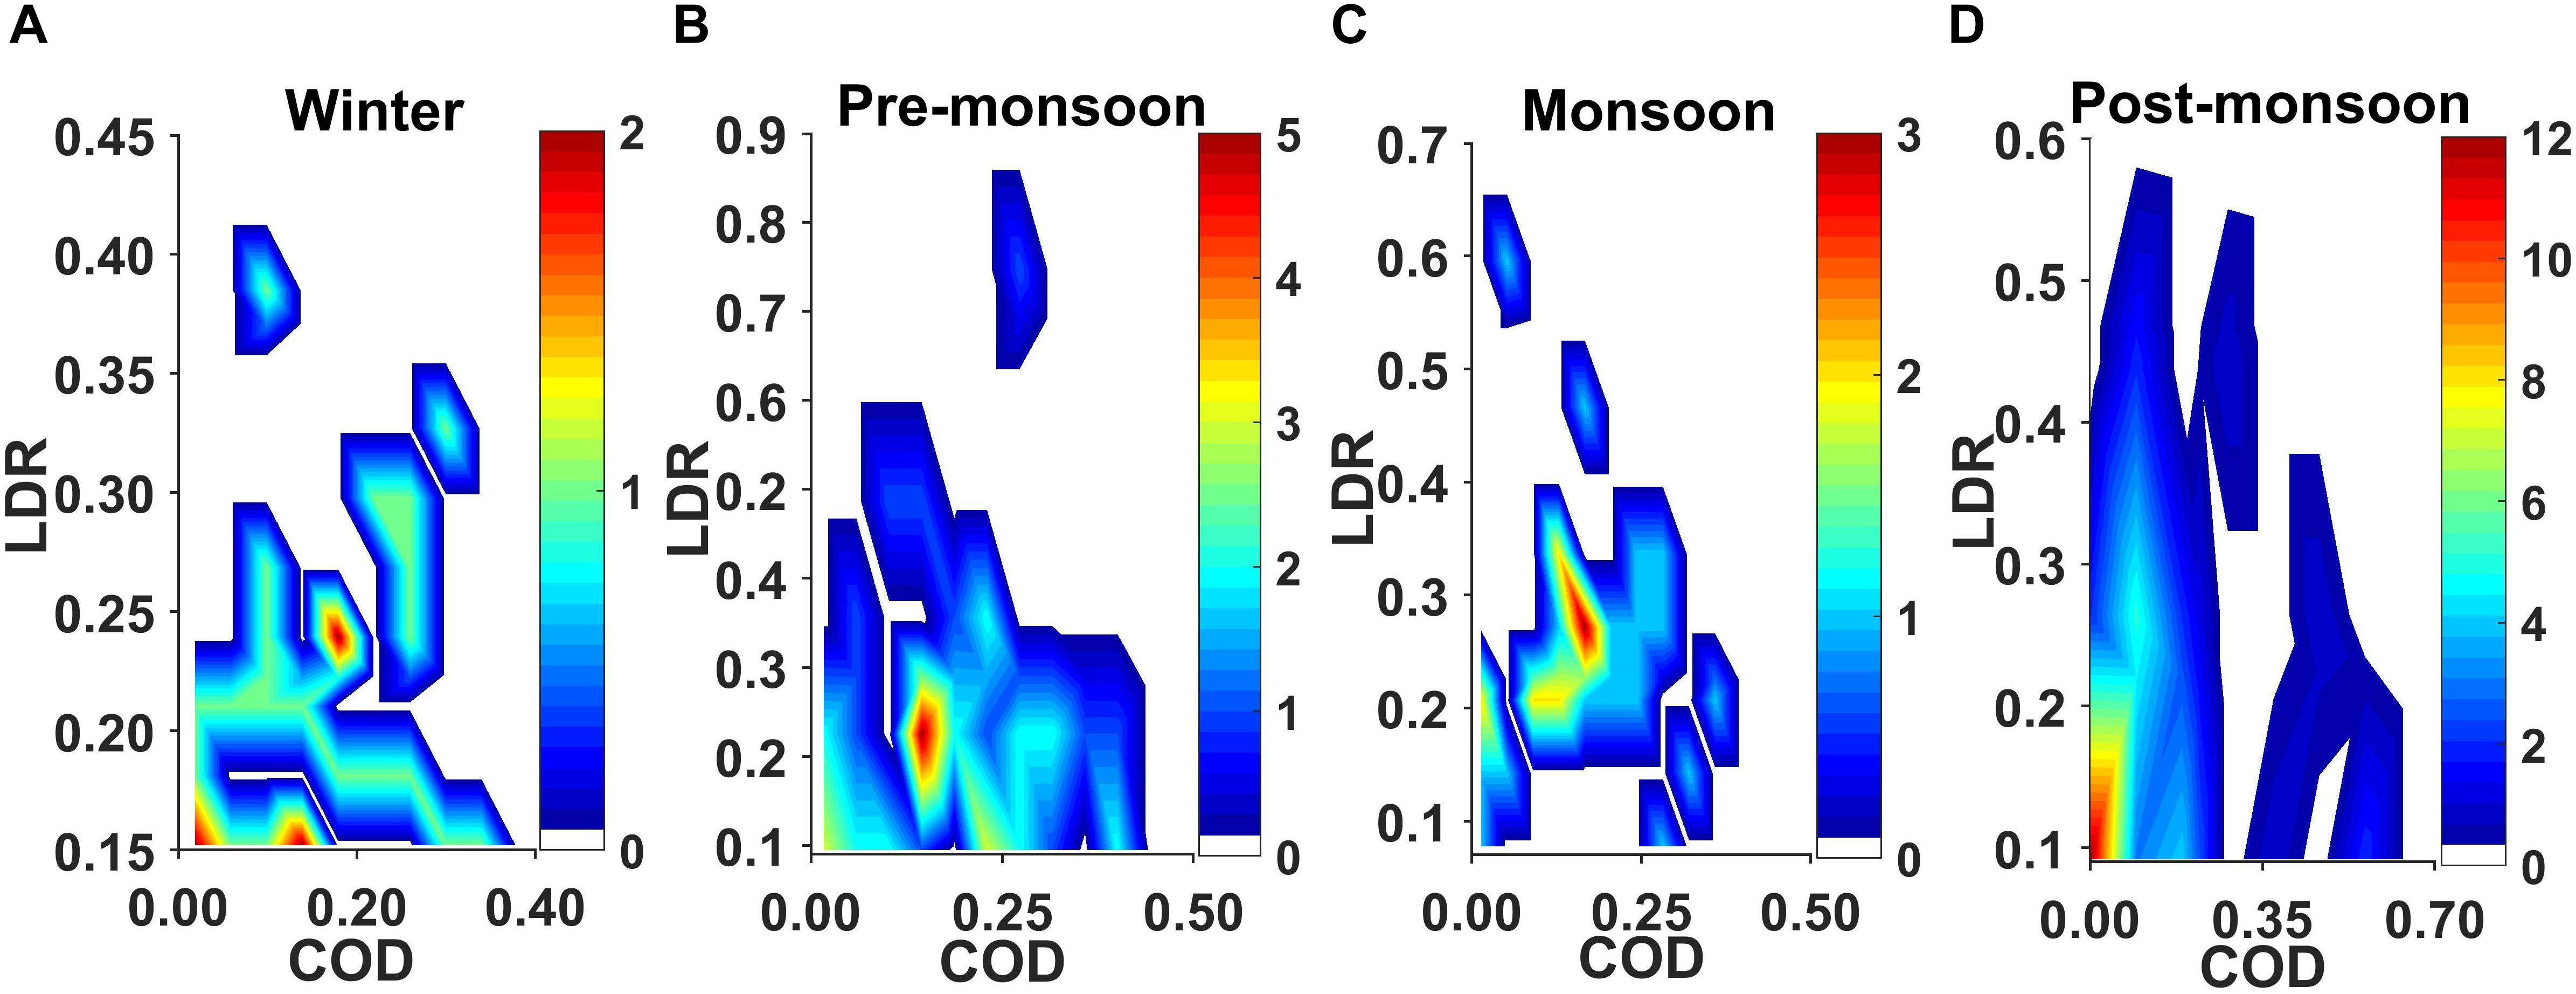
Figure 6. Optical depth versus depolarization ratio of cirrus clouds for (A) winter, (B) pre-monsoon, (C) monsoon, and (D) post-monsoon seasons during the year 2013.
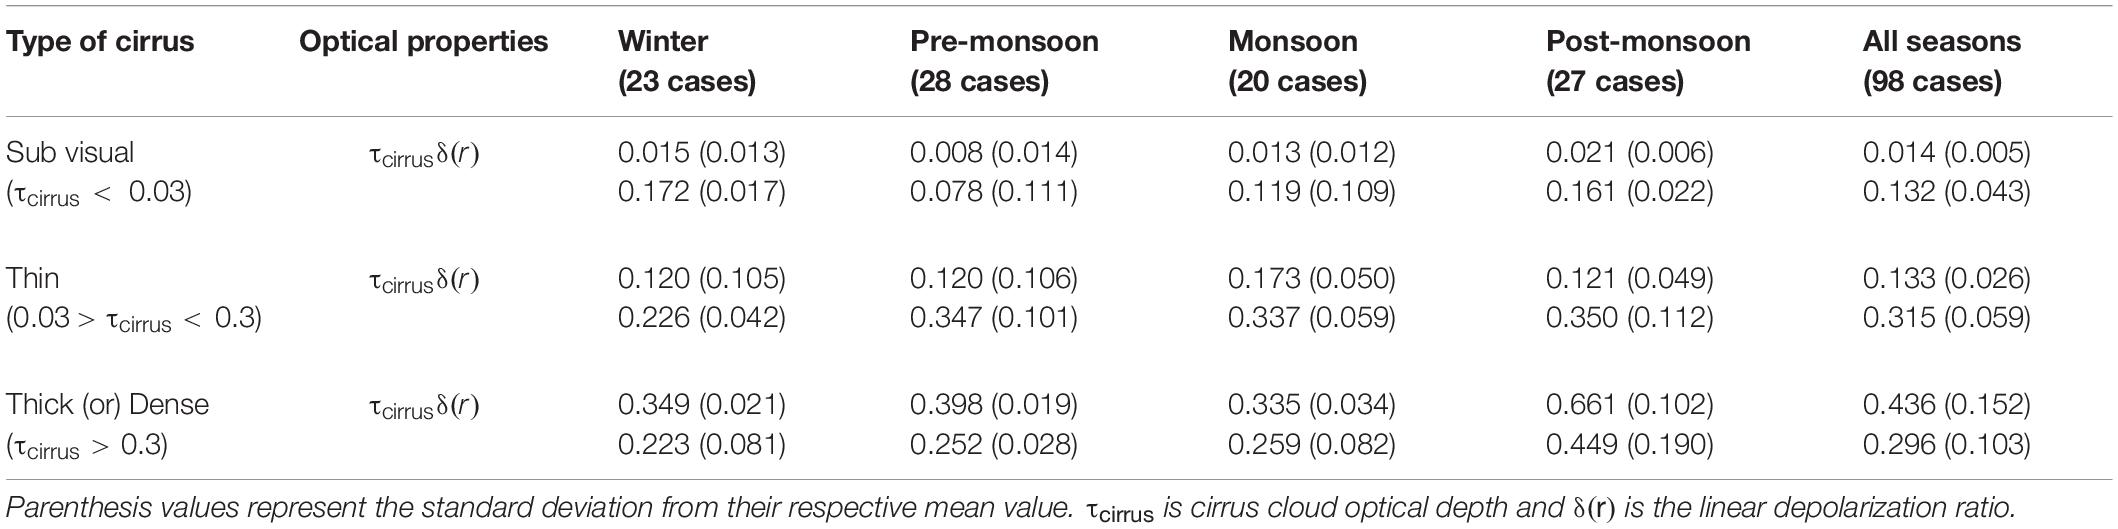
Table 2. Statistics of optical properties of cirrus clouds over Gadanki, India for the year 2013.
It was observed that in all seasons, most of the thin cirrus clouds formed over Gadanki have higher values of extinction (scattering and absorption together), leading to positive radiative forcing. The depolarization ratios vary with optical depth for all the seasons indicating the presence of different ice crystals in the cirrus clouds. The depolarization ratio varies during winter season which shows that the cirrus clouds are composed of supercooled (like ice) particles which affect the earth’s radiative budget. During the pre-monsoon season, the depolarization ratio varies due to process of heterogeneous nucleation (DeMott et al., 2010) indicating the presence of randomly oriented of complex ice crystals inside the cirrus clouds. Low values of depolarization ratio during monsoon season indicate the presence of more water content in the clouds and its high value indicate the presence of moderate to heavy ice particles. During post monsoon season, the depolarization ratio values are almost same, indicating the presence of mixed phase of water, ice and complex ice crystals in the cirrus clouds. The optical depth is high during this season. These cirrus clouds are observed near to the tropopause layer and hence there is a chance for formation of ice crystals during the period of observation. Radiation budget of cirrus cloud depends on orientation, phase and size of cloud particles. Thus it is observed that there is a strong seasonal variation in the optical properties of cirrus clouds. In general, thin cirrus clouds occurred more frequently than the sub-visual and thick clouds. The upper portion of the cirrus clouds contain randomly oriented hexagonal ice crystals with different orientations and sizes, whereas the lower portion contains the mixed phase of ice crystals and liquid water droplets.
Conclusion
The optical properties of cirrus clouds were analyzed using ground-based polarization diversity lidar over the tropical site, Gadanki, India from January 2013 to December 2013. 98 days of cloud data (80.3%) were analyzed out of 122 days of lidar observation. Results show that cirrus clouds were observed in the altitude region between 8–20 km. The values of optical depth and depolarization ratio range from 0.01–0.4 and 0.1–0.4, respectively. It is observed that the optical depth and LDR increases in the altitude range of 10–14 km and then decreases. Above 12 km, the LDR values are high (0.3–0.6) which confirms the presence of ice crystals in cirrus cloud having thick plate structures. The interdependence of optical depth and LDR of cirrus clouds is analyzed and a positive correlation is observed between them. Based on the measured optical depth values, cirrus clouds are classified as sub-visual cirrus (8%), thin cirrus (77%), and thick cirrus (14%) and it is observed that most of the cirrus clouds that are formed above this site are found to be thin clouds. Monthly and seasonal variations of optical depth and LDR of cirrus clouds were presented during the period. Summary of cirrus layer statistics for the total time of observation and the statistical variation of the optical properties of cirrus clouds is presented for the period of observation.
The present research study can be relatively useful in the parameterization of cirrus clouds and can be a corresponding tool to satellite product that cannot provide vertical structure of cloud. The kind of information presented here is required as input in the calculation of radiative transfer models. Moreover, the statistics of cirrus clouds properties could also be useful in the improvement and validation of the subsequent satellite product retrievals.
Data Availability Statement
All datasets generated for this study are included in the article/supplementary material.
Author Contributions
NM: conceptualization, methodology, formal analysis, and draft preparation. KV: supervision and editing.
Conflict of Interest
The authors declare that the research was conducted in the absence of any commercial or financial relationships that could be construed as a potential conflict of interest.
Acknowledgments
The authors thank NARL data center, Gadanki for providing the LIDAR datasets and necessary support. The authors express their gratitude to the two reviewers for their resourceful suggestions in shaping the work as is presented now.
References
Campbell, J., Lolli, S., Lewis, J., Gu, Y., and Welton, E. (2016). Daytime cirrus cloud top-of-the-atmosphere radiative forcing properties at a mid latitude site and their global consequences. J. Appl. Meteorol. Clim. 55, 1667–1679. doi: 10.1175/JAMC-D-15-0217.1
Chen, W. N., Chiang, C. W., and Nee, J. B. (2002). Lidar ratio and depolarization ratio for cirrus clouds. Appl. Opt. 41, 6470–6476. doi: 10.1364/AO.41.006470
Dai, G., Wu, S., Song, X., and Liu, L. (2019). Optical and Geometrical properties of cirrus clouds over the tibetan plateau measured by LiDAR and radiosonde sounding during the summertime in 2014. Remote Sens. 11, 1–17. doi: 10.3390/rs11030302
DeMott, J. P., Prenni, A. J., Liu, X., Kreidenweis, S. M., Petters, M. D., Twohy, C. H., et al. (2010). Predicting global atmospheric ice nuclei distributions and their impacts on climate. PNAS 107, 11217–11222. doi: 10.1073/pnas.0910818107
Fahey, D. W., and Schumann, U. (1999). “Aviation-Produced Aerosols and Cloudiness,” in Intergovernmental Panel on Climate Change Special Report on Aviation and the Global Atmosphere, eds J. E. Penner, D. H. Lister, D. J. Griggs, D. J. Dokken, and M. McFarland (Cambridge: Cambridge University Press), 65–120.
Fernald, F. D. (1984). Analysis of atmospheric lidar observations: some comments. Appl. Opt. 23, 652–653. doi: 10.1364/AO.23.000652
Foth, A., Baars, H., Di Girolamo, P., and Pospichal, B. (2015). Water vapour profiles from Raman lidar automatically calibrated by microwave radiometer data during HOPE. Atmos. Chem. Phys. 15, 7753–7763. doi: 10.5194/acp-15-7753-2015
Fu, Q., and Liou, K. N. (1993). Parameterization of the radiative properties of cirrus clouds. J. Atmos. Sci. 50, 2008–2025. doi: 10.1175/1520-0469(1993)050<2008:potrpo>2.0.co;2
Heymsfield, J., and McFarquehar, G. M. (1996). High albedos of cirrus in the tropical pacific warm pool: microphysical interpretations from CEPEX and from Kwajalein. Marshall Islands. J. Atmos. Sci. 53, 2424–2451. doi: 10.1175/1520-0469(1996)053<2424:haocit>2.0.co;2
Klett, J. D. (1981). Stable analytical inversion solution for processing lidar returns. App. Opt. 20, 211–220. doi: 10.1364/AO.20.000211
Klett, J. D. (1985). Lidar inversion with variable backscatter/extinction ratios. App. Opt. 24, 1638–1643. doi: 10.1364/AO.25.000833
Krishnakumar, V., Satyanarayana, M., Radhakrishnan, S. R., Dhaman, R. K., Jayeshlal, G. S., Motty, G. N. S., et al. (2014). Lidar investigations on the optical and dynamical properties of cirrus clouds in the upper troposphere and lower stratosphere regions at a tropical station. Gadanki, India (13.5°N, 79.2°E). J. Appl. Remote Sens. 8, 1–22. doi: 10.1117/1.JRS.8.083659
Liou, K. N. (1986). Influence of cirrus clouds on weather and climate processes: a global perspective. Mon. Weather Rev. 114, 1167–1199. doi: 10.1175/1520-0493(1986)114<1167:ioccow>2.0.co;2
Lolli, S., Campbell, J. R., Lewis, J. R., Gu, Y., Marquis, J. W., Chew, B. N., et al. (2017). Daytime top-of-the-atmosphere cirrus cloud radiative forcing properties at Singapore. J. Appl. Meteorol. Climatol. 56, 1249–1257. doi: 10.1175/jamc-d-16-0262.1
Lolli, S., Delaval, A., Loth, C., Garnier, A., and Flamant, P. H. (2013). 0.355-micrometer direct detection wind lidar under testing during a field campaign in consideration of ESA’s ADM-Aeolus mission. Atmos. Meas. Tech. 6, 3349–3358. doi: 10.5194/amt-6-3349-2013
Lolli, S., Khor, W. Y., Matjafri, M. Z., and Lim, H. S. (2019). Monsoon season quantitative assessment of biomass burning clear-sky aerosol radiative effect at surface by ground-based lidar observations in pulau pinang. Malaysia in 2014. Remote Sens. 11, 1–14. doi: 10.3390/rs11222660
Lolli, S., Vivone, G., Lewis, J. R., Sicard, M., Welton, E. J., Campbell, J. R., et al. (2020). Overview of the New Version 3 NASA micro-pulse lidar network (MPLNET) automatic precipitation detection algorithm. Remote Sens. 12, 1–16. doi: 10.3390/rs12010071
Lynch D. K., Sassen K., Starr D., and Stephens G. (eds.) (2002). Cirrus. New York, NY: Oxford University Press, 499.
Manoj Kumar, N., Venkatramanan, K., and Vellaisamy, A. L. R. (2019). A statistical method for determining optical and geometrical characteristics of cirrus clouds. Climate 7:72. doi: 10.3390/cli7050072
Mc Farquhar, G. M., Heymsfield, A. J., Spinhirne, J. D., and Hart, B. (2000). Thin and sub visual tropopause tropical cirrus: observations and radiative impacts. J. Atmos. Sci. 57, 1841–1853. doi: 10.1175/1520-0469(2000)057<1841:tasttc>2.0.co;2
Motty, S., Satyanarayana, M., Jayeshlal, G. S., Krishnakumar, V., and Mahadevan Pillai, V. P. (2015). Optical properties of cirrus clouds in the tropical tropopause region during two contrasting seasons. Niscair 44, 155–166.
Nazaryan, H., McCormick, M. P., and Menzel, W. P. (2008). Global characterization of cirrus clouds using CALIPSO data. J. Geophys. Res. 113, 1–11. doi: 10.1029/2007JD009481
Noel, V., Chepfer, H., Ledanois, G., Delaval, A., and Flamant, P. H. (2002). Classification of particle effective shape ratios in cirrus clouds based on the lidar depolarization ratio. Appl. Opt. 41, 4245–4257. doi: 10.1364/ao.41.004245
Pandit, A. K., Gadhavi, H. S., Venkat Ratnam, M., Raghunath, K., Rao, S. V. B., and Jayaraman, A. (2015). Long-term trend analysis and climatology of tropical cirrus clouds using 16 years of lidar data set over Southern India. Atmos. Chem. Phys. 15, 13833–13848. doi: 10.5194/acp-15-13833-2015
Radhakrishnan, S. R., Satyanarayana, M., Krishnakumar, V., Mahadevan Pillai, V. P., Raghunath, K., Venkata Ratnam, M., et al. (2010). Optical properties of cirrus clouds at a tropical Indian station Gadanki. Tirupati (13.5°N, 79.2°E). J. Appl. Remote Sens. 4, 1–17. doi: 10.1117/1.3525238
Ramanathan, V., and Collins, W. (1991). Thermodynamic regulating of ocean warming by cirrus clouds deduced from observations of the 1987 El Niño. Nature 351, 27–32. doi: 10.1038/351027a0
Sandhya, M., Sridharan, S., Indira Devi, M., Niranjan, K., and Jayaraman, A. (2015). A case study of formation and maintenance of a lower stratospheric cirrus cloud over the tropics. Ann. Geophys. 33, 599–608. doi: 10.5194/angeo-33-599-2015
Sassen, K., Barnett, M., Wang, Z., and Mace, G. G. (2001). Cloud and aerosol research capabilities at FARS: the facility for atmospheric remote sensing. Bull. Amer. Meteor. Soc. 82, 1119–1138. doi: 10.1175/1520-0477(2001)082<1119:caarca>2.3.co;2
Sassen, K., and Campbell, J. R. (2001). A midlatitude cirrus cloud climatology from the facility for atmospheric remote sensing, part I: macrophysical and synoptic properties. J. Atmos. Sci. 58, 481–496. doi: 10.1175/1520-0469(2001)058<0481:amcccf>2.0.co;2
Sassen, K., and Cho, B. S. (1992). Subvisual-thin cirrus lidar dataset for satellite verification and climatological research. J. Appl. Meteor. 31, 1275–1285. doi: 10.1175/1520-0450(1992)031<1275:stcldf>2.0.co;2
Sassen, K., and Dodd, G. C. (1988). Homogeneous nucleation rate for highly super cooled cirrus cloud droplets. J. Atmos. Sci. 45, 1357–1369. doi: 10.1175/1520-0469(1988)045<1357:hnrfhs>2.0.co;2
Sassen, K., Wang, Z., and Liu, D. (2008). Global distribution of cirrus clouds from Cloudsat/Cloud-Aerosol Lidar and Infrared Pathfinder Satellite Observations (CALIPSO) measurements. J. Geophys. Res. 113, 1–12. doi: 10.1029/2008JD009972
Sassen, K., Wang, Z., and Liu, D. (2009). Cirrus clouds and deep convection in the tropics: insights from CALIPSO and CloudSat. J. Geophys. Res. Atmos. 114, 1–11. doi: 10.1029/2009JD011916
Satyanarayana, M., Radhakrishnan, S. R., Mahadevan Pillai, V. P., Veerabhuthiran, S., Raghunath, K., Presennakumar, B., et al. (2010). Laser radar characterization of atmospheric aerosols in the troposphere and stratosphere using range dependent lidar ratio. J. Appl. Remote Sens. 4, 1–20. doi: 10.1117/1.3306573
Stephens, G. L., Wood, N. B., and Gabriel, P. M. (2004). An assessment of the parameterization of subgrid-scale cloud effects on radiative transfer. part i: vertical overlap. J. Atmospheric Sci. 61, 715–732. doi: 10.1175/1520-0469(2004)061<0715:aaotpo>2.0.co;2
Keywords: altitude, cirrus clouds, depolarization, lidar, optical depth
Citation: Manoj Kumar N and Venkatramanan K (2020) Lidar Observed Optical Properties of Tropical Cirrus Clouds Over Gadanki Region. Front. Earth Sci. 8:140. doi: 10.3389/feart.2020.00140
Received: 12 January 2020; Accepted: 16 April 2020;
Published: 13 May 2020.
Edited by:
Xander Wang, University of Prince Edward Island, CanadaReviewed by:
Simone Lolli, Institute of Methodologies for Environmental Analysis (CNR), ItalyBijoy Vengasseril Thampi, Science Systems and Applications, Inc., United States
Copyright © 2020 Manoj Kumar and Venkatramanan. This is an open-access article distributed under the terms of the Creative Commons Attribution License (CC BY). The use, distribution or reproduction in other forums is permitted, provided the original author(s) and the copyright owner(s) are credited and that the original publication in this journal is cited, in accordance with accepted academic practice. No use, distribution or reproduction is permitted which does not comply with these terms.
*Correspondence: Nellore Manoj Kumar, bmVsbG9yZW1rQGdtYWlsLmNvbQ==