 Shaunna M. Morrison1*
 Joy Buongiorno1
 Robert T. Downs2
 Ahmed Eleish3
 Peter Fox3
 Donato Giovannelli4,5,6,7*Joshua J. Golden2
 Daniel R. Hummer8Grethe Hystad9
 Louise H. Kellogg10Oliver Kreylos10
 Sergey V. Krivovichev11Chao Liu1
 Andrew Merdith12
 Anirudh Prabhu3Jolyon Ralph13Simone E. Runyon14
 Sabin Zahirovic12Robert M. Hazen1
- 1Earth and Planets Laboratory, Carnegie Institution for Science, Washington, DC, United States
- 2Department of Geosciences, The University of Arizona, Tucson, AZ, United States
- 3Department of Earth and Environmental Sciences, Tetherless World Constellation, Rensselaer Polytechnic Institute, Troy, NY, United States
- 4Department of Biology, University of Naples Federico II, Naples, Italy
- 5Institute for Biological Resources and Marine Biotechnology, National Research Council of Italy, Ancona, Italy
- 6Department of Marine and Coastal Sciences, Rutgers The State University of New Jersey, New Brunswick, NJ, United States
- 7Earth-Life Science Institute, Tokyo Institute of Technology, Tokyo, Japan
- 8School of Earth Systems and Sustainability, Southern Illinois University, Carbondale, IL, United States
- 9Department of Mathematics, Statistics and Computer Science, Purdue University Northwest, Hammond, IN, United States
- 10Department of Earth and Planetary Sciences, University of California, Davis, Davis, CA, United States
- 11Kola Science Centre of the Russian Academy of Sciences, Apatity, Russia
- 12EarthByte Group, School of Geosciences, The University of Sydney, Sydney, NSW, Australia
- 13Mindat.org, Mitcham, United Kingdom
- 14Department of Geology and Geophysics, University of Wyoming, Laramie, WY, United States
Large and growing data resources on the spatial and temporal diversity and distribution of the more than 400 carbon-bearing mineral species reveal patterns of mineral evolution and ecology. Recent advances in analytical and visualization techniques leverage these data and are propelling mineralogy from a largely descriptive field into one of prediction within complex, integrated, multidimensional systems. These discoveries include: (1) systematic changes in the character of carbon minerals and their networks of coexisting species through deep time; (2) improved statistical predictions of the number and types of carbon minerals that occur on Earth but are yet to be discovered and described; and (3) a range of proposed and ongoing studies related to the quantification of network structures and trends, relation of mineral “natural kinds” to their genetic environments, prediction of the location of mineral species across the globe, examination of the tectonic drivers of mineralization through deep time, quantification of preservational and sampling bias in the mineralogical record, and characterization of feedback relationships between minerals and geochemical environments with microbial populations. These aspects of Earth’s carbon mineralogy underscore the complex co-evolution of the geosphere and biosphere and highlight the possibility for scientific discovery in Earth and planetary systems.
Introduction
Minerals, including carbon-bearing phases, are the oldest available materials from the ancient history of our planet and other bodies in our solar system – they record information about their genetic environments and any subsequent weathering and alteration they underwent, offering a glimpse of ancient environments through deep time. In this work, we describe some of the important carbon mineral data resources, outline a number of new advances in data-driven discovery in carbon and other mineral systems, including new insights from mineral network visualizations and statistical modeling. We also preview upcoming studies and directions of research related to the diversity and distribution of mineral species, statistical modeling of complex, multidimensional data objects and their underlying trends, tectonic drivers of mineralization, characterization of relationships between microbial populations, their expressed protein functions and the geochemical environment, quantification of preservational and sampling bias present in the mineralogical record, and a number of predictive algorithms including those which predict formational environments of minerals as well as the location of previously unknown mineral localities.
Carbon minerals are particularly compelling for multi-dimensional analysis due to their diverse range of bonding behaviors, paragenetic modes, mineral properties, and ages. Carbon minerals are some of the first condensed phases formed in a solar system and among the hardest materials known, yet carbon minerals are also some of the latest occurring and most ephemeral crystalline phases. Carbon has the ability to behave as a cation, anion, or neutral atom, allowing bonding with itself and 80+ other elements, with a variety of bonding coordination numbers including 2, 3, and 4, and valance states of −4, +2, and +4 (Hazen et al., 2013a). Many of the first crystals formed in our cooling solar system were refractory carbon-bearing phases, including diamond (C) (Lewis et al., 1987), graphite (C) (Amari et al., 1990), and moissanite (SiC) (Zinner et al., 1987). Carbon and its mineral phases are intrinsically linked to organic and biological processes – biomineralization is responsible for a significant portion of rhombohedral carbonates on Earth’s surface and organic minerals make up nearly 15% of the 411 known carbon mineral species (as of June 2019; rruff.info/ima). Carbon’s widely varying character offers a fascinating opportunity to employ rapidly developing advanced analytics and visualization techniques to characterize its complex, multivariate systems and answer previously inaccessible questions at the interface of Earth, planetary, and life sciences.
Mineral Data Resources
The International Mineralogical Association List of Mineral Species
The International Mineralogical Association (IMA) list of mineral species (RRUFF.info/IMA) is part of the RRUFF Project (Lafuente et al., 2015) – a mineral library and series of databases with the goal of providing robust, diverse mineralogical data, including high-quality chemical, spectral, and diffraction data, the IMA list of approved mineral species, the American Mineralogist Crystal Structure Database (AMCSD; RRUFF.geo.arizona.edu/AMS/amcsd.php), mineral locality age information (see “Mineral Evolution Database” section below), and other mineral properties (see “Mineral Properties Database” section below). The IMA list allows users to search the over 5400 (as of June 2019) mineral species by name, chemical composition, unit-cell parameters and crystallography, crystal structure group, paragenetic mode, and the availability of ancillary data including crystal structure files in the AMCSD or direct RRUFF Project analyses. This database also provides useful information about each mineral species, including composition, oldest known age, crystal structure group, and unit-cell parameters along with corresponding compositions, all of which can be downloaded in a number of machine-readable file formats. Lastly, this page offers links to a number of related informational pages and websites, including the Handbook of Mineralogy (Anthony et al., 2003), measured data in RRUFF Project databases, crystal structure files in the AMCSD, mineral locality information at Mindat.org (see “Mindat.org” section below), and age and locality data in the Mineral Evolution Database (MED).
The Mineral Evolution Database (MED)
The Mineral Evolution Database (MED; RRUFF.info/Evolution; Golden et al., 2016; Prabhu et al., 2020) was created to support mineral evolution and ecology studies – studies that examine and characterize spatial and temporal mineral diversity and distribution in relation to geologic, biologic, and planetary processes Hazen et al., 2008, 2011, 2013c, 2013b, 2014, 2015a, 2015b, 2016, 2017a, 2017b, 2019b; Hazen and Ferry, 2010; McMillan et al., 2010; Golden et al., 2013; Hazen, 2013, 2018, 2019; Grew and Hazen, 2014; Zalasiewicz et al., 2014; Grew et al., 2015; Hystad et al., 2015b, a, 2019a; Liu et al., 2017a, b, 2018b; Ma et al., 2017; Morrison et al., 2017b; Glikson and Pirajno, 2018). The MED contains mineral locality and age information extracted from primary literature and the mineral-locality database, Mindat.org. As of 14 June 2019, 15,906 unique ages for 6,253 directly dated mineral localities, documenting 810,907 mineral-locality pairs and 194,090 mineral-locality-age triples are available in the MED. Specific to the known 411 carbon-bearing phases, there are 8,635 dated carbon mineral localities, 94,677 carbon mineral-locality pairs, and 20,773 dated carbon mineral-locality pairs available in the MED, as of June 2019. These data have been assembled and documented to maximize the accuracy and transparency of age associations, which include data on specific mineral formations, mineralization events, element concentrations, and/or deposit formations. The MED interface allows many sorting and displaying options, including sorting by age or locality name, as well as displaying all of the queried minerals at a given locality or displaying a line of data for each mineral-locality pair. These data are available for download directly from the MED (RRUFF.info/Evolution) with various file format options.
The Mineral Properties Database (MPD)
The Mineral Properties Database (MPD; Morrison et al., 2017b; Prabhu et al., 2019a) was created with the goal of better understanding the multidimensional, multivariate trends amongst mineral species and their relationships to geologic materials, preservational and sampling biases, and geologic, biologic, and planetary processes. At present, this database contains dozens of parameters, including age, color, redox state, structural complexity (Krivovichev, 2012, 2013, 2016, 2018; Hazen et al., 2013b; Grew et al., 2016; Krivovichev et al., 2017, 2018) and method of discovery associated with copper, uranium, and carbon minerals. Ongoing efforts are in place to expand to minerals of each element of the periodic table. These data, coupled with those of the MED, offer the opportunity to study changes in redox conditions through deep time and are the basis for mineral network analysis studies (Morrison et al., 2017b; Perry et al., 2018; Hazen, 2019; Hazen et al., 2019b). This database will be publicly available through the RRUFF Project on the Open Data Repository platform (ODR; opendatarepository.org). The ODR interface will maximize the flexibility with which users view, explore, subset, and download data of interest.
Mindat.org
Hudson Institute of Mineralogy’s Mindat.org is an interactive mineral occurrence database with a wealth of information on mineral localities around the globe, as well as Apollo Lunar samples and meteorites. At present, mindat houses nearly 300,000 mineral localities, with >1.2 million mineral-locality pairs and nearly one million mineral photographs. A large majority of the mineral occurrence information available on Mindat.org is from published literature, but users can also add localities, mineral-locality pairs, photographs, and references. The MED directly interfaces with mindat, harnessing and incorporating the huge amount of mineral locality data held in mindat. It has been an important resource for scientific research and discovery – many studies on the diversity and distribution of minerals on Earth’s surface have relied in part on mindat mineral locality information Hazen et al., 2008, 2011, 2013c, 2013b, 2014, 2015a, 2015b, 2016, 2017a, 2017b, 2019b; Hazen and Ferry, 2010; McMillan et al., 2010; Golden et al., 2013; Hazen, 2013, 2018, 2019; Grew and Hazen, 2014; Grew et al., 2015; Hystad et al., 2015a, b, 2019a; Liu et al., 2017a, b, 2018b; Ma et al., 2017; Morrison et al., 2017b). These studies include those of Carbon Mineral Ecology detailed below.
Global Earth Mineral Inventory (GEMI)
The Global Earth Mineral Inventory (GEMI1) is a Deep Carbon Observatory (DCO) data legacy project born out of the diverse data types collected in conjunction with the DCO’s broad range of scientific driving questions (Prabhu et al., 2019a, 2020). Specifically, Prabhu et al. (2019a, 2020) aimed to support and facilitate scientific discovery by merging and integrating DCO data products, such as the MPD and MED, into a digestible, accessible, and user-friendly format for exploration, statistical analysis, and visualization. Therefore, GEMI is a faceted, searchable knowledge graph or network in which each node represents a feature of the MED and MPD – allowing users to explore, query, and extract the specific subset of data or combinations of data necessary for their research goal.
Carbon Mineral Ecology
Statistical approaches are particularly useful in characterizing surface and near-surface environments where biology and reaction kinetics play a major role in mineral formation and stability, as opposed to the dominance of thermodynamics in the subsurface. Mineral ecological studies employ the MED and Mindat.org to examine and characterize the spatial diversity and distribution of mineral species on planetary bodies (Hazen et al., 2015b, a, 2016, 2017b; Hystad et al., 2015a, b; Grew et al., 2017; Liu et al., 2017a, 2018a). “Mineral species” in this case are those recognized by the IMA Commission on New Minerals, Nomenclature and Classification (CNMNC), which often does not account for subtle variations in chemistry or formational processes (see section “Natural Kind Clustering”). Previous studies have found that minerals on Earth’s surface follow a distinct trend, a “Large Number of Rare Events” (LNRE) frequency distribution in which most mineral species are rare, occurring at fewer than five geologic localities, and only a few species are very common (Hazen et al., 2015b; Hystad et al., 2015a, b).
The discovery of an LNRE frequency distribution across all mineral systems on Earth enabled the modeling of accumulation curves and, thereby, the prediction of the number of missing or previously unknown mineral species that occur on Earth but have yet to be discovered. Carbon minerals are no exception to the LNRE trend and Hazen et al. (2016) explored their ecology – discovering that in addition to the 400 known carbon mineral species, there were likely at least 145 more species awaiting discovery. Hazen et al. (2016) delved into the likely candidates of missing species, generating accumulation curves for carbon minerals with and without oxygen, hydrogen, calcium, and sodium. They predicted that, of the 145 as-yet undiscovered carbon minerals, 129 would contain oxygen, 118 would contain hydrogen, 52 would contain calcium, and 63 would contain sodium. This study led to the Carbon Mineral Challenge (mineralchallenge.net) – a DCO initiative to engage scientists and collectors in finding and identifying the missing carbon phases. As of June 2019, the Carbon Mineral Challenge boasts 30 new mineral species approved by IMA, a number of which were predicted in Hazen et al. (2016).
At the time of the initial mineral ecology studies, it was understood that the models and the predictions based upon them were to be treated as lower limits of the estimate of missing mineral species. This is due, in part, to sampling bias toward well-crystallized, colorful, or economically valuable specimens. An additional constraint is the advent of new, unforeseen technology that can identify and distinguish minerals at increasingly finer scales. While it is difficult to predict the next technological advance, we can attempt to develop better models to make predictions on our existing data. With this in mind, Hystad et al. (2019a) developed a new Bayesian technique for modeling mineral frequency distribution and predicting the number of undiscovered mineral species on Earth’s surface. Hystad et al. (2019a) updated the prediction of the number of missing mineral species on Earth from the previous minimum estimate of 6394 (Hystad et al., 2015a, b) to an increased estimate of 9308 with 95% posterior interval (8650, 10,070). Note that this new, higher value is still a low estimate due to the unknowns of future technology.
Here, we apply the Poisson lognormal model of Hystad et al. (2019a) to the currently known 411 carbon mineral species and their 50,095 localities (with 94,677 mineral-locality pairs, 22% of which have associated ages, as of June 2019). Figure 1A illustrates the carbon mineral frequency distribution with a Poisson lognormal LNRE model overlaid in blue. The frequency distribution is used to generate an accumulation curve (Figure 1B), which models the expected number of carbon minerals species as a function of the number of localities characterized, and therefore predict the expected number of carbon mineral species currently present on Earth’s surface, many of which remain undiscovered. The new estimate of carbon mineral diversity on Earth is 993 with a 95% posterior interval of (759, 1268), up from the former prediction of 548 carbon mineral species (Hazen et al., 2016). Note again that, as with the above, this prediction should be considered a lower estimate given the unknowns associated with future technological advances and their impacts on mineral discovery.
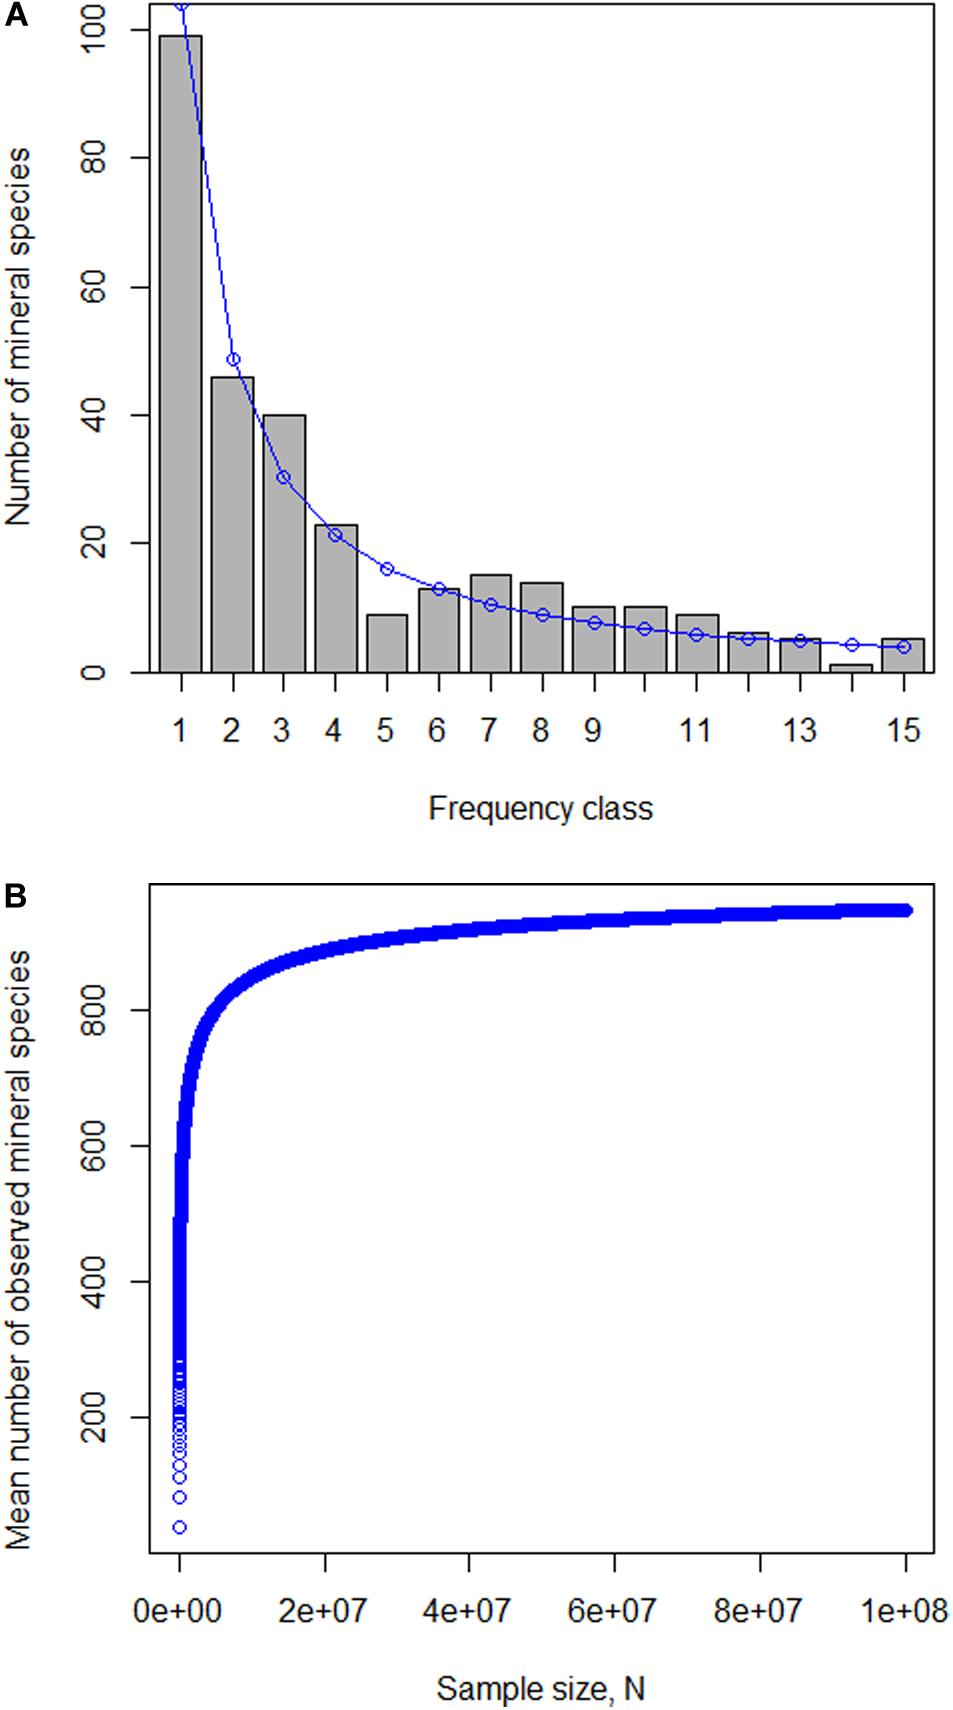
Figure 1. (A,B) Carbon mineral frequency distribution and corresponding accumulation curve. (A) The frequency distribution of carbon minerals on Earth’s surface. The x-axis, “frequency class,” is the number of minerals that occur at a locality. The y-axis is the number of mineral species that occur at exactly the corresponding frequency class (i.e., nearly 100 carbon mineral species occur at exactly one locality). The blue line represents the Poisson lognormal LNRE model. (B) Accumulation curve for the mean number of carbon mineral species versus the number of localities sampled, N, based on the Poisson lognormal LNRE model. Today, there are 411 known carbon mineral species based on N = 92,466 sampled localities. As N approaches infinity, the median number of predicted carbon mineral species is 993 with a 95% posterior interval of (759, 1268).
Carbon Mineral Network Analysis and Visualization
Network Analysis
Network analysis, a subfield of graph theory (Otte and Rousseau, 2002; Clauset et al., 2004; Newman, 2006; Kolaczyk, 2009a; Abraham et al., 2010; Newman and Mark, 2010), is particularly useful for visualizing many variables in a multidimensional system in a digestible and meaningful way, particularly when the questions rely on the interrelationships of many entities and their properties, as is the case in mineralogical systems in the context of Earth and planetary processes. Networks are composed of nodes (or vertices) representing entities and edges (or links) between the nodes symbolizing a relationship between two connected nodes. Nodes can be sized, shaped, colored, etc. according to any variables of interest. Likewise, edges can be directed, colored, texturized, or their thickness can be adjusted to represent any parameter of choice and the length of edges can be scaled in proportion to the strength of the connecting variable. With all of these options, it is possible to display upward of eight variables within one network. Network renderings are projections from N-1 dimensional space (where N is the number of different mineral species) into two or three dimensions, although the multidimensionality is preserved in the original data object and therefore in any statistical metrics derived from the network data. Network metrics fall into two categories, the first of which are “local” metrics that describe the role and significance of individual nodes in a network. Local metrics include degree, which is the number of links connected to a given node, and betweenness, a measure of the number of geodesic (shortest) paths that pass through a given node. The second type of metrics are “global” and are used to evaluate overall trends within a network and allow for comparison of different networks, such as networks of minerals of different elements, from different environments or planetary bodies, or a series of networks over a time interval. Global metrics include density, which is the number of links divided by the number of possible links (i.e., a measure of the interconnectedness of a network), and centralization, a measure of how central a network’s “most central” node is relative to how central all the other nodes are (i.e., indicating whether or not there are many highly interconnected nodes or if there are a few key “broker” nodes). Additionally, there are a number of network modularity and community detection algorithms, which allows users to determine if there are distinct groups within their network and what nodes belong to those groups. With further exploration, users can determine what characteristics are shared within each group and/or between groups. Furthermore, random forest or decision tree algorithms can offer insight into the relative importance or weight of each characteristic to the network partitioning.
Mineral Network Analysis
Mineral network analysis, which is a powerful approach to exploring complex multidimensional and multivariate systems, facilitates a holistic, integrated, higher-dimensional understanding of Earth and planetary systems (Morrison et al., 2017b; Hazen et al., 2019a, b). The renderings of Fruchterman-Reingold force-directed (Fruchterman and Reingold, 1991; Csardi and Nepusz, 2006) mineral coexistence networks herein are of two types: unipartite and bipartite. Interactive, manipulatable versions of these networks, including node labels, can be found at https://dtdi.carnegiescience.edu/node/4557.
Unipartite Mineral Networks
In the unipartite networks (Figures 2–4), each node represents a mineral species; the nodes are sized according to the frequency of occurrence of each species and colored according to chemistry, paragenetic mode, or structural complexity; the edges represent co-occurrence (which may or may not correspond to an equilibrium assemblage) of two mineral species at a locality on Earth’s surface and their length is scaled inversely proportional to their frequency of co-occurrence (i.e., when two species occur together more frequently, they are closer together in the graph). Note that while the nodes of Figures 2–4 are colored according to various parameters (e.g., composition, paragenetic mode), those parameters were not coded into the network layout – meaning that the network topology and any trends are strictly a function of mineral co-occurrence. A number of interesting trends can be observed in the topologies of unipartite mineral co-occurrence networks. Firstly, the copper (Cu) networks show a high density and low centralization; in the Cu network colored by chemistry (Figure 2A), there is strong chemical segregation in which sulfides (red nodes) cluster together, as do sulfates (yellow nodes), and Cu mineral containing oxygen and no sulfur (blue nodes) (Morrison et al., 2017b; Hazen et al., 2019a, b). This chemical segregation results in chemical trend lines throughout the graph, including sulfur fugacity, fS2, increasing from bottom (oxides) of the graph to top (through sulfates and into sulfides) and oxygen fugacity, fO2, increasing from the top left (sulfides) to the bottom (sulfates and oxides). For any variable that exhibits an embedded trendline, that trend can be used to predict the value of said variable for any node in which the value is unknown. In the case of chemical variables in mineral networks representing equilibrium assemblages, this could allow for the extraction of thermochemical parameters. Secondly, Figure 2B renders the Cu network with nodes colored by crystal structural complexity (Hazen et al., 2013b; Krivovichev, 2013, 2016, 2018; Krivovichev et al., 2017, 2018). Structural complexity is a mathematical measure for evaluating the symmetry and chemical complexity of a mineral’s crystal structure and IMA-approved ideal chemical formula, and converting that complexity into information, measured in bits. Krivovichev et al. (2018) hypothesize crystal structure complexity exhibited by minerals has increased through deep time, with the simplest structures existing at the earliest stages of mineral evolution and becoming increasingly complex moving into modern day. In this network, there is segregation resulting in a trendline from the simplest crystal structures to moderately complex structures. The most complex structures are few and scattered throughout the network, an unexpected trend that begs further investigation alongside whether or not age of first occurrence plays a role in the structural complexity trends observed in network Figure 2B. Thirdly, the chromium (Cr) network (Figure 3) has a very low density and high centralization, with the mineral phase chromite having the highest centrality (Morrison et al., 2017b; Hazen et al., 2019a, b). The most notable feature of the Cr co-occurrence network is its strong clustering by paragenetic mode, indicating that formational environment and mode is the strongest driver for Cr mineral co-occurrence. Lastly, Figure 4 illustrates the changes in carbon mineral co-occurrence through deep time. The earliest known carbon minerals are few and form a dense, highly interconnected network with low centralization. Through time into modern day, the density decreases slightly while the centralization becomes significantly more pronounced, forming two lobes of carbon mineral populations connected by a few key nodes of high centrality beginning as early as 799 Ma and becoming very distinct at 251 Ma, contemporaneous with the end-Permian mass extinction. These two lobes comprise different populations of carbon mineral chemistry, with the left lobe containing a much higher proportion of organic carbon minerals and hydrous phases containing transition elements, lanthanides, and/or actinides, and the right lobe having a higher frequency of anhydrous phases lacking transition elements, lanthanides, or actinides. This unexpected trend and its underlying geologic or biologic implications are the subject of further study.
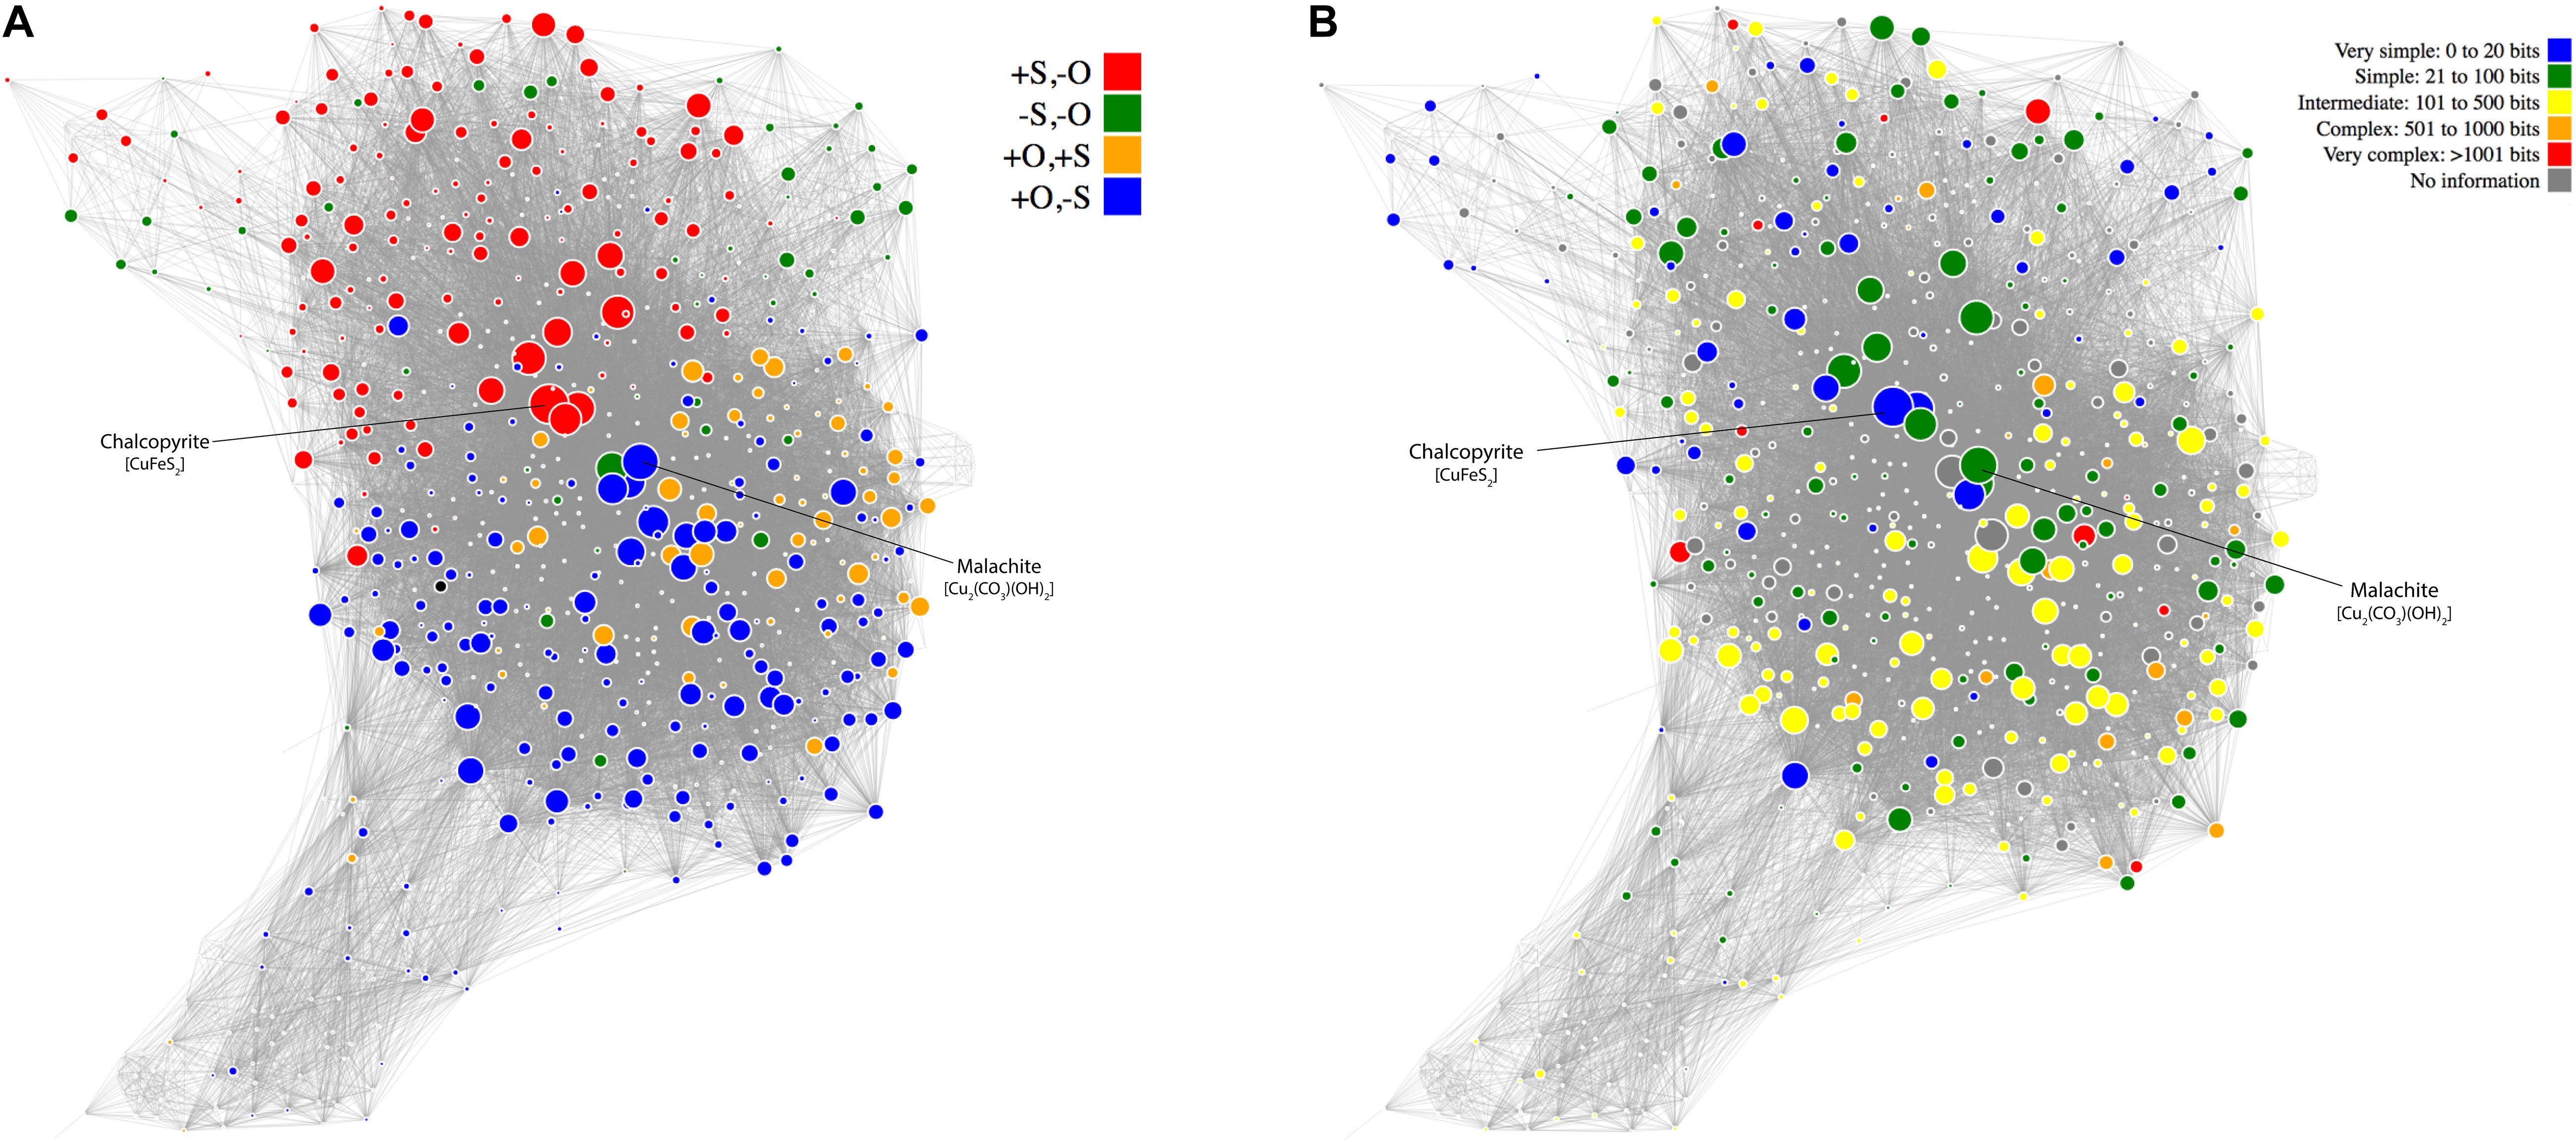
Figure 2. (A,B) Copper mineral networks. Force directed, unipartite, copper (Cu) mineral network renderings. Nodes represent Cu mineral species, sized according to their frequency of occurrence. Edges represent co-occurrence of mineral species at localities on Earth’s surface; edge length is scaled inversely proportional to frequency of co-occurrence. (A) Nodes are colored according to chemical composition, specifically the presence or absence of sulfur and oxygen. (B) Nodes are colored according to crystal structural complexity (i.e., the bits of information contained in each crystal structure; Krivovichev, 2013).
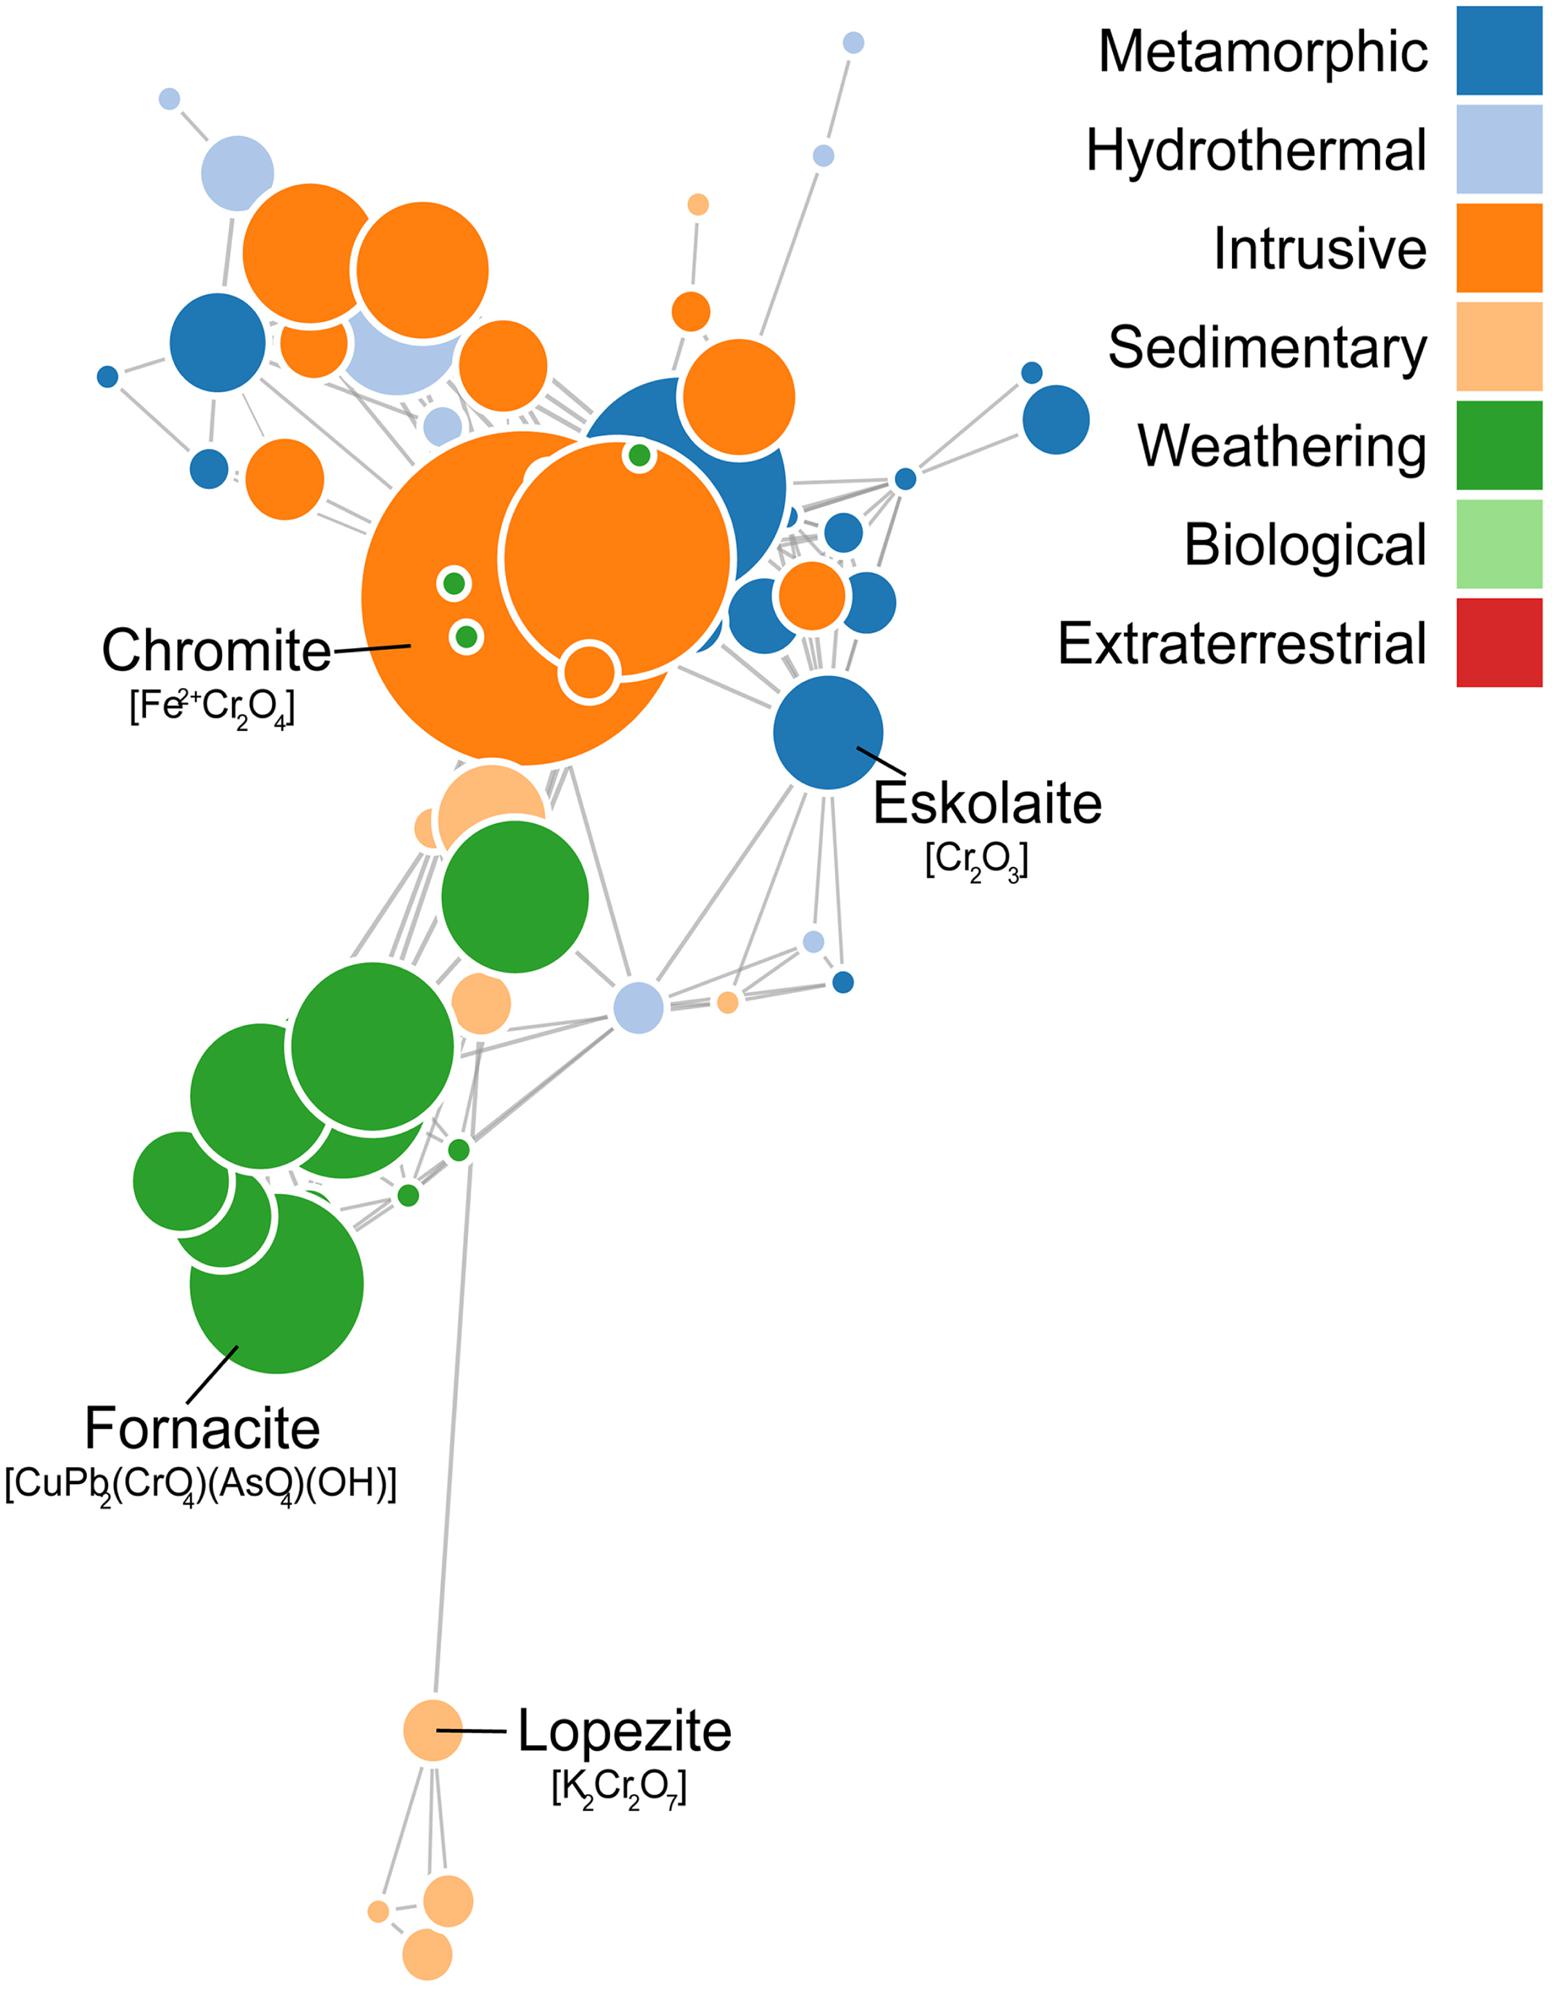
Figure 3. Unipartite chromium mineral network. Force directed, unipartite, chromium (Cr) mineral network rendering. Nodes represent Cr mineral species, sized according to their frequency of occurrence and colored according to their paragenetic mode. Edges represent co-occurrence of mineral species at localities on Earth’s surface; edge length is scaled inversely proportional to frequency of co-occurrence.
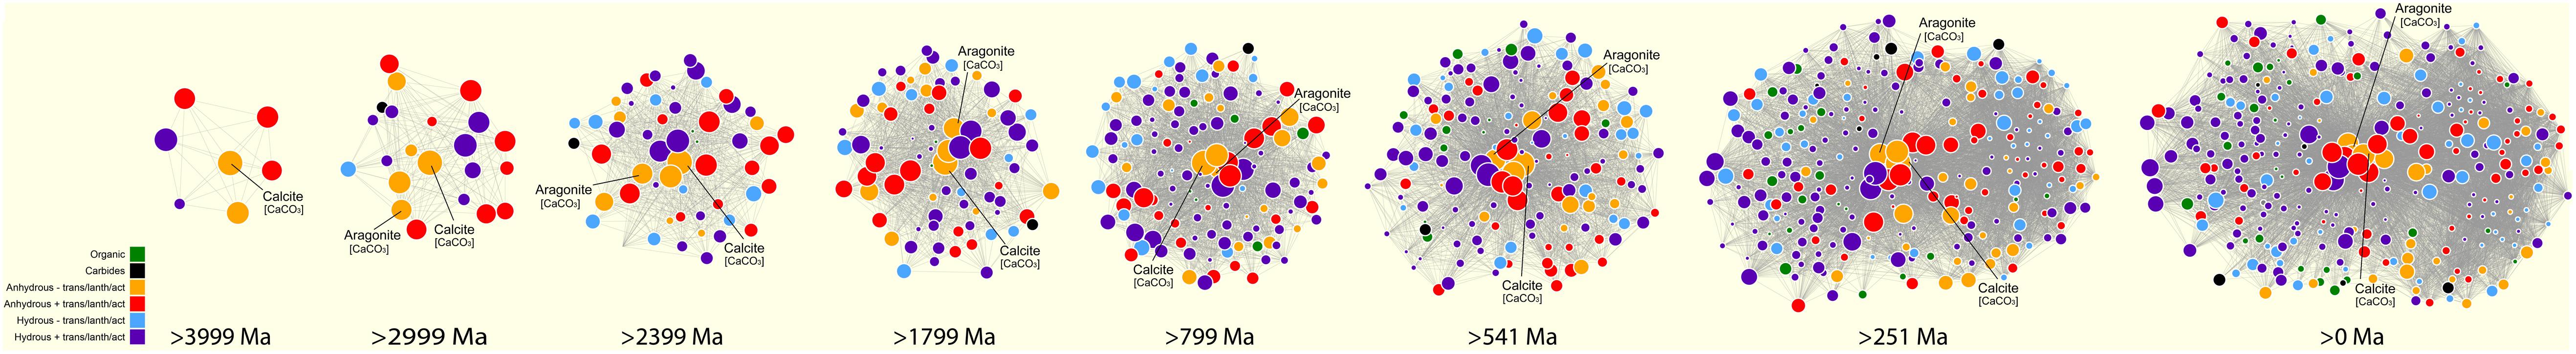
Figure 4. Evolving unipartite carbon mineral networks. Force directed, unipartite, carbon mineral network renderings. Nodes represent carbon mineral species, sized according to their frequency of occurrence and colored according to composition. Edges represent co-occurrence of mineral species at localities; edge length is scaled inversely proportional to frequency of co-occurrence. Each network represents a cumulative time bin in order to illustrate the changes in carbon mineralogy on Earth’s surface through deep time.
Bipartite Mineral Network
In the bipartite network rendering (Figure 5), the set of colored nodes represent carbon mineral species, sized by their frequency of occurrence and colored according to the age of the oldest known occurrence (Hazen, 2019; Hazen et al., 2019a). The other set of nodes in black represent the localities at which the carbon minerals occur, sized proportionally to their carbon mineral diversity (i.e., the number of mineral species found at a locality). The edges between nodes signifying that a mineral occurs at a locality. Mineral bipartite diagrams illustrate many relationships between carbon minerals and their locations on Earth’s surface. The first surprising feature of the network is the “U-shaped” (or “vase shaped” in 3D, see “Advanced Mineral Network Visualizations” section below) locality node distribution. This topology provides a striking visual representation of mineral ecology, specifically the LNRE frequency distribution in which there are a few very common species (such as calcite and aragonite), but most species are rare. In the network graph, the most common minerals fall at the bottom of the locality “U,” the frequency of occurrence quickly falls off moving up and out of the locality “U,” ultimately radiating outward and around the locality nodes where the majority of carbon minerals lie, most of which have small radii (i.e., they occur at very few localities). Another related feature clearly visible in the rendering is that rare mineral species tend to occur at localities rich in other rare species, as opposed to localities dominated by the more common species. This is visible at the individual node level, but also in the overall topology of the network: the mineral diversity of the localities, and therefore the size of the locality nodes, decreases from top to the bottom, as the network trends from more rare mineral species into more common mineral species. This trend gives researchers exploration targets to look for new, rare mineral species: at localities already known to host other rare mineral species. This qualitative observation can be parlayed into a quantitative method, specifically affinity analysis (see “Affinity Analysis” in the future directions section below) for predicting new locations of existing mineral species, predicting which minerals are likely to occur but have not been reported at a given locality, and possibly make predictions on the most likely locations for finding new mineral species. Additionally, an embedded timeline can be observed in the carbon mineral-locality network topology. The nodes of Figure 5 are colored according to the age of first occurrence; however, their ages were not coded into the network layout – meaning that the network topology is strictly a function of mineral-locality occurrence. Despite the lack of age information encoded in the topological layout, the oldest known minerals occur at the bottom of the locality “U” and radiate up and outward as the minerals become younger, with the youngest minerals skirting around the outside of the locality “U”. Observing trendlines in any network system can lead to predicting missing values, but age, in particular, offers the opportunity to pin other parameters, such as chemistry, structural complexity, bioavailability, etc. to a timeline and therefore relate these parameters to geologic, biologic, or planetary events throughout deep time.
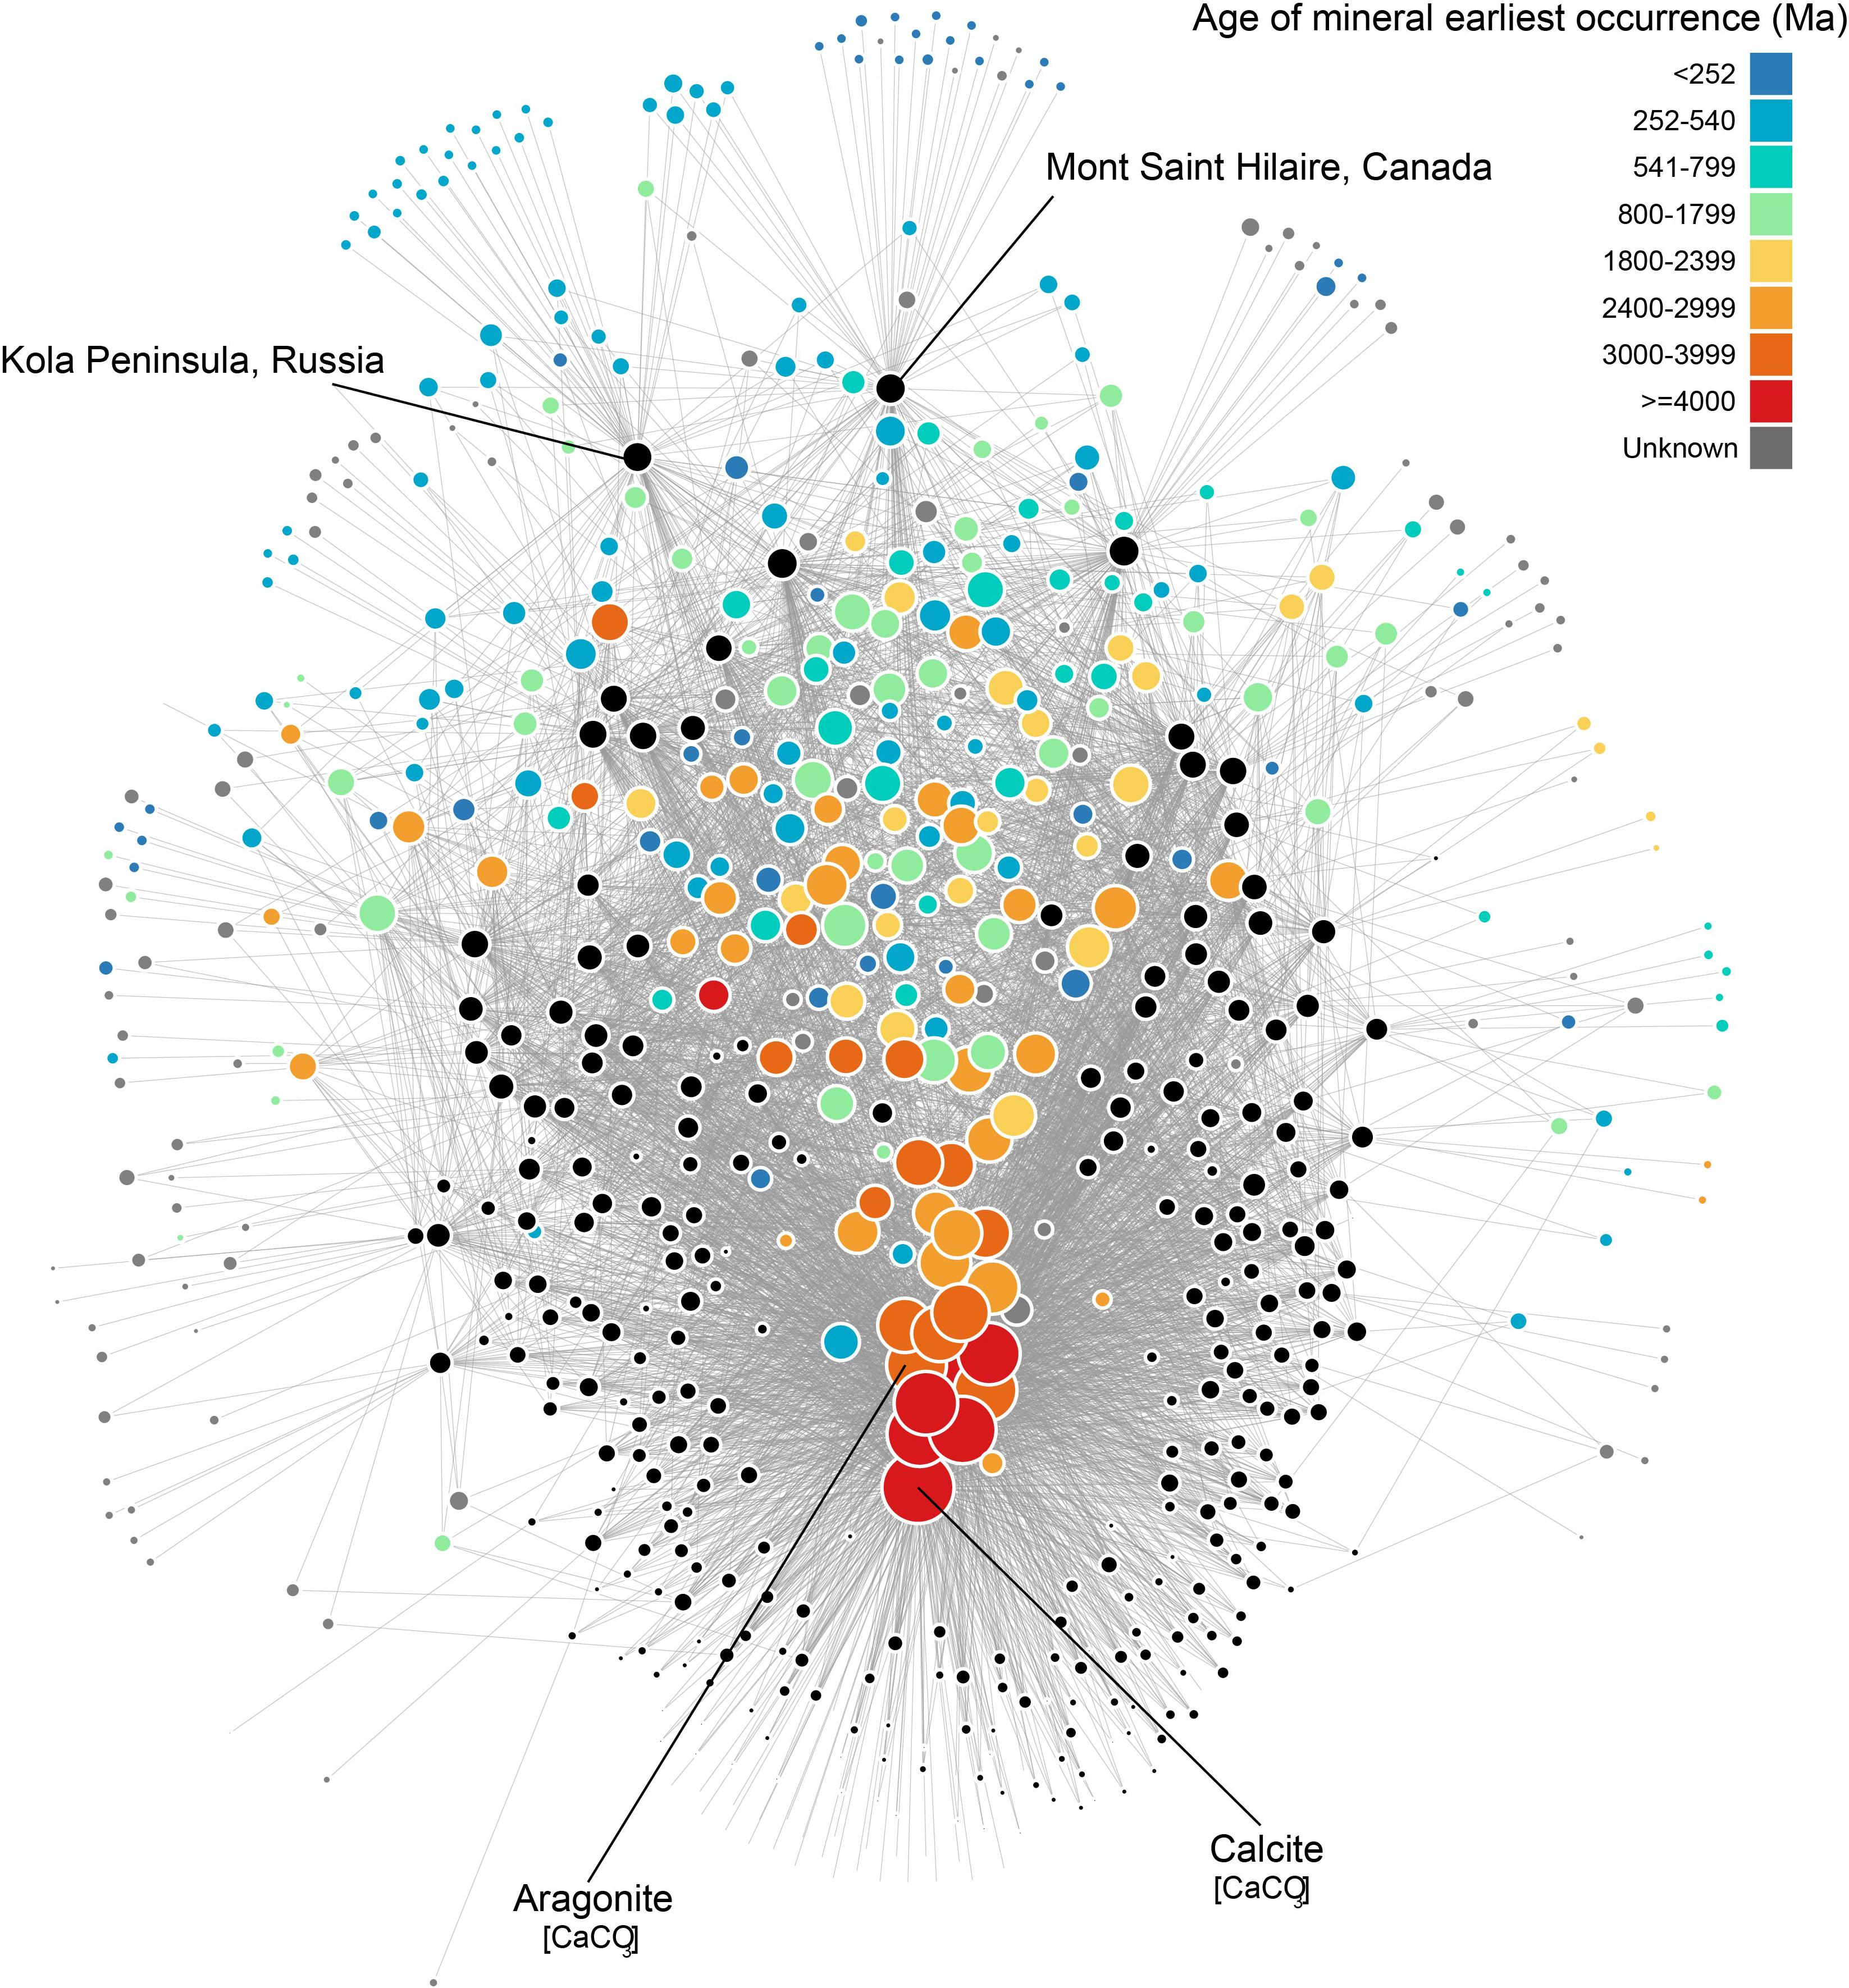
Figure 5. Bipartite carbon mineral-locality network. Force directed, bipartite, carbon mineral-locality network rendering. Colored nodes represent carbon mineral species, sized according to their frequency of occurrence and colored according to age of first occurrence. Black nodes represent carbon mineral localities on Earth and are sized according to mineral diversity (i.e., the number of mineral species found at a locality). Edges represent the occurrence of a mineral species at a locality.
Advanced Mineral Network Visualizations
Network renderings are projections from multidimensional space into two dimensions and, inherently, some information is lost. Therefore, it is important to explore variations in visualization techniques that will allow the user to maximize the accuracy and amount of information rendered. With this in mind, we are developing 3D networks and also exploring virtual reality (VR) techniques for visualization and network manipulation. VR offers two primary benefits for visual analytics: (1) the ability to employ true 3D layouts that are not projected to 2D displays and offer additional insight especially for very dense networks, and (2) direct natural interaction, and observation of a network’s response to such, creates an additional dimension for analysis not captured in static or non-interactive visualizations. At the following link, a video demonstration of an early VR visualization prototype of the bipartite carbon mineral-locality network in Figure 5 can be viewed2. The locality “U-shape” observed in the 2D version becomes a “vase” shape in 3D, with the most common, oldest carbon minerals at the base of the locality vase and the youngest, rarest carbon minerals radiate out of the top of the locality vase and down the sides. This and other networks can also be explored in an immersive fashion with VR.
Organic Carbon Mineralogy in Early Earth Environments and Planetary Systems
Currently, there are more than 50 organic mineral species approved by the IMA (Skinner, 2005; Perry et al., 2007; Echigo and Kimata, 2010; Hazen et al., 2013a; Piro and Baran, 2018), most of which form through alteration of biological materials (Oftedal, 1922; Rost, 1942; Nasdala and Pekov, 1993; Perry et al., 2007; Chesnokov et al., 2008; Witzke et al., 2015; Pekov et al., 2016; Hummer et al., 2017). Recent discoveries and new studies of organic minerals (Pekov et al., 2016; Bojar et al., 2017; Hummer et al., 2017; Mills et al., 2017) and minerals with metal-organic framework structures that contain metal centers bonded via molecular linkers into porous assemblies of different dimensionalities (Huskić et al., 2016) led to the formulation of novel geomimetic approaches in the design and synthesis of metal-organic frameworks (Huskić and Friščić, 2018; Huskiæ and Frišèiæ, 2019; Li et al., 2019). Most organic minerals observed on Earth today are oxalates and carboxylates of low nutrient value to microbes (Benner et al., 2010) and are therefore able to persist on a planet teeming with life. The presence of life limits the long-term survival of other organic crystals on modern Earth, but such crystals, including co-crystals, could have existed on early Earth and may currently exist on other planetary bodies (Hazen, 2018; Maynard-Casely et al., 2018; Morrison et al., 2018). Organic molecules can be created by abiotic processes (Glasby, 2006; Fu et al., 2007; Kolesnikov et al., 2009; McCollom, 2013; Sephton and Hazen, 2013; Huang et al., 2017). They have been shown to exist in many planetary settings, including meteorites (Cooper et al., 2001; Sephton, 2002; Pizzarello et al., 2006; Burton et al., 2012; Sephton and Hazen, 2013; Kebukawa and Cody, 2015; Cooper and Rios, 2016; Koga and Naraoka, 2017), comets (Kimura and Kitadai, 2015), and have been detected or are hypothesized to exist on many other planetary bodies in our solar system, including Mars, Titan, Enceladus, Callisto, and Ganymede (McCord et al., 1997; Formisano et al., 2004; Cable et al., 2012, 2018; Kimura and Kitadai, 2015; Webster et al., 2015, 2018; Zolensky et al., 2015; Hand, 2018; Maynard-Casely et al., 2018). On bodies with low temperatures there is also the possibility of clathrates containing and protecting organic molecules (Kvenvolden, 1995; Buffett, 2000; Shin et al., 2012; Hazen et al., 2013c; Maynard-Casely et al., 2018). Therefore, the earliest, prebiotic minerals on Earth’s surface, many of which may currently be present on other planetary bodies, were likely organic crystalline compounds, such as amino acids, nucleobases, hydrocarbons, co-crystals, clathrates, and other species that have since been consumed by cellular life here on Earth (Hazen, 2018; Morrison et al., 2018).
Current and Future Directions
Network Structure Quantification
Many trends associated with geologic or planetary processes have been recognized in the topologies of mineral networks and a multitude of unrecognized trends also exist within mineral network topologies and/or data objects. Therefore, it is imperative to develop statistical methods for quantifying mineral network structures and relating these structures to their underlying geologic, biologic, or planetary drivers (Hystad et al., 2019b). Such methods will allow for the systematic study of network features, such as degree distribution, distribution of shared partners, centrality, clustering, connected subgraphs, and cliques, and will employ an exponential random graph model (ERGM) (Frank and Strauss, 1986; Snjiders, 2002; Hunter and Handcock, 2006; Snijders et al., 2006; Hunter, 2007; Pattison et al., 2007; Lusher et al., 2012). The models will determine whether or not the substructures within a network occur more often than would be expected by chance. They will also determine which attributes are most significant to mineral co-occurrence, or any other relationship of interest, including, for example, whether or not minerals of the same paragenetic mode tend to be found at the same location or if there is a more influential parameter. The ERGM model will be expanded to include multilevel networks (Wang et al., 2013), such as one of mineral species, their localities, and their chemical compositions. The multilevel approach will provide a means to model the complex dependence structures and interactions amongst the many network parameters. Additionally, we will employ a latent network model, which models unobserved factors that underlie the expression of network structures by incorporating latent variables (Kolaczyk, 2009b; Kolaczyk and Csárdi, 2014).
Natural Kind Clustering
Physical and chemical attributes of minerals are the direct product of and, as a result, encode their formational conditions and any subsequent weathering and alteration. Therefore, multivariate correlation of these attributes will allow for association of minerals to their paragenetic modes, resulting in a number of distinct “natural kinds” within a mineral species (Hazen, 2019). For example, diamond may have many “natural kinds,” including stellar vapor-deposited diamonds (Hazen et al., 2008; Ott, 2009; Hazen and Morrison, 2019), Type I (Davies, 1984; Shirey et al., 2013; Sverjensky and Huang, 2015), Type II (Smith et al., 2016), and carbonado (Heaney et al., 2005; Garai et al., 2006). Cluster analysis and classification algorithms will allow characterization and designation of various natural kinds of each mineral species and thereby relate the wealth of information contained within mineral samples to their geologic, biologic, and/or planetary origins. Designation of the natural kinds of minerals within the earliest environments of our universe is given in Hazen and Morrison (2019) and Morrison and Hazen (2020), preliminary work is underway to classify the natural kinds of many mineral species, with a particular focus on carbon-bearing phases, including diamond, calcite, and aragonite (Boujibar et al., 2019; Zhang et al., 2019).
Affinity Analysis
The mineral co-occurrence information stored in the MED and Mindat.org provide the means to make predictions on the most likely locations to find certain mineral species, geologic settings, deposits, and/or planetary environments, as well as a probabilistic list of minerals likely to occur at any given locality (Prabhu et al., 2019b; Morrison et al., 2020). Affinity analysis is a machine learning method that discovers relationships between various entities in a dataset. This method analyzes co-occurrence data and identifies strong rules based on associations between entities. This method was first introduced by Agrawal and Srikant (1994), and they present two algorithms to create association rules (i.e., the Apriori and AprioriTid algorithms). Apriori uses a bottom-up approach where subsets of entities that frequently co-occur are generated as candidates for testing against the data. The number of occurrences of the candidates are then compiled and patterns observed from the occurrence of these candidates are used to generate rules. For example, consider the following small carbon mineral dataset:
{malachite, calcite, azurite}
{malachite, azurite}
{malachite, calcite, azurite, dolomite}
{malachite, calcite}
Let us assume these data represents the co-occurrence of carbon minerals. If we generate candidates of size 2 and 3, then most commonly occurring sets of minerals are:
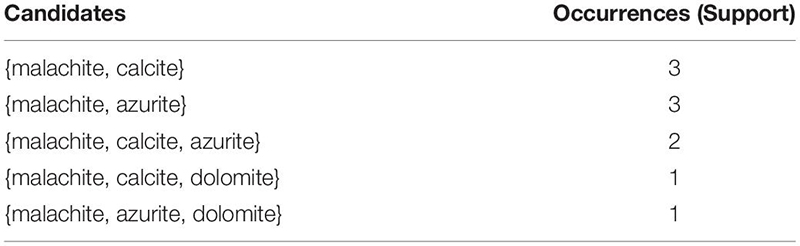
Based on the occurrence of candidates, we can create the following rules:
• 75% of the sets with malachite also contain calcite.
• 75% of the sets with malachite also contain azurite.
• 50% of the sets with malachite and calcite also contain azurite.
• 25% of the sets with malachite and calcite also contain dolomite.
• 25% of the sets with malachite and azurite also contain dolomite.
Such association rules can be used to predict the probability of occurrence for certain minerals or mineral assemblages, given the currently known mineralogy of a locality. Therefore, this method allows for prediction of the most probable locations on Earth or other planetary bodies to find mineral species or mineral assemblages of interest, as well as certain geologic settings, deposits, or environments. Likewise, this method can assess the probability of finding any mineral species at a locality in question. In a preliminary case study on Mindat.org mineral occurrence data, pair-wise correlations (i.e., candidates of size 2) were used to predict a likely locality of the mineral species wulfenite. The model predicted the Surprise Mine, Cookes Peak District, Luna County, NM, United States as a very likely new location of wulfenite (locality3). Erin Delventhal, a member of the Mindat.org management team, validated this prediction by going to Cookes Peak and positively identifying an occurrence of wulfenite (image of collected sample4). These preliminary results highlight the promise of discovery with affinity analysis in mineral systems.
GPlates Plate Tectonic Reconstructions
GPlates is an open-source and cross-platform plate reconstruction software that enables users to incorporate any vector or raster data into digital community plate motion models (Merdith et al., 2017; Müller et al., 2018; Young et al., 2019). Incorporation of mineralogical data into plate tectonic reconstructions (Figure 6) will illuminate tectonic drivers and feedbacks of mineralization through deep time, such as identifying tectonic settings that preferentially generate or focus particular mineral species. We will begin to answer questions related to subduction conditions (i.e., depth of mantle wedge interaction and estimation of slab angle, rate of subduction, devolatilization of the subducting slab, etc.) of subduction-related mineralization, characterize mineralization associated with mantle plume and hydrothermal settings, collisional regimes, and identify mineralization clearly not controlled by tectonic influences. A video of a preliminary reconstruction model of carbon mineralization through deep time (from modern day to 1.0 Ga) can be found at https://4d.carnegiescience.edu/explore-our-science.
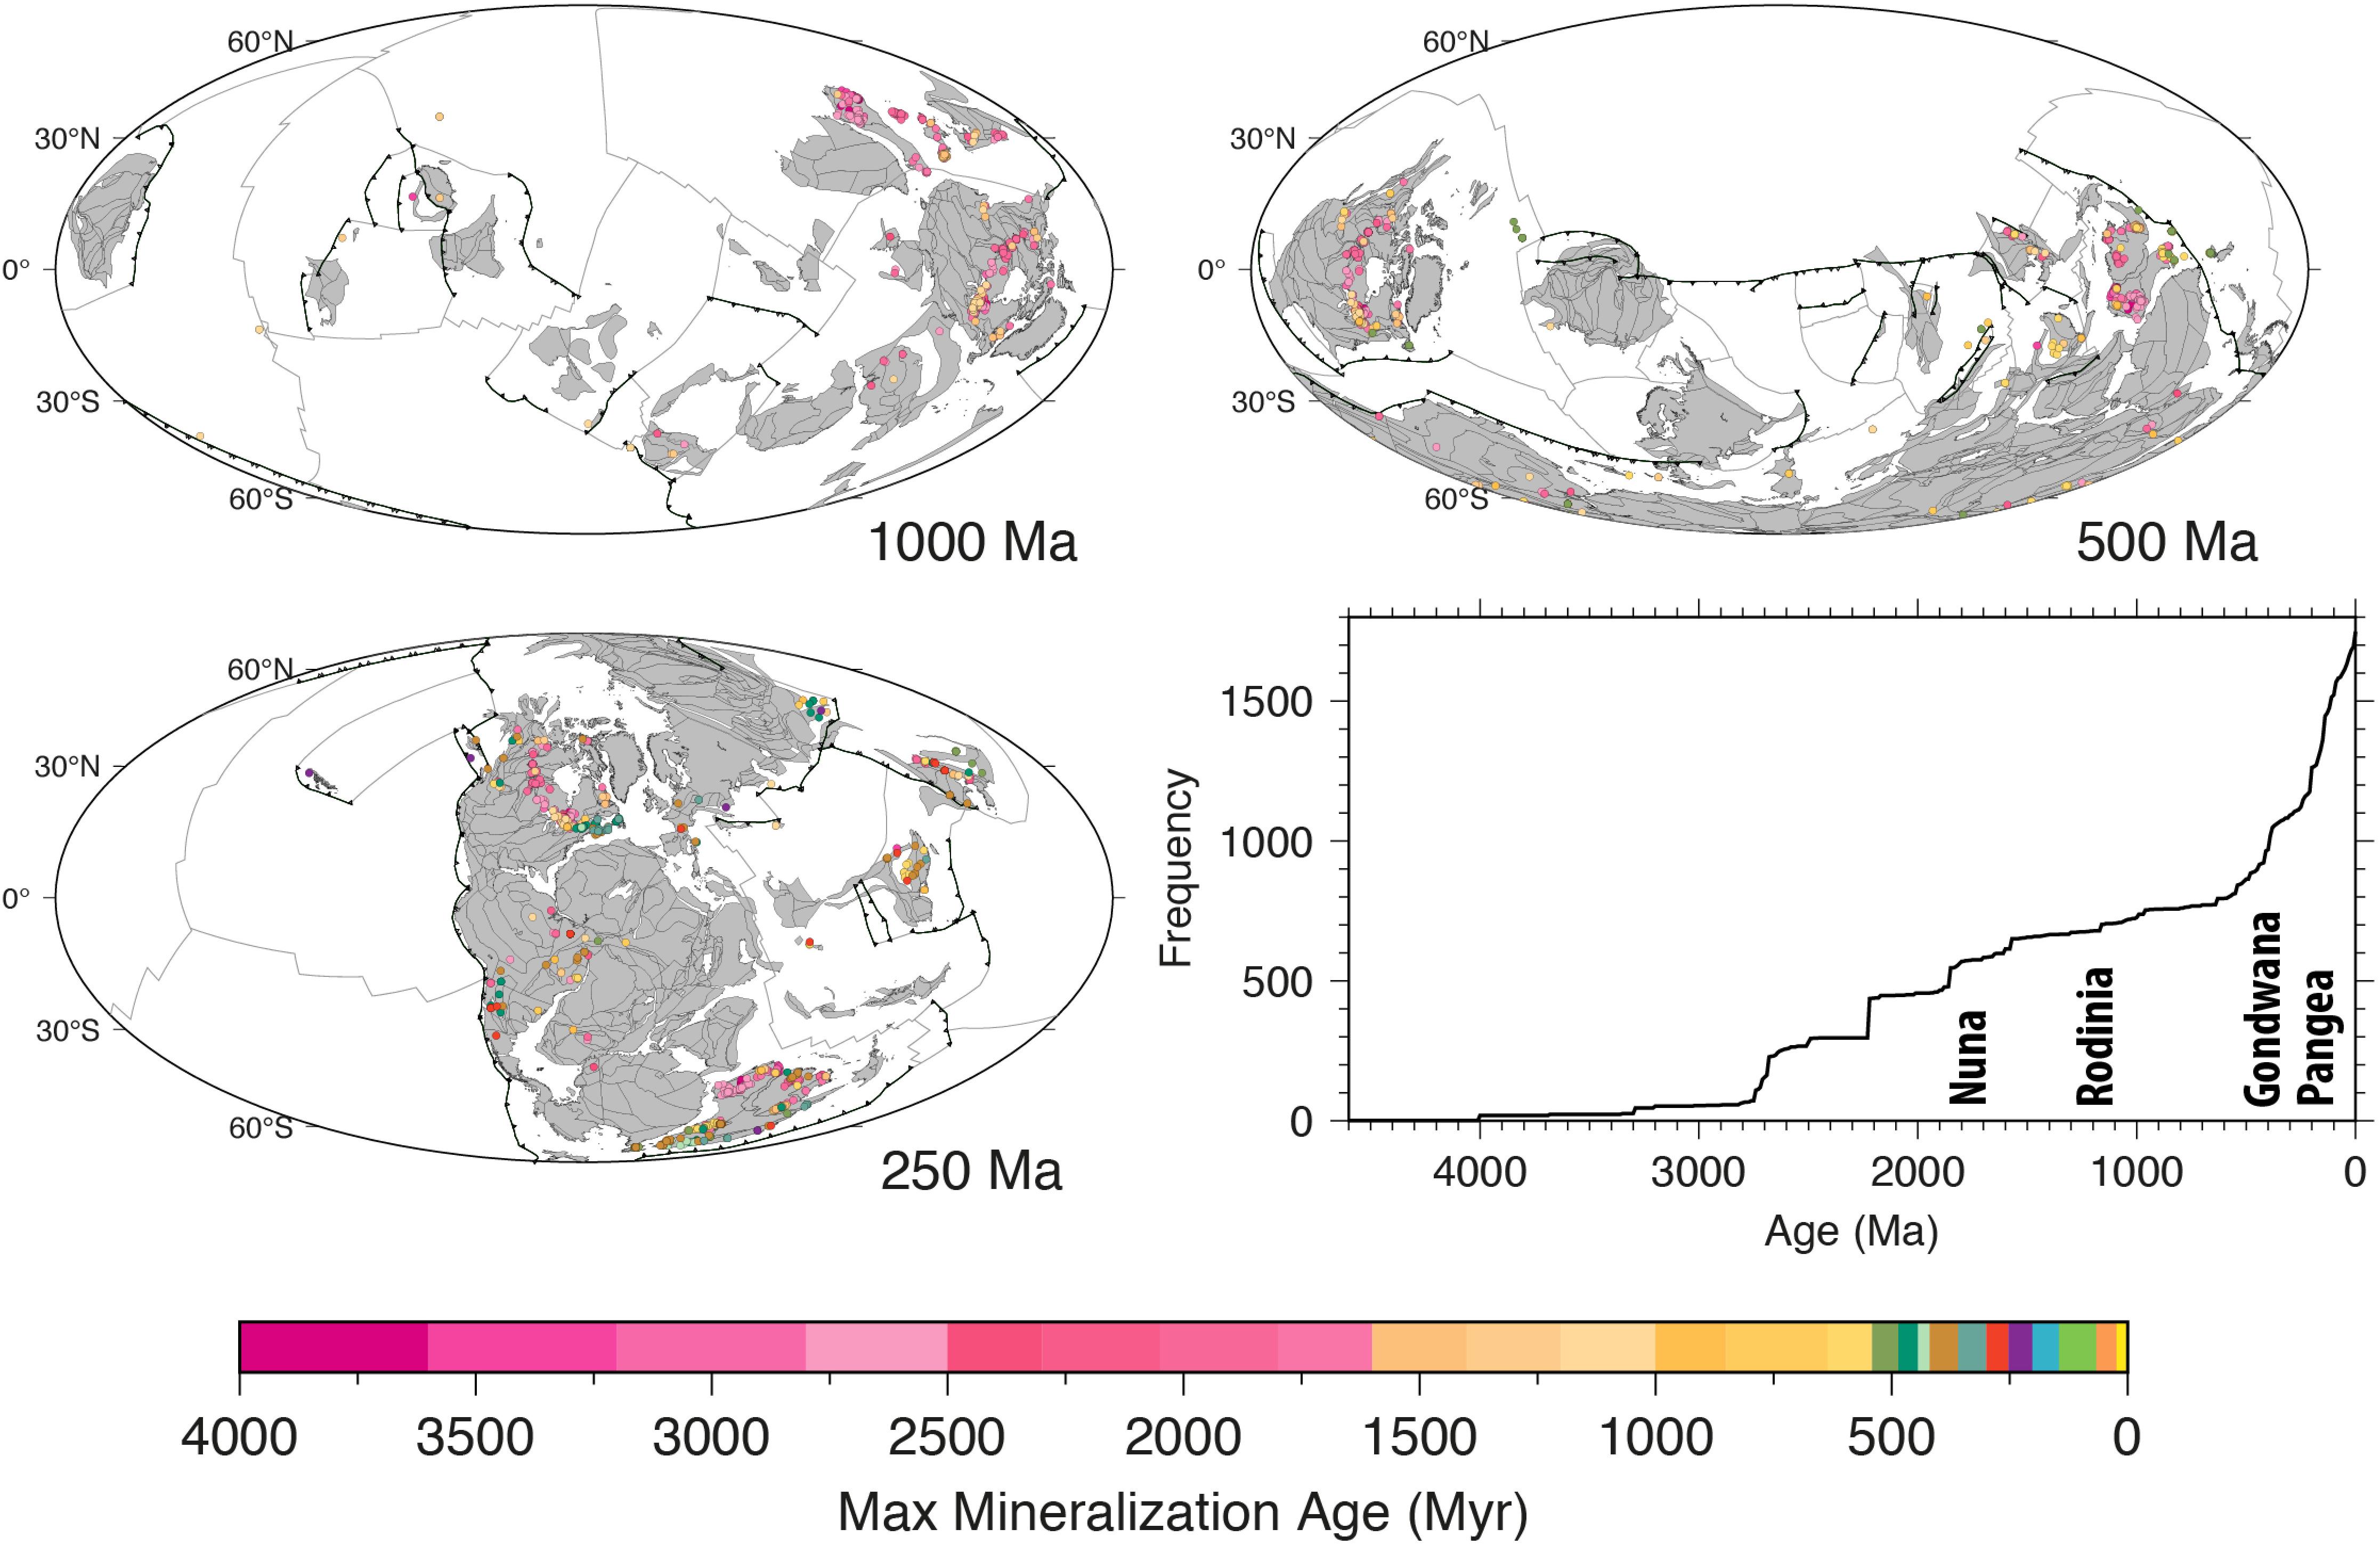
Figure 6. GPlates plate tectonic reconstruction snapshots with carbon mineral occurrences, and a cumulative frequency plot highlighting that some increases in carbon mineral occurrences are contemporaneous with changes in the supercontinent cycle. Full video (modern day to 1.0 Ga) available at https://4d.carnegiescience.edu/explore-our-science.
Quantifying Preservational Bias
Preservational and sampling bias is inherent to geologic materials, the magnitude of which is not uniform through time or across a system and, therefore, can be very difficult to quantify. Recent data-driven studies of mineralization associated with the Rodinian assembly (Liu et al., 2017b, 2018b) have examined the differences in the mineralogy and geochemistry of igneous rocks associated with the assembly of the Rodinian supercontinent, as igneous rocks of Rodinian age tend to have different geochemical signatures than those from other supercontinents. The question remains: how much of the trend is related to conditions and processes during assembly and how much is related to preservational and sampling bias? This is evident in Figure 6 where major increases in carbon mineralization is associated with the younger mega-continent of Gondwana and supercontinent of Pangea, while the signal related to Nuna and Rodinia assembly is more subdued in the cumulative frequency plot. This question must also be asked of many other formational environments, including those relevant to carbon mineralization (e.g., carbonate platforms, carbonatites). Ongoing and future studies will attempt to quantify preservational bias in the mineralogical record by examining factors that contribute to preservation, such as mineral characteristics (e.g., solubility, hardness), common tectonic settings of mineral formation, etc. It is also important to consider human factors that govern sampling, including economic significance of the material, physical characteristics (e.g., color, crystal habit, size, luster), and scientific importance, and may result in sampling bias within datasets. These data will be used to develop statistical models for prediction of the amount of erosional loss through deep time.
Microbial Populations and Mineral Systems
An underlying driving principle of studying Earth’s mineralogy through deep time is to gain insight into the co-evolution of the geosphere and biosphere. Mineral evolution studies characterize Earth’s mineralogy during the time of life’s emergence and throughout its evolution, but how do we garner an understanding of direct influence and feedback systems between Earth materials (e.g., the “geochemical environment”) and microbial populations? Given the dearth of ancient microbial samples, we can examine modern day equivalents, particularly in geochemical environments most likely to be analogous to ancient environments (e.g., hydrothermal vents, hot springs). Therefore, a study is underway to employ advanced analytics and visualization, including network analysis, to characterize the complex, multidimensional, multivariate relationships between the metagenomes of extant microbial populations and their geochemical environments (Morrison et al., 2017a; Buongiorno et al., 2019a, b, 2020; Giovannelli et al., 2019). Figures 7A,B illustrate a preliminary look at bipartite networks of sampling site locations and their metagenomes (A) and mineralogy (B). A multilevel network approach (see “Network Structure Quantification” section above) and transfer learning techniques will be used to relate location, metagenomic data, and mineralogy (Figures 7A,B), as well as aqueous geochemistry, temperature, pressure, pH, salinity, and more, and to generate models quantifying the complex relationships therein. These studies are examining trends in metagenomic and geochemical parameters across a single arc system (Barry et al., 2019a, b), across multiple systems such as volcanic arcs, mid-oceanic ridges, and hot spots, and across disparate systems around our planet, as depicted in Figures 7A,B (e.g., including settings like acid-mine drainage, permafrost, and hot springs). Targeting closely related systems, such as a single volcanic arc or all hotspot related hot spring systems, allows tight correlation of changes in geochemical conditions with changes in microbial communities due to the fact that there is less variance in the environmental parameters. Whereas a more global comparison allows for examination of all possible environmental and microbial variables. Preliminary results show distinct, complex trends in geochemical parameters related to changes in protein functions of microbial populations.
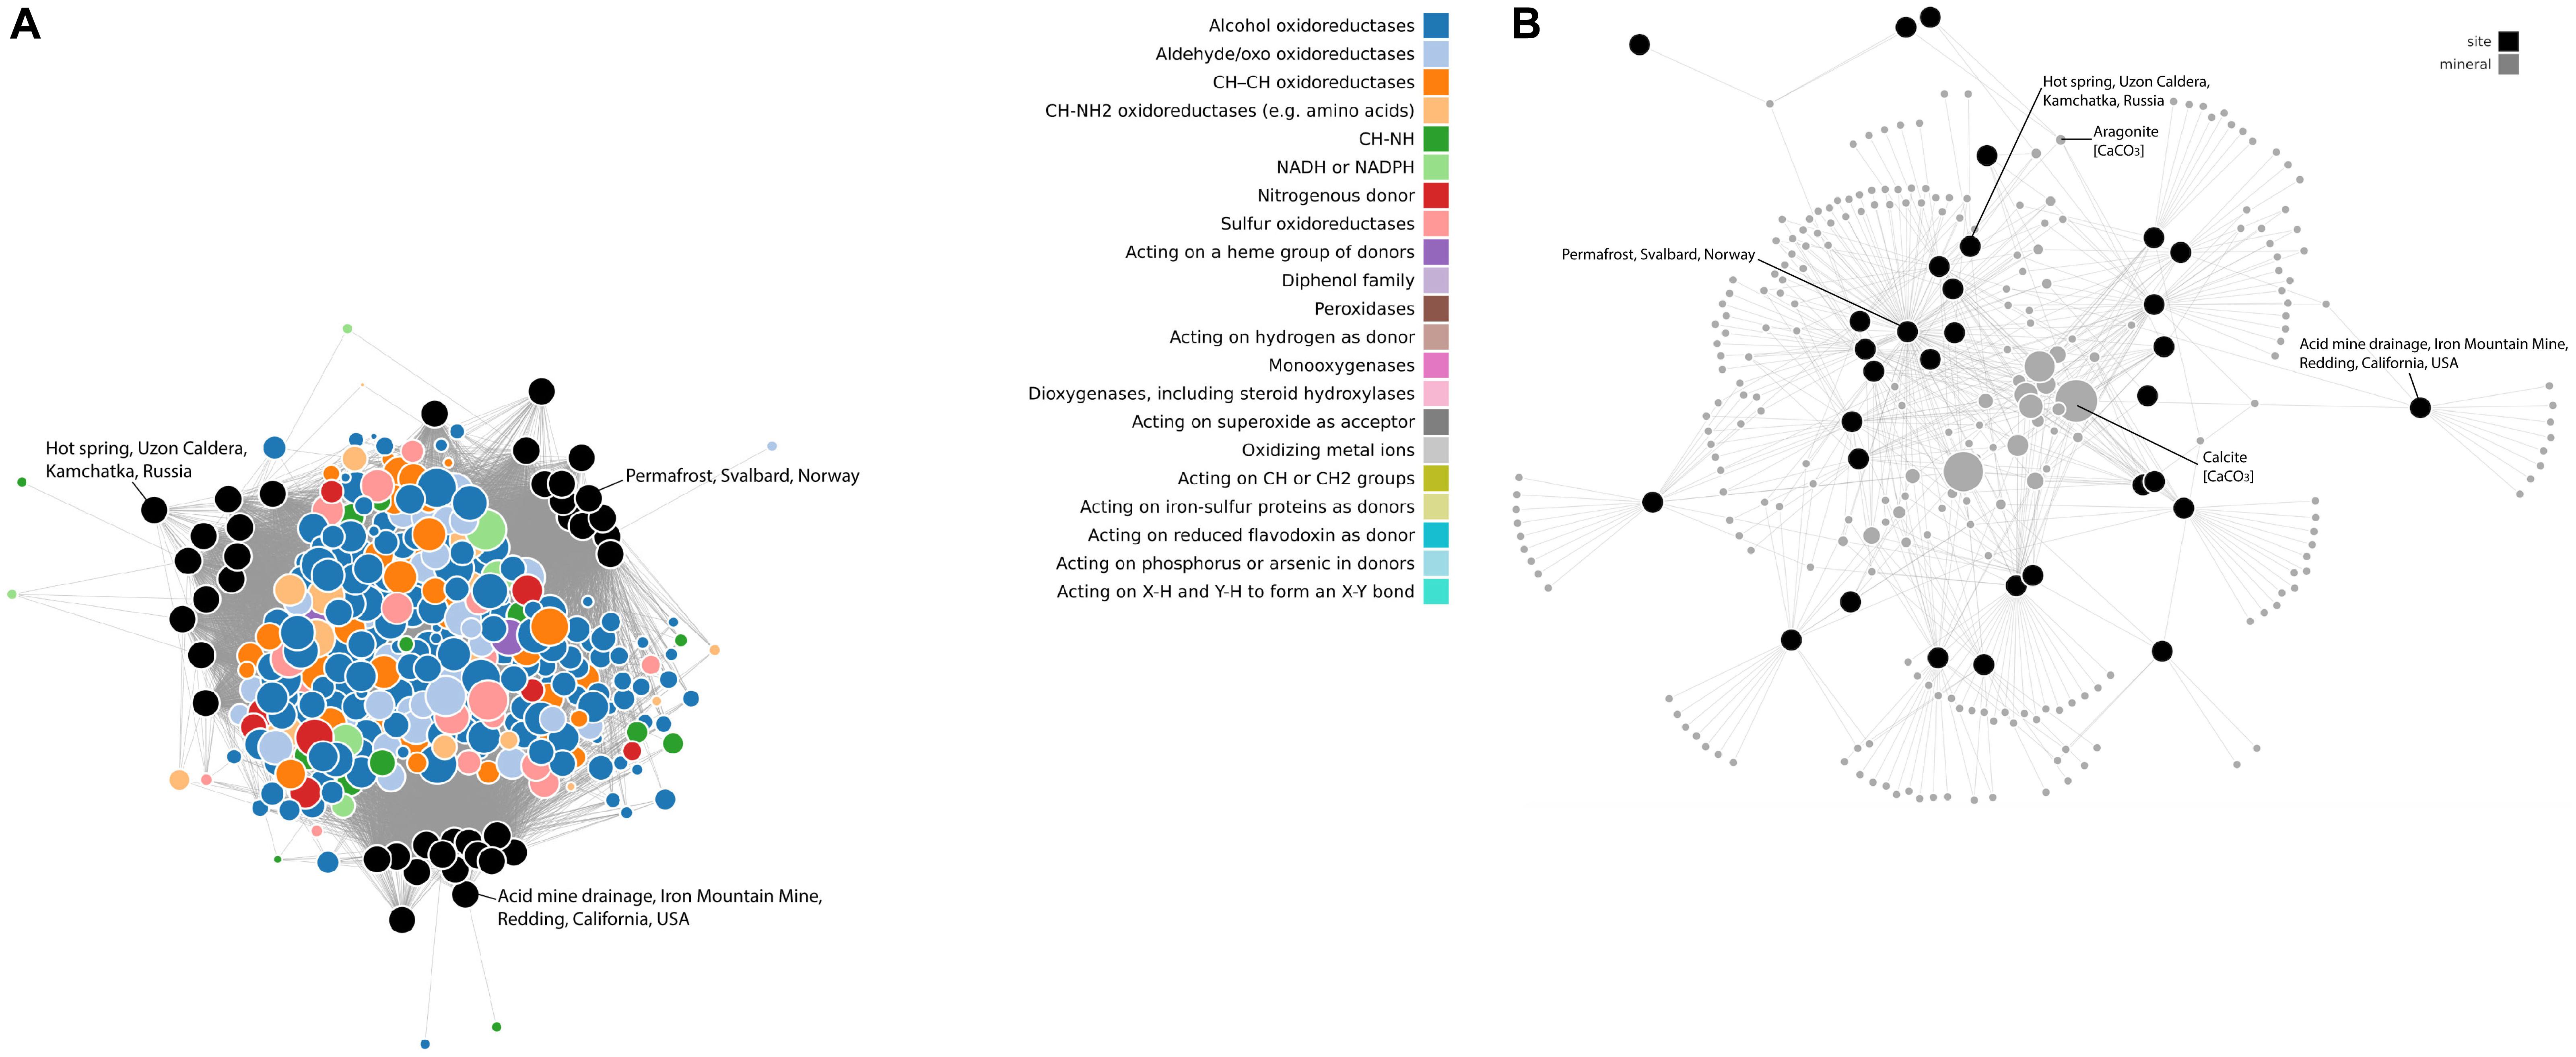
Figure 7. (A,B) Bipartite microbial population-locality and mineral-locality networks. Force-directed, bipartite networks of a preliminary analysis of interaction between metagenomes and mineralogy of the same sampling sites. (A) Metalloprotein oxidoreductases (colored nodes; enzyme commission EC1 class) and the sites where they were found (black nodes). Enzyme nodes sized according to their counts and colored by their subclass. (B) Bipartite network of the mineral diversity at the same sites. Mineral nodes in gray, sized according to their mineral diversity; site nodes in black.
Discussion
Motivated by understanding Earth’s mineral diversity and distribution through deep time, bioavailability of redox sensitive elements during the emergence and evolution of life, biosignatures at mineralogical and planetary scales, and underlying geologic and biologic drivers of mineralization, we have made many discoveries in carbon science, including: (1) Earth’s mineralogy is a function of the physical, chemical, and biological processes that are different at each stage of planetary evolution. (2) Earth’s mineral diversity and spatial distribution follows an LNRE trend, a trend that is visually represented in the topology of mineral-locality bipartite network renderings and is likely a planetary-scale biosignature. (3) Predication of as-yet undiscovered mineral species, which spurred the Carbon Mineral Challenge – an initiative that has reported 30 new carbon minerals species in less than 3 years. (4) Recognition of embedded trend lines in network topologies, such as those of chemical composition, crystal structural complexity, time, and paragenetic mode. In addition, this work has developed new tools for visualization of mineral systems, including mineral networks, as well as 3D and VR platforms thereof. Furthermore, we are exploring and are on the brink of discoveries related to (1) quantifying mineral network structures and their underlying geologic, biologic, and planetary drivers, (2) predicting mineral paragenetic mode on Earth and other planetary bodies through natural kind clustering, (3) predicting the new locations of mineral occurrence and missing minerals at specified locations on Earth’s surface via affinity analysis, (4) investigating the tectonic drivers of mineralization through deep time through integration with paleotectonic reconstructions, (5) understanding the complex feedback systems controlling the relationships between mineralogy and the geochemical environment with microbial populations and their enzymatic functions, and (6) quantifying preservational and sampling bias in the mineralogical record. These recent discoveries and new research directions show great promise for further unraveling the complexities surrounding carbon mineral formation, the deep carbon cycle, and life’s coevolution with Earth materials and processes.
Author Contributions
The individuals listed with the following projects or databases provided discussion, performed analyses, and/or collected/curated data. JG, RH, RD, and SM: the International Mineralogical Association list of mineral species (RRUFF.info/IMA). CL, DH, JG, JR, RH, RD, SR, and SM: the Mineral Evolution Database (MED). AE, AP, JR, RH, RD, SM, and SK: the Mineral Properties Database (MPD). JR: Mindat.org. AE, AP, JG, JR, PF, RH, RD, SM, and SK: Global Earth Mineral Inventory (GEMI). AE, CL, DH, GH, JG, JR, RH, RD, and SM: Mineral ecology. AE, AP, CL, DH, GH, JG, JR, LK, OK, PF, RH, RD, and SM: network analysis. DH, RH, SM, and SK: organic carbon mineralogy. AE, AP, CL, PF, RH, and SM: natural kind clustering. AE, AP, JG, JR, PF, RH, and SM: affinity analysis. AM, CL, JG, RH, SM, and SZ: GPlates plate tectonic reconstructions. AE, AP, DG, JB, PF, RH, and SM: microbial populations and mineral systems. CL, JR, RH, and SR: quantifying preservational bias.
Funding
This publication is a contribution to the Deep Carbon Observatory. Studies of mineral evolution, mineral ecology, and data-driven discovery in mineral systems are supported by the Deep Carbon Observatory, the Alfred P. Sloan Foundation, the W. M. Keck Foundation, the John Templeton Foundation, the NASA Astrobiology Institute (80NSSC18M0093), a private foundation, and the Carnegie Institution for Science. SK thanks Russian Science Foundation for financial support (grant 19-17-00038). SZ was supported by Alfred P. Sloan grants G-2017-9997 and G-2018-11296 through the Deep Carbon Observatory, and Australian Research Council grant IH130200012. Any opinions, findings, or recommendations expressed herein are those of the authors and do not necessarily reflect the views of the funding agencies or affiliated organizations.
Conflict of Interest
The authors declare that the research was conducted in the absence of any commercial or financial relationships that could be construed as a potential conflict of interest.
Acknowledgments
The authors thank the reviewers of this manuscript for their insightful and constructive feedback. A special thanks goes to Erin Delventhal for her field work to identify a previously unreported wulfenite locality.
Supplementary Material
The Supplementary Material for this article can be found online at: https://www.frontiersin.org/articles/10.3389/feart.2020.00208/full#supplementary-material
Footnotes
- ^ https://dx.deepcarbon.net/11121/6200-6954-6634-8243-CC
- ^ https://www.youtube.com/watch?v=5GDnpqpOokU
- ^ https://www.Mindat.org/loc-300363.html
- ^ https://www.mindat.org/photo-930500.html
References
Abraham, A., Hassanien, A.-E., and Snasel, V. (2010). Computational Social Network Analysis: Trends, Tools and Research Advances, eds A. Abraham, A. E. Hassanien, and V. Snasel (New York, NY: Springer).
Agrawal, R., and Srikant, R. (1994). “Fast algorithms for mining association rules,” in Proceedings of the 20th International Conference on Very Large Data Bases, San Jose, CA, 487–499.
Amari, S., Anders, E., Virag, A., and Zinner, E. (1990). Interstellar graphite in meteorites. Nature 345, 238–240. doi: 10.1038/345238a0
Anthony, J. W., Bideaux, R. A., Bladh, K. W., and Nichols, M. C. (2003). Handbook of Mineralogy. Chantilly, VA: Mineralogical Society of America.
Barry, P. H., de Moor, J. M., Giovannelli, D., Schrenk, M., Hummer, D. R., Lopez, T., et al. (2019a). Forearc carbon sink reduces long-term volatile recycling into the mantle. Nature 568, 487–492. doi: 10.1038/s41586-019-1131-5
Barry, P. H., Nakagawa, M., Giovannelli, D., Maarten de Moor, J., Schrenk, M., Seltzer, A. M., et al. (2019b). Helium, inorganic and organic carbon isotopes of fluids and gases across the Costa Rica convergent margin. Sci. Data 6:284. doi: 10.1038/s41597-019-0302-4
Benner, S. A., Kim, H.-J., Kim, M.-J., and Ricardo, A. (2010). Planetary organic chemistry and the origins of biomolecules. Cold Spring Harb. Perspect. Biol. 2:a003467. doi: 10.1101/cshperspect.a003467
Bojar, H.-P., Walter, F., and Baumgartner, J. (2017). Joanneumite, Cu(C3 N3 O3 H2)2 (NH3)2, a new mineral from Pabellón de Pica, Chile and the crystal structure of its synthetic analogue. Mineral. Mag. 81, 155–166. doi: 10.1180/minmag.2016.080.078
Boujibar, A., Zhang, S., Howell, S., Prabhu, A., Narkar, S., Hystad, G., et al. (2019). Natural kind clustering of presolar silicon carbides and its astrophysical implications. AGUFM 2019:V11C-02.
Buongiorno, J., Fullerton, K., Rogers, T., Giovannelli, D., DeMoor, M., Barry, P., et al. (2019a). “Interactions between microbial communities and their geologic environment at the Costa Rica active margin,” in Proceedings of the Goldschmidt Annual Meeting, Barcelona.
Buongiorno, J., Giovannelli, D., DeMoor, M., Barry, P., Shrenk, M., Lloyd, K., et al. (2020). “An integrated machine learning approach reveals geochemical controls on microbial electron-transfer protein abundance,” in Proceedings of the Goldschmidt Annual Meeting (Virtual).
Buongiorno, J., Herbert, L. C., Wehrmann, L. M., Michaud, A., Laufer, K., Røy, H., et al. (2019b). Complex microbial communities drive iron and sulfur cycling in Arctic fjord sediments. Appl. Environ. Microbiol. 85:e00949-19. doi: 10.1128/AEM.00949-19
Burton, A. S., Stern, J. C., Elsila, J. E., Glavin, D. P., and Dworkin, J. P. (2012). Understanding prebiotic chemistry through the analysis of extraterrestrial amino acids and nucleobases in meteorites. Chem. Soc. Rev. 41, 5459–5472.
Cable, M. L., Hörst, S. M., Hodyss, R., Beauchamp, P. M., Smith, M. A., and Willis, P. A. (2012). Titan tholins: simulating titan organic chemistry in the cassini-huygens era. Chem. Rev. 112, 1882–1909. doi: 10.1021/cr200221x
Cable, M. L., Vu, T. H., Maynard-Casely, H. E., Choukroun, M., and Hodyss, R. (2018). The acetylene-ammonia co-crystal on titan. ACS Earth Sp. Chem. 2, 366–375. doi: 10.1021/acsearthspacechem.7b00135
Chesnokov, B. V., Shcherbakova, Y. P., and Nishanbayev, T. P. (2008). Minerals from Burned Dumps of Chelyabinsk Coal Basin. Miass: Russian Academy of Sciences, 139.
Clauset, A., Newman, M. E. J., and Moore, C. (2004). Finding community structure in very large networks. Phys. Rev. E. 70:066111. doi: 10.1103/PhysRevE.70.066111
Cooper, G., Kimmich, N., Belisle, W., Sarinana, J., Brabham, K., and Garrel, L. (2001). Carbonaceous meteorites as a source of sugar-related organic compounds for the early earth. Nature 414, 879–883. doi: 10.1038/414879a
Cooper, G., and Rios, A. C. (2016). Enantiomer excesses of rare and common sugar derivatives in carbonaceous meteorites. Proc. Natl. Acad. Sci. U.S.A. 113, E3322–E3331.
Csardi, G., and Nepusz, T. (2006). The Igraph Software Package for Complex Network Research. InterJournal Complex Systems 1695. Available online at: http://igraph.sf.net (accessed March 8, 2012).
Echigo, T., and Kimata, M. (2010). CRYSTAL CHEMISTRY AND GENESIS OF ORGANIC MINERALS: A REVIEW OF OXALATE AND POLYCYCLIC AROMATIC HYDROCARBON MINERALS. Can. Mineral. 48, 1329–1357. doi: 10.3749/canmin.48.5.1329
Formisano, V., Atreya, S., Encrenaz, T., Ignatiev, N., and Giuranna, M. (2004). Detection of methane in the atmosphere of mars. Science 306, 1758–1761. doi: 10.1126/science.1101732
Frank, O., and Strauss, D. (1986). Markov graphs. J. Am. Stat. Assoc. 81, 832–842. doi: 10.1080/01621459.1986.10478342
Fruchterman, T. M. J., and Reingold, E. M. (1991). Graph drawing by force-directed placement. Softw. Pract. Exp. 21, 1129–1164. doi: 10.1002/spe.4380211102
Fu, Q., Lollar, B. S., Horita, J., Lacrampe-Couloume, G., and Seyfried, W. E. Jr. (2007). Abiotic formation of hydrocarbons under hydrothermal conditions: constraints from chemical and isotope data. Geochim. Cosmochim. Acta 71, 1982–1998. doi: 10.1016/j.gca.2007.01.022
Garai, J., Haggerty, S. E., Rekhi, S., and Chance, M. (2006). Infrared absorption investigations confirm the extraterrestrial origin of carbonado diamonds. Astrophys. J. Lett. 653:L153. doi: 10.1086/510451
Giovannelli, D., Buongiorno, J., Prabhu, A., Eleish, A., Huang, F., Fox, P. A., et al. (2019). Tracking the evolution of our planet using large scale geochemistry and metagenomic data. AGUFM 2019:V11C-06.
Glasby, G. P. (2006). Abiogenic origin of hydrocarbons: an historical overview. Resour. Geol. 56, 83–96. doi: 10.1111/j.1751-3928.2006.tb00271.x
Glikson, A. Y., and Pirajno, F. (2018). Asteroids Impacts, Crustal Evolution and Related Mineral Systems with Special Reference to Australia. Berlin: Springer.
Golden, J. J., McMillan, M., Downs, R. T., Hystad, G., Goldstein, I., Stein, H. J., et al. (2013). Rhenium variations in molybdenite (MoS2): evidence for progressive subsurface oxidation. Earth Planet. Sci. Lett. 366, 1–5. doi: 10.1016/j.epsl.2013.01.034
Golden, J. J., Pires, A. J., Hazen, R. M., Downs, R. T., Ralph, J., and Meyer, M. (2016). “Building the Mineral evolution database: implications for future big data analysis,” in Proceedings of the Geological Society of America Annual Meeting Abstracts with Programs, 7, Denver, CO. doi: 10.1130/abs/2016AM-286024
Grew, E. S., Dymek, R. F., De Hoog, J. C. M., Harley, S. L., Boak, J., Hazen, R. M., et al. (2015). Boron isotopes in tourmaline from the ca. 3.7–3.8 Ga Isua supracrustal belt, Greenland: sources for boron in Eoarchean continental crust and seawater. Geochim. Cosmochim. Acta 163, 156–177. doi: 10.1016/j.gca.2015.04.045
Grew, E. S., and Hazen, R. M. (2014). Beryllium mineral evolution. Am. Mineral. 99, 999–1021. doi: 10.2138/am.2014.4675
Grew, E. S., Hystad, G., Hazen, R. M., Krivovichev, S. V., and Gorelova, L. A. (2017). How many boron minerals occur in Earth’s upper crust? Am. Mineral. 102, 1573–1587. doi: 10.2138/am-2017-5897
Grew, E. S., Krivovichev, S. V., Hazen, R. M., and Hystad, G. (2016). Evolution of structural complexity in boron minerals. Can. Mineral. 54, 125–143. doi: 10.3749/canmin.1500072
Hand, E. (2018). Mars methane rises and falls with the seasons. Science 359, 16–17. doi: 10.1126/science.359.6371.16
Hazen, R. M., Bromberg, Y., Downs, R., Eleish, A., Falkowski, P., Fox, P., et al. (2019a). “Deep carbon through deep time: data-driven insights,” in Deep Carbon: Past to Present, eds B. Orcutt, R. Dasgupta, and I. Daniel (Cambridge: Cambridge University Press), 620–652. doi: 10.1017/9781108677950.020
Hazen, R. M. (2013). Paleomineralogy of the Hadean eon: a preliminary species list. Am. J. Sci. 313, 807–843. doi: 10.2475/09.2013.01
Hazen, R. M. (2018). Titan mineralogy: a window on organic mineral evolution. Am. Mineral. 103, 341–342. doi: 10.2138/am-2018-6407
Hazen, R. M. (2019). An evolutionary system of mineralogy: proposal for a classification based on natural kind clustering. Am. Mineral. 104, 810–816. doi: 10.2138/am-2019-6709CCBYNCND
Hazen, R. M., Bekker, A., Bish, D. L., Bleeker, W., Downs, R. T., Farquhar, J., et al. (2011). Needs and opportunities in mineral evolution research. Am. Mineral. 96, 953–963. doi: 10.2138/am.2011.3725
Hazen, R. M., Downs, R. T., Eleish, A., Fox, P., Gagné, O. C., Golden, J. J., et al. (2019b). Data-driven discovery in mineralogy: recent advances in data resources, analysis, and visualization. Engineering 5, 397–405. doi: 10.1016/J.ENG.2019.03.006
Hazen, R. M., Downs, R. T., Jones, A. P., and Kah, L. (2013a). “Carbon mineralogy and crystal chemistry,” in Reviews in Mineralogy and Geochemistry, eds R. M. Hazen, A. Jones, and J. Baross (Chantilly, VA: Mineralogical Society of America), 7–46. doi: 10.2138/rmg.2013.75.2
Hazen, R. M., Downs, R. T., Kah, L., and Sverjensky, D. (2013b). Carbon mineral evolution. Rev. Mineral. Geochem. 75, 79–107. doi: 10.2138/rmg.2013.75.4
Hazen, R. M., and Ferry, J. M. (2010). Mineral evolution: mineralogy in the fourth dimension. Elements 6, 9–12. doi: 10.2113/gselements.6.1.9
Hazen, R. M., Grew, E. S., Downs, R. T., Golden, J., and Hystad, G. (2015a). Mineral ecology: chance and necessity in the mineral diversity of terrestrial planets. Can. Mineral. 53, 295–324. doi: 10.3749/canmin.1400086
Hazen, R. M., Grew, E. S., Origlieri, M. J., and Downs, R. T. (2017a). On the mineralogy of the “Anthropocene Epoch.” Am. Mineral. 102, 595–611. doi: 10.2138/am-2017-5875
Hazen, R. M., Hummer, D. R., Hystad, G., Downs, R. T., and Golden, J. J. (2016). Carbon mineral ecology: predicting the undiscovered minerals of carbon. Am. Mineral. 101, 889–906. doi: 10.2138/am-2016-5546
Hazen, R. M., Hystad, G., Downs, R. T., Golden, J. J., Pires, A. J., and Grew, E. S. (2015b). Earth’s “missing” minerals. Am. Mineral. 100, 2344–2347. doi: 10.2138/am-2015-5417
Hazen, R. M., Hystad, G., Golden, J. J., Hummer, D. R., Liu, C., Downs, R. T., et al. (2017b). Cobalt mineral ecology. Am. Mineral. 102, 108–116. doi: 10.2138/am-2017-5798
Hazen, R. M., Liu, X.-M., Downs, R. T., Golden, J. J., Pires, A. J., Grew, E. S., et al. (2014). Mineral evolution: episodic metallogenesis, the supercontinent cycle, and the coevolving geosphere and biosphere. Soc. Econ. Geol. Spec. Publ. 18, 1–15.
Hazen, R. M., and Morrison, S. M. (2019). An evolutionary system of mineralogy, part I: stellar mineralogy (>13 to 4.6 Ga). Am. Mineral. 105, 627–651. doi: 10.2138/am-2020-7173
Hazen, R. M., Papineau, D., Bleeker, W., Downs, R. T., Ferry, J. M., McCoy, T. J., et al. (2008). Mineral evolution. Am. Mineral. 93, 1693–1720. doi: 10.2138/am.2008.2955
Hazen, R. M., Sverjensky, D. A., Azzolini, D., Bish, D. L., Elmore, S. C., Hinnov, L., et al. (2013c). Clay mineral evolution. Am. Mineral. 98, 2007–2029.
Heaney, P. J., Vicenzi, E. P., and De, S. (2005). Strange diamonds: the mysterious origins of carbonado and framesite. Elements 1, 85–89. doi: 10.2113/gselements.1.2.85
Huang, F., Daniel, I., Cardon, H., Montagnac, G., and Sverjensky, D. A. (2017). Immiscible hydrocarbon fluids in the deep carbon cycle. Nat. Commun. 8:15798. doi: 10.1038/ncomms15798
Hummer, D. R., Noll, B. C., Hazen, R. M., and Downs, R. T. (2017). Crystal structure of abelsonite, the only known crystalline geoporphyrin. Am. Mineral. 102, 1129–1132.
Hunter, D. R. (2007). Curved exponential family models for social networks. Soc. Netw. 29, 216–230. doi: 10.1016/J.SOCNET.2006.08.005
Hunter, D. R., and Handcock, M. S. (2006). Inference in curved exponential family models for networks. J. Comput. Graph. Stat. 15, 565–583. doi: 10.1198/106186006X133069
Huskić, I., and Friščić, T. (2018). Understanding geology through crystal engineering: coordination complexes, coordination polymers and metal–organic frameworks as minerals. Acta Crystallogr. Sect. B Struct. Sci. Cryst. Eng. Mater. 74, 539–559. doi: 10.1107/S2052520618014762
Huskiæ, I., and Frišèiæ, T. (2019). Geomimetic approaches in the design and synthesis of metal-organic frameworks. Philos. Trans. R. Soc. A Math. Phys. Eng. Sci. 377:20180221. doi: 10.1098/rsta.2018.0221
Huskić, I., Pekov, I. V., Krivovichev, S. V., and Frišèić, T. (2016). Minerals with metal-organic framework structures. Sci. Adv. 2:e1600621. doi: 10.1126/sciadv.1600621
Hystad, G., Downs, R. T., Grew, E. S., and Hazen, R. M. (2015a). Statistical analysis of mineral diversity and distribution: earth’s mineralogy is unique. Earth Planet. Sci. Lett. 426, 154–157. doi: 10.1016/j.epsl.2015.06.028
Hystad, G., Downs, R. T., and Hazen, R. M. (2015b). Mineral species frequency distribution conforms to a large number of rare events model: prediction of earth’s missing minerals. Math. Geosci. 47, 647–661. doi: 10.1007/s11004-015-9600-3
Hystad, G., Eleish, A., Hazen, R. M., Morrison, S. M., and Downs, R. T. (2019a). Bayesian estimation of earth’s undiscovered mineralogical diversity using noninformative priors. Math. Geosci. 51, 401–417. doi: 10.1007/s11004-019-09795-8
Hystad, G., Morrison, S. M., and Hazen, R. M. (2019b). Statistical analysis of mineral evolution and mineral ecology: the current state and a vision for the future. Appl. Comput. Geosci. 1:100005. doi: 10.1016/j.acags.2019.100005
Kebukawa, Y., and Cody, G. D. (2015). A kinetic study of the formation of organic solids from formaldehyde: implications for the origin of extraterrestrial organic solids in primitive solar system objects. Icarus 248, 412–423. doi: 10.1016/J.ICARUS.2014.11.005
Kimura, J., and Kitadai, N. (2015). Polymerization of building blocks of life on Europa and other icy moons. Astrobiology 15, 430–441. doi: 10.1089/ast.2015.1306
Koga, T., and Naraoka, H. (2017). A new family of extraterrestrial amino acids in the Murchison meteorite. Sci. Rep. 7:636. doi: 10.1038/s41598-017-00693-9
Kolaczyk, E. D. (2009a). Sampling and Estimation in Network Graphs. New York, NY: Springer, doi: 10.1007/978-0-387-88146-1_5
Kolaczyk, E. D., and Csárdi, G. (2014). Statistical Analysis of Network Data with R. New York, NY: Springer New York. doi: 10.1111/insr.12095_10
Kolesnikov, A., Kutcherov, V. G., and Goncharov, A. F. (2009). Methane-derived hydrocarbons produced under upper-mantle conditions. Nat. Geosci. 2, 566–570. doi: 10.1038/ngeo591
Krivovichev, S. (2012). Topological complexity of crystal structures: quantitative approach. Acta Crystallogr. Sect. A Found. Crystallogr. 68, 393–398. doi: 10.1107/S0108767312012044
Krivovichev, V. G., Charykova, M. V., and Krivovichev, S. V. (2018). The concept of mineral systems and its application to the study of mineral diversity and evolution. Eur. J. Mineral. 30, 219–230. doi: 10.1127/ejm/2018/0030-2699
Krivovichev, S. V. (2013). Structural complexity of minerals: information storage and processing in the mineral world. Mineral. Mag. 77, 275–326. doi: 10.1180/minmag.2013.077.3.05
Krivovichev, S. V. (2016). Structural complexity and configurational entropy of crystals. Acta Crystallogr. Sect. B Struct. Sci. Cryst. Eng. Mater. 72, 274–276. doi: 10.1107/S205252061501906X
Krivovichev, S. V. (2018). Ladders of information: what contributes to the structural complexity of inorganic crystals. Zeitschrift für Krist. Cryst. Mater. 233, 155–161. doi: 10.1515/zkri-2017-2117
Krivovichev, S. V., Krivovichev, V. G., and Hazen, R. M. (2017). Structural and chemical complexity of minerals: correlations and time evolution. Eur. J. Mineral. 30, 231–236. doi: 10.1127/ejm/2018/0030-2694
Kvenvolden, K. A. (1995). A review of the geochemistry of methane in natural gas hydrate. Org. Geochem. 23, 997–1008. doi: 10.1016/0146-6380(96)00002-2
Lafuente, B., Downs, R. T., Yang, H., and Stone, N. (2015). “The power of databases: the RRUFF project,” in Highlights in Mineralogical Crystallography, eds T. Armbruster and R. M. Danisi (Berlin: De Gruyter).
Lewis, R. S., Ming, T., Wacker, J. F., Anders, E., and Steel, E. (1987). Interstellar diamonds in meteorites. Nature 326, 160–162. doi: 10.1038/326160a0
Li, S., Huskić, I., Novendra, N., Titi, H. M., Navrotsky, A., and Frišèić, T. (2019). Mechanochemical synthesis, accelerated aging, and thermodynamic stability of the organic mineral paceite and its cadmium analogue. ACS Omega 4, 5486–5495. doi: 10.1021/acsomega.9b00295
Liu, C., Eleish, A., Hystad, G., Golden, J. J., Downs, R. T., Morrison, S. M., et al. (2018a). Analysis and visualization of vanadium mineral diversity and distribution. Am. Mineral. 103, 1080–1086. doi: 10.2138/am-2018-6274
Liu, C., Hystad, G., Golden, J. J., Hummer, D. R., Downs, R. T., Morrison, S. M., et al. (2017a). Chromium mineral ecology. Am. Mineral. 102, 612–619. doi: 10.2138/am-2017-5900
Liu, C., Knoll, A. H., and Hazen, R. M. (2017b). Geochemical and mineralogical evidence that Rodinian assembly was unique. Nat. Commun. 8:1950. doi: 10.1038/s41467-017-02095-x
Liu, C., Runyon, S. E., Knoll, A. H., and Hazen, R. T. (2018b). The same and not the same: ore geology, mineralogy and geochemistry of Rodinia assembly. Earth Sci. Rev. 196:102860. doi: 10.1016/j.earscirev.2019.05.004
Lusher, D., Koskinen, J., and Robins, G. (eds). (2012). Exponential Random Graph Models for Social Networks. Cambridge: Cambridge University Press. doi: 10.1017/CBO9780511894701
Ma, X., Hummer, D., Golden, J., Fox, P., Hazen, R., Morrison, S., et al. (2017). Using visual exploratory data analysis to facilitate collaboration and hypothesis generation in cross-disciplinary research. ISPRS Int. J. Geo Information 6:368. doi: 10.3390/ijgi6110368
Maynard-Casely, H. E., Cable, M. L., Malaska, M. J., Vu, T. H., Choukroun, M., and Hodyss, R. (2018). Prospects for mineralogy on Titan. Am. Mineral. 103, 343–349. doi: 10.2138/am-2018-6259
McCollom, T. M. (2013). Laboratory simulations of abiotic hydrocarbon formation in Earth’s deep subsurface. Rev. Mineral. Geochem. 75, 467–494. doi: 10.1515/9781501508318-017
McCord, T. B., Carlson, R. W., Smythe, W. D., Hansen, G. B., Clark, R. N., Hibbitts, C. A., et al. (1997). Organics and other molecules in the surfaces of Callisto and Ganymede. Science 278, 271–275. doi: 10.1126/science.278.5336.271
McMillan, M. M., Downs, R. T., Stein, H. J., Zimmerman, A., Beitscher, B. A., Sverjensky, D. A., et al. (2010). Molybdenite mineral evolution: a study of trace elements through time. AGU Fall Meet. Abstr. 1:2293.
Merdith, A. S., Williams, S. E., Müller, R. D., and Collins, A. S. (2017). Kinematic constraints on the Rodinia to Gondwana transition. Precambrian Res. 299, 132–150. doi: 10.1016/J.PRECAMRES.2017.07.013
Mills, S. J., Kampf, A. R., Nestola, F., Williams, P. A., Leverett, P., Hejazi, L., et al. (2017). Wampenite, C18 H16, a new organic mineral from the fossil conifer locality at Wampen, Bavaria, Germany. Eur. J. Mineral. 29, 511–515. doi: 10.1127/ejm/2017/0029-2621
Morrison, S. M., and Hazen, R. M. (2020). An evolutionary system of mineralogy, part II: Interstellar and solar nebula primary condensation mineralogy (> 4.565 Ga). Am. Mineral. doi: 10.2138/am-2020-7447
Morrison, S. M., Prabhu, A., Eleish, A., Narkar, S., Fox, P., Golden, J. J., et al. (2020). “Mineral affinity analysis: predicting unknown mineral occurrences with machine learning,” in Proceedings of the Goldschmidt Annual Meeting.
Morrison, S. M., Eleish, A., Liu, C., Hummer, D., Giovannelli, D., Meyer, M., et al. (2017a). “Network analysis applications: exploring geosphere and biosphere co-evolution with big data techniques,” in Proceedings of the Goldschmidt Annual Meeting, Paris.
Morrison, S. M., Liu, C., Eleish, A., Prabhu, A., Li, C., Ralph, J., et al. (2017b). Network analyses of mineralogical systems. Am. Mineral. 102, 1588–1596. doi: 10.2138/am-2017-6104
Morrison, S. M., Runyon, S. E., and Hazen, R. M. (2018). The paleomineralogy of the hadean eon revisited. Life 8:64. doi: 10.3390/life8040064
Müller, R. D., Cannon, J., Qin, X., Watson, R. J., Gurnis, M., Williams, S., et al. (2018). GPlates: building a virtual earth through deep time. Geochem. Geophys. Geosyst. 19, 2243–2261. doi: 10.1029/2018GC007584
Nasdala, L., and Pekov, I. V. (1993). Ravatite, C14HIO, a new organic mineral species from Ravat, Tadzhikistan. Eur. J. Miner. 5, 699–705. doi: 10.1127/ejm/5/4/0699
Newman, M. E. J. (2006). Finding community structure in networks using the eigenvectors of matrices.pdf. Phys. Rev. E 74:36104. doi: 10.1103/PhysRevE.74.036104
Newman, M. E. J., and Mark, E. J. (2010). Networks?: an Introduction. Oxford: Oxford University Press.
Oftedal, I. (1922). “Minerals from the burning coal seam at Mt. Pyramide, Spitsbergen,” in Resultater av de Norske Statsunderstottede Spitsbergenekspeditioner:UTGIT PAA Den Norske Stats Bekostning Ved Spitsbergenkomiteen 1, eds W. Werenskiold and I. Oftedal (Oslo: Det Norske Videnskaps-Akademi), 9–14.
Ott, U. (2009). Nanodiamonds in meteorites: properties and astrophysical context. J. Achiev. Mat. Manuf. Eng. 37, 779–784.
Otte, E., and Rousseau, R. (2002). Social network analysis: a powerful strategy, also for the information sciences. J. Inf. Sci. 28, 441–453. doi: 10.1177/016555150202800601
Pattison, P., Kalish, Y., and Lusher, D. (2007). An introduction to exponential random graph (p∗) models for social networks. Soc. Netw. 29, 173–191. doi: 10.1016/J.SOCNET.2006.08.002
Pekov, I. V., Chukanov, N. V., Belakovskiy, D. I., Lykova, I. S., Yapaskurt, V. O., Zubkova, N. V., et al. (2016). Tinnunculite, IMA 2015-021a. Mineral. Mag. 80, 199–205.
Perry, R. S., Mcloughlin, N., Lynne, B. Y., Sephton, M. A., Oliver, J. D., Perry, C. C., et al. (2007). Defining biominerals and organominerals: direct and indirect indicators of life. Sediment. Geol. 201, 157–179. doi: 10.1016/j.sedgeo.2007.05.014
Perry, S., Morrison, S., Runyon, S., Prabhu, A., Eleish, A., Zhong, H., et al. (2018). “Big data network analysis of uranium mineral occurrences and formation mechanisms,” in Proceedings of the International Mineralogical Association Conference (Melbourne).
Piro, O. E., and Baran, E. J. (2018). Crystal chemistry of organic minerals – salts of organic acids: the synthetic approach. Crystallogr. Rev. 24, 149–175. doi: 10.1080/0889311X.2018.1445239
Pizzarello, S., Cooper, G. W., and Flynn, G. J. (2006). The nature and distribution of the organic material in carbonaceous chondrites and interplanetary dust particles. Meteor. Early Sol. Syst. II 1, 625–651.
Prabhu, A., Morrison, S. M., Eleish, A., Zhong, H., Huang, F., Golden, J. J., et al. (2019a). Creating, Managing and Evaluating Data Legacies: Updates on the Global Earth Mineral Inventory. AGU, Abstract U11C-0.
Prabhu, A., Morrison, S. M., Eleish, A., Narkar, S., Fox, P. A., Golden, J. J., et al. (2019b). Predicting unknown mineral localities based on mineral associations. AGUFM 2019:EP23D-2286.
Prabhu, A., Morrison, S. M., Eleish, A., Zhong, H., Huang, F., Golden, J., et al. (2020). Global Earth Mineral Inventory: a deep carbon observatory data legacy. Special Issue. Geosci. Data J. doi: 10.1002/GDJ3.106
Rost, R. (1942). Supplements to the mineralogy of the burning (coal) heaps in the region of Kladno. Rozpravy II. Trídy Ces. Akad. 52, 1–4.
Sephton, M. A., and Hazen, R. M. (2013). On the origins of deep hydrocarbons. Rev. Mineral. Geochem. 75, 449–465. doi: 10.2138/rmg.2013.75.14
Sephton, M. A. (2002). Organic compounds in carbonaceous meteorites. Nat. Prod. Rep. 19, 292–311. doi: 10.1039/b103775g
Shin, K., Kumar, R., Udachin, K. A., Alavi, S., and Ripmeester, J. A. (2012). Ammonia clathrate hydrates as new solid phases for Titan, Enceladus, and other planetary systems. Proc. Natl. Acad. Sci. U.S.A. 109, 14785–14790. doi: 10.1073/pnas.1205820109
Shirey, S. B., Cartigny, P., Frost, D. J., Keshav, S., Nestola, F., Nimis, P., et al. (2013). Diamonds and the geology of mantle carbon. Rev. Mineral. Geochem. 75, 355–421.
Smith, E. M., Shirey, S. B., Nestola, F., Bullock, E. S., Wang, J., Richardson, S. H., et al. (2016). Large gem diamonds from metallic liquid in Earth’s deep mantle. Science 354, 1403–1405. doi: 10.1126/science.aal1303
Snijders, T. A. B., Pattison, P. E., Robins, G. L., and Handcock, M. S. (2006). New specifications for exponential random graph models. Sociol. Methodol. 36, 99–153. doi: 10.1111/j.1467-9531.2006.00176.x
Snjiders, T. A. B. (2002). Markov chain Monte Carlo estimation of exponential random graph models. J. Soc. Struct. 3, 1–5.
Sverjensky, D. A., and Huang, F. (2015). Diamond formation due to a pH drop during fluid–rock interactions. Nat. Commun. 6:8702. doi: 10.1038/ncomms9702
Wang, P., Robins, G., Pattison, P., and Lazega, E. (2013). Exponential random graph models for multilevel networks. Soc. Netw. 35, 96–115. doi: 10.1016/J.SOCNET.2013.01.004
Webster, C. R., Mahaffy, P. R., Atreya, S. K., Flesch, G. J., Mischna, M. A., Meslin, P.-Y., et al. (2015). mars atmosphere. mars methane detection and variability at Gale crater. Science 347, 415–417. doi: 10.1126/science.1261713
Webster, C. R., Mahaffy, P. R., Atreya, S. K., Moores, J. E., Flesch, G. J., Malespin, C., et al. (2018). Background levels of methane in Mars’ atmosphere show strong seasonal variations. Science 360, 1093–1096. doi: 10.1126/science.aaq0131
Witzke, T., de Wit, F., Kolitsch, U., Blass, G., Stracher, G. B., Prakash, A., et al. (2015). Mineralogy of the burning Anna I coal mine dump, Alsdorf, Germany. Coal Peat Fires Glob. Perspect. 3, 203–240. doi: 10.1016/b978-0-444-59509-6.00007-7
Young, A., Flament, N., Maloney, K., Williams, S., Matthews, K., Zahirovic, S., et al. (2019). Global kinematics of tectonic plates and subduction zones since the late Paleozoic Era. Geosci. Front. 10, 989–1013. doi: 10.1016/J.GSF.2018.05.011
Zalasiewicz, J., Kryza, R., and Williams, M. (2014). The mineral signature of the Anthropocene in its deep-time context. Geol. Soc. London Spec. Publ. 395, 109–117. doi: 10.1144/sp395.2
Zhang, S., Morrison, S. M., Prabhu, A., Ma, C., Huang, F., Gregory, D., et al. (2019). Natural clustering of pyrite with implications for its formational environment. AGUFM 2019:EP23D-2284.
Zinner, E., Ming, T., and Anders, E. (1987). Large isotopic anomalies of Si, C, N and noble gases in interstellar silicon carbide from the Murray meteorite. Nature 330, 730–732. doi: 10.1038/330730a0
Keywords: carbon, mineral evolution, mineral ecology, network analysis, carbon minerals
Citation: Morrison SM, Buongiorno J, Downs RT, Eleish A, Fox P, Giovannelli D, Golden JJ, Hummer DR, Hystad G, Kellogg LH, Kreylos O, Krivovichev SV, Liu C, Merdith A, Prabhu A, Ralph J, Runyon SE, Zahirovic S and Hazen RM (2020) Exploring Carbon Mineral Systems: Recent Advances in C Mineral Evolution, Mineral Ecology, and Network Analysis. Front. Earth Sci. 8:208. doi: 10.3389/feart.2020.00208
Received: 30 June 2019; Accepted: 19 May 2020;
Published: 27 August 2020.
Edited by:
Carmen Sanchez-Valle, University of Münster, GermanyReviewed by:
Sasha Wilson, University of Alberta, CanadaFabrice Brunet, UMR 5275 Institut des Sciences de la Terre (ISTERRE), France
Copyright © 2020 Morrison, Buongiorno, Downs, Eleish, Fox, Giovannelli, Golden, Hummer, Hystad, Kellogg, Kreylos, Krivovichev, Liu, Merdith, Prabhu, Ralph, Runyon, Zahirovic and Hazen. This is an open-access article distributed under the terms of the Creative Commons Attribution License (CC BY). The use, distribution or reproduction in other forums is permitted, provided the original author(s) and the copyright owner(s) are credited and that the original publication in this journal is cited, in accordance with accepted academic practice. No use, distribution or reproduction is permitted which does not comply with these terms.
*Correspondence: Shaunna M. Morrison, c21vcnJpc29uQGNhcm5lZ2llc2NpZW5jZS5lZHU=; Donato Giovannelli, ZG9uYXRvLmdpb3Zhbm5lbGxpQGdtYWlsLmNvbQ==