 Rémy Bossu1,2*
 Laure Fallou1
 Matthieu Landès1Fréderic Roussel1Sylvain Julien-Laferrière1
 Julien Roch1
 Robert Steed1
- 1European-Mediterranean Seismological Centre, Arpajon, France
- 2CEA, DAM, DIF, Arpajon, France
The use of the LastQuake information system, its app, the associated Twitter account, and, to a lesser extent, the EMSC’s websites have been analyzed for the 7 days following the November 26, 2019, M6.4 Albania destructive earthquake to evaluate what can be improved and how crowdsourcing of information and monitoring of both use and absence of use of the app can contribute to rapid situational awareness. The mainshock and its numerous felt aftershocks triggered a strong public desire for information, which in turn led to rapid and massive adoption of the LastQuake app by up to 5% of the country’s population. The constant flow of new app users created a stress test of the app’s crowdsourcing features and led to errors in the association of felt reports with their appropriate earthquake. However, these errors had no identifiable impact, supporting the conclusion that the curation mechanisms currently in place are efficient. The rapid succession of felt aftershocks contributed to these errors by making information related to the mainshock difficult to access within hours of its occurrence, especially for new users who were not attuned to the app, since more recent events pushed older ones down the timeline of presented information. This revealed that prioritization of information within the app layout was lacking and must be an important design objective, especially during aftershock sequences. LastQuake has been shown to be a powerful tool for rapid situational awareness. The possibility of damage was detected within 8 min of the mainshock earthquake by a lack of LastQuake app activity close to the epicenter. This possibility was then gradually strengthened as new data became available and was finally confirmed by the reception of the first geo-located pictures of structural damage and building collapse within 60–70 min. Direct exchanges on Twitter were appreciated by eyewitnesses and seemed to help to reduce their anxiety in some cases (based on the personal reports). Questions mainly focused on the possible evolution of the seismicity. Attempts to debunk prediction claims were difficult. We report on how this could be eased and possibly made more efficient by sharing among the different actors a clear, concise, pre-prepared statement in the local language, that explains the state of scientific knowledge and the difference between prediction, early warning, or forecasts.
Introduction
In 1999, the United States Geological Survey (USGS) developed the “Did You Feel It?” (DYFI) online system to collect felt reports from earthquake eyewitnesses in a standardized manner and to process them automatically (Wald et al., 1999a). It replaced paper questionnaires distributed after earthquakes to collect information about their effects. Such eyewitness reports have always been part of seismology. Preinstrumental earthquakes are primarily—and often exclusively—documented through written evidence (e.g., newspaper clippings, parish bulletin…), this evidence being used by scientists to determine location and magnitude and to extend the historical reach of catalogs for seismic hazard studies (e.g., Musson, 1986). The scientific value of felt reports did not stop with the development of monitoring networks and goes beyond linking past and present earthquake observations. Site effects can be inferred from analysis of historical macroseismic data, which are known to be somewhat subjective and incomplete (e.g., Bossu et al., 2000; Hough and Bilham, 2008). Based on 20 years of DYFI experience, and despite their intrinsic variability, Quitoriano and Wald (2020) list how felt reports contribute to earthquake response and science, from improving Shakemap (Wald et al., 1999b), to social science and behavior studies.
In terms of response, the integration of DYFI data in Shakemap improves shaking estimates, which in turn improves the rapid assessment of the earthquake’s impact (Quitoriano and Wald, 2020). In some cases, even an individual eyewitness’s observation, a geo-located picture, or a written statement on social media can significantly reduce impact scenario uncertainties by excluding, for example, the possibility of major widespread damage in a specific city (Bossu et al., 2016). Fast crowdsourcing of larger volume of eyewitnesses’ observations can then enhance rapid situational awareness and, as such, is a significant development for operational seismology.
Social media and the ubiquity of smartphones have opened new opportunities for fast crowdsourcing and also changed public earthquake communication by allowing instant two-way communication between affected people and institutions/authorities (e.g., Simon et al., 2015; Petersen et al., 2017). This is the basis of the LastQuake multichannel information system, which on the one hand offers rapid earthquake information as well as safety tips to inform and engage with eyewitnesses, and on the other hand crowdsources their observations (felt reports, geo-located pictures, comments) for improved situation awareness and ingestion in new earthquake products (Bossu et al., 2018b).
This article analyzes the use of the LastQuake rapid earthquake information multichannel tools (Bossu et al., 2018b) in the few hours before and up to 7 days after the M 6.4 earthquake, which killed 51 people in the night of November 26, 2019, in Albania, and damaged many buildings in the cities of Durres and Thumane along the Adriatic coast. The aim of this study is two-fold. First, the paper studies whether the LastQuake system correctly addresses the public’s need for information. Second, the paper considers what improvements are required for the system to work more optimally during time periods that include foreshocks, a destructive mainshock, an energetic aftershock sequence, and rumors predicting a forthcoming large shock. This is an iterative process that has been carried out after previous large earthquakes, such as Nepal, 2015, Mayotte (France), Lombok, and Palu (Indonesia), 2018 earthquakes (Bossu et al., 2015, 2019a). This article further illustrates how situational awareness can be raised within the first hour through crowdsourcing. It also highlights differences in use of LastQuake app for damaging and non-damaging shaking levels.
Our analysis of the efficacy of the LastQuake system has been derived from qualitative analysis of exchanges on the @LastQuake Twitter timeline and from information collected through the LastQuake smartphone app. Although this reveals only a partial picture, we still believe that there are important lessons here to be learned for the scientific community and for emergency managers in order to exploit the potential of social media for reducing anxiety levels in the population and for seismologists to be better prepared for the recurrent tricky questions that arise about future seismic activity after a damaging earthquake (e.g., Lamontagne and Flynn, 2014; Wein et al., 2016).
After a presentation of the LastQuake system, the studied earthquake sequence, and its background, the LastQuake app adoption and its crowdsourcing performances are analyzed in the context of this destructive earthquake as well as its benefits in terms of improving rapid impact assessments. Strengths and weaknesses of rapid communication disseminated through both the app and Twitter feed are also identified via feedback from its audience before a discussion on a specific earthquake prediction hoax and the possible ways for the seismological community to limit the impact of such rumors in the future.
Materials and Methods
This study is based on data collected through the LastQuake information system following the M 6.4 earthquake that struck Albania on November 26, 2019. This data includes LastQuake app launches, crowdsourced felt reports, open comments, and geo-located pictures as well as message exchanges on the @LastQuake Twitter account.
The LastQuake Multichannel Earthquake Information System
LastQuake is a multichannel automatic earthquake information system (for a general presentation, see Bossu et al., 2018b) including a Twitter quakebot, websites (one for desktops and one for mobile devices) and a smartphone app targeting global earthquake eyewitnesses. It is operated by the European Mediterranean Seismological Center (EMSC). It aims to provide rapid earthquake information, engage with eyewitnesses, and initiate crowdsourcing of felt reports (i.e., reports describing shaking and/or damage level), open comments, and geo-located pictures and videos. In turn, crowdsourced information is merged together to create new information products that bring valuable constraints to rapid impact scenarios (Bossu et al., 2016). Crowdsourced data is integrated with other sources of information under the ARISTOTLE project, contributing to rapid (3 h) situation reports for the 24/7 Emergency Response Coordination Center (ERCC) unit of the European Union (EU) Civil Protection Mechanism who coordinates the delivery of assistance to disaster-stricken countries. The ERCC also makes these situation reports available to EU national civil protection agencies (Michelini et al., 2017).
LastQuake utilizes visual communication to erase language and literacy hurdles: felt reports are collected through a set of cartoons describing different shaking and damage levels, each cartoon representing an intensity level of the European Macroseismic Scale 1998 (Grünthal, 1998; Figure 1). This approach has been validated by comparing it with the USGS’s DYFI macroseismic questionnaire system as well as with independently and manually derived macroseismic datasets (Bossu et al., 2017). Note that felt reports corresponding to intensity 11 and 12 are considered as unreliable and excluded from analyses. Cartoons are also used to offer guidance through safety tips after strong shaking or during a tsunami threat (Fallou et al., 2019). LastQuake is the only information system providing information for only felt earthquakes, regardless of their magnitude. Felt earthquakes are automatically identified through what is called “crowdsourced earthquake detections,” which detect eyewitnesses’ information-seeking behaviors through their digital footprint immediately after shaking (Bossu et al., 2018b). Three independent sources of crowdsourced detections are in operation, based on rapid changes, respectively, in the number of users accessing EMSC websites (Bossu et al., 2012), of tweets (messages posted on the microblogging Twitter site) containing the keyword “earthquake” in various languages (Earle et al., 2012), and of users launching the LastQuake app (Bossu et al., 2019b). They are complementary with more than two-thirds of felt earthquakes being identified only by a single method, they are fast with detections typically within 20 to 90 s of earthquake occurrence, and they generally precede seismic detections. Crowdsourced detections are published as a rolling banner on websites, as an automatic tweet and on the LastQuake app (without notification). Users are informed about the possibility of a felt earthquake in a given region, and eyewitnesses are invited to confirm the existence of the shaking by providing felt reports (Figure 1). When the earthquake responsible has been seismically located, it is associated with related crowdsourced detections, which occurs typically within a few to 20 min depending on earthquake location and magnitude.
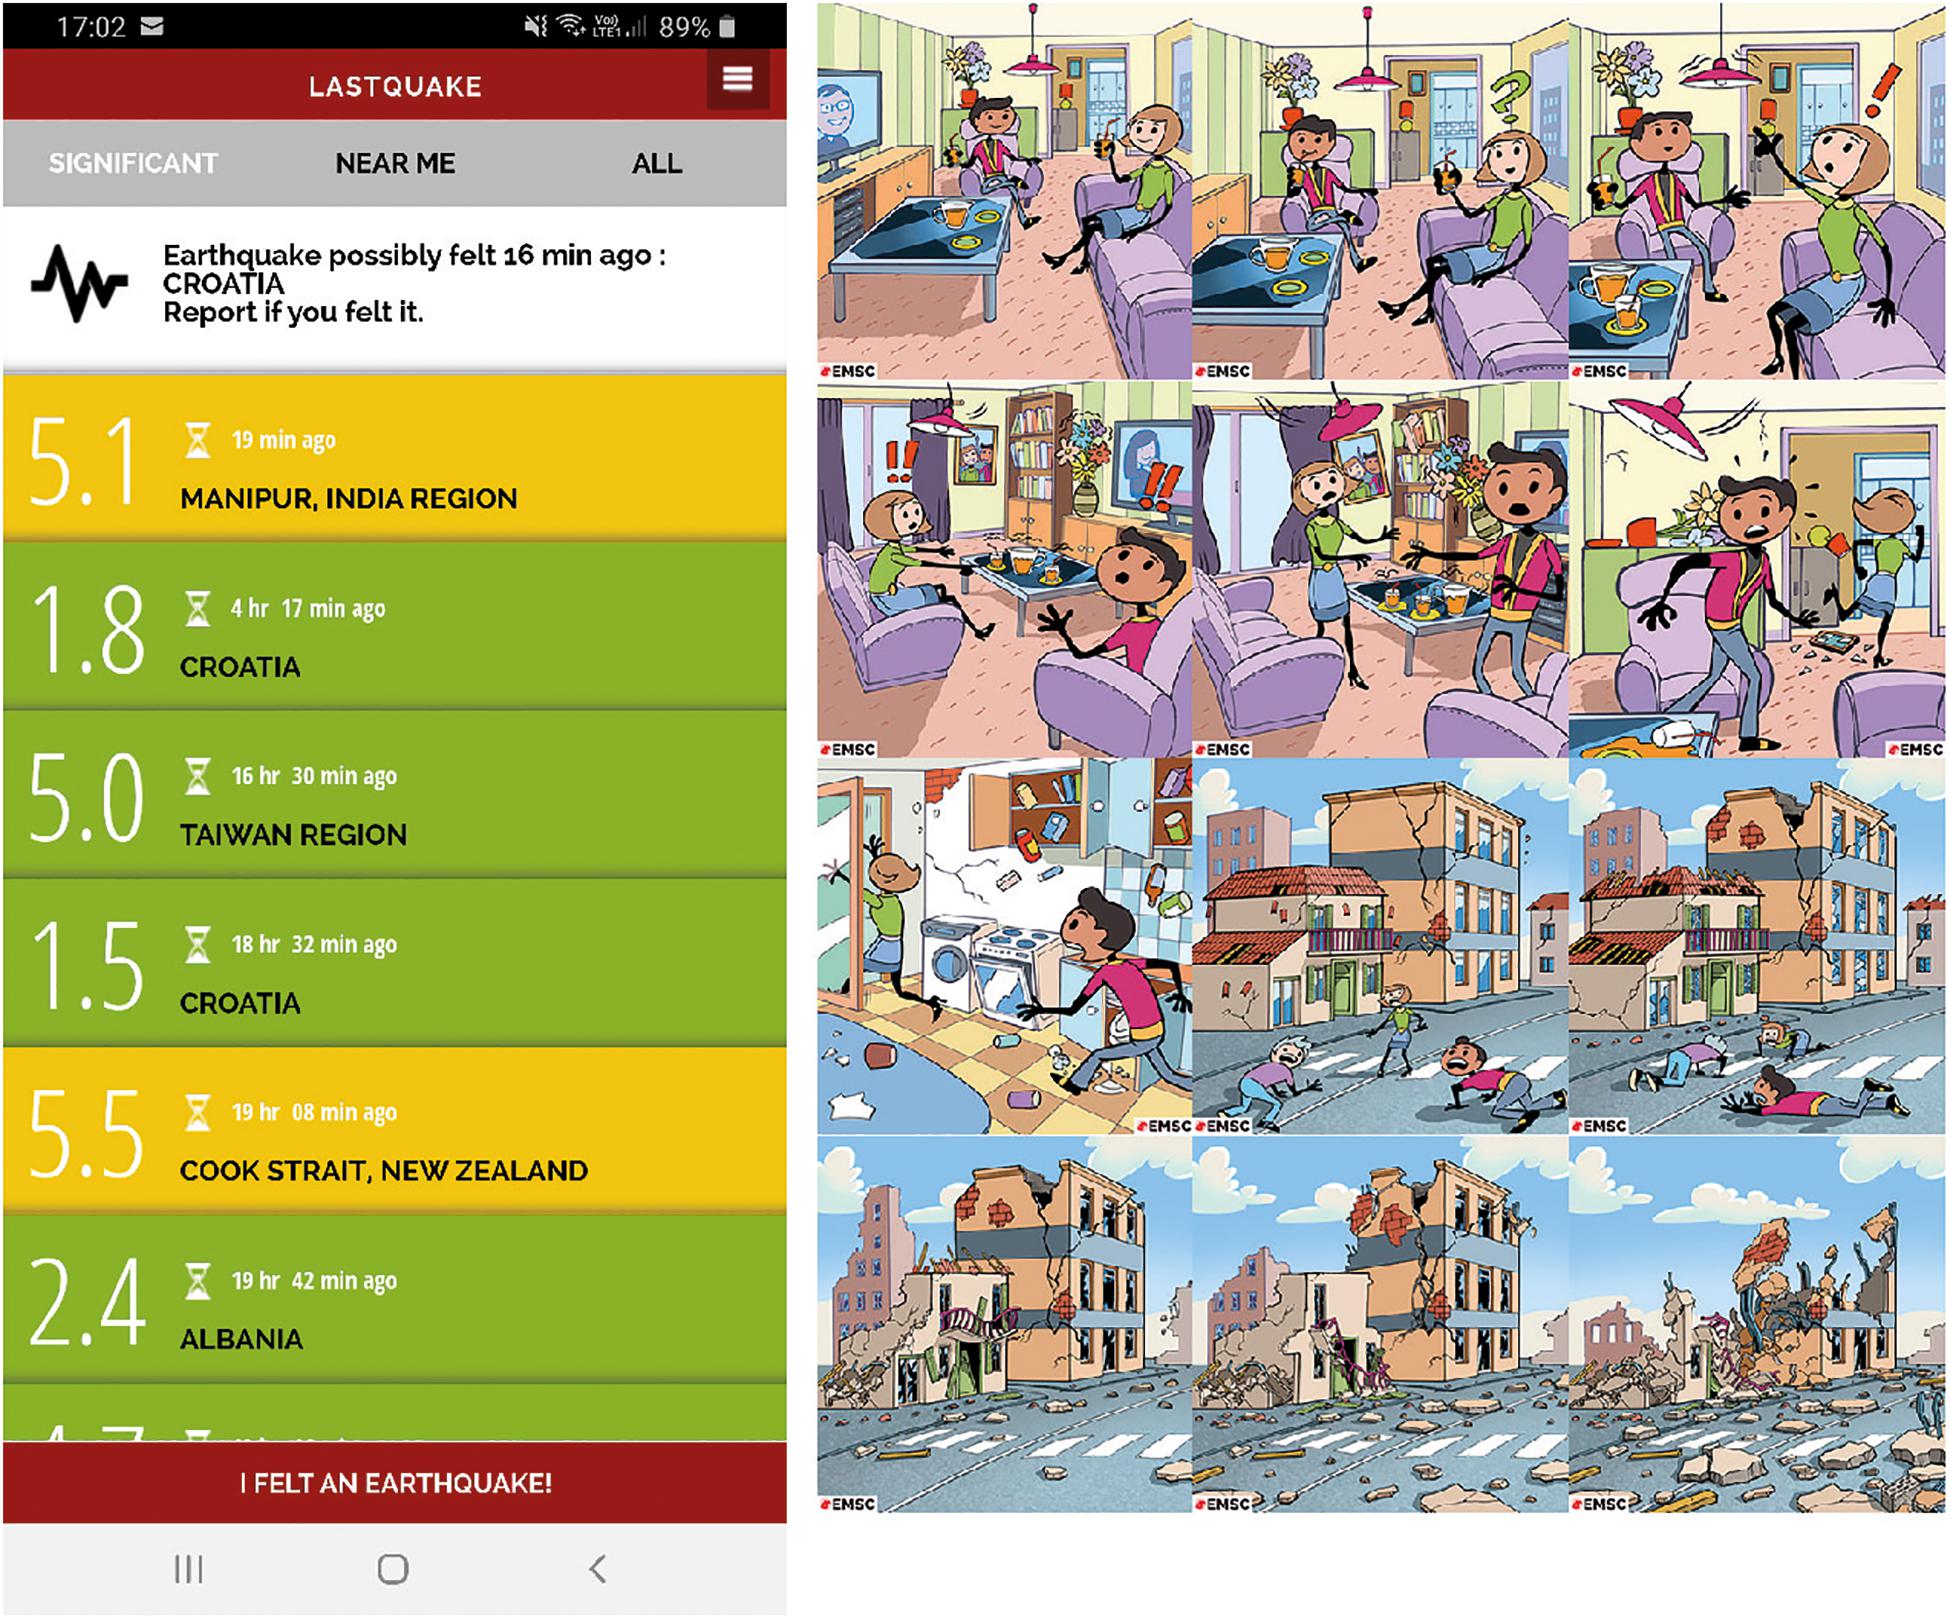
Figure 1. The LastQuake app screen (left) contains the latest felt earthquakes with colors from green to red representing different expected impact (from felt by a limited number of persons to heavily damaging earthquake) and crowdsourced detections (white) not yet confirmed by a seismic location. Felt reports are collected by choosing one of the 12 cartoons (right) presenting different shaking and damage levels. There are two ways for a LastQuake app user to report a felt experience, either by clicking first on the causal event (earthquake or crowdsourced detections) and then accessing the cartoons, or by accessing cartoons directly by clicking on “I felt an earthquake” section of the landing page (left). In the first case, the association between felt reports is performed by the user, while in the second one, it is the EMSC team that will try to perform a posteriori this association using a simple magnitude-distance relationship.
The principal objective of the @LastQuake Twitter quakebot is to automatically share rapid earthquake information with its users and encourage those who felt an earthquake to turn to our websites or app to share their felt experience in a structured manner. Structured data collection is essential for automatic processing, for quality checks, and for ingestion into other data products.
For a non-damaging-felt earthquake, there are typically seven automatic tweets published by LastQuake: the first published tweet concerns the crowdsourced detection, then follows the preliminary seismic magnitude and map, the preliminary felt report map (see an example in Figure 5), a link to the comments, then a revised seismic magnitude and map, revised felt reports map, and finally, 45 min after the earthquake occurrence, an estimate of the number people who felt the shaking. However, the number of automatically published tweets can increase up to 20 in the same time frame, depending on parameters such as the severity of the earthquake, whether it has been preceded by another shock during the previous days, the existence of a tsunami threat, the volume of crowdsourced data, or whether earthquake parameters (magnitude and/or location) had to be revised. For example, earthquake safety tips are published in the case of a potentially damaging shaking level and tsunami safety tips in the case of a tsunami threat (Fallou et al., 2019).
Alongside automatic tweets, we answer questions left on our Twitter feed and publish and retweet key information related to the earthquake (e.g., scientific information, information on its impact…). We also answer remarks and questions on the app stores. We do not answer questions that may appear in the open comments visible on the app and websites. In early September 2019, there were 440,000 LastQuake app users (2,800 in Albania), and the @LastQuake Twitter feed had 109,000 followers.
M 6.4 Earthquake on November 26, 2019
On November 26, 2019, at 03:54 local time, a M 6.4 earthquake occurred a few kilometers north of the port city of Durres (Albania) killing 51 people and injuring 600 others. Several buildings collapsed in the cities of Durres and Thumane, and many were damaged as well as in Tirana, the capital city 30 km from the epicenter1. The death toll was probably limited thanks to five felt foreshocks, especially a M 4.4, and a M 3.1, which occurred, respectively, 67 and 35 min before the mainshock, leading many people to leave their buildings before the mainshock (Figure 2).
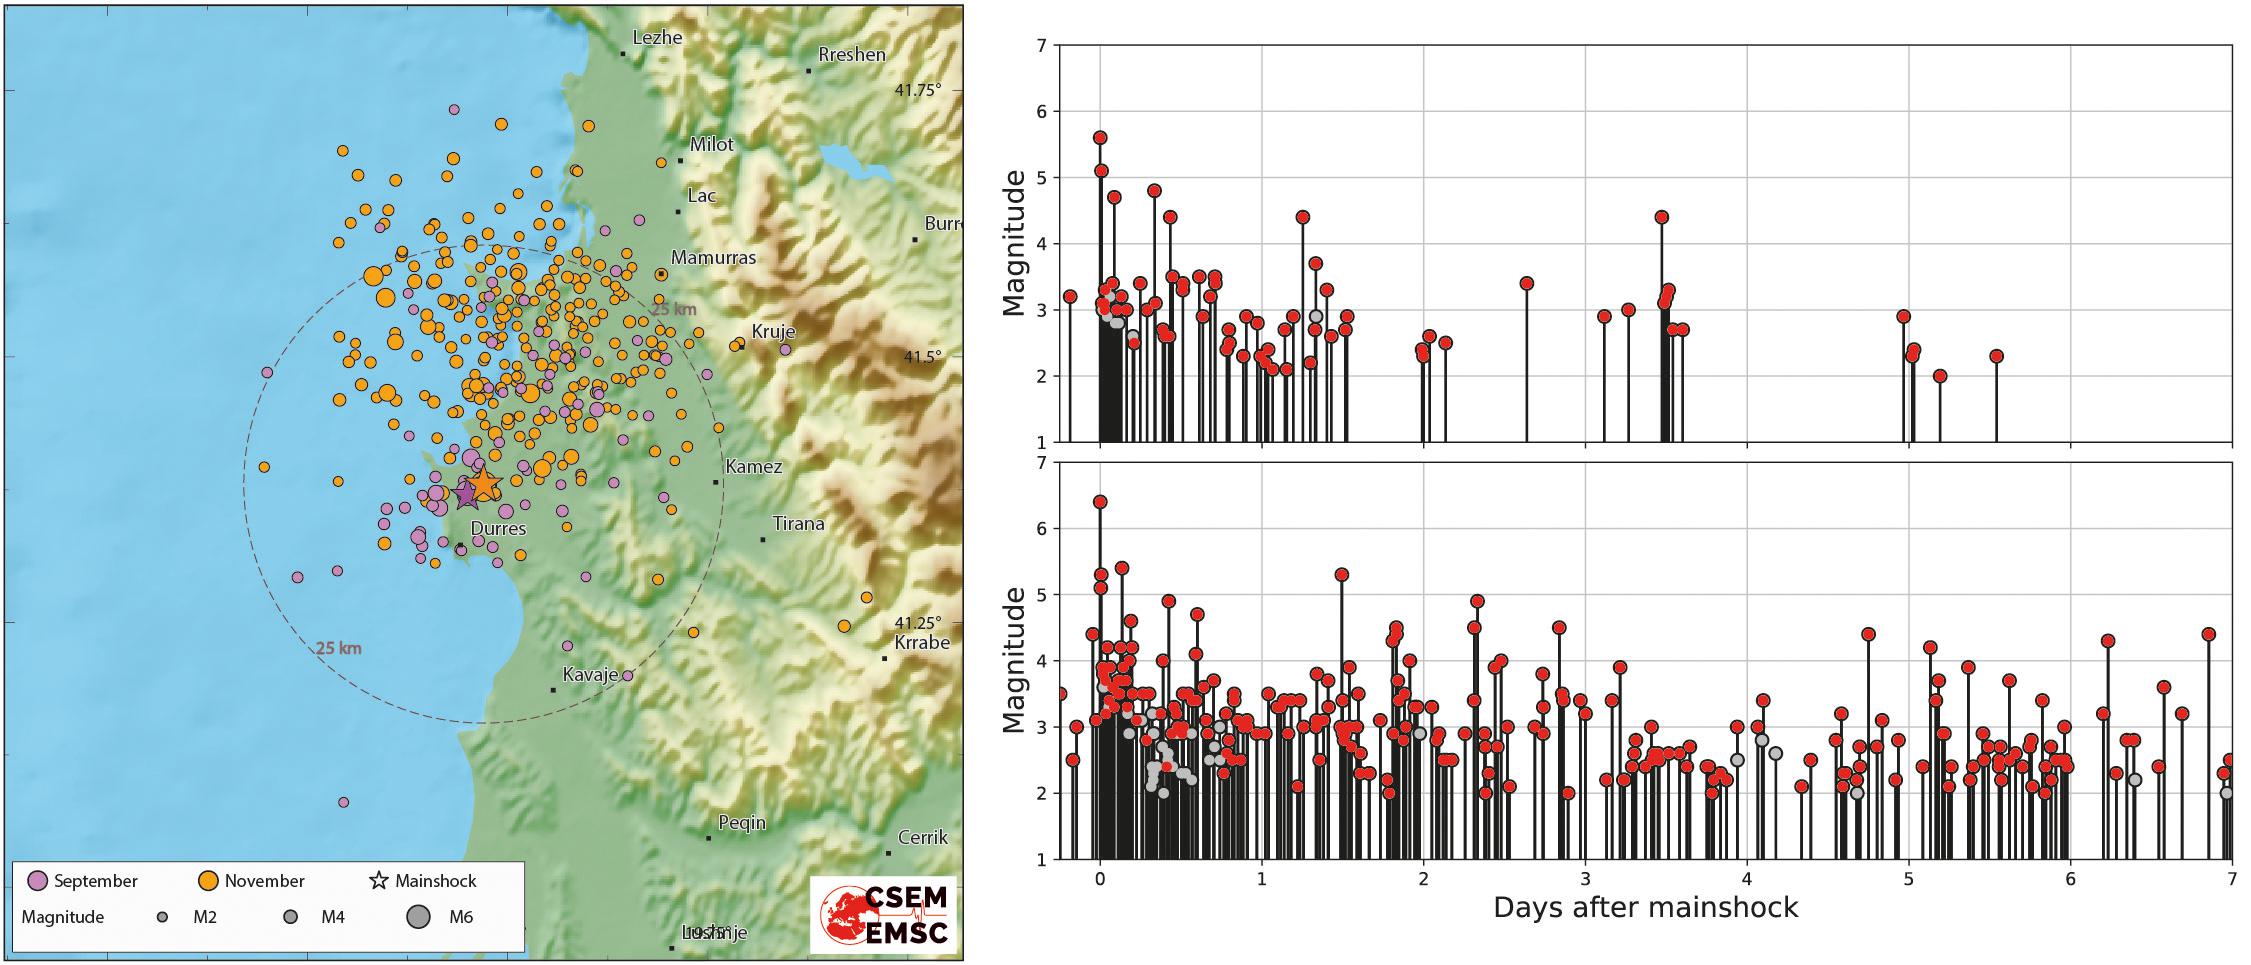
Figure 2. Seismicity map for Albania immediately before and after the September 21, 2019, M 5.6 shock (purple) and November 26, 2019, M 6.4 earthquake (orange) (Left); time evolution of this seismicity before and after the September 21, 2019, M 5.6 shock (Right); and November 26, 2019, M 6.4 earthquake (Right, bottom). For the sake of comparison, figures share the time duration, starting 6 h before the respective mainshock and ending 7 days (168 h) after. Earthquakes in red are the ones known to have been felt, that is, for which felt reports were crowdsourced. Only earthquakes within 100 km of M 6.4 earthquake are shown. Both aftershock sequences were energetic with six aftershocks greater than M 4 for the September 21 M 5.6 event and four aftershocks greater than M 5 for the November 26 M 6.4 event. There were 77 and 271 aftershocks recorded, among them 68 and 234 were reported as felt, respectively.
The same region had already been shaken by an earthquake 2 month before. On September 21, 2019, at 16:04 local time, a M 5.6 event whose epicenter was within a few kilometers of the M 6.4 mainshock (i.e., within location uncertainties) damaged about 500 buildings, causing no recorded fatalities. As in November, the September M 5.6 earthquake was also preceded 127 min before by a M 3.2 felt foreshock (Figure 2). Both September M 5.6 and November M 6.4 were felt throughout the whole country. In both cases, the majority of the seismically recorded aftershocks—down to M 2—were felt by locals according to the felt reports collected by EMSC. Even those earthquakes considered as not felt in these two sequences were close in time with other events (Figure 2), and we believe that when aftershocks follow each other within minutes, eyewitnesses may have difficulties selecting the causing earthquake and may tend to choose the event presenting the larger magnitude. In other words, one cannot exclude that some of the aftershocks labeled as not-felt may have indeed been felt. However, this does not affect the results of this study.
Results
Number of LastQuake App Users and Efficiency of Felt Report Crowdsourcing
As observed in other regions of the world, the main driver for LastQuake app installation is widely felt earthquakes, especially rapid successions of felt earthquakes (Bossu et al., 2015). In Albania, the number of users rose from 2,800 to 25,000 in September and exceeded 146,000 7 days after the M 6.4 November earthquake for a population of about 2.8 million inhabitants, i.e., 5% of the population and an average density of 5/km2 (Figure 3).
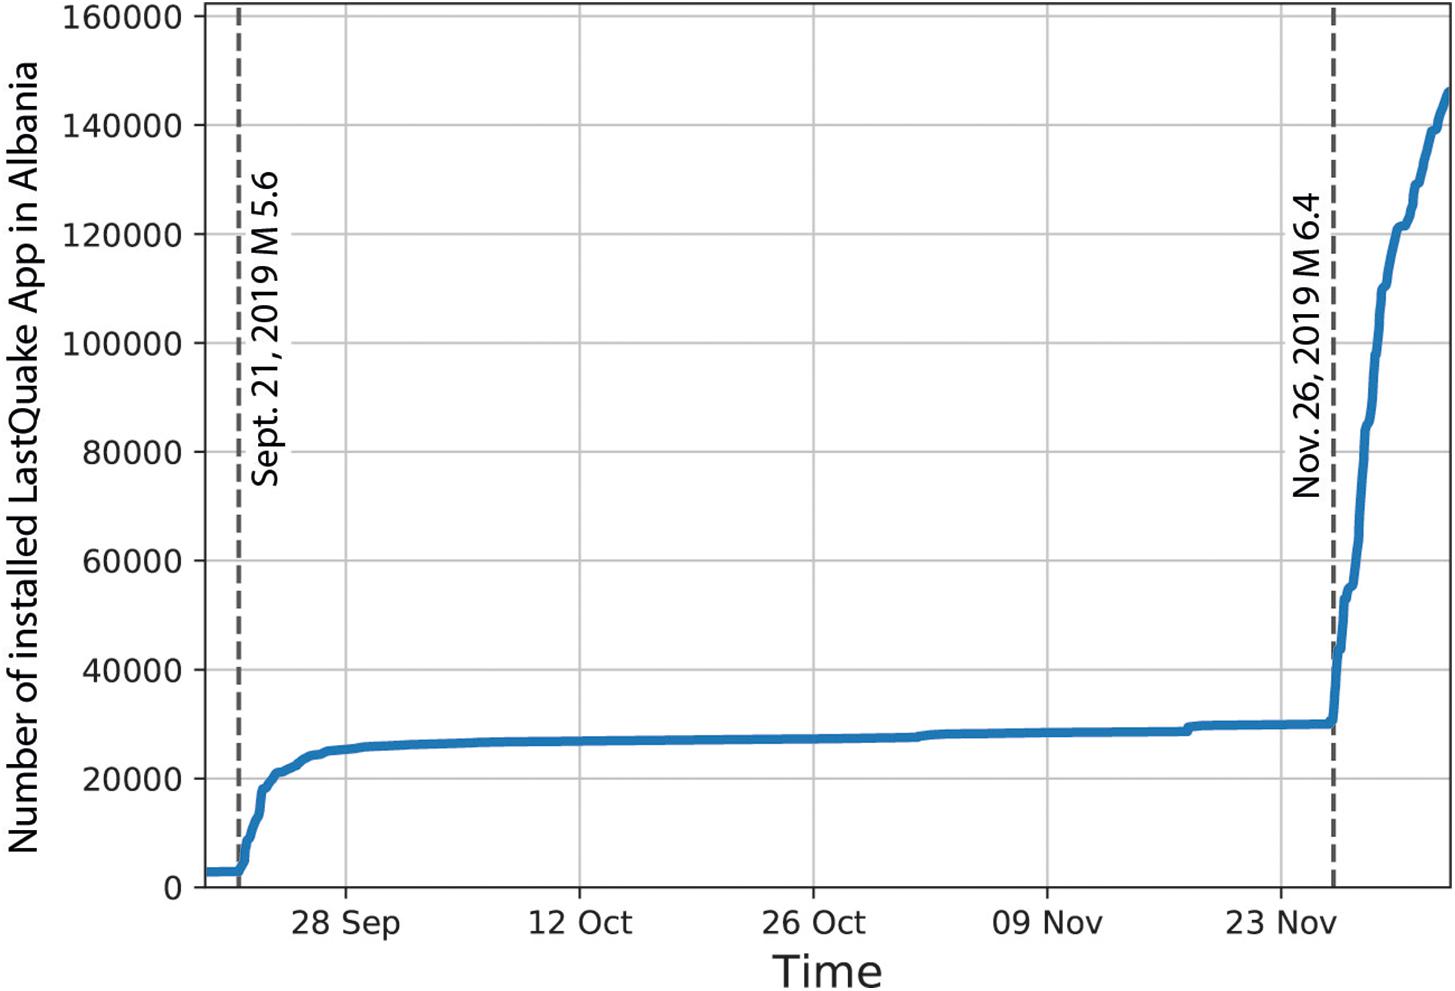
Figure 3. Time evolution of the number of LastQuake app users geo-located in Albania. This estimate contains users who installed the app corrected by the ones known to have deleted it at the time of the estimate. Felt earthquakes led to rapid LastQuake app installations.
People adopt the LastQuake app to get rapid earthquake information. The way they use it is then informative of their information-seeking behaviors. As usual, one can see that large spikes in the rate of app launches correlate with widely felt earthquakes (Figure 4). The mainshock was thus detected through the surge in app launches it generated in 73 s. Still, the app launch rate remained high during the daytime, even in the absence of felt earthquakes (Figure 4). This indicates that during an aftershock sequence, information-seeking periods are not limited to the immediate follow-up of a tremor but that a significant proportion of users are repeatedly checking for updates, possibly reflecting a high emotional state, a behavior that has been reported on Twitter (see Figure 4). For example, the 5% most-active Albanian users launched the app more than 46 times during the studied period.
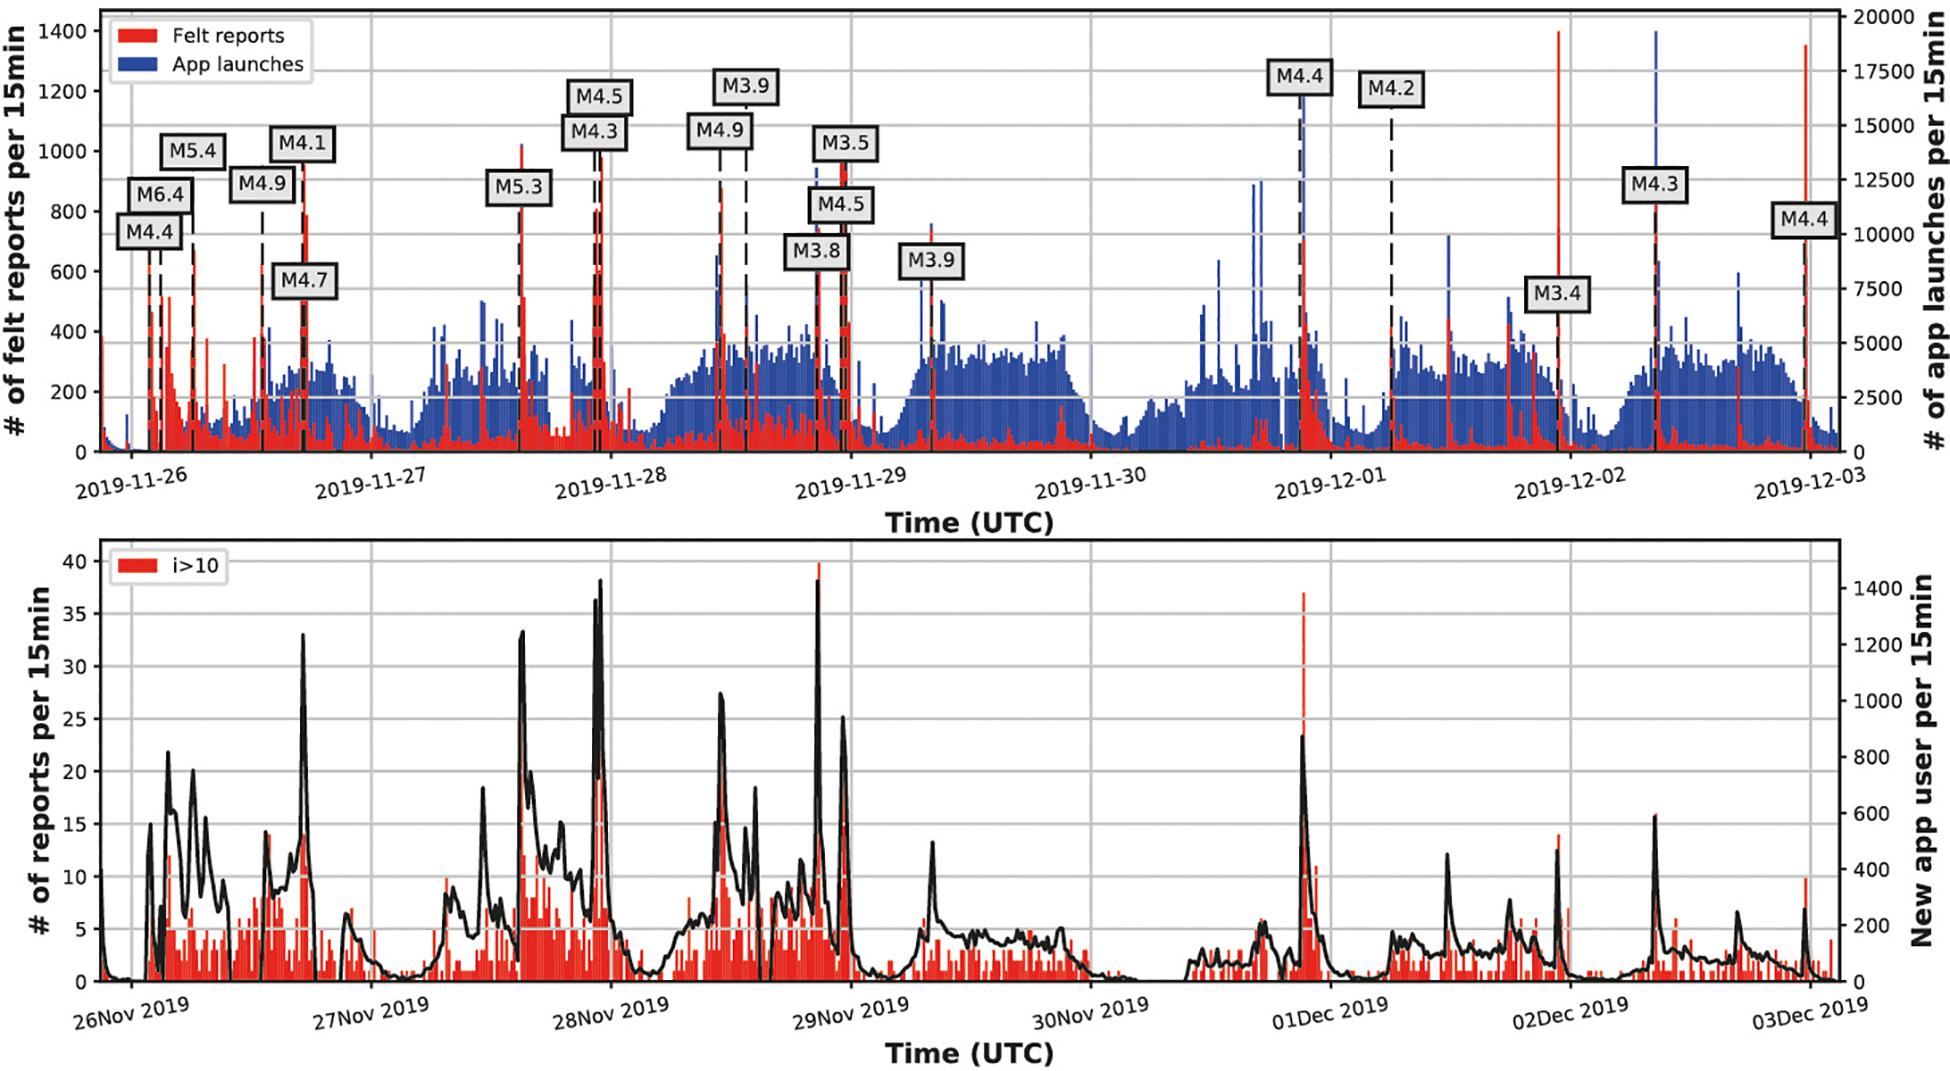
Figure 4. Top: Time variations of individual app launches (blue) and felt report collection (red) within 150 km of the mainshock. The 2.3 M app launches exhibited a strong day/night variation over the whole sequence, showing significant information seeking behaviors even in the absence of felt earthquakes. Some app launch peaks like on November 30 are not correlated with located earthquakes or a surge in felt report collection; Bottom: time variations of collected intensities 11 and 12 (red) and LastQuake app installations (black) (below) in 15-min windows during the M 6.4 Albania November period. The strong correlation between the number of intensities 11 and 12 reports and the number of new users suggests that these unrealistically high-intensity values are mainly caused by new users testing the app.
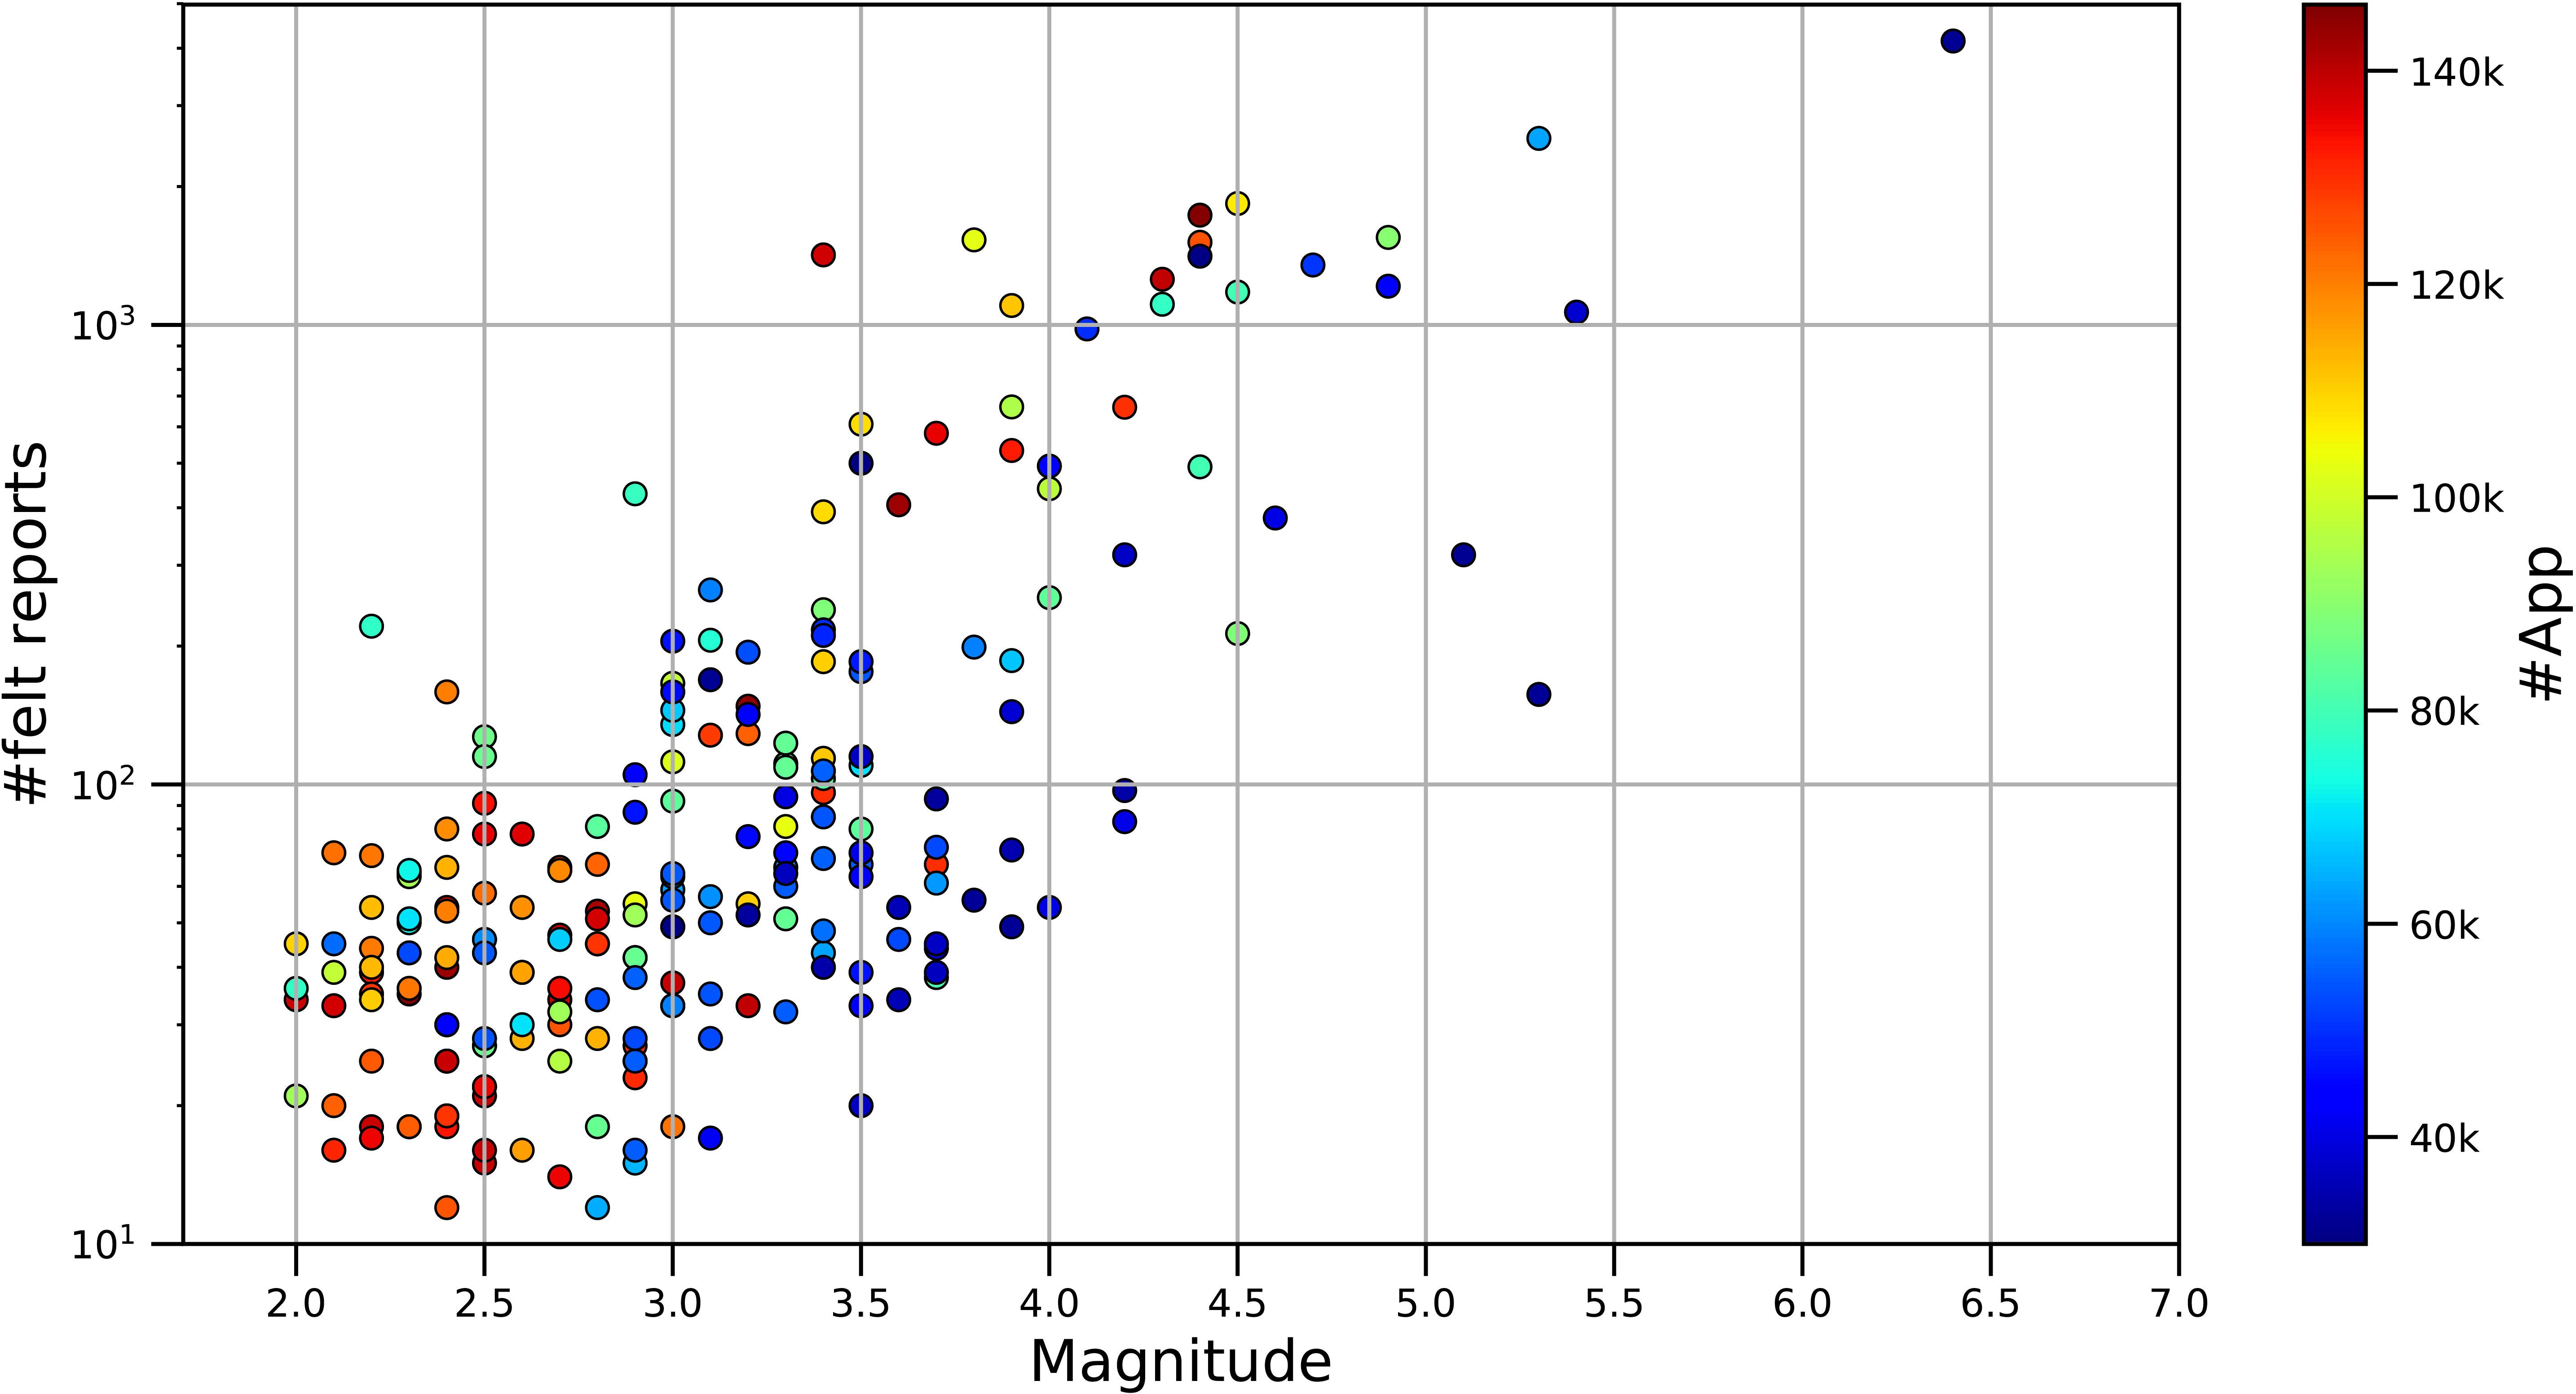
Figure 5. Number of collected felt reports per earthquake as a function of their magnitude for the 228 felt earthquakes of the November 26 studied period (see Figure 1) with at least 10 felt reports. The number of LastQuake app users in Albania at the time of each earthquake occurrence is shown via marker color. For a given magnitude greater than three, overall, the larger the number of app users, the larger the number of collected reports. For the earthquakes below magnitude three, felt reports were mainly collected when the number of users was large, reflecting the increasing sensitivity of the crowdsourcing system with growth in the number of app users.
The LastQuake app is the main crowdsourcing tool of the LastQuake system (Bossu et al., 2015, 2018b), and the number of app users greatly influences both the number of collected felt reports and the sensitivity of felt earthquake identification: the higher the density of app users, the more likely a small magnitude weakly felt earthquake will be reported. In the November period, there were 58,125 collected felt reports within 150 km of the M 6.4 epicenter. For comparison, in the same area, 15,780 were collected in the September period. Intensity in this area was greater than 4 for the former and greater than 3 for the latter. In the period in November, despite our services being inaccessible due to high traffic for 5 h—and very slow after several widely felt aftershocks—there was an average collection of about 6/min. The maximum collection rate was observed for a M 3.4 aftershock on December 1 at 180/min, while it was only 100/min for the mainshock (Figure 4), illustrating the impact of the growing number of users (Figure 5).
Increasing the number of app users not only impacted the rate of collection but also the volume of crowdsourced data per earthquake. For earthquakes of similar-and-greater-than-3 magnitude, the number of felt reports increased with the number of app users, while for lower-magnitude earthquakes, felt reports were mainly collected once the number of app users exceeded 100,000, illustrating the correlation of the sensitivity of the crowdsourcing system to the density of users (Figure 5).
The rate of unassociated felt reports of 22% (12,749) in the November time period is high compared to the 12% (1,825) of the September period. A large number of new app users in conjunction with an energetic aftershock sequence where felt events were sometimes within minutes of each other (Figures 2, 3) probably caused some difficulties and errors in the association of individual felt reports to the causative earthquake. Difficulty in report association likely was amplified by the setup of the LastQuake app, which by default displays the last 25 felt earthquakes. As a consequence of the energetic aftershock sequence, the Albanian mainshock disappeared 4 h 36 min after its occurrence from the default screen of LastQuake app. This may have left new users in a practical difficulty to associate their felt experience, since information about the mainshock was only visible by scrolling down to download older earthquakes.
Errors in report association are illustrated by the M 5.4 earthquake in Bosnia and Herzegovina, which happened 6 h 25 min after the Albanian mainshock (which by then had disappeared from the default screen of LastQuake app) and 250 km away. Although this earthquake was widely felt in Albania, it did not cause strong or damaging shaking in this country contrary to what was reported by some users (Figure 6). The fact that these reported damages were localized along the Durres-Thumane area of the Adriatic coast where actual damage from the Albanian mainshock occurred points to an association error rather than fake felt reports (Figure 6). We surmise that some new users may have been confused and reported their experience of the Albanian mainshock via other earthquakes (such as the Bosnian one) due, at least partly, to an inadequate prioritization of information within the LastQuake app.
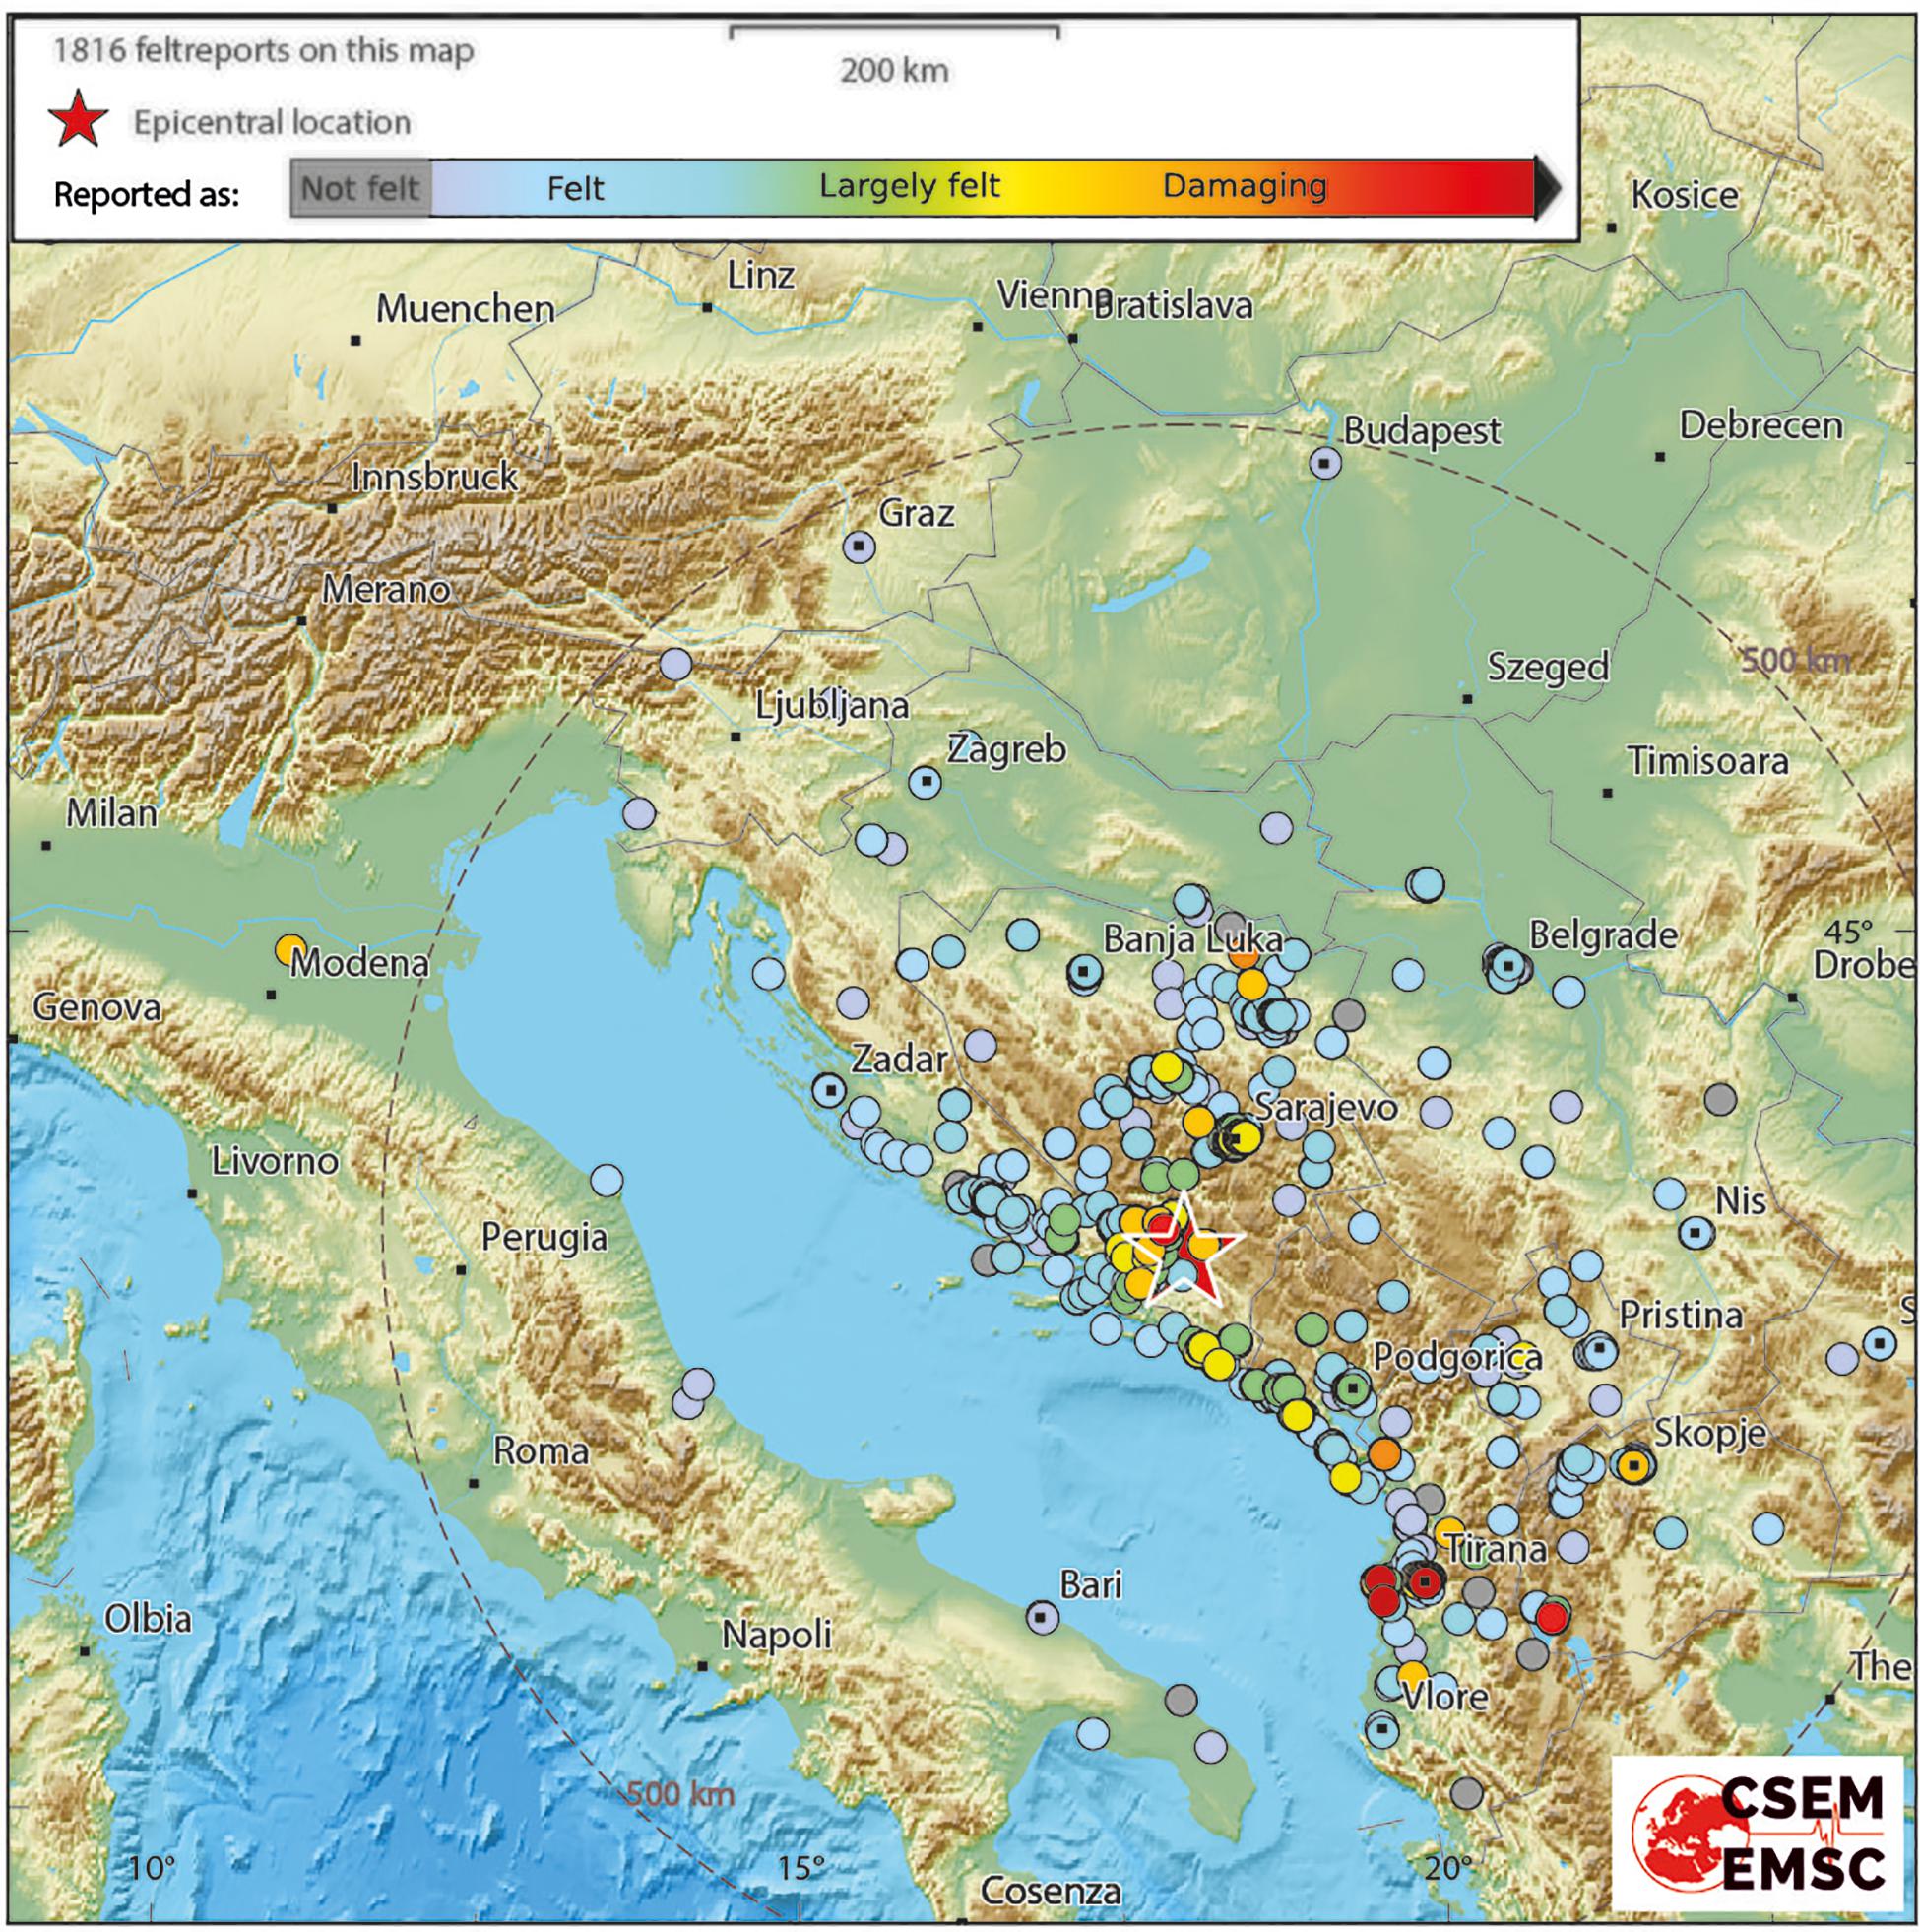
Figure 6. Individual felt reports for the M 5.4 Bosnia and Herzegovina earthquake, which happened 6 h 25 min after the Albanian mainshock. Damaging intensities (in red) are reported along the Adriatic coast where the main damage caused by the M 6.4 earthquake lies but which could not have been incurred by this earthquake. Higher intensity reports are plotted over other reports to illustrate the association issue. However, they are too few to influence the intensity vs distance curve for this earthquake (see an example Figure 9) derived from all the felt reports https://www.emsc-csem.org/Earthquake/earthquake.php?id=807844#map.
There is another indication that for new users, at least some of them, may need time and/or tests to discover the app’s functionalities and how to share their experience. This is revealed by the strong correlation between the number of new users and the number of intensities 11 and 12 collected (Figures 1, 4). As mentioned before, these intensities values are automatically excluded during data processing because crowdsourcing is highly unlikely to work under such extreme circumstances, and so they are considered to result from tests or jokes (Bossu et al., 2018a). Although some users influenced by high emotional state may have reported such values in good faith, it reaffirms that these reports are not reliable enough to be integrated in situation maps (Bossu et al., 2017).
Crowdsourced Pictures and Videos
Eyewitnesses are also invited to share geo-located pictures and videos. These are manually validated before publication to ensure that they are not related to a previous earthquake or subject to copyright (by checking their possible indexation on the internet, as well as their shooting and location dates), that effects are consistent with expected shaking level at the location, and that they are informative (e.g., a close-up of a crack is not validated) and respect human dignity. There were 1,788 collected pictures, and 361 (available on an interactive map here2) were validated and published during the November period. The first picture to be validated was submitted 44 min after the earthquake, the first one to show structural damage in 64 min and the first collapse in 77 min (Figure 7). There were 32 validated pictures within 2 h of the mainshock occurrence and more than 200 within 24 h.
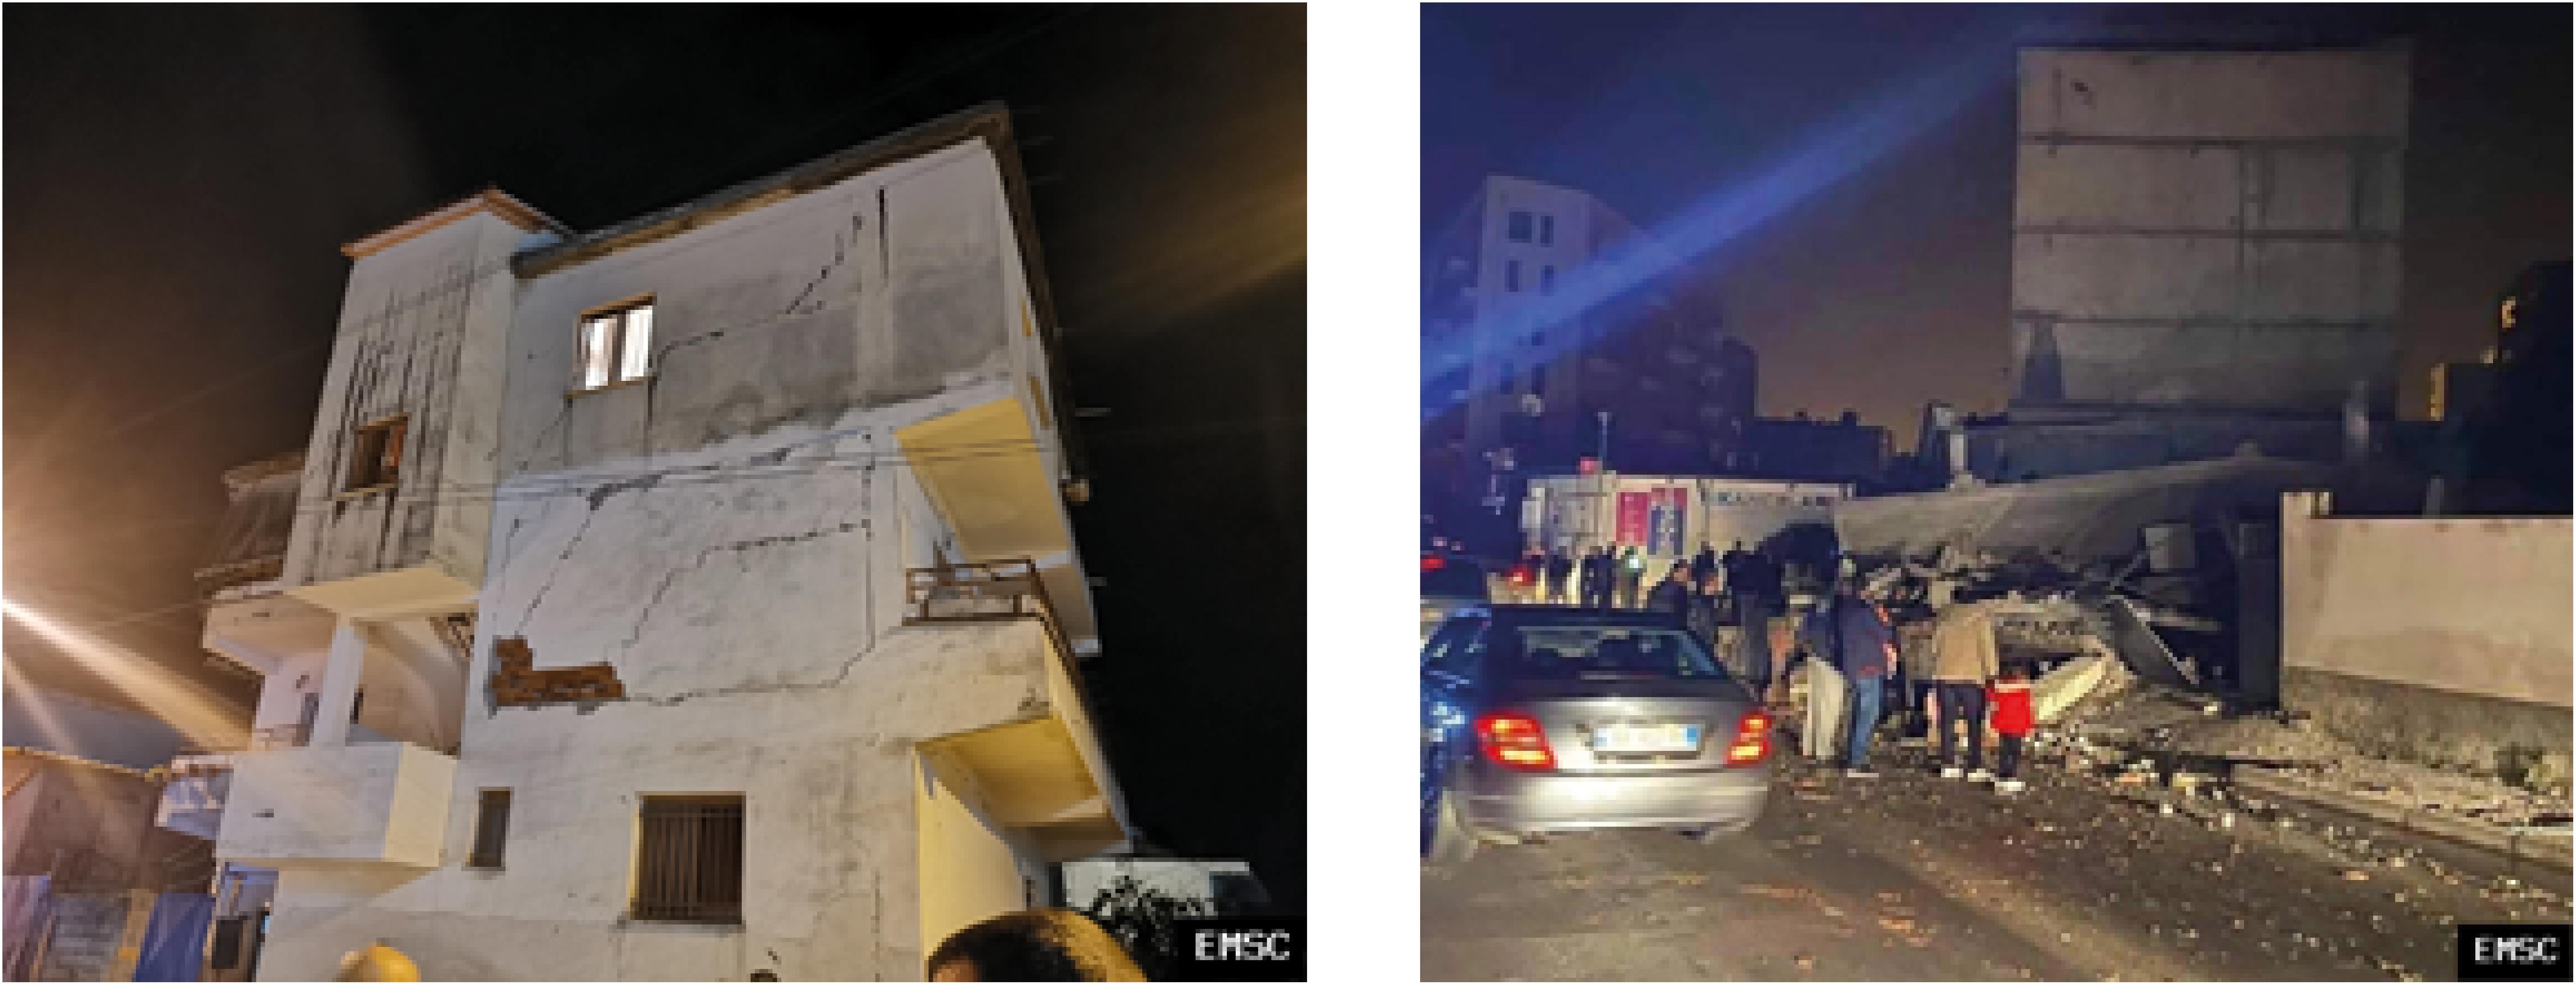
Figure 7. The first crowdsourced picture exhibiting structural damage (left) was collected 64 min after the mainshock and located in Tirana, 30 km from epicenter. The first collapse (right) was collected 77 min after the mainshock and taken in Durres, less than 10 km from the epicenter.
This shows that when building collapses are localized (rather than generalized over a whole city or region) and the communication network remains active, first pictures of interest for rapid impact assessment can be crowdsourced within a couple of hours even for an earthquake happening during the night, and the majority are collected within few tens of hours. After a couple of days, submitted files include a majority of selfies or family pictures. It could be part or an extension of a “witnessing culture” with these pictures simply saying, “I lived through this earthquake” (Koliska and Roberts, 2015).
From Crowdsourced Data to Situational Awareness
Crowdsourced information can be a cost-effective alternative to a dense real-time accelerometric network for reducing intrinsic uncertainties of rapid earthquake damage scenarios (Bossu et al., 2016). A schematic pattern, named the “doughnut effect,” has been statistically identified for data collected by the EMSC where damaged zones are free or almost free of felt reports and app launches, or at least the local ratio of app launches amongst the locally installed apps is much lower for the same earthquake in damaged areas than in areas affected by lower shaking levels (Bossu et al., 2018a). While the absence of such a pattern is proof of the absence of significant damage, its existence is not a proof on its own of damage and can be due to local communication issues (Bossu et al., 2018a).
The “doughnut pattern” was observed following the M 6.4 Albania earthquake where despite more than 1,000 app users within the first 10–20 km of the epicenter where damage occurred, there were only a few of them launching the app, with a ratio below 5% in the first 8 min (Figure 8). It was the first indication of the likely existence of damage.
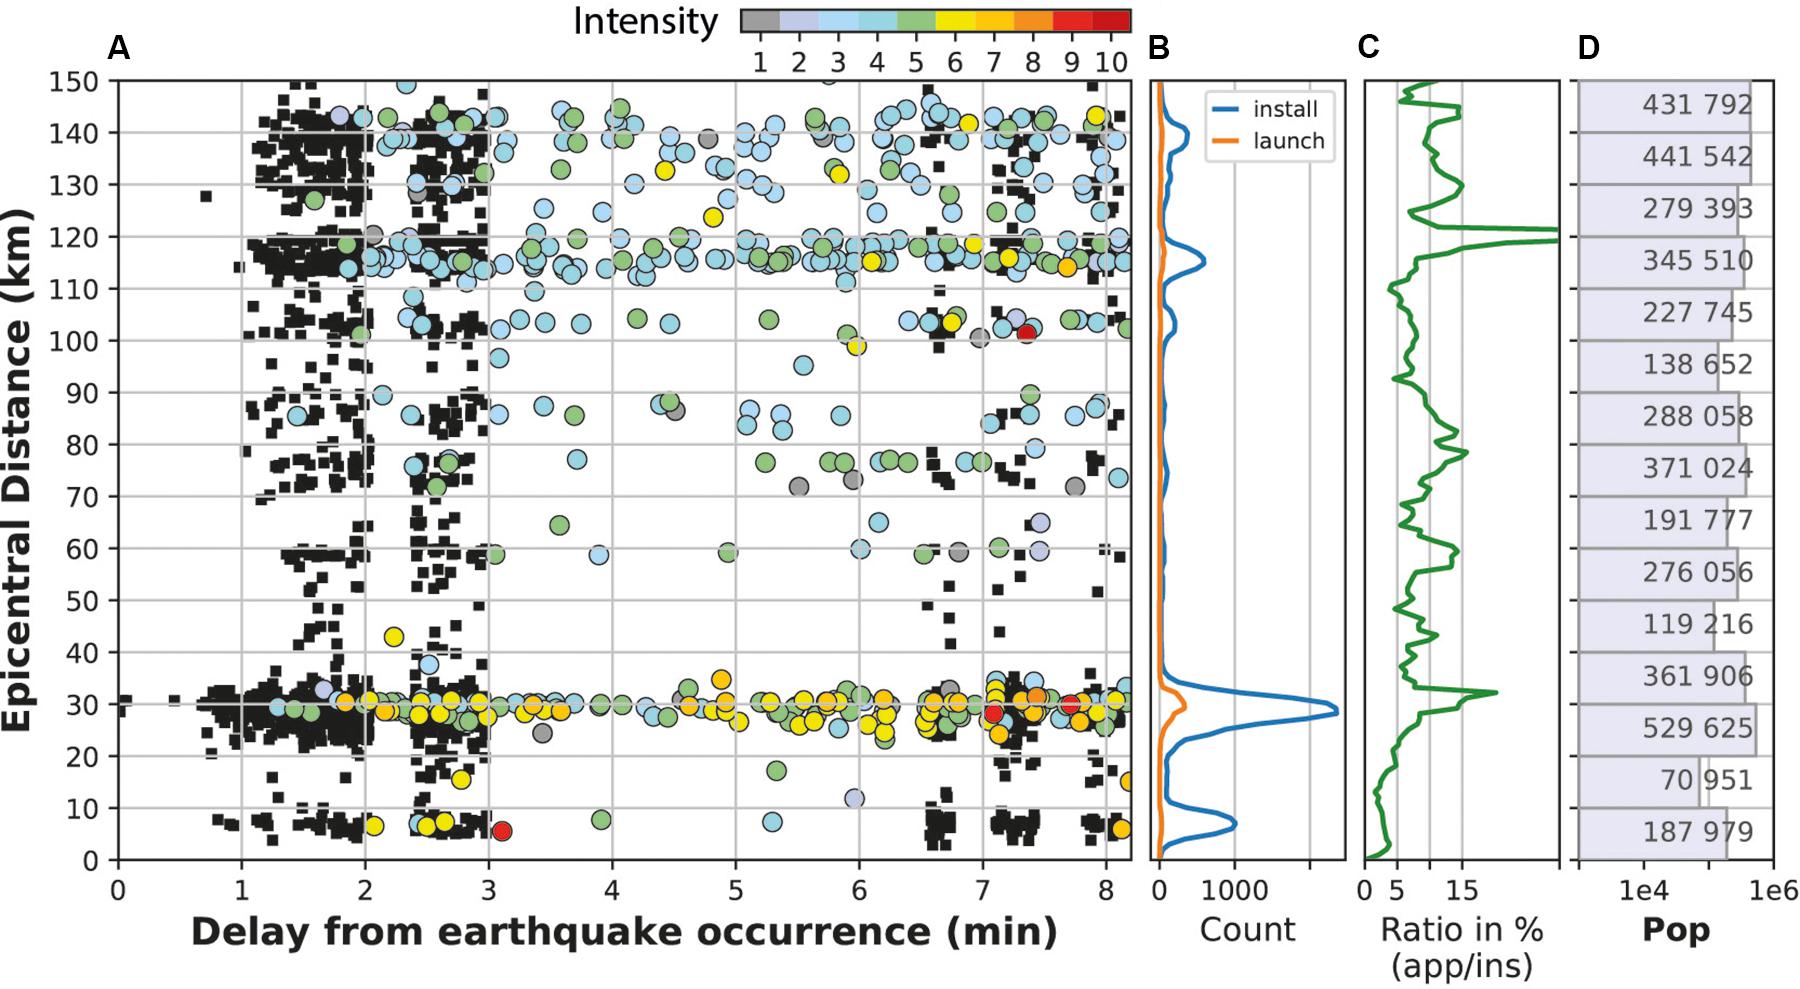
Figure 8. Time-distance distribution of app launches (black square) and felt reports (colored circles) for the M 6.4 Albania earthquake occurrence until the app notification—8 min after the earthquake occurrence—that is, when app users react to the shaking rather that the notification The apparent absence of app launches in different time intervals (e.g., from 3 to 6 min) is an artifact due to technical issues during the data collection process due to the high level of internet traffic to the EMSC servers (A); only a minority of installed apps (blue curve) are launched (orange curve) in this time window (B); still, the ratio (green curve) of app launches to app’s locally installed decreases below 5% within 20 km of the epicenter indicating the possibility of damage in this area (curves are smoothed with a 2.5 km space window) (C); and population in 10-km intervals are indicated (D).
The second indication resulted from Earthquake Qualitative Impact Assessment, a software used internally at EMSC, calibrated on past earthquakes where impact is estimated by comparing expected ground motion with the number of inhabitants (Bossu et al., 2009; Julien-Laferrière, 2019a, b). Its first automatic estimate based on preliminary earthquake parameters was available 10 min after the earthquake, immediately after the first preliminary earthquake parameters were available. It was updated 15 min later once earthquake parameters had been manually reviewed. Both qualitative impact assessments predicted significant damage in the epicentral region. Likely damage was further supported by the automatic analysis of felt reports, which indicated an intensity eight (severe damage) within 1 h of the quake within 13 km of the epicenter (Figure 9). After an hour, the existence of damage within 10–20 km of the epicenter could be established with high certainty supported by impact scenario data (Earthquake Qualitative Impact Assessment results), statistical analysis of felt reports (Figure 9), and eyewitnesses’ digital footprints (Figure 8). It was further confirmed with the first crowdsourced geo-located pictures of damage (Figure 7).
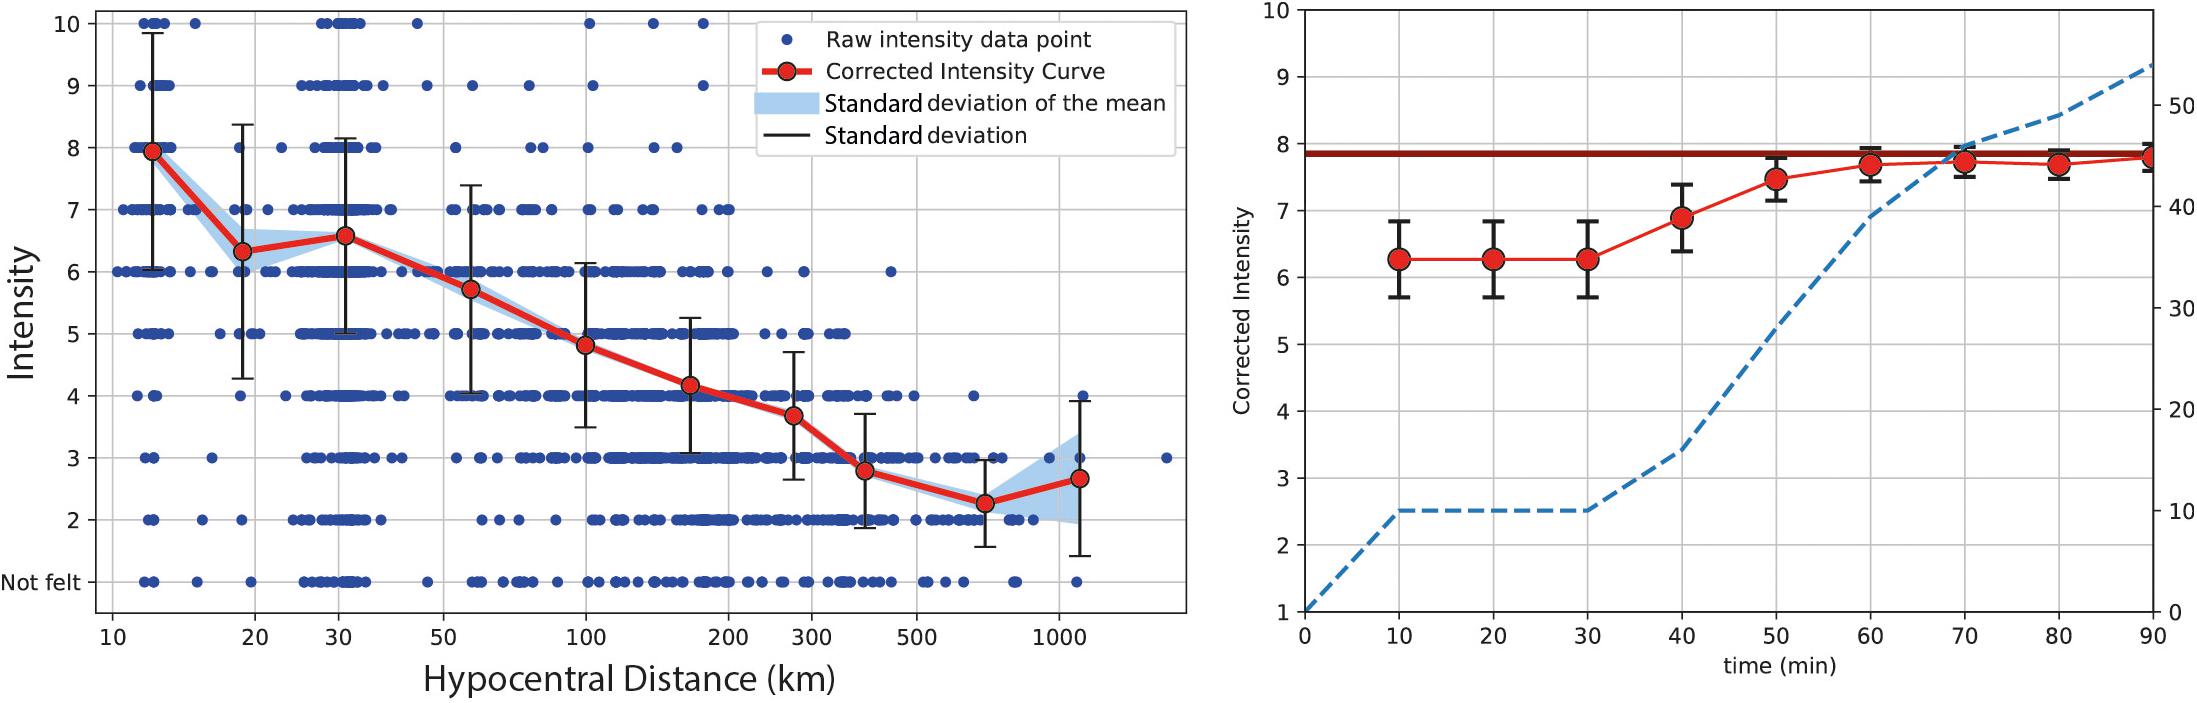
Figure 9. Right: Time evolution of the intensity derived from felt reports within 13 km of the epicenter (red). The increase of number of felt reports (blue dashed) and the estimated intensity after 30 min translates the doughnut effect. The intensity moved from 6 (slightly damaging) to 8 (heavily damaging) between 30 and 60 min after the earthquake. The final intensity is shown as a horizontal dark red line. Left: Final intensity vs distance curve (red) derived from collected felt reports (blue dots). If individual reports at the same epicentral distance exhibit significant variability (as measured by the standard deviation), averaging allows accurate estimation of the mean intensity (as measured by the standard deviation of the mean). Intensities are corrected following procedures presented in Bossu et al. (2017).
Collected Open Comments
During the November period, 34% of the felt reports associated with an earthquake were also associated with an open comment, a proportion similar to that observed for other earthquakes. We do not currently exploit these comments for situational awareness. They are generally shared by eyewitnesses to express emotions (anxiety, fear…) and/or felt experience in plain words. They are visible on EMSC’s websites and on the app where users can vote in favor or against a comment through a system of up and down arrows. Reading other eyewitnesses’ experiences is an appreciated feature of the app often mentioned as such on the IOS and Android app stores. Moderation is minimal due to language barriers, and the volume of comments typically no more than a few comments are deleted per earthquake, with special attention on comments with significant negative votes. Moderation, which is explicitly mentioned in the terms of service of the app, concerns offensive comments, earthquake prediction claims, proselytism comments, fake news (e.g., fake death toll), or comments including phone numbers, Internet links, and social media handles. Some comments were removed after being reported to us by email.
Alongside its main objective of sharing emotions and earthquake experience in plain words and although one cannot directly answer a comment, this feature has been exploited during the November period by some as a social platform, for example, posting ads to sell cars, furniture, dating messages, and many for humoristic remarks as well as political comments. This new usage of the comments as a sort of social network was later observed following the destructive Elazig, Turkey, M 6.8 earthquake of January 24, 2020. Although this earthquake was not felt in Albania (1,600 km away), some Albanian users shared felt reports and comments such as “Pray for Turkey” comments, which were among the most voted for. This further illustrates that, at least for some Albanian users, the role of comments expanded from its initial objective of sharing experience to more direct discussion. Such an extension of use was not unanimously approved; comments not related to the earthquake led to new comments complaining about what their authors perceived as inappropriate behavior in the face of a disaster.
We received emails and messages on Twitter asking for more stringent moderation. Beyond the difficulty and resources needed for moderating comments in foreign languages, we consider it difficult to draw a precise line between what is and is not acceptable, especially in terms of humor or political statements because it is highly cultural. From our perspective, the fact that this feature is commonly used argues that its overall benefits outweigh possible negative impact. Being appreciated by users, it may contribute to the adoption and/or retention of the app and in turn to its crowdsourcing efficiency.
Earthquake Communication on Twitter
The aims of the @LastQuake Twitter account are to broadcast rapid information about felt earthquakes, attract more app users, and better understand public expectations after earthquakes. Publications comprise of automatic tweets (a quakebot) conveying rapid earthquake information as well as manual ones. The latter cover general solid earth science. They also share external information and resources about damaging earthquakes, and they include systematic—or nearly systematic—direct answers to questions. The increase in the number of followers on Twitter was far more modest than the one observed for LastQuake app users, moving from 109,000 at the beginning of September to 124,000 at the end of the November period. There is no way to evaluate the proportion of these new followers from Albania.
During the November period, there were 14.2 million cumulated views of the 2,272 @LastQuake tweets. The most viewed was our dedicated Twitter moment with 238,000 views (a compilation of tweets gathering key information on the earthquake and its effects) and which was pinned (i.e., remained the first message of the @LastQuake timeline) during the duration of the November period. The second most popular with 140,000 views was our first tweet published on November 26, explaining that earthquake prediction does not exist and should not be trusted (Figure 10).
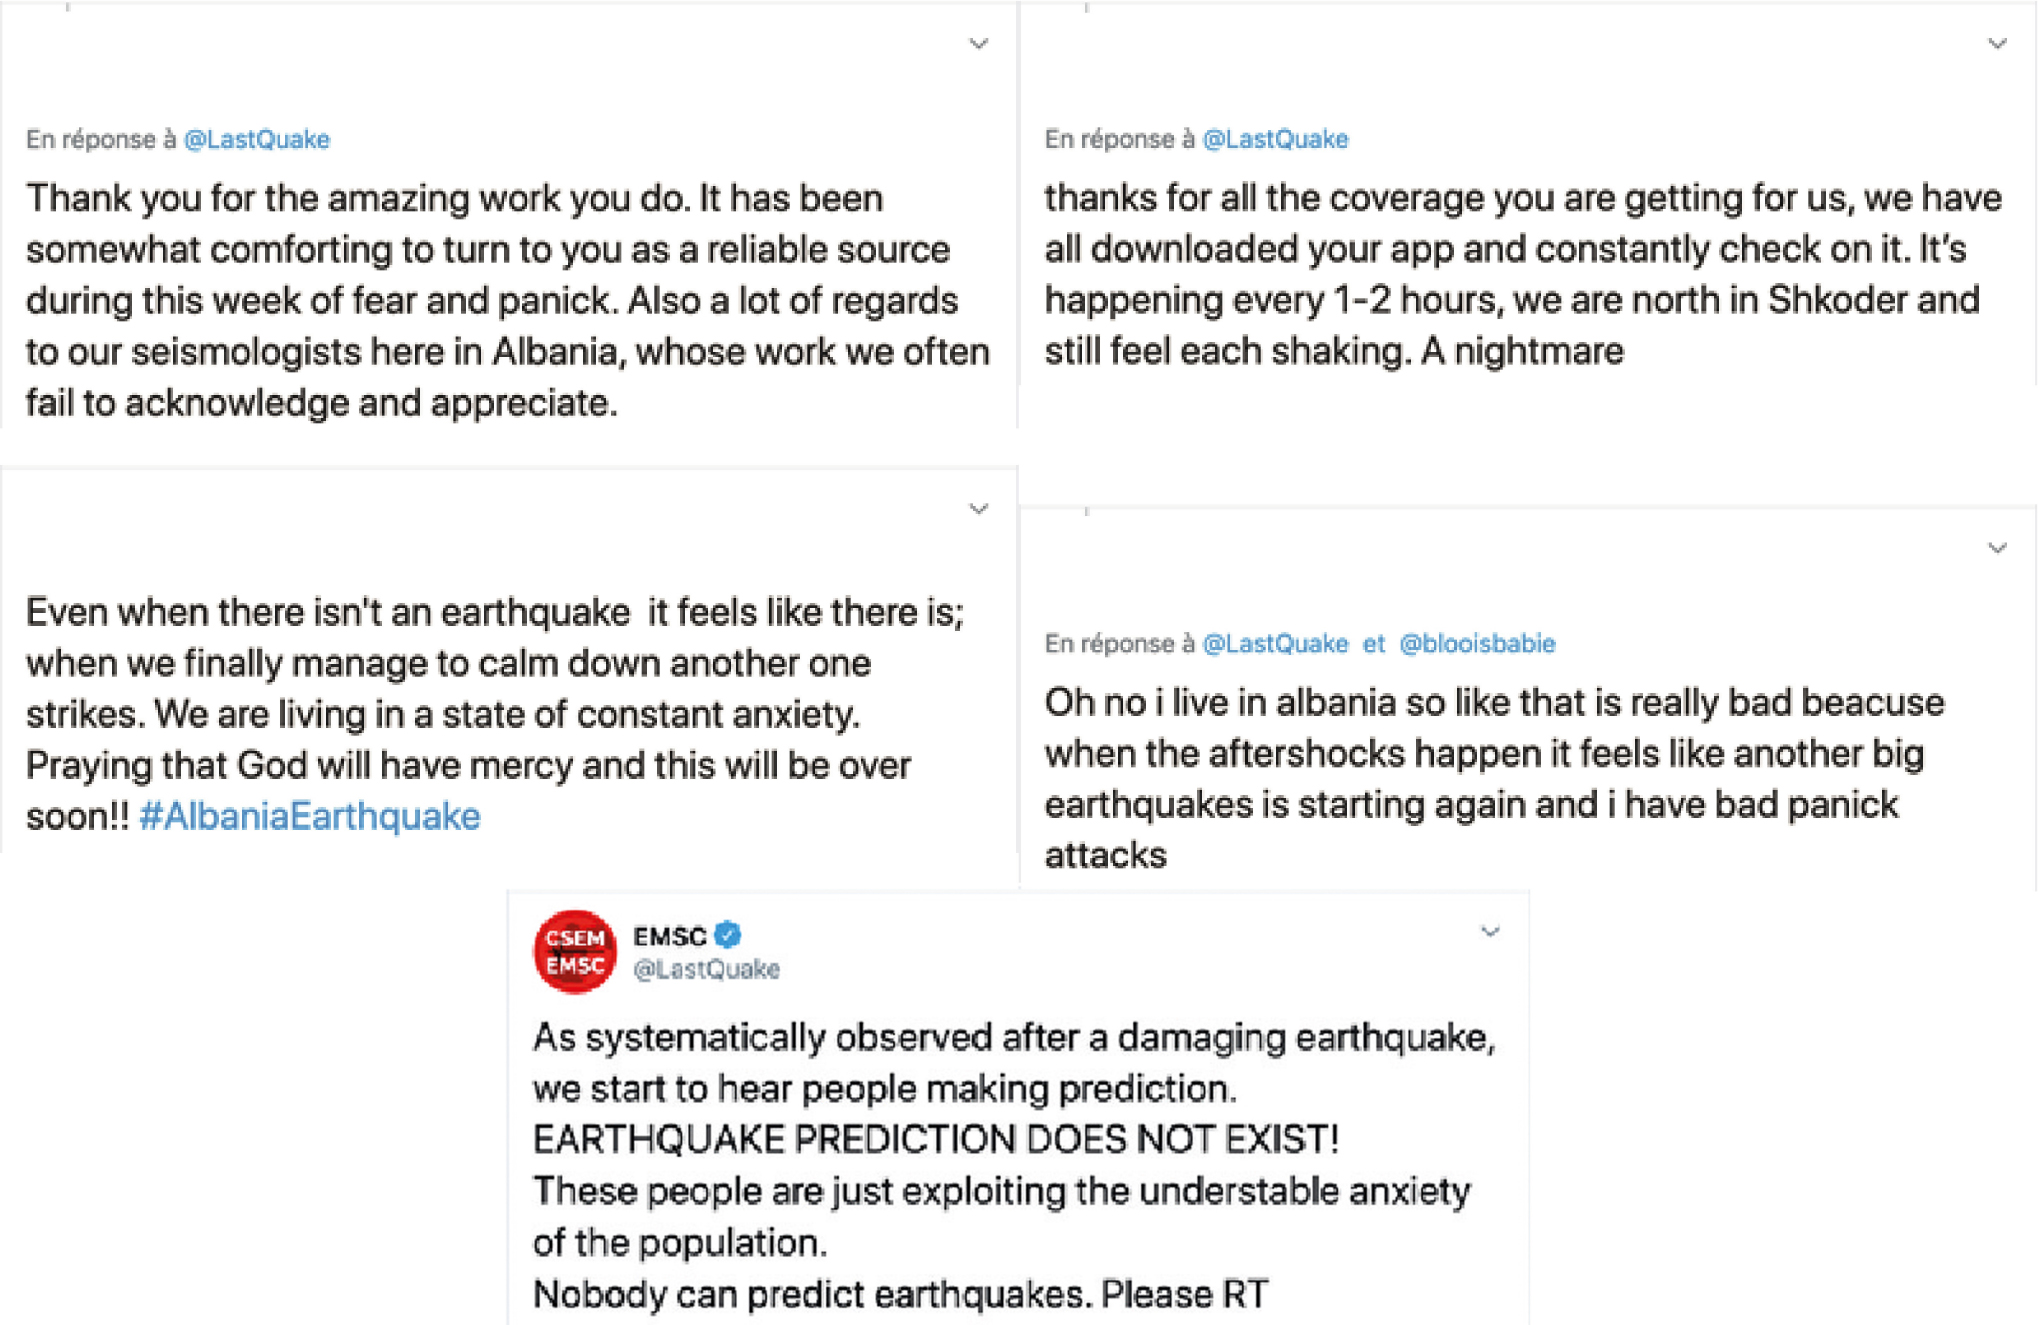
Figure 10. Examples of tweets exchanged following M 6.4 earthquake in Albania. EMSC systematically reminds its audience after damaging earthquakes that earthquake prediction does not exist to date. Followers express their anxiety, compulsive need for information and appreciation of @LastQuake information. Some report possibly phantom earthquake effects.
On November 26, the day of the mainshock, there were 586 tweets published, mainly automatic ones, relating to the numerous felt earthquakes in Albania (Figure 1). This was too high a number of publications to be easily followed. Furthermore, information about the mainshock had been rapidly replaced by new tweets, and so the Twitter moment had to be put in place to correct this and make the mainshock data accessible. Beside the volume of tweets, a common situation was the intertwining of automatic tweets from different events since automatic tweets continue to be published up to 45 min after an earthquake (Figure 1). This lack of clarity can create potential confusion, especially during a rapid succession of aftershocks when users may be nervous and tense. In conclusion, the current publication strategy of the LastQuake twitter quakebot is not suitable for an energetic aftershock sequence. It will be revised in order to hierarchize the information, that is, first to ensure the information about the mainshock remains easily accessible, and second to reduce the number of tweets about small magnitude aftershocks and shorten the time window of publication.
Although this analysis is purely qualitative, exchanges with Twitter followers illustrate the high level of anxiety among at least in part of the population (Figure 10). Some report how they constantly check for updates on the LastQuake app (Figure 10), a behavior that likely contributed to the large number of app launches even in the absence of felt earthquakes (Figure 4). Despite slow services due to high traffic after widely felt earthquakes, users found information useful and somehow comforting, illustrating the public desire for information during an earthquake and why it is important for the seismological community to fulfill this need (Figure 10).
The Question of Earthquake Prediction and Evolution of the Earthquake Sequence
The central question raised on Twitter was about the possible evolution of the seismicity after the mainshock, whether the aftershock rate was normal, whether one should expect a new damaging shock, and whether earthquake prediction can be trusted. We explained the best we could, without jargon and with empathy (Bartel and Bohon, 2019), that a new damaging shock was not the most likely scenario but could not be totally ruled out and that the aftershock rate decreases with time but will last for weeks and months. Despite the lack of certainty, these answers were generally accepted, and Twitter users appreciated our effort to provide them with answers, even incomplete and non-actionable (Figure 10).
Earthquake prediction is another recurrent question after a strong earthquake. Following similar experience during the Lombok (Indonesia) 2018 earthquake sequence (Bossu et al., 2019a), we systematically publish a message on Twitter after a damaging earthquake explaining that earthquake prediction does not exist as of today and that such a claim should not be trusted (Figure 10). We also systematically blocked Twitter accounts associating prediction claim to our Twitter account in an attempt to make it visible to our followers. This stringent policy aims at reducing possible adverse consequences of earthquake prediction rumors. An example of such a negative consequence was observed in Albania on September 22, 2019, when large-scale panicked evacuations were reported following a prediction about an imminent earthquake published online3. A similar rumor spread via the messaging app Whatsapp on November 27, maybe also with panicked evacuations, although this is disputed4. In the latter case, the audio message was a deliberate attempt to create panic by claiming that the prediction was based on confidential military information and explicitly inviting people to leave the area. We published several tweets in an attempt to counter this claim. However, some answers and new questions showed there can be confusion between early warning, aftershock forecast, and prediction and that we lacked a clear, simple, and complete statement in the local language to explain what science can and cannot offer today.
Discussion and Lessons Learned
We analyzed the use of the LastQuake multichannel information system in the aftermath of the deadly M 6.4 Albania earthquake of November 26, 2019, to identify its strengths and weaknesses in answering public desire for earthquake information, as well as how the data it collects from eyewitnesses can contribute to rapid situational awareness. We acknowledge that since this study is focused on a single country, Albania, the cultural context, risk perception, and technological culture are likely playing a role, but we still believe there are lessons to be learned. This earthquake is of specific interest because the number of LastQuake app users in Albania was significant (25,000) when the mainshock struck thanks to a previous M 5.6 earthquake, which affected the same region on September 21, 2019. It reached 5% of the country population 7 days after the mainshock and after more than 200 felt events represents the highest adoption rate we can realistically expect for this app. Rather than representing the average expected performances for any global earthquake, this study then likely illustrates the current best-case scenario.
This analysis confirms two important lessons learned from past earthquakes, such as the M 7.8 2015 Gorkha Nepal earthquake (Bossu et al., 2015). First, that felt earthquakes trigger a public desire for information and the adoption of LastQuake app (Figure 1). Second, while the app is the most efficient and rapid crowdsourcing tool yielding 96% of the felt reports collected in the first 10 min of the mainshock, websites remain essential in terms of reach with an average of 1 million daily unique visitors during the 7-day studied period, with one-third originating from Albania. App launches were also significant even in the absence of located felt earthquakes (Figure 4). It cannot be excluded that some M < 2 aftershocks (M2 being the smallest reported aftershocks) caused some app launch activity because the aftershocks were located in a populated area and could have been felt. However, that is also consistent with a behavior identified by Wein et al. (2016) via focus group studies where some members of the public try to relieve anxiety by “endlessly seeking scientific information when emotional support is actually needed.” Another possible explanation could be “phantom earthquakes” when some people report feeling tremors that cannot be confirmed by any seismic data after a large earthquake (e.g., Takayama, 2017; Hapsari et al., 2019). Both phantom earthquake phenomena and unreported small-magnitude felt aftershocks could explain why fake crowdsourced earthquake detections caused by high traffic during the studied period were regularly confirmed by several individual felt reports. Whatever the cause, we should consider strengthening earthquake detection criteria during aftershock sequence to restrict crowdsourced detections to larger app launch surge and to avoid contributing to any phantom earthquake phenomena.
In the studied case, new users were shown to be more likely to report unrealistically high-intensity values (11 and 12) and to make mistakes in associating their felt reports with the correct causative earthquake. Intensities 11 and 12 resulted either from tests of new users or from overinflated reports (potentially due to high emotional state) but also possibly due to a lack of distinction between the different cartoons representing high intensities (Figure 1). On the cartoons, intensities 8–12 mainly differ through the level of damage to the same couple of buildings (Figure 1), while the definition of the EMSC 98 scale, includes a different class of building vulnerability and different proportion of damaged buildings. If building vulnerability cannot be easily estimated by laypersons—and even less through a simple system of cartoons—cartoons could better represent a different proportion of collapsed buildings that range from intensity 8 to 12 from a few to most/all. More precise and distinctive cartoons could help an eyewitness observing a couple of collapsed buildings in an otherwise unscathed neighborhood not choose intensity 11 or 12. Until such changes are developed, tested, and implemented, our analysis confirms previous studies that intensities 11, 12 have to be excluded from automatic processing (Bossu et al., 2017).
Errors in felt report association with the causative earthquake are not specific to the LastQuake system, and Quitoriano and Wald (2020) noted that “DYFI contributors tend to select the most recent earthquake displayed on the USGS website.” However, they were likely amplified by the current setup of the app where, due to the lack of information prioritization, information about the mainshock was difficult to access within hours of its occurrence. A similar prioritization issue was identified with the Twitter quakebot. They will need to be corrected to ensure both on the app and on Twitter that essential information, such as reports related to the mainshock, remains easily accessible during an appropriate time window and also to limit information overload due to multiple aftershocks, notably by reducing the number of tweets automatically published for small-magnitude aftershocks. Despite slow and sometimes disrupted app services due to the high demand on the EMSC’s internet infrastructure and the lack of an Albanian language version of the LastQuake app (which was only released in January 2020) the overall satisfaction was large with a rating for Albania of 4.8/5 (based on 504 ratings on January 24, 2020) in the IOS store where statistics per country are available.
A second important result concerns rapid situation awareness. This study confirms that when the number of users is significant in the epicentral region, when communication networks remain operative and building collapses remain localized rather than widespread over a whole city, the LastQuake system can confirm the existence of significant damage suspected from impact scenarios within about an hour thanks to independent corroborating information. The first cue about the existence of damage was derived within 8 min (i.e., when the first preliminary seismic location was available) of the earthquake occurrence through the lack of app users’ reactions within 20 km of the epicenter (Figure 8). This was then supported by a rapid impact scenario, then by a felt report analysis, and (Figure 9) finally through the first crowdsourced geo-located pictures of structural damage and collapse (Figure 7). Although today comments are not exploited for situational awareness, there is, however, a potential here too with the first comment in English reporting damage from Durres 48 min after the mainshock: “It was scary. A five-story building fell in front of my eyes. People were hurt. Communication shut till now. Stay safe Albanians.” These results indicate that rapid impact assessment can directly benefit from improved public interaction by fast cost-effective collection of valuable information and data on earthquake impact while better fulfilling strong public desire for information after widely felt earthquakes. Put together with a recent work by Steed et al. (2019) demonstrating that the combined analysis of crowdsourced and seismic data improves seismic network location performances at marginal costs, the current work further illustrates that operational seismology can benefit from crowdsourced data.
Open comments are an appreciated feature of the app. They have been exploited by the users in Albania not only to share experience and emotions in plain words but also more as a type of social platform with comments answering each other and topics not always related to earthquakes. We do not know whether this is specific to the affected country or a change of expectations and needs during an aftershock sequence or a type of behavior that only emerges with a large density of users. It will be monitored during future earthquakes, and if necessary, our moderation policy will be updated.
Exchanges on Twitter @LastQuake reflect anxiety among the population and the desire from the affected people for direct interactions. Exchanges being in English and the number of Twitter followers having not dramatically surged during the studied period (and the geographical origin of followers being difficult to identify), the potential impact of such exchanges should not be overevaluated. Although this may not be true for the whole affected population, LastQuake followers on Twitter from Albania reported that service and information offered tend to reduce their anxiety (Figure 10). Same effects were reported by LastQuake Twitter followers during other earthquake sequence, such as 2018 Lombok (Indonesia) or in Mayotte (France) (Fallou and Bossu, 2019) and consistent with study underlining the importance of information during crisis to reduce uncertainty and comfort affected population (Saathoff and Everly, 2002; Boyle et al., 2004).
Questions were often about possible evolution of the seismicity and the trustworthiness of prediction claims. The lack of certainty in our answers about possible sequence evolution, where we systematically mentioned that an earthquake as strong or even stronger than the mainshock was unlikely but could not be totally excluded, was accepted and positively received. Focus then shifted more specifically on earthquake prediction after such a claim spread on the messaging app WhatsApp. Because such claims, observed after many significant earthquakes around the globe can have advert consequences such as panic evacuations, we believe that both EMSC but also the seismological community should be better prepared to debunk them by communicating rapidly with the public. We thus advocate for the establishment of a clear, concise statement on this topic, explaining differences between prediction, aftershock forecast, or early warning, a statement that ideally would be endorsed and shared by the seismological community and made available in multiple languages. EMSC and other actors could then automatically publish it after large earthquakes both on Twitter but also on the LastQuake app. An informal international working group has been set up to prepare such a statement. Although it will not be a panacea, such a document made rapidly and widely available after destructive earthquakes in an easy-to-understand format could contribute to reducing unnecessary confusion and anxiety among the population at a time of high emotional state. This communication issue about prediction is part of a wider effort in seismology to adapt rapid direct public communication to time-varying hazard products, such as aftershock forecast or earthquake early warning (e.g., Jordan et al., 2014; Lamontagne and Flynn, 2014; Wein et al., 2016; Allen et al., 2018; Allen and Melgar, 2019; McBride et al., 2020) in a consistent way.
Conclusion
This article demonstrates that a multichannel earthquake information system such as LastQuake aiming to satisfying eyewitnesses’ information needs can efficiently engage with them and collect, at least in some cases, essential information about the damage caused by an earthquake with 60–70 min of its occurrence and then reduce uncertainties of the damage scenario and improve rapid situational awareness. It also identifies some weaknesses in the LastQuake system that will need to be addressed.
More fundamentally, it shows that earthquake predictions, which tend to flourish after a damaging earthquake, could be better debunked by having a clear and concise consensual statement available in various languages about what science can and cannot offer today in terms of time evolution of seismicity. Although it will not eradicate on its own all possible advert consequences of every pseudo-prediction, it would facilitate communication and possibly encourage more actors, individual seismologists, seismological observatories, or civil protection agencies to engage with the public on social media before and after earthquakes to contribute to raising awareness, improving earthquake literacy, and reducing public anxiety.
Data Availability Statement
Felt reports can be found through the web service, https://www.seismicportal.eu/testimonies-ws/. The datasets generated for this study are available on request to the corresponding author.
Author Contributions
RB formulated the overarching research goals, led and supervised the project, and acquired funding. LF and ML had major contributions in the analysis of the results. FR, SJ-L, JR, and RS have contributed in LastQuake system development and operation as well as in data preparation and provided feedback during the discussions. All authors contributed to the article and approved the submitted version.
Funding
This article was partially funded by the European Union’s Horizon 2020 Research and Innovation Program under grant agreement RISE No. 821115 and grant agreement TurnKey No. 821046. Opinions expressed in this article solely reflect the authors’ views; the EU is not responsible for any use that may be made of information it contains.
Conflict of Interest
The authors declare that the research was conducted in the absence of any commercial or financial relationships that could be construed as a potential conflict of interest.
Acknowledgments
Rapid earthquake locations are collated from different seismological institutes contributing to the EMSC earthquake information system. We thank them for their support with a special thanks to the Institute of Geosciences, Energy, Water, and Environment (IGEWE) of Albania.
Footnotes
- ^ https://balkaninsight.com/2019/12/02/albania-probes-illegal-buildings-after-earthquake-devastation/
- ^ https://www.emsc-csem.org/Earthquake/Gallery/maps.php?id=807751
- ^ https://shqiptarja.com/lajm/ministria-e-mbrojtjes-sqaron-lajmi-per-termet-te-fuqishem-ne-2330-i-pavertete-fajtoret-do-mbajne-pergjegjesi
- ^ https://shqiptarja.com/lajm/nje-audio-ne-italisht-shperthen-panikun-ne-durres-por-eshte-false
References
Allen, R. M., Cochran, E. S., Huggins, T. J., Miles, S., and Otegui, D. (2018). Lessons from Mexico’s earthquake early warning system. EOS Earth Space Sci. 99. Available online at: https://eos.org/features/lessons-from-mexicos-earthquake-early-warning-system
Allen, R. M., and Melgar, D. (2019). Earthquake early warning: advances, scientific challenges, and societal needs. Annu. Rev. Earth Planet. Sci. 47, 361–388. doi: 10.1146/annurev-earth-053018-060457
Bartel, B., and Bohon, W. (eds) (2019). “The hazards of hazard communication: importance, rewards, and challenges of science in the public sphere: a white paper summary of presentations from session,” in Proceedings of the PA23B at the 2018 Fall Meeting of the American Geophysical Union, Washington, DC.
Bossu, R., Fallou, L., Julien-Laferrière, S., Landès, M., Roch, J., Roussel, F., et al. (2019a). How to Improve Rapid Public Earthquake Information? Listen to Eyewitnesses!. Available online at: https://blogs.egu.eu/divisions/sm/2019/05/08/how-to-improve-rapid-public-earthquake-information-listen-to-eyewitnesses/
Bossu, R., Gilles, S., Mazet-Roux, G., Roussel, F., Frobert, L., and Kamb, L. (2012). Flash sourcing, or rapid detection and characterization of earthquake effects through website traffic analysis. Ann. Geophys. 54, 716–727.
Bossu, R., Landès, M., Roussel, F., and Steed, R. (2018a). Felt reports for rapid mapping of global earthquake damage: the doughnut effect? Seismol. Res. Lett. 89, 138–144. doi: 10.1785/0220170129
Bossu, R., Landès, M., Roussel, F., Steed, R., Mazet-Roux, G., Martin, S. S., et al. (2017). Thumbnail-based questionnaires for the rapid and efficient collection of macroseismic data from global earthquakes. Seismol. Res. Lett. 88, 72–81. doi: 10.1785/0220160120
Bossu, R., Laurin, M., Mazet-Roux, G., Roussel, F., and Steed, R. (2015). The importance of smartphones as public earthquake-information tools and tools for the rapid engagement with eyewitnesses: a case study of the 2015 Nepal earthquake sequence. Seismol. Res. Lett. 86, 1587–1592. doi: 10.1785/0220150147
Bossu, R., Merrer, S., and Mazet Roux, G. (2009). Applications and Utilization of ELER Software. Evaluation of the Level 0 Approach, 38. Available online at: http://www.neries.eu.org/main.php/JRA3_D5EMSCImpactEstimationJRA3_V3.pdf?fileitem=10272797
Bossu, R., Roussel, F., Fallou, L., Landès, M., Steed, R., Mazet-Roux, G., et al. (2018b). LastQuake: From rapid information to global seismic risk reduction. Int. J. Disaster Risk Reduct. 28, 32–42. doi: 10.1016/j.ijdrr.2018.02.024
Bossu, R., Steed, R., Roussel, F., Landès, M., Fuenzalida, A., Matrullo, E., et al. (2019b). App earthquake detection and automatic mapping of felt area. Seismol. Res. Lett. 90, 305–312. doi: 10.1785/0220180185
Bossu, R., Scotti, O., Cotton, F., Cushing, M., and Levret, A. (2000). Determination of geomechanical site effects in France from macroseismic intensities and reliability of macroseismic magnitude of historical events. Tectonophysics 324, 81–110. doi: 10.1016/s0040-1951(00)00112-8
Bossu, R., Steed, R., Mazet-Roux, G., Roussel, F., Etivant, C., Frobert, L., et al. (2016). “The key role of eyewitnesses in rapid impact assessment of global earthquakes,” in Earthquakes and Their Impact on Society, ed. S. D’Amico (Cham: Springer), 601–618. doi: 10.1007/978-3-319-21753-6_25
Boyle, M. P., Schmierbach, M., Armstrong, C., McLeod, D. M., Shah, D. V., and Pan, Z. (2004). Information seeking and emotional reactions to the September 11 terrorist attacks. J. Mass Commun. Q. 81, 155–167. doi: 10.1177/107769900408100111
Earle, P. S., Bowden, D. C., and Guy, M. (2012). Twitter earthquake detection: earthquake monitoring in a social world. Ann. Geophys. 54:6.
Fallou, L., and Bossu, R. (2019). Taking into Account the Cultural Context to Improve Scientific Communication – Lessons Learned from Earthquakes in Mayotte. EGU Blog for Seismology. Available online at: https://blogs.egu.eu/divisions/sm/2019/03/08/taking-into-account-the-cultural-context-to-improve-scientific-communication-lessons-learned-from-earthquakes-in-mayotte/
Fallou, L., Petersen, L., Bossu, R., and Roussel, F. (2019). “Efficiently allocating safety tips after an earthquake – lessons learned from the smartphone application LastQuake,” in Proceedings of the 16th International Conference on Information Systems for Crisis Response And Management, eds Z. Franco, J. J. González, and J. H. Canós (Spain: Iscram).
Grünthal, G. (1998). European Macroseismic Scale 1998. Bruyères-le-Châtel: European Seismological Commission (ESC).
Hapsari, A. D., Hutagalung, F. D., Harsono, Y. T., Puspitasari, D. N., and Azzahra, T. A. (2019). Psychoeducation: Psychological First Aid After Disaster (earthquake) at Sekarbela Region. Lombok: Southeast West Nusa.
Hough, S. E., and Bilham, R. (2008). Site response of the Ganges basin inferred from re-evaluated macroseismic observations from the 1897 Shillong, 1905 Kangra, and 1934 Nepal earthquakes. J. Earth Syst. Sci. 117, 773–782. doi: 10.1007/s12040-008-0068-0
Jordan, T. H., Marzocchi, W., Michael, A. J., and Gerstenberger, M. C. (2014). Operational earthquake forecasting can enhance earthquake preparedness. Seismol. Res. Lett. 85, 955–959. doi: 10.1785/0220140143
Julien-Laferrière, S. (2019a). Earthquake Qualitative Impact Assessment (EQIA): Improvements and New Performance Evaluation, SERA JRA6 Report, 62. Available online at: http://www.sera-eu.org/export/sites/sera/home/.galleries/pdfs/Improvement_EQIA.pdf
Julien-Laferrière, S. (2019b). Earthquake Qualitative Impact Assessment (EQIA): Performance Evaluation, SERA JRA6 Report, 43. Available online at: http://www.sera-eu.org/export/sites/sera/home/.galleries/pdfs/Performance_analysis_EQIA.pdf
Koliska, M., and Roberts, J. (2015). Selfies: witnessing and participatory journalism with a point of view. Int. J. Commun. 9, 1672–1685.
Lamontagne, M., and Flynn, B. W. (2014). Communications in the aftermath of a major earthquake: bringing science to citizens to promote recovery. Seismol. Res. Lett. 85, 561–565. doi: 10.1785/0220130118
McBride, S. K., Llenos, A. L., Page, M. T., and van der Elst, N. (2020). # EarthquakeAdvisory: exploring discourse between government officials, news media, and social media during the 2016 bombay beach swarm. Seismol. Res. Lett. 91, 438–451. doi: 10.1785/0220190082
Michelini, A., Wotawa, G., and Arnold-Arias, D. (2017). “ARISTOTLE (all risk integrated system towards the holistic early-warning),” in Proceedings of the EGU General Assembly Conference Abstracts, Munich.
Musson, R. M. (1986). The use of newspaper data in historical earthquake studies. Disasters 10, 217–223. doi: 10.1111/j.1467-7717.1986.tb00591.x
Petersen, L., Fallou, L., Reilly, P., and Serafinelli, E. (2017). “Should CI operators use social media to communicate with the public during crisis situations?: lessons learned from a pilot study in Oslo Harbour,” in Proceedings of the 2017 4th International Conference on Information and Communication Technologies for Disaster Management (ICT-DM) (Piscataway, NJ: IEEE), 1–6.
Quitoriano, V., and Wald, D. J. (2020). USGS “Did you feel it?”-science and lessons from twenty years of citizen science-based macroseismology. Front. Earth Sci. 8:120. doi: 10.3389/feart.2020.00120
Saathoff, G., and Everly, J. G. (2002). Psychological challenges of bioterror: containing contagion. Int. J. Emerg. Mental Health 4, 245–252.
Simon, T., Goldberg, A., and Adini, B. (2015). Socializing in emergencies—A review of the use of social media in emergency situations. Int. J. Inform. Manag. 35, 609–619. doi: 10.1016/j.ijinfomgt.2015.07.001
Steed, R. J., Fuenzalida, A., Bossu, R., Bondár, I., Heinloo, A., Dupont, A., et al. (2019). Crowdsourcing triggers rapid, reliable earthquake locations. Sci. Adv. 5:eaau9824. doi: 10.1126/sciadv.aau9824
Takayama, K. (2017). Disaster relief and crisis intervention with deaf communities: lessons learned from the Japanese deaf community. J. Soc. Work Disabil. Rehabil. 16, 247–260. doi: 10.1080/1536710x.2017.1372241
Wald, D. J., Quitoriano, V., Dengler, L., and Dewey, J. W. (1999a). Utilization of the internet for rapid community intensity maps. Seismol. Res. Lett. 70, 680–697. doi: 10.1785/gssrl.70.6.680
Wald, D. J., Quitoriano, V., Heaton, T. H., Kanamori, H., Scrivner, C. W., and Worden, C. B. (1999b). TriNet “ShakeMaps”: rapid generation of peak ground motion and intensity maps for earthquakes in southern California. Earthquake Spectra 15, 537–556.
Keywords: public earthquake information, crowdsourcing, citizen science, situational awareness, public communication
Citation: Bossu R, Fallou L, Landès M, Roussel F, Julien-Laferrière S, Roch J and Steed R (2020) Rapid Public Information and Situational Awareness After the November 26, 2019, Albania Earthquake: Lessons Learned From the LastQuake System. Front. Earth Sci. 8:235. doi: 10.3389/feart.2020.00235
Received: 07 February 2020; Accepted: 02 June 2020;
Published: 04 August 2020.
Edited by:
Carmine Galasso, University College London, United KingdomReviewed by:
Rosemary Fayjaloun, Bureau de Recherches Géologiques et Minières, FranceKarim Tarbali, University College London, United Kingdom
Copyright © 2020 Bossu, Fallou, Landès, Roussel, Julien-Laferrière, Roch and Steed. This is an open-access article distributed under the terms of the Creative Commons Attribution License (CC BY). The use, distribution or reproduction in other forums is permitted, provided the original author(s) and the copyright owner(s) are credited and that the original publication in this journal is cited, in accordance with accepted academic practice. No use, distribution or reproduction is permitted which does not comply with these terms.
*Correspondence: Rémy Bossu, Ym9zc3VAZW1zYy1jc2VtLm9yZw==