 Alexandra Gossart1*
 Stephen P. Palm2,3Niels Souverijns1Jan T. M. Lenaerts4
 Irina V. Gorodetskaya5
 Stef Lhermitte6
 Nicole P. M. van Lipzig1
- 1Department of Earth and Environmental Sciences, KU Leuven, Leuven, Belgium
- 2Science Systems and Applications, Greenbelt, MD, United States
- 3NASA Goddard Space Flight Center, Greenbelt, MD, United States
- 4Department of Atmospheric and Oceanic Sciences, University of Colorado Boulder, Boulder, CO, United States
- 5Centre for Environmental and Marine Studies, Department of Physics, University of Aveiro, Aveiro, Portugal
- 6Department of Geosciences and Remote Sensing, Delft University of Technology, Delft, Netherlands
Continuous measurements of blowing snow are scarce, both in time and space. Satellites now provide the opportunity to derive blowing snow occurrences, transport and sublimation rates over Antarctica. These products are extremely valuable and offer a continental-wide assessment of blowing snow, which is an important but unknown component of the surface mass balance of the Antarctic ice sheet. However, little ground truth is available to validate these retrievals. The recent application of ceilometers for detection of blowing snow frequencies provides an opportunity to validate the satellite retrievals of blowing snow. A routine to detect blowing snow occurrence from ground-based remote sensing ceilometers has been developed at two coastal locations in East Antarctica for the 2011–2016 time period. Thanks to their ground-based location, ceilometers are able to detect blowing snow events in the presence of clouds and precipitation, which can be missed by the satellite, since optically thick clouds impede the penetration of the signal. In coastal areas, more than 90% of blowing snow occurs under cloudy conditions and represent 30 to 56% of all cloudy conditions at Princess Elisabeth and Neumayer III (Neumayer hereafter) stations, respectively. For cloud-free conditions, 8% of the measurements at Princess Elisabeth (and none at Neumayer) are identified as blowing snow by the satellite but not by the ceilometer, likely due to differences in sensors, limitation of the surface identification by the satellite, or the spatial inhomogeneity of the blowing snow event. While the satellite blowing snow retrieval is a useful product, further investigation is needed to reduce the uncertainties on blowing snow frequencies associated with clouds.
1. Introduction
Blowing snow is a frequent phenomenon on the Antarctic ice sheet, occurring as often as 70% during winter (Palm et al., 2011). By redistributing snow, it is a locally and regionally important component of the surface mass balance. Wind-induced displacement of snow particles, dislodged from the surface and entrained in the near-surface air, can be a sink (referred to as erosion) or a source of mass (referred to as deposition).
Snow particles can creep on the ground, be in saltation between the snow surface and the atmospheric surface layer, or remain in suspension in the atmospheric boundary layer (Schlosser, 1999; Gallée et al., 2001; Leonard et al., 2012). The displacement of particles is only a minor contributor to the integrated surface mass balance of the ice sheet (Loewe, 1970; Dery and Yau, 2002; Lenaerts and Van den Broeke, 2012). However, the erosion of snow can have a strong impact on the surface mass balance at a local or regional scale (Gallée et al., 2001; Dery and Yau, 2002; Lenaerts and Van den Broeke, 2012; Groot Zwaaftink et al., 2013) through the displacement and relocation of snow particles, the erosion of snow cover and the exposure of blue ice areas (Takahashi et al., 1988; Bintanja and Van den Broeke, 1995).
Blowing snow can be driven by katabatic winds or synoptic systems. Katabatic winds are gravity-induced atmospheric flows from the interior of the ice sheet toward the coast. Synoptic systems particularly affect the coastal areas, where blowing snow is associated with synoptic-scale depressions that frequently reach the coast of Antarctica (Konig-Langlo and Loose, 2007; Gossart et al., 2017). These weather systems originate from the Southern Ocean and bring precipitation onto the ice sheet (Souverijns et al., 2018), sometimes far into the interior (Schlosser, 1999; Hirasawa et al., 2013). During such events, the wind speed is relatively high and the snow particles from fresh snow accumulation are light, facilitating blowing snow. In addition to snow transport, the sublimation of blowing snow is an effective sink of mass over the ice sheet (Kodama et al., 1985; Takahashi et al., 1992; Thiery et al., 2012; Dai and Huang, 2014): the particles suspended in the air offer a larger surface area to sublimation than those on the ground, resulting in more efficient sublimation (Bintanja, 1998; Van den Broeke et al., 2004). Blowing snow sublimation was measured to represent 50–80% of the total sublimation rate at two sites in East Antarctica (Bintanja and Reijmer, 2001).
Despite its important contribution to the local surface mass balance of Antarctica, methods to measure blowing snow are still limited. Various techniques have been used ranging from mechanical traps or nets to acoustic sensors, optical sensors and macro photography techniques (e.g., Scarchilli et al., 2010; Leonard et al., 2012; Amory et al., 2015; Trouvilliez et al., 2015). These techniques are usually limited to a few sites and/or short time periods, and are scarce and uncertain due to the remoteness of the continent and harsh weather conditions.
Satellite remote sensing has recently been used to retrieve blowing snow observations on the entire ice sheet. In particular, the Cloud-Aerosol LIdar with Orthogonal Polarization (CALIOP) on board the Cloud Aerosol Lidar and Infrared Pathfinder Satellite Observations (CALIPSO) has been used to design an algorithm that uses the CALIOP 20 Hz calibrated, attenuated backscatter profiles to derive blowing snow occurrence, layer height and optical depth (Palm et al., 2011), as well as to derive snow transport and snow sublimation rates over the full ice sheet since 2006 (Palm et al., 2017) and will be expanded using ICESat-2 data (Palm et al., 2018). However, satellite blowing snow detection is hampered by the presence of (optically thick) clouds, which implies that the blowing snow retrieval is limited to clear-sky or optically thin cloud conditions [<2: weak to 3: moderate (WMO classification)]. Additionally, the vertical resolution of CALIPSO limits the detection to blowing snow layers with minimum 30 meter thickness (Palm et al., 2017). And lastly, despite its potential for blowing snow detection, the CALIPSO product has not yet been validated.
The objective of this study is to compare the satellite retrievals of blowing snow from CALIPSO with novel ground-based ceilometer observations of blowing snow, and directly quantify the proportion of events missed by the satellite retrievals due to the presence of cloud decks. An algorithm has recently been developed to routinely detect the occurrence of blowing snow at two stations located in Dronning Maud Land, East Antarctica (Gossart et al., 2017). Ground-based remote sensing ceilometers offer the opportunity to derive blowing snow frequencies from the continuous measurement of attenuated backscatter. While it is very difficult to validate or even compare satellite-based retrievals of blowing snow with a point measurement on the ground, we believe the work presented here will help understand the limitations of the satellite measurements and highlight the utility of both products. We apply and compare two algorithms based on automatic measurements in order to identify blowing snow during precipitation and cloudy conditions.
In this paper, we will first describe the two data sets used in this study (section 2). Section 3 reveals the extent of the agreement and disagreement of both methods and in section 4 we conclude by describing the limitations of both detection methods for blowing snow, and provide some recommendations for future improvements.
2. Data and Methods
2.1. Satellite Data
The satellite retrievals of blowing snow in this study are based on measurements from the CALIOP (Cloud-Aerosol LIdar with Orthogonal Polarization), which measures vertical profiles of clouds and aerosols at 1,064 nm (backscatter intensity) and 532 nm (orthogonally polarized components). The 20 HZ CALIOP profiles equate to a horizontal resolution of 333 m along the satellite track. This lidar on board CALIPSO, launched in June 2006, is part of the A-train constellation of satellites and orbits the earth since 2006 at 705 km height (Winker et al., 2007, 2009). To retrieve blowing snow information, an algorithm was developed by Palm et al. (2011) and further refined in Palm et al. (2017). This algorithm uses the CALIPSO observations to derive blowing snow frequencies, layer heights, optical thicknesses, and also estimates the mass transport and the sublimation resulting from blowing snow, for the period 2006–2016 over the whole continent. Here we limit our analysis to the period 2011 to 2016, for which we have concurrent ground-based observations. The blowing snow data are now available at the NASA Langley Atmospheric Science Data Center and include satellite tracks (temporal and spatial coordinates) along with the derived presence of diamond dust, blowing snow occurrence (including a confidence level) as well as the wind speed and direction from the Goddard Earth Observing System Model, Version 5 [GEOS-5, Gelaro et al., 2017].
The original retrieval algorithm includes four steps (for an extensive description, see Palm et al., 2011, 2017). First, the surface is detected. This implies that no (optically thick) clouds can be present, which would completely attenuate the backscatter signal. The algorithm identifies the surface level by starting 200 m below the surface given by the digital elevation model (1 × 1 km resolution GMTED Digital Elevation Model (DEM) used in the Goddard Earth Observing System 5 [GEOS-5)], and searches upward until a sufficiently strong return of the attenuated backscatter signal indicates the surface. Second, the blowing snow algorithm compares the intensity of the signal at the first bin above the surface with a threshold equivalent to 10 times the local molecular backscatter. If the intensity surpasses the threshold, the algorithm identifies the bin as blowing snow with a high concentration of particles in the lowermost 30 m above the surface, i.e., snow particles dislodged and in saltation in the lowest atmospheric levels. Third, the algorithm then interrogates the bins higher in the atmosphere, looking for a large decrease in signal magnitude. This would indicate the top of the blowing snow layer. The search for the top is limited to 500 m above the surface. If the top of the blowing snow layer is not found within that height, it is considered diamond dust. Fourth, the algorithm only considers blowing snow events if the GEOS-5 10 m wind speed exceeds 4 m s−1. The vertical resolution of the CALIOP measurements is 30 m, which limits the detection to blowing snow layers of 30 m or greater.
Finally, the updated version of the algorithm (Palm et al., 2017) includes additional checks to screen for clouds in order to avoid low cloud layers being detected as blowing snow. Layers are removed if the maximum of the backscatter profile occurs above 300 m, or if the maximum signal exceeds a predefined threshold.
2.2. Ceilometers
Ceilometers are robust ground-based remote sensing instruments, consisting of a vertically pointing laser. The two instruments used in this study are manufactured by Vaisala, but have slightly different characteristics. The CL-31 ceilometer is set up on the roof of Princess Elisabeth station and measures up to 7,700 m above ground level (a.g.l.) (Gorodetskaya et al., 2015) and the CL 51 at Neumayer station reports measurements up to 13,500 m a.g.l. (Konig-Langlo and Loose, 2007). The ceilometer measures the attenuated backscatter profile at a frequency of 15 s, with a vertical resolution of 10 meters, used to derive the cloud base height, and information on the cloud phase and cloud cover. The ground based retrievals of blowing snow are derived from the blowing snow detection (BSD) algorithm (for more information, see Gossart et al., 2017), developed using the ceilometer measurements at Princess Elisabeth station and applicable at other stations (as demonstrated for Neumayer).
The BSD algorithm enables the retrieval of the blowing snow signal from the attenuated backscatter that is measured by the ceilometer. The BSD algorithm is similar to the blowing snow algorithm for the satellite data, with some modifications. There is no need for a surface detection algorithm and we do not apply any wind threshold. The BSD algorithm consist of two steps. First, it involves the comparison of the near-surface bin attenuated backscatter with the clear-sky threshold. If the backscatter surpasses the threshold, it indicates the presence of snow particles in the lower atmosphere just above the surface. Second, the BSD requires that the intensity of the signal must decrease with height, which indicates that the concentration of blowing snow particles declines within the layer, until the top of the blowing layer is reached.
Since ceilometers are pointing upward, they discriminate between blowing snow and no-blowing snow, during clear-sky and even in cloudy conditions. In order to detect the presence of clouds (with and without precipitation), the PT algorithm (Van Tricht et al., 2014) was used, which includes a signal-to-noise ratio correction. The PT algorithm allows the detection of geometrically thicker clouds (>90 m vertical extent), but does not consider thin clouds (lower limit of optical depth = 0.01). The BSD method has been compared to visual observations at Neumayer station, and the results agree for heavy blowing snow, but underdetections occur for lighter blowing snow events (Gossart et al., 2017), implying that the ceilometer fails to detect light blowing snow events, or blowing snow that only occurs very close to the ground. This limitation is explained by a combination of two instrument-specific issues. Firstly, the actual lowest measurement bin of the ceilometer, i.e., the first 15 m above the surface, must be discarded from the analysis because it is polluted by the internal noise of the instrument. Secondly, the ceilometers are installed on the roof of the stations, approximately 10–15 m above the actual surface. This implies that the ceilometer can only detect blowing snow starting at 30 m above the surface, effectively missing all shallower blowing snow layers.
2.3. Stations Location and Data Sampling
We compare the satellite retrievals of blowing snow, to the ceilometer derived blowing snow observations from two ground-based remote sensing ceilometers set up at the East Antarctic stations Neumayer and Princess Elisabeth. The latter was installed in 2009 as part of the cloud and precipitation observatory (Gorodetskaya et al., 2015; Gossart et al., 2017; Souverijns et al., 2017, 2018). The Princess Elisabeth station, located at 71.95°S and 23.35°E, 173 km from the coastline, is shielded by the Sør Røndane mountains (Figure 1). Blowing snow is observed 13% of the summer time by the ceilometer, and mainly associated with warm synoptic regimes (Gossart et al., 2017), related to the transient low-pressure systems passing nearby (Gorodetskaya et al., 2013, 2014).
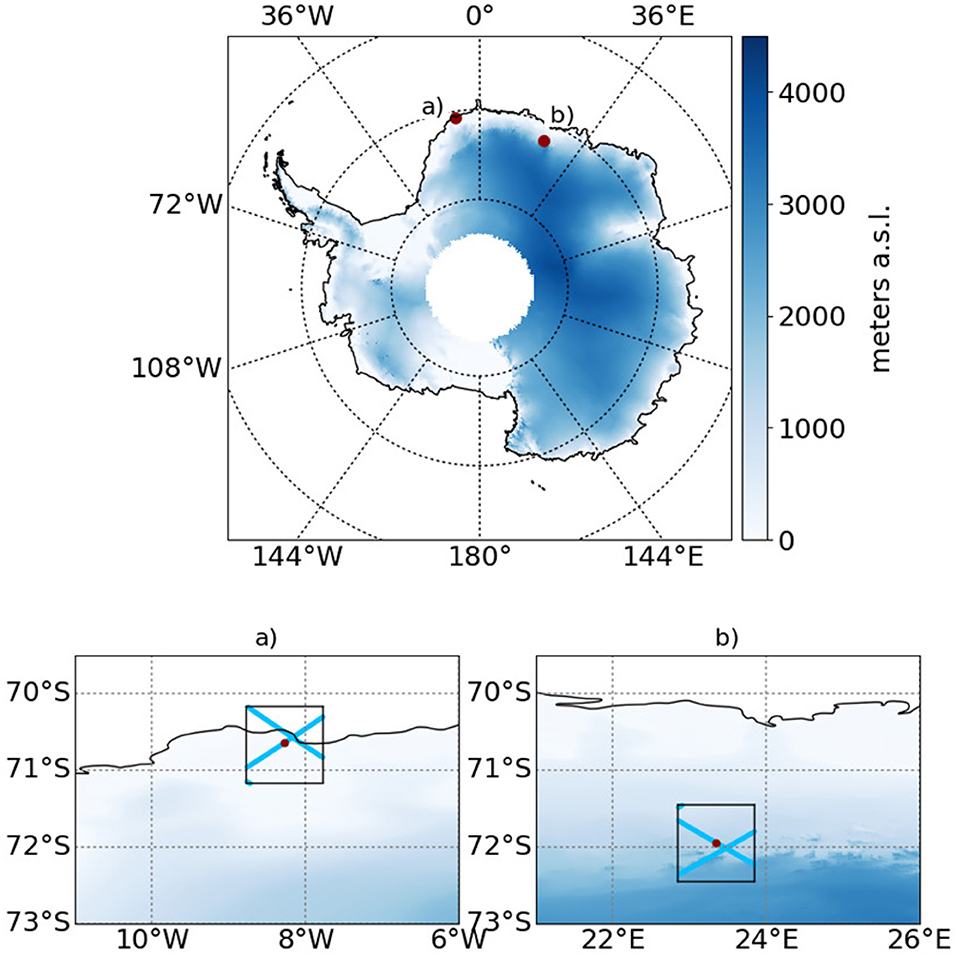
Figure 1. Location of the two Antarctic stations used in this study. Top: The Antarctic continent, the red dots indicate the location of the stations. Elevation is represented in blue. Bottom: zoom over (a) the Neumayer and (b) Princess Elisabeth stations. The gray boxes represent the 1 × 1° area. Elevation is represented in blue and the satellite track is represented by the light blue lines.
The second ceilometer was installed in 2011 at Neumayer station, located on the Ekström ice shelf close to the coast (70.67°S and 8.27°E, Figure 1). Generally, the climate at Neumayer is warmer and windier than at Princess Elisabeth (Table 1). The synoptic origin for blowing snow is also predominant at Neumayer station (Konig-Langlo and Loose, 2007). There, yearly blowing snow frequencies attain nearly 40%, but with substantial seasonal and inter-annual variability (Lenaerts et al., 2009). The blowing snow events presented in this paper are linked to synoptic conditions, and this process is important and not being addressed yet due to difficulty of observations. This work is a step toward addressing this problem.
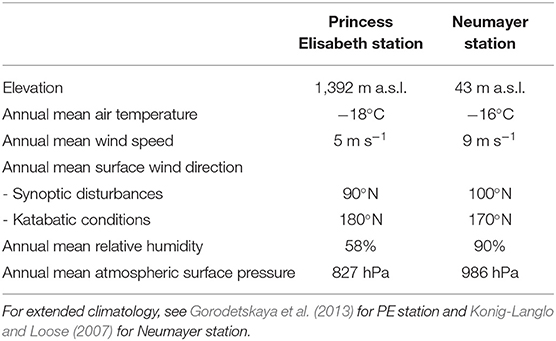
Table 1. Meteorological conditions at Princess Elisabeth and Neumayer stations.
The measurement period of the CL-31 at Princess Elisabeth station starts in February 2010 and extends up to May 2016, but is mainly limited to the Summer and Fall Antarctic seasons (November to May), as a result of power outages occurring at the station during the Antarctic winter. Only 1 year (2015) is fully recorded. At Neumayer station, observations are available from 2011 to 2016, without significant data gaps.
We define 1 × 1° boxes centered around the two stations as the evaluation domain (gray boxes in Figure 1). We consider each of the satellite overpasses (blue tracks) within the box, for the time period that is concurrent to ceilometer measuring at the station. Each of these overpasses is then considered a “case” and compared to the ceilometer retrievals of the same day and time. There are 232 cases (or overpasses with coincident data) at Neumayer and 132 at Princess Elisabeth station. Because both sensors have a vertical resolution of 30 m they can only detect blowing snow layers of a minimum of 30 m height (due to the location of the instruments and the hardware artifact for the ceilometer and the vertical resolution of the CALIOP sensor for the satellite), the two instruments should be able to retrieve the same blowing snow events, while missing the shallower events.
Although the CALIPSO satellite repeats the exact same track every 16 days, overpass frequencies and timing differ for both stations (see Table 2). At Princess Elisabeth station, three distinct tracks can be considered: the first track passes within a radius of ≈ 3 km from the station at 13:55 UTC, while the second track is located ≈ 12 km away from the station at 22:25 UTC, and the most distant overpass is located ≈ 66 km away from the station, at 22:31 UTC. The combination of all tracks results in an overpass frequency every 3rd or 9th day. At Neumayer station, there are two overpasses every 16 days: the first one at 15:53 UTC on day one at about 18 km from the station, the second at 00:41 UTC on day 3 within about 5 km of the station.
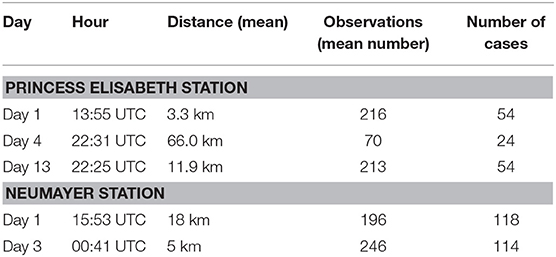
Table 2. Overview of the overpasses at Princess Elisabeth and Neumayer stations.
For each case, we consider the full length of the satellite track within the domain. The satellite clear-sky fraction is calculated by counting the number of surface detections over the total length of the track and dividing by the total number of observations along the track. The cloud coverage fraction is subsequently derived as one minus the clear-sky fraction. Then, the number of clear-sky conditions with and without blowing snow is calculated by determining the number of (no-)blowing snow detections along the clear-sky part of the track. For this purpose, blowing snow occurrence is assumed if the blowing snow confidence level is higher than 1 as described in Palm et al. (2017).
To match the spatial sampling of the satellite, we define a 20 min time window during which we consider ceilometer data. The ceilometer measurements at the exact moment of satellite overpass plus/minus 10 min are compared to the satellite track. Subsequently ceilometer-derived cloudy and clear-sky fractions are calculated from the number of measurements indicating the presence/absence of clouds over the total number of observations within the 20 min time window. In addition, the BSD algorithm is used to determine the fraction of blowing and no-blowing snow. This leads to the determination of the ratio of three combinations: clear-sky with blowing snow, clear-sky without blowing snow, and cloudy conditions. The latter can be associated with the presence or absence of blowing snow by the ceilometer, but since the satellite has no information on the presence or absence of blowing snow under cloudy conditions.
For each individual case, we compare the satellite-based and ground-based fraction of clear-sky and cloudy conditions. We then focus on the fraction of clear-sky blowing snow, as well as the fraction of blowing snow occurring under cloud cover as detected by the ceilometer, thus omitted by the satellite detection. Statistics of these matches and mismatches are expressed over the whole sample size (total number of overpasses).
For both detection methods, the cloud fraction indicates whether we are in presence of cloudy or clear sky conditions. Since the cloud distribution over the study area is bi-modal and either equal or close to 0 or 100%, we put a 50% threshold for cloud/clear sky detection. This implies that if there is > 50% ground return along the satellite track, the entire case is considered as clear sky, and < 50% ground return is identified as a cloudy case. The same is applied to the ceilometer data: if > 50% of the ceilometer data within the time window indicates the presence of a cloud, the whole case is considered as cloudy, and < 50% of cloud presence indicates clear sky conditions.
We determine the blowing snow threshold as follows: Figure 2 indicates that the optimum to minimize errors, but keeping a minimal number of blowing snow events, is reached between 0 and 10% blowing snow detection along the satellite track. While most of the ceilometer timeseries indicates either no blowing snow, or a continuous blowing snow signal, the 10% threshold for blowing snow detections is mostly decisive for the satellite retrievals. Indeed, many cases have between 0 - 10% blowing snow along track, including single isolated blowing snow returns. Most of these cases are not detected by the ceilometer.
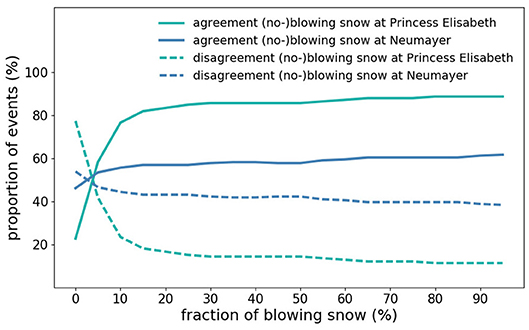
Figure 2. Distribution on agreement on (no-) blowing snow (solid lines) and disagreement on (no-)blowing snow (dashed lines) at Princess Elisabeth station (green) and Neumayer station (blue).
We define agreement on clouds/clear sky as cases when both the ceilometer and the satellite indicate clear sky conditions (cloud fraction below 50%) or the presence of clouds (cloud fraction over 50%) while the agreement on the presence/absence of blowing snow indicates if the blowing snow fraction is over/under 10% for both instruments. The latter implies that the conditions are different for the two instruments : blowing snow retrieved from the satellite originates from clear sky conditions only, while the ceilometer blowing snow detection are obtained from all observations (including both clear sky and cloudy conditions). Then, commission errors occur if the satellite-derived measurement indicates the presence of blowing snow, but the ceilometer does not. Finally, omission errors arise if blowing snow is detected by the BSD algorithm, but the satellite product does not indicate the presence of blowing snow. During the occurrence of optically thick clouds, the satellite is unable to measure beyond the cloud cover and no information can be retrieved about blowing snow occurrences. Finally, we also investigate the total agreement : if the two devices agree simultaneously on the cloud/clear sky fraction and the presence/absence of blowing snow.
3. Results and Discussion
3.1. Cloud/Clear Sky Fraction
The comparison of clouds and clear sky conditions, Figure 3, shows that the two sensors display varying results. The ceilometer detects either 0–10, or 90–100% cloud cover while the range of the cloud fraction measured by the satellite varies more. At the Princess Elisabeth station, ceilometer-detected clear-sky conditions (cloud fraction <50%) occur more frequently than cloudy conditions (cloud fraction >50%, Figure 3). This can also be seen from Table 3 where the agreement on clear-sky conditions reaches 47%, and 37% of the cloudy cases are correctly detected by both methods. In 10% of the cases, the satellite omits the clouds seen by the ceilometer, and it identifies 6% of clear sky conditions as clouds. At Neumayer, cloudy conditions dominate. Table 3 indicates that the agreement between satellite and ceilometer clear sky reaches 20%, and 69% for cloudy conditions. The cases where the satellite retrieval indicates clear sky, while a cloud is detected in the ceilometer attenuated backscatter signal (9%) outweights the opposite (2%).
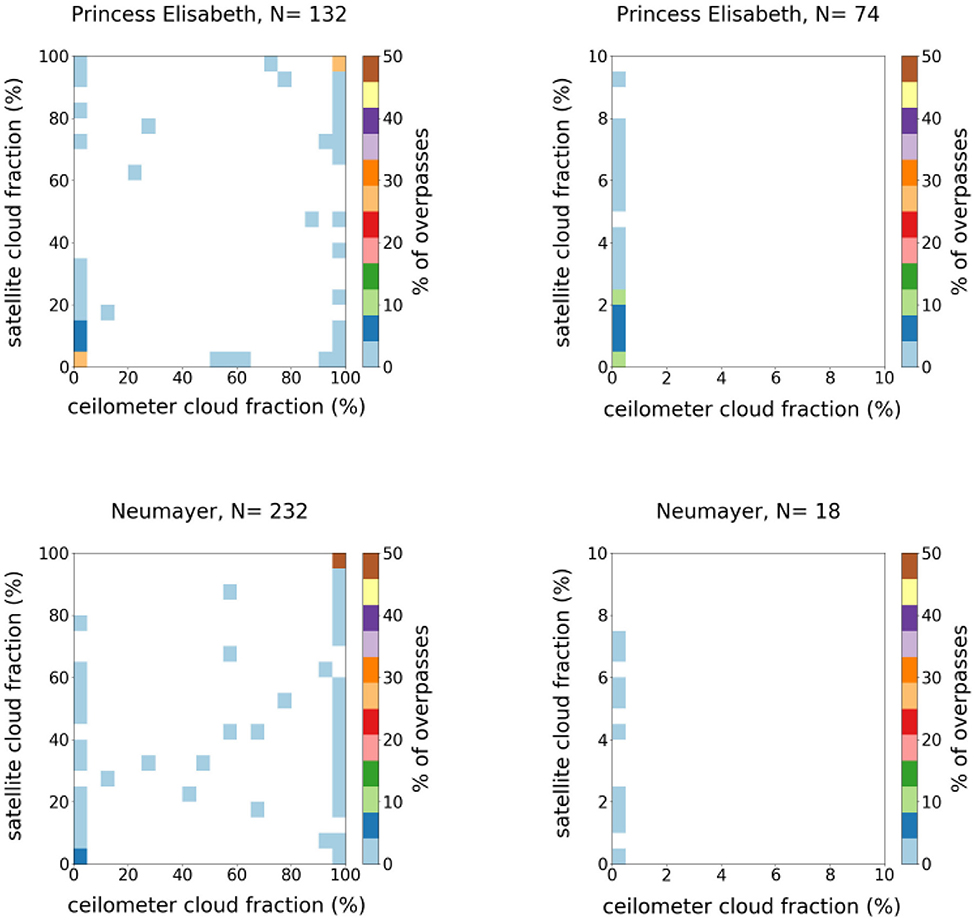
Figure 3. Concurrent measurements of cloud fraction at top Princess Elisabeth and bottom Neumayer stations, as derived from the ceilometer signal (x-axis) and the satellite return (y-axis). The right graph is a zoom between 0 and 10 % for both detection methods.
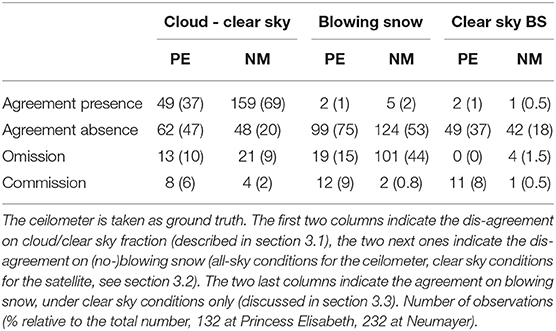
Table 3. Overview of the agreement between ceilometer and satellite detections at the Princess Elisabeth (PE) and Neumayer (NM) stations.
Since thin clouds are identified by the ceilometer, at optical depths of minimum 0.01, but are not thick enough to totally attenuate the satellite backscatter signal (this only happens when the cloud has an optical depth greater than about 2–3), mismatches can occur for thin clouds. This can be explained by the differences in the two sensors: the satellite does not detect a cloud if it is a thin cloud while the ceilometer does (Figure 5B).
3.2. Blowing Snow Fraction
Table 4 presents the blowing snow frequencies, individually retrieved for each of the detection methods applied independently. We consider the whole time series at the two stations, without time collocation between the ceilometer measurements and the satellite overpasses. We apply the BSD algorithm to the full ceilometers datasets to get blowing snow rates as in Gossart et al. (2017). The satellite data consists of each overpass over the defined domains. We then count the number of ground detection including the presence of blowing snow over the total number of blowing snow detections. We also distinguish between summer and winter measurements. We also applied the 10% threshold on the satellite data (each ground detection is evaluated independently) and we keep the blowing snow restriction to ceilometer events lasting at least 20 min to be defined as blowing snow.
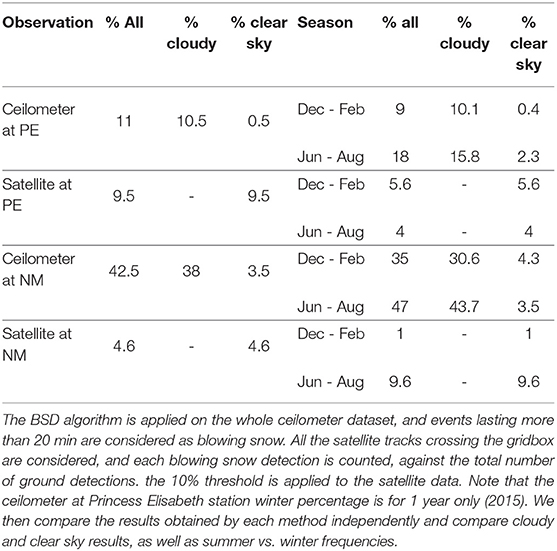
Table 4. Presentation of the blowing snow frequencies over the 2011–2016 time period at Princess Elisabeth and Neumayer stations, as retrieved from the two different sensors individually (the whole time series is considered for each sensor, no time collocation is applied).
Looking only at the ceilometer results, Table 4 demonstrates that blowing snow occurs 11% of the time at Princess Elisabeth (summer-only in 2011–2014 and 2016 + year-round in 2015) and 42.5% at Neumayer station (data available for the whole year from 2011 to 2016). Clear sky blowing snow is rare at both stations, resulting in >90% blowing snow detection occurring under cloudy conditions. Figure 4 and Table 3 illustrate the blowing snow fraction as detected by both the BSD (all-sky) and the satellite (clear-sky only) algorithms at Princess Elisabeth and Neumayer stations. Most cases indicate the absence of blowing snow for both sensors (75% at Princess Elisabeth and 53% at Neumayer). The satellite measurements are limited to clear sky conditions, and while there were only two clear sky blowing snow events (1%) at Princess Elisabeth, they are both retrieved by the satellite (Tables 3, 5). At Neumayer, there are five clear sky blowing snow cases, one of which is detected by the satellite (and the rest is missed, Tables 3, 6). However, there are four cases of cloudy blowing snow, which are identified as clear sky blowing snow by the satellite leading to an agreement on the presence of blowing snow over 5 cases (2%). Moreover, taking into account the absence of blowing snow as detected by both sensors, the agreement on (no-)blowing snow occurrence reaches 76 and 55% of the cases at Princess Elisabeth and Neumayer, respectively.
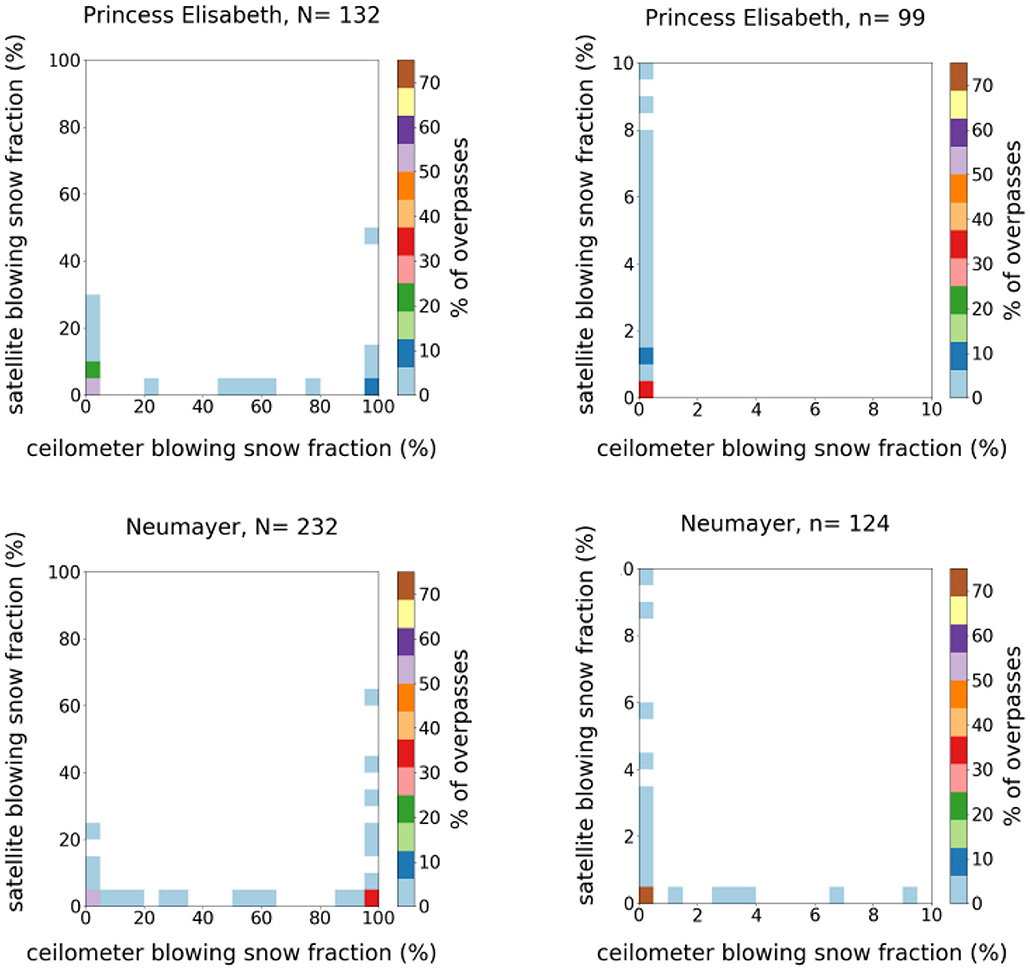
Figure 4. Concurrent measurements of blowing snow fraction at top Princess Elisabeth and bottom Neumayer stations, as derived from the ceilometer signal (x-axis) and the satellite return (y-axis). The detections include all-sky measurements for the ceilometer and clear-sky only for the satellite. The right graph is a zoom between 0 and 10% for both detection methods.
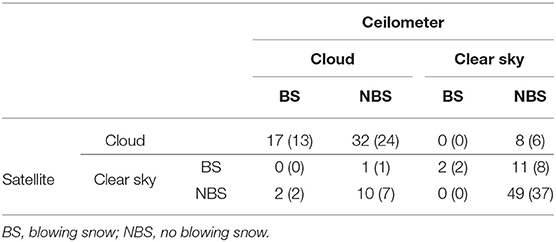
Table 5. Overview of the comparison between ceilometer and satellite detections at the Princess Elisabeth station, number of observations (% relative to the total number, 132).

Table 6. Overview of the comparison between ceilometer and satellite detections at the Neumayer station, number of observations (% relative to the total number, 323).
The number of blowing snow detection along the satellite track never reaches more than 30%, while the ceilometer often measures blowing snow over the whole sample time. The clear sky omission errors (blowing snow detected by the ceilometer algorithm, but not the satellite) are close to zero for both stations (Table 3). In contrast, clear sky commission errors (clear sky blowing snow detected by the satellite algorithm, but not the ceilometer) reach 8% at Princess Elisabeth station, and are negligible at Neumayer station. Tables 5, 6 give the results for the 12 combinations of cloud/clear sky and absence/presence of blowing snow. A significant part of the blowing snow occurring during cloudy conditions is totally missed by the satellite algorithm. These omissions occur because the satellite only detects the clouds (the attenuated backscatter signal does not penetrate through the cloud, Figure 5A). This satellite under-detection of blowing snow represents 13 and 39% of all cases at Princess Elisabeth and Neumayer stations, respectively. This implies that if there is a cloud, in 30% of the cases, it is are accompanied by blowing snow at Princess Elisabeth and 56% at Neumayer station.
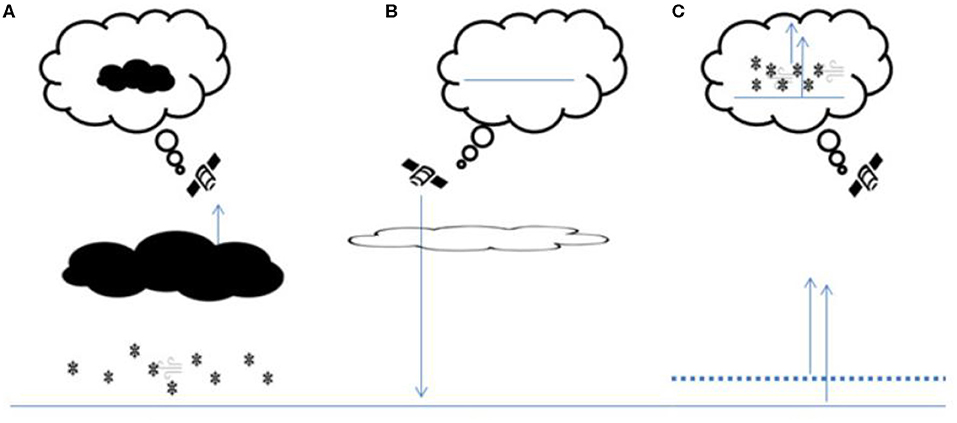
Figure 5. Possible type of blowing snow commission/omission and cloud/clear sky mis-classification. (A) The ceilometer-based BSD detects a blowing snow layer overlaid by clouds, while the satellite detects clear sky and effectively misses the blowing snow. (B) The ceilometer detects a cloud, which is transmissive and seen through by the satellite. (C) The satellite algorithm detects a blowing snow layer unseen by the ceilometer (possibly due to the pollution of the first bin above ground, misinterpretation of the ground return or of a low cloud or fog as blowing snow).
Overall, looking at both cloudy and clear sky conditions, the satellite only slightly underestimates summer blowing snow frequency at Princess Elisabeth station (15% omission vs. 9% commission), but strongly underestimates yearly blowing snow frequency by 44% at Neumayer station (Table 3). This indicates that while the omission and commission errors nearly compensate at Princess Elisabeth, this is not the case for Neumayer. There, satellite retrieved blowing snow frequencies under clear sky conditions are not at all representative for the all sky blowing snow frequencies.
Palm et al. (2018) estimates the magnitude of the error in blowing snow frequencies associated with the inability of the satellite to detect cloudy blowing snow, that blowing snow was occurring 50% of the time for the profiles without a ground return (presence of a cloud). This leads to a 25–30% error increase in blowing snow occurrence over coastal areas of East Antarctica (all-sky). Yet, our results show that at Princess Elisabeth station, assuming that 50% of the clouds are associated with blowing snow is an overestimation, since only 30% of the cloudy conditions are accompanied with blowing snow as detected by the ceilometer. At Neumayer, however, the occurrence of blowing snow during cloudy conditions (56%) is closer to the estimate of Palm et al. (2018).
To investigate whether the cloud information from satellites would be useful to get information on the probability of blowing snow occurring under cloud cover, we examined the cloud top height and structure from CALIOP attenuated backscatter on cases identified as cloudy by both sensors, with and without blowing snow as detected by the ceilometer. Table 7 summarizes the results by cloud (top) height. The results indicate that at both stations, blowing snow is much more likely to occur in the presence of high clouds (cirrus-like, with a large vertical extent that totally attenuates the lidar signal) and to not occur when low clouds (generally stratus or stratocumulus, totally attenuating the lidar signal) are present.

Table 7. Classification of cloudy events detected by both sensors, per cloud top height above ground (as detected by CALIOP).
Regarding the mismatches, at Princess Elisabeth station 8% of the cases are signaled as blowing snow by the satellite retrieval algorithm, while the ceilometer indicates clear sky but no blowing snow. These blowing snow commission errors during clear sky are most likely due to spatial inhomogeneity of blowing snow, especially in the case of a CALIPSO track at the edge of the domain. In addition, it is possible that the satellite falsely detects the presence of blowing snow by mistaking a portion of the surface signal for blowing snow (Figure 5C). Since Princess Elisabeth is located at the foot of the Sør Røndane mountains (Figure 1), and these commission errors are not observed at Neumayer station, such errors might relate to the coarser terrain.
3.3. Total Agreement
Table 3 indicates that the total agreement (clear sky agreement, simultaneous with (no-)blowing snow agreement) reaches 38% at Princess Elisabeth station (1% blowing snow occurrence—37% absence of blowing snow) and 18.5% at Neumayer station. Since the detection of blowing snow is impeded by the presence of thick clouds, the frequencies derived from the satellite retrievals are realistic for clear-sky or thin cloud conditions only. The ceilometer retrieval illustrated in Figure 6 shows the distribution of blowing snow frequencies retrieval by the ceilometer over the collocated timeseries, under both cloudy and clear-sky conditions. There are almost no blowing snow under clear-sky conditions and these events last for the whole time window at Princess Elisabeth station. Clear-sky blowing snow events can be shorter at Neumayer station, but remain very rare. In opposition, the frequencies of blowing snow accompanied with clouds are much larger than for clear sky conditions and most of them reach 20 min. This implies that taking clear-sky conditions is not representative for all-sky conditions. The size and magnitude of the events (distribution) is sensibly similar for blowing snow under both conditions, but leaving out the cloudy events reduces a lot the frequency of blowing snow.
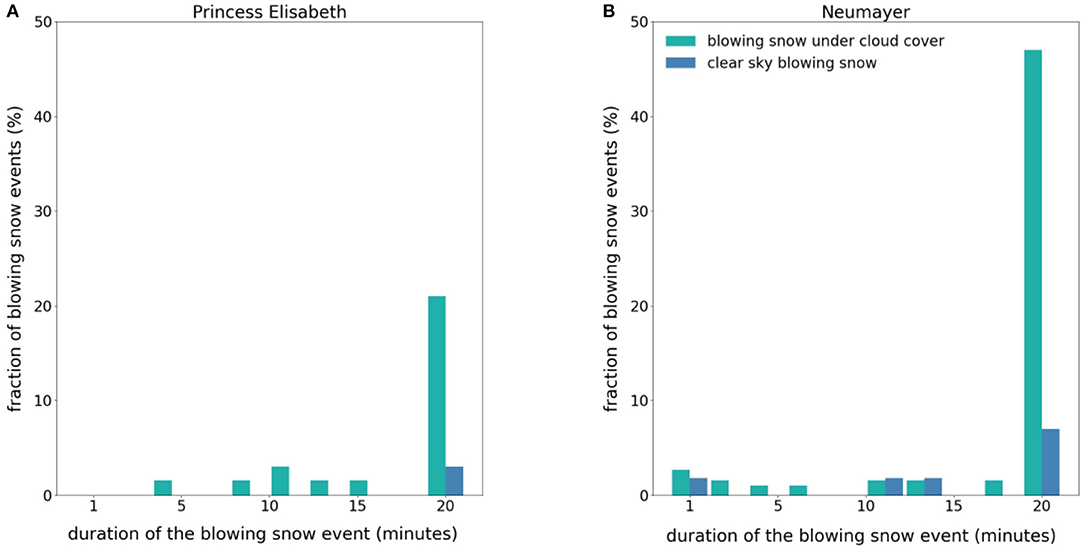
Figure 6. Distribution of the blowing snow frequencies as detected by the ceilometer over the collocated timeseries. The length of the event is displayed along the x-axis (in minutes, 20 min being 100%) and the proportion of events as y-axis. The proportion represents the number of events over the total of these events (e.g., the fraction of blowing snow accompanied with clouds over the total number of cloudy events and the fraction of clear sky blowing snow over the total number of events during clear sky conditions) at (A) Princess Elisabeth and (B) Neumayer stations.
Table 4 indicates that the blowing snow frequencies retrieved from the satellite only reach 11%, similar to the 9.5% detected by the ceilometer at Princess Elisabeth station, which indicates that the omission and commission errors compensate. At Neumayer, however, there is no compensation between commission and omission errors, which leads to a substantially lower blowing snow rate detected by the satellite (4.6%) than indicated by the ceilometer (42.5%), predominantly due to the presence of cloud decks. Blowing snow occurs predominantly in cloudy conditions at both Princess Elisabeth and Neumayer stations.
3.4. Limitations of Blowing Snow Detection
Plausible reasons for the non-agreement on blowing snow occurrence between the two sensors include (1) the spatial inhomogeneity of blowing snow, (2) the identification of the ground return by the satellite, (3) the definition of “blowing snow event” and (4) the differences in the blowing snow detection methods of each sensor as described in Palm et al. (2011) and Gossart et al. (2017).
(1) The low frequency of winter blowing snow observed at Princess Elisabeth is due to its particular location. The station happens to be right in a large gradient of blowing snow frequency, leading to low blowing snow frequencies, even in winter. While clear sky winter blowing snow frequency detected by the satellite is limited to 7.5% at Princess Elisabeth, the next 1 × 1° box South of the station shows satellite detected blowing snow frequencies of 50% for the winter 2015. Such local variations in blowing snow frequency patterns highlight the utility of point measurements and the difficulty to compare spatial averages to local point measurements.
(2) Most of the clear sky conditions at Princess Elisabeth do not indicate the presence of blowing snow. However, the satellite detects a blowing snow signal for 8% of these events. Since both sensors indicate clear sky conditions, the bin identified as the first bin above the ground by the satellite could contains some surface signal which is then interpreted as blowing snow. The latter would happen only over very rough terrain and mountains (Figure 5C).
(3) Comparing a point measurement on the ground to a satellite track within a 1 × 1° grid is challenging and implies the set up of thresholds. This might explain part of the differences between the two detection results (see Table 4), where blowing snow frequencies are measured by the two methods independently. Moreover the ceilometer at Princess Elisabeth station is limited mainly to summer data, where the satellite retrievals during the summer are very sparse, especially in this area.
In addition, there are differences between the method defined in Palm et al. (2011) and Palm et al. (2017) to retrieve blowing snow frequencies within 1 × 1° gridcells for the whole continent, and the method used in this paper. Palm et al. (2011) and Palm et al. (2017) takes into account all overpasses within the gridcell over a defined time period, where each ground detection is an “observation.” As such, all the cloudy observations are removed. Subsequently, they count the number of CALIOP observations complying with the blowing snow detection algorithm defined in section 2.1. These detections are summed and divided by the number of cloud-free detections within the 1 × 1° cell to compute frequencies in that cell over a certain time period. In that way, the tracks are not investigated individually but all added together. In our paper, we investigate each track individually, to compare to the corresponding ceilometer measurement. We set up the minimum of 10% blowing snow measurement along the track to rule out potential noise and isolated detections, while these detections are taken into account in Palm et al. (2011) and Palm et al. (2017) method. We show that if the (Palm et al., 2011, 2017) method gives acceptable results for continent-wide or regional estimations, it most probably leads to commission errors if validated with ground truth at areas near the coast on the ice sheet. Moreover, the error associated to the presence of clouds in Palm et al. (2018), estimated at 50%, exceeds the occurrence of blowing snow at Princess Elisabeth station.
3.5. Conclusions
In this paper, we compare the space borne blowing snow retrieval based on the CALIOP lidar on board the CALIPSO satellite with blowing snow retrievals from attenuated backscatter profiles from ground-based remote sensing ceilometers set up at two stations in East Antarctica. We define a 1 × 1° grid centered on both stations and investigate each satellite overpass within the predefined domain to concurrent ceilometer data within a 20 min time window. The measurement period extends from 2011 to 2016 year-round at Neumayer and is limited to the summer months mainly at Princess Elisabeth station.
We compare the correspondence in clear sky blowing snow detection and cloud detection by the satellite with the Blowing Snow Detection (BSD) algorithm, based on the ceilometer attenuated backscatter profile, in order to quantify the percentage of time that blowing snow occurs during cloudy conditions that result in the satellite not being able to render a decision. This is valuable information that could be used to help correct the satellite estimates of blowing snow near the coasts.
First, cloud decks shield blowing snow events from the satellite, whereas the ceilometer can identify blowing snow during cloudy conditions. This is not trivial, since over 90% of the blowing snow occurs under cloud cover at Princess Elisabeth and Neumayer stations. Moreover, clear-sky blowing snow commission errors equal 8% at Princess Elisabeth station, probably due to the inhomogeneity of the event and/or the bin identified as the first bin above the ground contains some surface signal which is then interpreted as blowing snow. Such commission errors can happen in rough terrain, and are absent at Neumayer, located on a flat ice shelf.
Further, the comparison developed in this paper is limited to two stations where blowing snow is significantly driven by synoptic events (occurs only/mostly during cloudy conditions), which is not the case for the entire ice sheet. We therefore advise to compare the satellite algorithm to more inland stations, where the influence of clouds is reduced.
Our analysis shows that the satellite blowing snow retrieval is a useful product but further investigation is needed to reduce the uncertainty on blowing snow frequencies under cloud cover. In such areas, it may be important to investigate further the differences in cloud type or height to better estimate the likelihood of blowing snow occurrence. Investigating the difference in cloud classification for both sensors could further constrain mismatches between the two detection methods.
Finally, our analysis has shown that, while the satellite-derived product is a useful tool to estimate blowing snow frequencies over Antarctica, it is limited to clear sky or thin cloud conditions which predominate over the interior of East Antarctica. In coastal areas and most of West Antarctica, opaque clouds are often present and the satellite retrieval misses all of the synoptic-driven blowing snow.
Data Availability Statement
Publicly available datasets were analyzed in this study. This data can be found here: The Blowing Snow Detection algorithm is freely available by contacting YWxleGFuZHJhLmdvc3NhcnRAa3VsZXV2ZW4uYmU=, Neumayer station datasets are publicly available on the Pangaea portal (König-Langlo, 2012, 2013, 2014, 2015, 2016, 2017), data from the instruments at Princess Elisabeth station are available on the www.aerocloud.be CALIPSO blowing snow data are now available at the NASA Langley Atmospheric Science Data Center (ASDC) at https://earthdata.nasa.gov/about/daacs/daac-asdc.
Author Contributions
AG conceived the study with NS, JL, SL, and NL. SP provided the satellite data and performed the cloud top height analysis. AG led the analysis and wrote the initial version of the paper. All authors contributed to the interpretation of the results and the writing of the manuscript.
Funding
This work was supported by the Belgian Science Policy Office (BELSPO; grant number BR/143/A2/AEROCLOUD) and the Research Foundation Flanders (FWO; grant number G0C2215N). The CALIPSO blowing snow algorithm and data analysis was performed under NASA contracts NNH14CK40C and NNH14CK39C. IG thanks FCT/MCTES for the financial support to CESAM (UID/AMB/50017/2019), through national funds.
Conflict of Interest
The authors declare that the research was conducted in the absence of any commercial or financial relationships that could be construed as a potential conflict of interest.
Acknowledgments
We thank the logistic teams and the Royal Meteorological Institute for executing the yearly maintenance of our instruments at the Princess Elisabeth station and for their help by installing and setting up the new AWS. We thank Wim Boot, Carleen Reijmer, and Michiel Van den Broeke (Utrecht University, Institute for Marine and Atmospheric Research Utrecht) for the development of the automatic weather station, technical support, and raw data processing. The authors would like to thank NASA program managers Thomas Wagner and David Considine for their support and encouragement. This manuscript has been released as a Pre-Print at The Cryosphere Discussions (tc-20191-25) (Gossart et al., 2019). We thank two reviewers for their contribution in the improvement of the paper.
References
Amory, C., Trouvilliez, A., Gallee, H., Favier, V., Naaim-Bouvet, F., Genthon, C., et al. (2015). Comparison between observed and simulated aeolian snow mass fluxes in Adelie Land, East Antarctica. Cryosphere 9, 1373–1383. doi: 10.5194/tc-9-1373-2015
Bintanja, R. (1998). The contribution of snowdrift sublimation to the surface mass balance of Antarctica. Ann. Glaciol. 27, 251–259. doi: 10.3189/1998AoG27-1-251-259
Bintanja, R., and Reijmer, C. H. (2001). A simple parameterization for snowdrift sublimation over Antarctic snow surfaces. J. Geophys. Res. Atmos. 106, 31739–31748. doi: 10.1029/2000JD000107
Bintanja, R., and Van den Broeke, M. R. (1995). The surface energy balance of antarctic snow and blue ice. J. Appl. Meteorol. 34, 902–926. doi: 10.1175/1520-0450(1995)034<0902:TSEBOA>2.0.CO;2
Dai, X., and Huang, N. (2014). Numerical simulation of drifting snow sublimation in the saltation layer. Sci. Rep. 4:6611. doi: 10.1038/srep06611
Dery, S. J., and Yau, M. K. (2002). Large-scale mass balance effects of blowing snow and surface sublimation. J. Geophys. Res. Atmos. 107, ACL 8-1-ACL 8-17. doi: 10.1029/2001JD001251
Gallée, H., Guyomarc'h, G., and Brun, E. (2001). Impact of snow drift on the antarctic ice sheet surface mass balance: possible sensitivity to snow-surface properties. Bound. Layer Meteorol. 99, 1–19. doi: 10.1023/A:1018776422809
Gelaro, R., McCarty, W., Suarez, M., Todling, R., Molod, A., Takacs, L., et al. (2017). The modern-era retrospective analysis for research and applications, version 2 (MERRA-2). J. Clim. 30, 5419–5454. doi: 10.1175/JCLI-D-16-0758.1
Gorodetskaya, I. V., Kneifel, S., Maahn, M., Van Tricht, K., Thiery, W., Schween, J. H., et al. (2015). Cloud and precipitation properties from ground-based remote-sensing instruments in East Antarctica. Cryosphere 9, 285–304. doi: 10.5194/tc-9-285-2015
Gorodetskaya, I. V., Tsukernik, M., Claes, K., Ralph, M. F., Neff, W. D., and Van Lipzig, N. P. M. (2014). The role of atmospheric rivers in anomalous snow accumulation in East Antarctica. Geophys. Res. Lett. 41, 6199–6206. doi: 10.1002/2014GL060881
Gorodetskaya, I. V., Van Lipzig, N. P. M., Van den Broeke, M. R., Mangold, A., Boot, W., and Reijmer, C. H. (2013). Meteorological regimes and accumulation patterns at Utsteinen, Dronning Maud Land, East Antarctica: analysis of two contrasting years. J. Geophys. Res. Atmos. 118, 1700–1715. doi: 10.1002/jgrd.50177
Gossart, A., Palm, S. P., Souverijns, N., Lenaerts, J. T. M., Gorodetskaya, I. V., Lhermitte, S., et al. (2019). Blowing snow in East Antarctica: comparison of ground-based and space-borne retrievals. Cryosphere Discussions 2019, 1–19. doi: 10.5194/tc-2019-25
Gossart, A., Souverijns, N., Gorodetskaya, I. V., Lhermitte, S., Lenaerts, J. T. M., Schween, J. H., et al. (2017). Blowing snow detection from ground-based ceilometers: application to East Antarctica. Cryosphere 11, 2755–2772. doi: 10.5194/tc-11-2755-2017
Groot Zwaaftink, C. D., Cagnati, A., Crepaz, A., Fierz, C., Macelloni, G., Valt, M., and Lehning, M. (2013). Event-driven deposition of snow on the Antarctic Plateau: analyzing field measurements with SNOWPACK. Cryosphere 7, 333–347. doi: 10.5194/tc-7-333-2013
Hirasawa, N., Nakamura, H., Motoyama, H., Hayashi, M., and Yamanouchi, T. (2013). The role of synoptic-scale features and advection in prolonged warming and generation of different forms of precipitation at Dome Fuji station, Antarctica, following a prominent blocking event. J. Geophys. Res. Atmos. 118, 6916–6928. doi: 10.1002/jgrd.50532
Kodama, Y., Wendler, G., and Gosink, J. (1985). The Effect of Blowing Snow on Katabatic Winds in Antarctica. Ann. Glaciol. 6, 59–62. doi: 10.1017/S026030550000999X
König-Langlo, G. (2012). Meteorological Synoptical Observations From Neumayer Station. Bremerhaven: Alfred Wegener Institute, Helmholtz Center for Polar and Marine Research, PANGAEA. doi: 10.1594/PANGAEA.783629
König-Langlo, G. (2013). Meteorological Synoptical Observations From Neumayer Station. Bremerhaven: Alfred Wegener Institute, Helmholtz Center for Polar and Marine Research, PANGAEA. doi: 10.1594/PANGAEA.811874
König-Langlo, G. (2014). Ceilometer Raw Data Measured at Neumayer Station. Bremerhaven: Alfred Wegener Institute, Helmholtz Center for Polar and Marine Research, PANGAEA. doi: 10.1594/PANGAEA.834355
König-Langlo, G. (2015). Ceilometer Raw Data Measured at Neumayer Station. Bremerhaven: Alfred Wegener Institute, Helmholtz Cen-ter for Polar and Marine Research, PANGAEA. doi: 10.1594/PANGAEA.845419
König-Langlo, G. (2016). Ceilometer Raw Data Measured at Neumayer Station. Bremerhaven: Alfred Wegener Institute, Helmholtz Center for Polar and Marine Research, PANGAEA. doi: 10.1594/PANGAEA.858536
König-Langlo, G. (2017). Meteorological Synoptical Observations From Neumayer Station, 2013-01 to 2016-01. Alfred Wegener Institute, Helmholtz Center for Polar and Marine Research, PANGAEA. doi: 10.1594/PANGAEA.150030
Konig-Langlo, G., and Loose, B. (2007). The Meteorological Observatory at Neumayer Stations (GvN and NM-II) Antarctica. Polarforschung2006 76, 25–38. doi: 10.2312/polarforschung.76.1-2.3
Lenaerts, J. T. M., and Van den Broeke, M. R. (2012). Modeling drifting snow in Antarctica with a regional climate model: 2. Results. J. Geophys. Res. Atmos. 117:D05109 doi: 10.1029/2010JD015419
Lenaerts, J. T. M., Van den Broeke, M. R., Déry, S. J., König-Langlo, G., Ettema, J., and Munneke, P. K. (2010). Modelling snowdrift sublimation on an Antarctic ice shelf. Cryosphere 4, 179–190. doi: 10.5194/tc-4-179-2010
Leonard, K. C., Tremblay, L., Thom, J., and MacAyeal, D. (2012). Drifting snow threshold measurements near McMurdo station, Antarctica: a sensor comparison study. Cold Regions Sci. Technol. 70, 71–80. doi: 10.1016/j.coldregions.2011.08.001
Loewe, F. (1970). “The transport of snow by the wind,” in Studies on Drifting Snow. Meterology Report 13. University of Melbourne. Meteorology Dept. Publication, University of Melbourne, Meteorology Department, 21–69.
Palm, S. P., Kayetha, V., and Yang, Y. (2018). Toward a satellite-derived climatology of blowing snow over Antarctica. J. Geophys. Res. Atmos. 123, 10301–10313. doi: 10.1029/2018JD028632
Palm, S. P., Kayetha, V., Yang, Y., and Pauly, R. (2017). Blowing snow sublimation and transport over Antarctica from 11 years of CALIPSO observations. Cryosphere 11, 2555–2569. doi: 10.5194/tc-11-2555-2017
Palm, S. P., Yang, Y., Spinhirne, J. D., and Marshak, A. (2011). Satellite remote sensing of blowing snow properties over Antarctica. J. Geophys. Res. Atmos. 116:D16123. doi: 10.1029/2011JD015828
Scarchilli, C., Frezzotti, M., Grigioni, P., De Silvestri, L., Agnoletto, L., and Dolci, S. (2010). Extraordinary blowing snow transport events in East Antarctica. Clim. Dyn. 34, 1195–1206. doi: 10.1007/s00382-009-0601-0
Schlosser, E. (1999). Effects of seasonal variability of accutmulation on yearly mean δ18O values in Antarctic snow. J. Glaciol. 45, 463–468. doi: 10.1017/S0022143000001325
Souverijns, N., Gossart, A., Gorodetskaya, I. V., Lhermitte, S., Mangold, A., Laffineur, Q., et al. (2018). How does the ice sheet surface mass balance relate to snowfall? Insights from a ground-based precipitation radar in East Antarctica. Cryosphere 12, 1987–2003. doi: 10.5194/tc-12-1987-2018
Souverijns, N., Gossart, A., Lhermitte, S., Gorodetskaya, I. V., Kneifel, S., Maahn, M., et al. (2017). Estimating radar reflectivity - Snowfall rate relationships and their uncertainties over Antarctica by combining disdrometer and radar observations. Atmos. Res. 196, 211–223. doi: 10.1016/j.atmosres.2017.06.001
Takahashi, S., Endoh, T., Asuma, N., and Leshida, S. (1992). Bare ice fields developed in the inland part of Antarctica. Proc. NIPR Symp. Polar Meteorol. Glaciol. 5, 128–139.
Takahashi, S., Naruse, R., Nakawo, M., and Mae, S. (1988). A bare ice field in East Queen Maud Land, Antarctica, caused by horizontal divergence of drifting snow. Ann. Glaciol. 11, 156–160. doi: 10.3189/S0260305500006479
Thiery, W., Gorodetskaya, I. V., Bintanja, R., van Lipzig, N. P. M., Van den Broeke, M. R., Reijmer, C. H., et al. (2012). Surface and snowdrift sublimation at Princess Elisabeth station, East Antarctica. Cryosphere 6, 841–857. doi: 10.5194/tc-6-841-2012
Trouvilliez, A., Naaim-Bouvet, F., Bellot, H., Genthon, C., and Gallee, H. (2015). Evaluation of the flowcapt acoustic sensor for the aeolian transport of snow. J. Atmos. Ocean. Technol. 32, 1630–1641. doi: 10.1175/JTECH-D-14-00104.1
Van den Broeke, M. R., Reijmer, C. H., Roderik, S. W., and Van de Wal, R. S. W. (2004). A study of the surface mass balance in Dronning Maud Land, Antarctica, using automatic weather stations. J. Glaciol. 50, 565–582. doi: 10.3189/172756504781829756
Van Tricht, K., Gorodetskaya, I. V., Lhermitte, S., Turner, D. D., Schween, J. H., and van Lipzig, N. P. M. (2014). An improved algorithm for polar cloud-base detection by ceilometer over the ice sheets. Atmos. Meas. Tech. 7, 1153–1167. doi: 10.5194/amt-7-1153-2014
Winker, D. M., Hunt, W. H., and McGill, M. J. (2007). Initial performance assessment of CALIOP. Geophys. Res. Lett. 34:L19803. doi: 10.1029/2007GL030135
Keywords: Antarctica, blowing snow, satellite, remote sensing, ceilometer
Citation: Gossart A, Palm SP, Souverijns N, Lenaerts JTM, Gorodetskaya IV, Lhermitte S and van Lipzig NPM (2020) Importance of Blowing Snow During Cloudy Conditions in East Antarctica: Comparison of Ground-Based and Space-Borne Retrievals Over Ice-Shelf and Mountain Regions. Front. Earth Sci. 8:240. doi: 10.3389/feart.2020.00240
Received: 13 June 2019; Accepted: 03 June 2020;
Published: 08 July 2020.
Edited by:
Michael Lehning, École Polytechnique Fédérale de Lausanne, SwitzerlandReviewed by:
Naohiko Hirasawa, National Institute of Polar Research, JapanRuzica Dadic, Victoria University of Wellington, New Zealand
Copyright © 2020 Gossart, Palm, Souverijns, Lenaerts, Gorodetskaya, Lhermitte and van Lipzig. This is an open-access article distributed under the terms of the Creative Commons Attribution License (CC BY). The use, distribution or reproduction in other forums is permitted, provided the original author(s) and the copyright owner(s) are credited and that the original publication in this journal is cited, in accordance with accepted academic practice. No use, distribution or reproduction is permitted which does not comply with these terms.
*Correspondence: Alexandra Gossart, YWxleGFuZHJhLmdvc3NhcnRAa3VsZXV2ZW4uYmU=