 Mahdi Jafari1*
 Isabelle Gouttevin2
 Margaux Couttet1Nander Wever1,3,4
 Adrien Michel1,3
 Varun Sharma1,3
 Leonard Rossmann4
 Nina Maass5
 Marcel Nicolaus6
 Michael Lehning1,3
- 1CRYOS, School of Architecture, Civil and Environmental Engineering, EPFL, Lausanne, Switzerland
- 2Univ. Grenoble Alpes, Université de Toulouse, Météo-France, CNRS, CNRM, Centre d'Etudes de la Neige, Grenoble, France
- 3WSL Institute for Snow and Avalanche Research SLF, Davos, Switzerland
- 4Department of Atmospheric and Oceanic Sciences, University of Colorado Boulder, Boulder, CO, United States
- 5Helmholtz Centre for Polar and Marine Research (AWI), Alfred Wegener Institute, Bremerhaven, Germany
- 6Center for Earth System Research and Sustainability, Institute of Oceanography, University of Hamburg, Hamburg, Germany
Water vapor transport has been highlighted as a critical process in Arctic snowpacks, shaping the snow cover structure in terms of density, thermal conductivity, and temperature profile among others. Here, we present an attempt to describe the thermally-induced vertical diffusion of water vapor in the snow cover and its effects of the snowpack structure using the SNOWPACK model. Convection, that may also constitute a significant part of vapor transport, is not addressed. Assuming saturated conditions at the upper boundary of the snowpack and as initial condition, the vapor flux between snow layers is expressed by a 1-dimensional transient diffusion equation, which is solved with a finite difference routine. The implications on the snowpack of this vertical diffusive flux, are analyzed using metrics such as the cumulative density change due to diffusive vapor transport, the degree of over- or undersaturation, the instantaneous snow density change rate, and the percentage of snow density change. We present results for four different regions sampling the space of natural snow cover variability: Alpine, Subarctic, Arctic, and Antarctic sea ice. The largest impact of diffusive water vapor transport is observed in snow on sea ice in the Weddell Sea and the shallow Arctic snowpack. The simulations show significant density reductions upon inclusion of diffusive water vapor transport: cumulative density changes from diffusive vapor transport can reach −62 and −66 kg m−3 for the bottom layer in the shallow Arctic snowpack and snow on sea ice, respectively. For comparison, in deeper snow covers, they rarely exceed −40 kg m−3. This leads to changes in density for shallow snowpacks at the soil-snow interface in the range of −5 to −21%. Mirroring the density decease at depth is a thicker deposition layer above it with increase in density around 7.5%. Similarly, for the sea ice, the density decreased at the sea ice-snow interface by −20%. We acknowledge that vapor transport by diffusion may in some snow covers—such as in thin tundra snow—be small compared to convective transport, which will have to be addressed in future work.
1. Introduction
As a crucial player in snow metamorphism, water vapor transport has been proven to be a very significant process in shaping the snowpack structure (Sturm and Benson, 1997; Pfeffer and Mrugala, 2002). It is important for issues such as snowpack stability and avalanches (Pfeffer and Mrugala, 2002; Woo, 2012) but also thermal conductivity e.g., in the context of climate studies (Slater et al., 2001; Callaghan et al., 2011).
In dry snow and particularly under strong temperature gradients, metamorphism is essentially driven by water vapor transport, whereby temperature gradients induce gradients in saturation water vapor density and pressure that result in diffusion (Sturm and Benson, 1997; Pfeffer and Mrugala, 2002). Both microscopic exchange of vapor between grains, and macroscopic vapor flux between snow layers over the entire snowpack, occur as a result of these gradients.
This process is especially active in Arctic and sub-arctic snowpacks, where shallow snow depth and strong temperature differences between soil and atmosphere lead to significant kinetic metamorphism, rapidly creating snow layers composed of depth hoar crystals, which are coarse grained, typically vertically-oriented and cup-shaped (Pinzer et al., 2012). Depth hoar has been seen to be dominant in sub-arctic snowpacks (Sturm and Benson, 1997; Taillandier et al., 2006; Derksen et al., 2009; Domine et al., 2015). Arctic, and to some extent subarctic snowpacks, are sometimes in direct contact with permafrost, which influences the vapor transport. Significant amounts of mass transferred from one layer to another, and from the soil into the basal snow layers, have been observed in these snowpacks (Trabant and Benson, 1972; Alley et al., 1990). Also, as an evidence of ice mass transfer due to water vapor flux, observations by Trabant and Benson (1972), Sturm and Benson (1997), and Domine et al. (2016) indicate a density decrease of more than 100 kg m−3 for layers close to the ground in thin snow covers. Domine et al. (2016) also report in some places about the “near-total disappearance of the basal depth hoar” due to a possible extreme impact of water vapor transport other than purely diffusive fluxes. From their measurements, Domine et al. (2016) also found that density increases in the wind slabs overlying the depth hoar, which may be attributed to upward water vapor transfer and its deposition. Sturm and Benson (1997) estimated that the magnitude of the averaged net layer-to-layer vapor flux from end-of-winter subarctic snowpacks is in the order of 10−7 kg m−2 s−1.
As it results notably in the formation of thick depth hoar layers that generally exhibit a low thermal conductivity, water vapor transport in high latitude snowpacks carries significant thermal implications: the ground thermal regime below the snow, including the permafrost thermal dynamics, is in great part governed by the thermal insulation of the snowpack (Zhang et al., 1996; Gouttevin et al., 2012, 2018), with consequences for ecology (Domine et al., 2018), geo-engineering, snow-atmosphere heat exchange (Domine et al., 2019) and global climate feedbacks (Schneider von Deimling et al., 2012). Note that the range of thermal conductivities of depth hoar snow types is still not well-known and that local values are influenced by local conditions (Calonne et al., 2014; Domine et al., 2016; Gouttevin et al., 2018).
In alpine snowpacks, temperature gradients that can result from the meteorological conditions over the course of the winter or early snowfall on unfrozen grounds are responsible for the formation of faceted snow layers of moderate cohesion. When covered by more cohesive snow types, faceted crystals form weak layers in the snowpack, which increases the avalanche risk.
For all these reasons, modeling the vapor transport within most types of snow covers, and its effects on the properties of the snow, appears to be of high importance. Some attempts to study the water vapor transport in snow columns have been done. The Snow Thermal model, SNTHERM (Jordan, 1991), includes vapor transport in snow (but not soil). In this model, saturation was assumed in snow such that the water vapor flux divergence in each layer was considered to be compensated by phase gains (deposition) and losses (sublimation) within the medium. Bartelt et al. (2004) studied the diffusive mass conservation of the water vapor with interfacial mass transfer term applying the atmospheric relative humidity as the top boundary condition. Calonne et al. (2014) applied the macroscopic equivalent model for heat conduction and vapor diffusion including the phase change source term. They concluded that for the large temperature gradient, the impact of these mass and energy source terms due to phase change cannot be neglected. Recently, Touzeau et al. (2018) have looked at vapor diffusion in polar firn and its potential influence on the isotopic composition.
Depending on the snowpack, soil, and meteorological conditions, water vapor transport may occur through both diffusion and convection (Trabant and Benson, 1972; Johnson and Bens, 1987; Alley et al., 1990; Sturm and Johnson, 1991; Domine et al., 2016, 2018). Trabant and Benson (1972) found from the measured rates of densification and density changes for snow in Fairbanks that significant convection must occur to explain differences with respect to vapor fluxes calculated from pure diffusion models. On the contrary, Akitaya (1974) found that convection did not occur in his experimental studies of depth hoar formation in Hokkaido. In the Fairbanks subarctic snowpack, Sturm and Johnson (1991) interpreted significant horizontal thermal gradients and incoherent temporal variations of horizontal temperature patterns, as a sign of convective circulation. They estimated that about half of the total heat transfer at their study site, and for the 3 years with measurements, were caused by convection. Domine et al. (2016) concluded that the near-total disappearance of basal depth hoar at Bylot Island could not be caused by just water vapor diffusion alone and also suggested convection as the possible explanation. Additionally, Domine et al. (2018) observed almost no depth hoar at Ward Hunt Island (Canadian high Arctic) in spring 2016 despite favorable thermal conditions. He proposed that high winds, which formed hard wind slabs of low permeability, prevented convection and would be a factor delaying depth hoar formation.
These seminal works suggest that both convection and diffusion have to be accounted for if a sound modeling of water vapor transport within the snowpack is to be achieved. As a first step in this process, we focus here on the modeling of water transport through diffusion only, which constitutes the lower limit for total water vapor transport. It is furthermore not possible to explicitly model convection in a one-dimensional model, so that a different, maybe stochastic approach, should be undertaken for this purpose. As will be shown, the results from the diffusion vapor model do not contradict most of the relevant observations from the field. For instance, diffusion vapor transport alone already reproduces lower densities at the base of the snowpack in some cases.
2. Methods
2.1. SNOWPACK Model
SNOWPACK is a 1D physics-based model predicting snowpack settling, layering, surface energy exchange and mass balance. It is based on a Lagrangian finite element coordinate system implementation and governed by the one-dimensional, mass, energy and momentum conservation equations taking into account phase change in the snowpack. The Lagrangian coordinate system allows the snowpack mesh to evolve over time, i.e keeping track of the layer identities when snow deposition (snowfall, wind drift) or removal (erosion, sublimation, melt) events occur. Snow is modeled as a three-component (ice, water, air) porous material for which phase changes between the components are simulated. For each layer, several core variables such as snow bulk temperature, density as well as liquid water content are calculated.
SNOWPACK requires at minimum 6 parameters: air temperature, relative humidity, wind speed, incoming shortwave radiation (or reflected shortwave radiation), incoming long wave radiation (or surface temperature). The amount of new snow added to the mesh is obtained from either measured precipitation rates or measured snow depth (from which snow precipitation rates are then derived via calculated settling rates) (Lehning et al., 1999).
Atmospheric forcing governs the development of the snow cover throughout the season, dictating mass and energy exchanges at the snow surface. As a result, it determines upper boundary conditions for e.g., temperature and relative humidity, at the top node of the snowpack using either Dirichlet or Neumann formulations. Usage of Dirichlet boundary conditions imposes measured temperatures at the snowpack surface, whereas Neumann prescribes the net snowpack surface energy flux (including long wave radiation, sensible and latent heat exchange and energy from rain) (Lehning et al., 2002a). At the snowpack-ground interface, the lower thermal boundary conditions are either set to a constant ground temperature or, if soil layers are specified, calculated from soil properties to which a constant heat flux is applied at the bottom.
Two particularly important and non-linear features of the model are thermal conductivity and creep viscosity, governing, respectively, energy transport and snow settlement. They are formulated as constitutive relations at both macroscopic and microscopic scales (Lehning et al., 2002b). To model liquid water flow through the snowpack, the model solves Richards Equation which describes liquid water movement in variably saturated porous media. This method is hence able to better reproduce the formation of capillary barriers (Richards, 1931; Wever et al., 2014, 2015). Snow microstructure plays a key role in determining the bulk characteristics in the snowpack such as temperature distribution, settling rate as well as mechanical and optical properties. Its representation in SNOWPACK model is done by determining several microscopic properties including ice grain size, shape (dendricity, sphericity), and bondings (bond radius, coordination number) (Lehning et al., 2002b).
Adding explicit vapor transport as described below changes the SNOWPACK dynamics and affects the non-linearities discussed above. For example, changes in local density will strongly impact creep viscosity and thermal conductivity. However, parameterizations for viscosity or thermal conductivity have been physically or empirically adjusted for the SNOWPACK model without explicit vapor transport. At this stage, we chose not to adjust these formulations to the changes in model behavior ensuing from the new explicit diffusive vapor transport. Indeed, as the present study will reveal, the effect of the new diffusive water vapor transport on e.g., density, is rather small for most snowpacks, so that effects of inconsistencies will be limited. Furthermore, adjusting paramaterizations requires major efforts and should be done as soon as also convective transport is implemented, which is expected to yield more substantial changes in e.g., snowpack density.
2.2. Diffusive Water Vapor Transport in Snow and Soils
2.2.1. General Equations
Layer-to-layer vapor transport is implemented by considering mass conservation of the water vapor component in the snow or soil, resulting in a transient diffusion equation written as:
In Equation (1), ρv (kg m−3) is the water vapor density, Jv (kg m−2s−1) is the diffusive water vapor flux (it is positive when is upward), θa is the air volume fraction in snow or soil, Mmm (kg m−3s−1) is the mass source (or sink) term due to deviation of vapor pressure from the saturation condition, and finally Deff,a (m2s−1) is the effective water vapor diffusivity in the air component of the snow or soil. As pointed out by Hansen and Foslien (2015), it is distinguished from the effective water vapor diffusivity in snow or soil by Dv,s = θaDeff,a.
Following Albert and McGilvary (1992), Mmm may be evaluated as:
In Equation (2), hm (m s−1) is the mass transfer coefficient, as (m−1) is the specific surface area of snow, and ρvs (kg m−3) is the saturation water vapor density at the local snow temperature. It should be noted that the heat source (or sink) term due to vapor transport, −MmmLh, is added to the heat transfer equation in SNOWPACK, with Lh (J kg−1) being the latent heat of sublimation.
Choices of formulations for the mass transfer coefficient and the effective water vapor diffusivity in snow and soil, will be detailed in the next subsections.
2.2.2. Mass Transfer Coefficient
Different formulations and quantifications for the mass transfer coefficient hm have been proposed in the literature. For spheres, hm may be evaluated as hm = ShDv,a/dp (Bird et al., 1961), using the definition of the Sherwood number, Sh, and with dp (m), the sphere diameter, and Dv,a (m2s−1), the water vapor diffusivity in air. Theory indicates that for Sh = 2, the mass transfer between sphere and fluid occurs only through diffusion in still fluids (Bird et al., 1961). Based on measurements, Thorpe and Mason (1966) proposed a formulation of Sh for an ice sphere, Shi, when the sphere is in a moving fluid:
with Re the Reynolds number of the flow based the sphere diameter and Sc is the Schmidt number. Equation (3) is a simple sum of the mass transfer contribution from the diffusive flow (the first term) and from the advective flow (the second term). For the range of particle diameters between 0.1 and 1 mm, which are reasonable for snow, both formulations yield mass transfer coefficients in the range between 0.04 to 0.4 m s−1 for the diffusion process only.
However, based on a similar formulation for the advective flow contribution, Albert and McGilvary (1992) quantified hm for the diffusion process, to values as low as 0.09 m s−1. Combining measurements of specific surface area and mass changes in an air-flow experiment, Neumann et al. (2009) inferred from Equation (2) also low values for hm, between 7.5 × 10⁻⁵ and 8 × 10⁻³ m s−1 and proposed the following formulation in which advection is also accounted for:
It should be noted that the factor 10−3 in the text of their paper is missing, however in the plots for hm vs. Re, the factor 10−3 is correctly represented.
Calonne et al. (2014) and Ebner et al. (2015), respectively, proposed and relied on another formulation for hm:
where β is the interface kinetic growth coefficient in units of s m−1. Based on experiments of sublimation and deposition on the ice structure for one case without advective flow and three cases with different possible rates of advective flows, Ebner et al. (2015) inferred β = 9.7 × 10⁹ s m−1 with an average normalized root-mean-square error less than 9.7%. This means an hm value around 8.07 × 10⁻⁵ m s−1.
As a result, there is a clear discrepancy in order of magnitude between the hm values inferred by Neumann et al. (2009) and Ebner et al. (2015) on the one hand (that lie in the range of 7.5 × 10⁻⁵ and 8 × 10⁻³ m s−1), and the theoretical original estimations from Bird et al. (1961) and Thorpe and Mason (1966) that reach values from 0.04 to 0.4 m s−1. A plausible explanation for this apparent contradiction is the fact that part of the snow grains' specific surface area may be not active for mass transfer, hence inducing much lower estimations of hm in the approaches of Neumann et al. (2009) and Ebner et al. (2015). They considered all specific surface area is active for mass transport which may not be the case (Kunii and Levenspiel, 1991). This is analogous to Crowe (2005) who explained that for a bed of small particles with low Re (low velocities), due to very large specific surface area, the gas phase gets saturated already before penetrating further into the bed of particles.
We made use of both theoretical mass transfer coefficient hm,t based on Shi = 2.0, and experimental or numerical estimations of hm, hm,e, by Ebner et al. (2015), to infer the actually active specific surface area, as,a, to be used in Equation (2) instead of as :
Equation (2) now has the form:
2.2.3. Specific Surface Area in Snow and Soils
The specific surface area of a dry snow layer (or in general a porous material layer), as, is defined as the total surface area of the snow—pore interface per volume of snow layer. Assuming the dry snow layer is composed of the spherical grains with average diameter of dp (m), the specific surface area is evaluated as:
For wet snow, we use the approximation applied by Gallet et al. (2014), that wet snow consists of ice cores with radius ri covered by a water film with outer radius of rw such that the ice core is not in contact with air. Similarly, for a frozen soil layer which may have some liquid water, the soil grain with radius rs is assumed to be covered first by an ice shell with the outer radius of ri and then covered by a water film with the outer radius of rw if liquid water is present. Hence, the diameter used in Equation (8) should be updated as the diameter of the last shell which can be: (1) water for wet snow, (2) either water for the wet-frozen soil or the ice for the completely-frozen soil. According to the Appendix of Gallet et al. (2014), the diameter of the last shell may be evaluated as:
It should be noted that for dry and wet snow, the radius of the ice core, ri, is selected as the optical grain size (Calonne et al., 2012). Obviously, in case there is just a dry soil layer, the mass source (or sink) term in Equation (1a), Mmm, will be set to zero.
2.2.4. Effective Water Vapor Diffusivity in Snow and Soils
The measured and calculated values of Dv,s, show an enhancement compared to the water vapor diffusion coefficient in air (Dv,a) (Yosida et al., 1955; Sommerfeld et al., 1987; Colbeck, 1993; Sokratov and Maeno, 2000). Yosida et al. (1955) have justified this enhancement by “hand-to-hand” way of water vapor transport which reduces the actual transport distance. Using a finite element model based on real snow microstructure, Pinzer et al. (2012) and Calonne et al. (2014) both calculated the effective water vapor diffusivity in snow in different ways. Based on results of Pinzer et al. (2012), an enhancement for the water vapor diffusivity in snow, compared to that in air, has been observed, ranging between 1.05 and 1.13. Results of Calonne et al. (2014) show a linear reduction of Dv,s/Dv,a when the snow density increases to higher values. Hansen and Foslien (2015) extended an analytical model developed by Foslien (1994) for the effective water vapor diffusivity in snow, based on two possible snow microstructures: (1) “pore microstructure” in which the heat is transferred in parallel through the air and ice phases, (2) “layered microstructure” in which the heat is transferred in series through the air and ice layers. Hansen and Foslien (2015) justified in detail how they combined heat fluxes resulting from these two microstructures to derive the following parametrization for effective water vapor diffusivity in snow:
In Equation (10), ki and ka (W m−1K−1), are the thermal conductivities for the air and ice component of the snow, respectively, and θi is the volume fraction of the ice component in snow. Even though this model assumes homogeneous snow, we believe this model predicts Dv,s with reliable accuracy because (1) it provides self-consistent values for Dv,s for the limiting cases of ice and air, (2) the calculated values are in a very good agreement with values calculated by numerical finite element results on microscale by Christon et al. (1994) and Pinzer et al. (2012), (3) it has no empirical coefficients, as developed based on heat and mass conservation using simple assumptions on snow microstructures, (4) in this model, the density contribution is included explicitly through volume fractions of air and ice and temperature effects are considered implicitly by thermal conductivity for ice and air. With this formulation, for snow with different values of θa e.g., 0.2, 0.3, and 0.5, the effective water vapor diffusivity in snow are estimated as Dv,s = 1.16Dv,air, 1.21Dv,air, and 1.25Dv,air, respectively.
To estimate the effective water vapor diffusivity in the soil, we rely on a simple parameterization and standard parameters. We a posteriori justify this simplified description as a brief sensitivity study of our results show that soil parameters have a negligible influence (discussed in section 3.6). Through the soil, the effective water vapor diffusivity is defined as Dv,soil = θa τ Dv,air, in which Deff,a = τDv,air is the effective water vapor diffusivity in the air component of the soil, θa is the air volume fraction, τ is the tortuosity factor defined by Millington and Quirk (1961) as , θs is the soil volume fraction, and m2 s−1 is the vapor diffusivity in air. We hence get the effective water vapor diffusivity in the soil as:
Similar to the effective diffusivity estimates made earlier for snow, we can use Equation (11) to assess the effective diffusivity for soils, given our soil setup with θs = 0.625 (see section 2.4): Maximum water vapor diffusivity in soils is reached for maximum air content (e.g., completely dry soils), yielding Dv,soil,max = 0.27Dv,air. Minimum water vapor diffusivity in soil is reached in completely saturated soils and tends to zero. Based on the initial soil volumetric content, these estimates show that vapor diffusivity in snow is at least three orders of magnitude larger than in the soil.
2.2.5. Discretization
Applying a combination of the forward and backward Euler methods in time (n is the time index) and the central difference scheme in space for an internal node (i is space index) excluding the boundary nodes, the discretized form of Equation (1a) has the form:
In Equation (12), Δt is the simulation time step, dzd = zi − zi−1, and dzu = zi+1 − zi. Here, choosing f = 1, a fully implicit discretization is selected while f = 0.5 refers to the Crank-Nicolson scheme. Even though the Crank-Nicolson scheme is unconditionally stable as the fully implicit scheme, it suffers from numerical oscillations so that the simulation time step should be limited similar to the criterion applied for the stability of an explicit scheme as vdΔt/Δz < 1 (Courant et al., 1928) (with vD = Jv/ρvs the diffusive water vapor velocity). The system of equations described by Equation (12) forms a tridiagonal sparse matrix for which the sparse solvers from the Eigen C++ library are used (Guennebaud and Jacob, 2010). For the upper boundary condition the saturation water vapor density at the snow surface temperature is used, and zero vapor flux is used for the bottom node of the soil as lower boundary condition. For the new snow layers added to snowpack due to snowfall, the water vapor density is initialized as saturation density based on the new snow temperature.
2.2.6. Diagnostic Variable: The Cumulative Snow Density Change Due to Diffusive Vapor Transport
To quantify the effects that water vapor transport has on the snow layer, the cumulative snow density change due to vapor transport, Δρcum, is introduced in Equation (13). This is the summation of snow density change due to the sublimation and deposition of water vapor for each element over all time steps. This is an interesting diagnostic variable since density changes due to vapor transport will tend to be masked by the highly non-linear snow settling.
2.3. Study Sites
The Arctic site is situated at Samoylov Island, Russia. This study site is located in a zone of continuous permafrost featuring polygonal tundra landscape in the delta of the Lena river, Siberia (Boike et al., 2013, 2018). Our simulation for the winter season 2010–2011 analyzed in section 3.2 characterizes a polygon center as described in Gouttevin et al. (2018), forcing data are derived from observations (for snow depth) and reanalysis data for the other atmospheric variables. It should be noted that the simulation for the winter season of 2012–2013 is used for comparison with measured density profile at Samoylov described in section 3.7.
The Subarctic site is situated in Sodankylä, Finland in a small clearing in pine plantation with sandy loam soil. The site has been one of the reference sites for snow studies in the past (Essery et al., 2016), whereby forcing data are derived from local meteorological measurements (incoming solar and longwave radiation, snowfall and rainfall rates, air temperature, humidity, wind speed, and atmospheric pressure). Winter season of 2007–2008 is analyzed in this study. Simulated snow density profiles are compared with observation at Sodankylä for four winter seasons, 2009–2013, in section 3.7.
The Alpine site, called Weissfluhjoch is located at an altitude of 2,540 m in the Swiss Alps (Davos, Switzerland). It has been operated by the WSL Institute for Snow and Avalanche research (SLF) since 1936. The long time operation of the site results in a large amount of reliable data. Meteorological parameters are automatically measured [(Enescu et al., 2018) under doi: 10.16904/1] and forcing data were derived for them for the winter season 2001–2002 simulated in the present paper.
The SNOWPACK sea ice version introduced by Wever et al. (2020) has been tested for a point in the Weddell Sea with latitude −69.4672°and longitude −42.3728°. This point represents the starting location of Snow Buoy 2016S31, for which we here simulate the snowpack evolution from 16th January 2016 until 25th January 2017. Forcing data are taken from the ERA5 reanalysis except for snow depth which was observed at the buoy. The trajectory of Snow Buoy 2016S31 from 16th January 2016 until 25th January 2017 is presented at www.meereisportal.de (Nicolaus and Schwegmann, 2017).
2.4. Model Configurations at Sites
All the simulations performed here rely on the same setup for the SNOWPACK model. The only exception is the high-Arctic Samoylov simulation, where additional options were used, namely the adaptations of the SNOWPACK model developed by Gouttevin et al. (2018). These include a mechanically reduced compaction and an enhanced grain growth in basal snow layers, as well as enhanced wind densification close to the surface. They were shown by Gouttevin et al. (2018) to provide better agreement with e.g., density measurements at Samoylov.
To solve the diffusive vapor transport equation discretized in Equation (12), the fully implicit scheme with a time step of 1 min is used, while the main simulation time step of SNOWPACK is 15 min. Note that the layer resolution of the simulations was increased from 2 to 0.1 cm for the thin Arctic snow cover. A general sensitivity analysis was conducted and it was found that a finer layer resolution did not qualitatively change the results. A small effect of stronger density decrease very close to the surface was observed for higher resolutions (not shown). This, however, is anyway artificial as the true snow surface is rough and we therefore assume that the layer resolution of the order of cm is adequate in general.
For all snow covers over land, a soil column 3 m deep with the soil volume fraction of 0.625, the air volume fraction of 0.125, and water volume fraction of 0.25 has been considered except for the layers with sub-zero temperatures. For these layers, the water content was added to the ice content. Sensitivity tests regarding this configuration have been performed at Samoylov and are reported in the section 3. For the heat transfer equation, the Neumann boundary condition was used at the top surface of snowpack and a constant heat flux of 0.06 Wm−2 is applied at the bottom of soil layer.
For the sea ice site, initial snow conditions are derived from observations and assumptions in terms of brine salinity, temperature, and pore space as described in Wever et al. (2020): at the beginning of the simulation in January 2016, 2 cm of snow lies above 274 cm of sea-ice. The boundary conditions applied by Wever et al. (2020) are also used.
3. Results and Discussion
In this section, we first present some general features of the new model for diffusive water vapor transport. Then, we analyse the effects of diffusive water vapor transport in four diverse snow covers, ranging from polar to Alpine conditions. These effects are primarily investigated on the density profiles, via the cumulative snow density change due to vapor transport. The largest effects are obtained for the snowpack on sea ice in the Weddell sea, and for the most shallow snowpack at Samoylov.
3.1. General Model Behavior
First, our simulations reveal that the temporal term in Equation (1a), ∂ρv/∂t, is very small compared to the other terms: Its magnitude rarely exceeds 5 × 10⁻⁸ kg m−3 s−1 while the diffusion and source/sink terms reach values of 2 × 10⁻⁵ kg m−3 s−1 at Samoylov for instance. This means that (i) departure from saturated conditions within the snowpack is always rather small when compared to the changes in water vapor content implied by inter-layer vapor fluxes, and (ii) that the source/sink term efficiently compensates for these inter-layer vapor fluxes. In other words, the sink/source term is generally not a limiting term for Equation (1a).
As a next observation, the degree of over- or undersaturation, σ = (ρv − ρv,s)/ρv, is very much related to the divergence of the vapor flux. It also drives snow density changes as an important player in sublimation/deposition processes (Equation 2). The degree of oversaturation is in general small over the whole depth of the snowpack (e.g., below 2%), except for situations with liquid water as discussed below.
3.2. Arctic Snowpack—Samoylov Island
Over the 2010–2011 season investigated at Samoylov, the snowpack gradually developed from early October on, to reach an height of about 30 cm at maximum accumulation mid-April. The February and March snowpack only reached 20 cm. The snowpack melt started on April 20, with positive air temperature for a few days, then paused for about 15 days. There were renewed positive temperatures around May 5, and the final meltout phase started on May 15, steadily up to snow disappearance by the end of the month. Samoylov is characterized by very low temperatures and high wind speeds : over the 2010–2011 snow season, air temperatures were negative from October 4 to late April; they were very rarely above −20°C from late November to early April, with minimum values around −37°C reached late February and early April. Mean wind speed from October to late April was 4.6 m s−1 with frequent winds above 10 m s−1. Temperature gradients within the snowpack are strong and negative from October to end of February, as a result of shallow snow and extremely cold, arctic weather conditions, and polar night (Figure 1A, to be compared to e.g., alpine conditions, Figure 7A). These gradients result in a general upward flux of water vapor (Figure 1B). After this period, temperature gradients at time reverse, leading also to downward vapor fluxes.
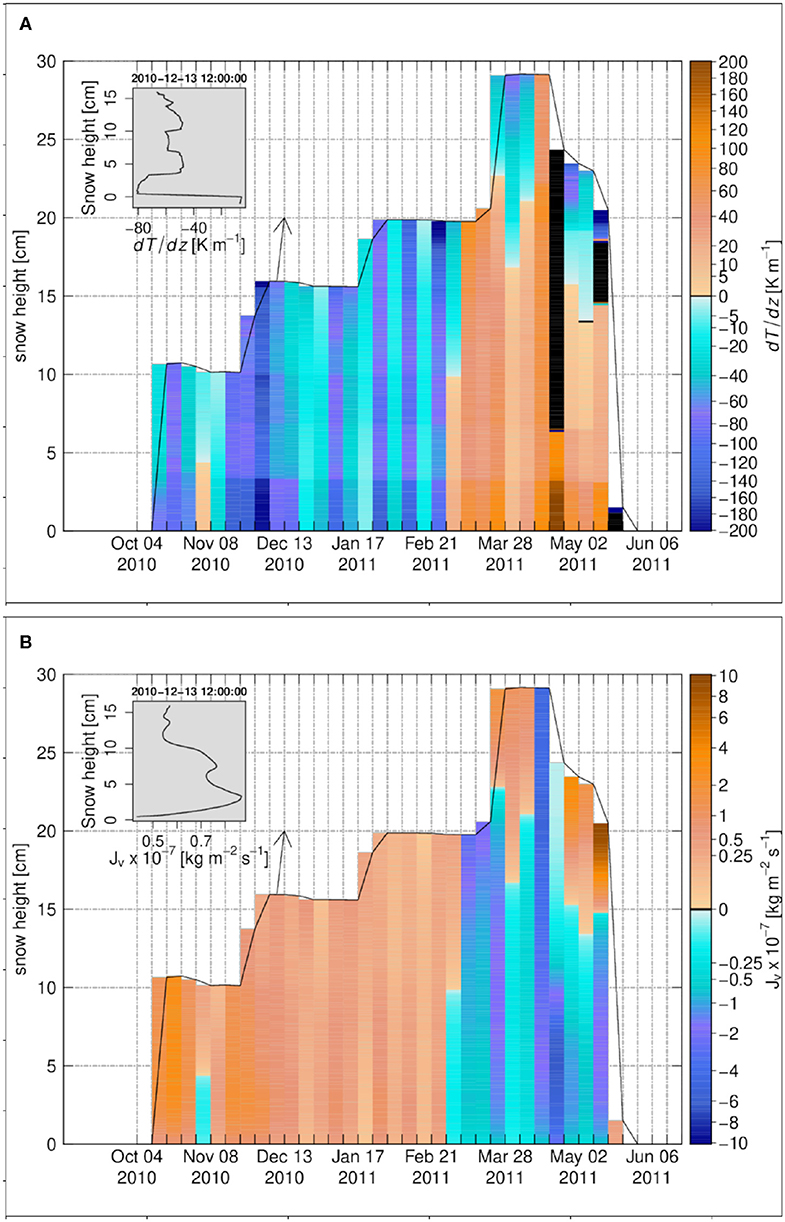
Figure 1. The weekly time series for Samoylov 2010–2011, (A) the temperature gradient, (B) the diffusive water vapor flux. The insets in (A,B) show the vertical profiles on 13 December 2010 12:00:00. Black color refers to zero values.
During the first part of the winter, the temperature gradients within snow and soil are strongest just above the soil, at the soil-snow interface: this may be due to the specific conditions at Samoylov, where snow and sedges are intertwined within the lowest centimeters of the snowpack, which leads to reduced density and hence thermal conductivity there, enhancing temperature gradients. As a result of these strong temperature gradients, vapor fluxes are considerable in these basal snow layers (e.g., Figure 1B).
Figure 2A also shows considerable undersaturation in the basal snow layers in the first part of the winter: this is an exception to the general model behavior described above. We explain this by two processes: first, there is a sharp change of temperature gradient at the soil-snow interface, with the temperature gradient at the snow-side of the interface being larger around one order of magnitude than that at the soil-side. The gradient for the degree of undersaturation is dependent on the temperature gradient and can be given as:
This means that the gradient of the saturation water vapor density, dρv,s/dz = dρv,s/dT × dT/dz (here, dρv,s/dT is always positive and decreases with temperature), changes one order of magnitude at the snow-soil interface, and can induce a significant change of dσ/dz for the first element above the soil-snow interface. Second, the very low diffusivity of water vapor in the soil layers limits the contribution of the soil to reduce the water vapor undersaturation in the basal snow layers (cf. section 2.2.4), and is a further explanation for undersaturation in these layers. Above the basal snow layers, e.g., above 3–4 cm height within the snowpack, the temperature gradients start to decrease and so does the magnitude of the water vapor diffusive flux, resulting in local flux convergence. Slight oversaturation occurs there, fostering moderate deposition (Figure 2). Similarly, a second sublimation layer occurs in the Samoylov snowpack around 7 cm height, concomitant to an increase in magnitude of temperature gradient there (Figure 1A, inset). Until the top of the snowpack, the alternance of deposition and sublimation layers can be traced down to convergence or divergence of temperature gradients, as over and undersaturations remain very low.
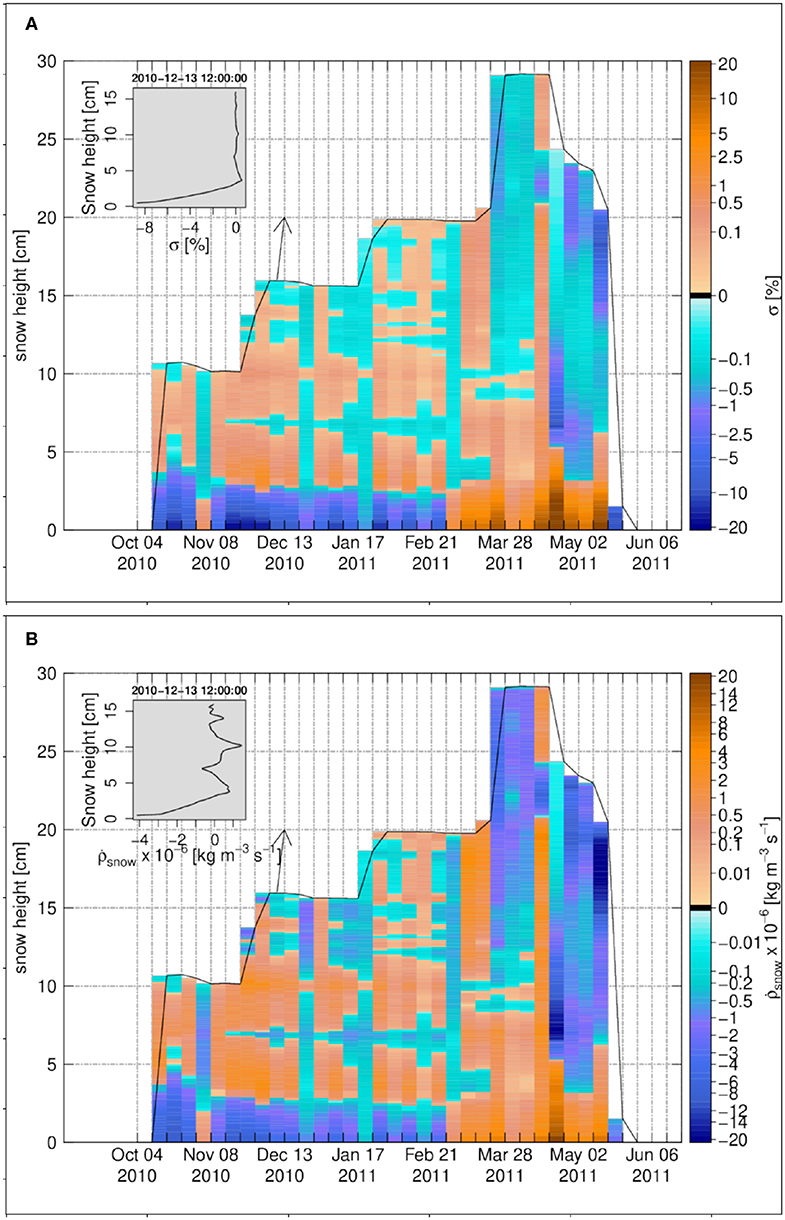
Figure 2. The weekly time series for Samoylov 2010–2011, (A) the degree of undersaturation, (B) the snow density change rate due to water vapor transport. The insets in (A,B) show the vertical profiles on 13 December 2010 12:00:00.
In the second part of the winter, e.g., from early March on, temperature and vapor fluxes mainly reverse as described earlier, with exception of cold spells that can affect the thermal structure of the upper snowpack (like in late March-early April, Figure 1A). Vapor fluxes in the lower half of the snowpack are mainly downward, and contrary to the first part of the winter, oversaturation and deposition occur in the basal layers of the snowpack: this is to be traced down to the same phenomena than during the first part of the winter, i.e., the much lower effective diffusivity of water vapor within the soil when compared to within the snow, that leads to oversaturation and deposition in the basal snow layers as vapor cannot be efficiently routed downward in the soil.
The cumulative density change profile introduced in Equation (13) is shown in Figure 3A. It is important to emphasize that the cumulative density change is basically the vapor flux divergence summed up for the individual layers over their full lifetime, showing the history of the snow density change over the winter season. This is different from an actual density difference between simulations with and without vapor transport, which will be discussed afterwards. Results at Samoylov show a considerable sublimation layer attached to the ground, with largest negative cumulative density changes around −62 kg m−3. Since settling counteracts the decrease in density in a non-linear way, (Lehning et al., 2002b), SNOWPACK actually predicts a much smaller density difference. Above this layer, and according to the alternation of sublimation and deposition layers described above, there is a substantial deposition layer with maximum positive changes around 18 kg m−3. We also note that the reversal of fluxes from March on, which is especially marked for the lower half of the snowpack, does not really change the characteristics of these sublimation and deposition layers, probably due to lower duration and magnitude of the involved fluxes.
Figure 3. The weekly time series for Samoylov 2010–2011, (A) the cumulative density change, (B) the snow density difference in percentage between the case of vapor transport and the case without vapor transport. The insets in (A,B) show the vertical profiles on 21 March 2010 12:00:00. Black color refers to zero values.
To show how much the density has changed in the case of vapor transport, the snow density difference in percentage as, (ρvapor − ρno vapor)/ρno vapor, is calculated. The snow density difference is shown in Figure 3B. At the snowpack base (soil-snow interface), the density difference is negative and its magnitude starts to increase over the winter season till it reaches around −21%. Above this layer, the density difference is positive and it increases over the winter season to reach a value around 7.5%.
The diffusive latent heat flux at the snow surface may be calculated as ql,D = Jv,top × Lh, and be compared to the turbulent latent heat flux between atmosphere and the snow surface, ql. Here, Jv,top is the diffusive water vapor flux at the snow surface and ql is due to turbulent mixing over the snow surface and is calculated in SNOWPACK based on wind speed, relative humidity and temperature in atmosphere. Larger fluxes are observed in autumn and spring and in particular during melt. Corresponding to the dynamics of the surface temperature gradient, there are mostly upward fluxes (here negative values). The averaged ratio of |ql,D/ql| is 1.4%.
3.3. Subarctic Snowpack–Sodankylä
Over the 2007–2008 snow season investigated at Sodankylä, the snowpack developed to a height of about 68 cm at peak accumulation. Two significant melt events from early December and early January, resulted in a quite thick melt-freeze crust in the lowest 15 cm of the snowpack that persisted until the melt season in the SNOWPACK simulations. Over most of the accumulation season the temperature gradient within the snowpack is negative but shows lower magnitude than at Samoylov (Figure 4A). Especially, the temperature gradient has low magnitude in the basal snow layers (from 0 to −25 K m−1) while it increases toward the upper layers to reach values up to −110 K m−1 below the surface. This structure results from the modeled stratigraphy described above, where dense, conductive layers dominate the lowermost snowpack, while more recent and facetted snow crystals occupy the upper part with lower thermal conductivity. Contrary to Samoylov, there is no big change in temperature-gradient at the soil-snow interface at Sodankylä.
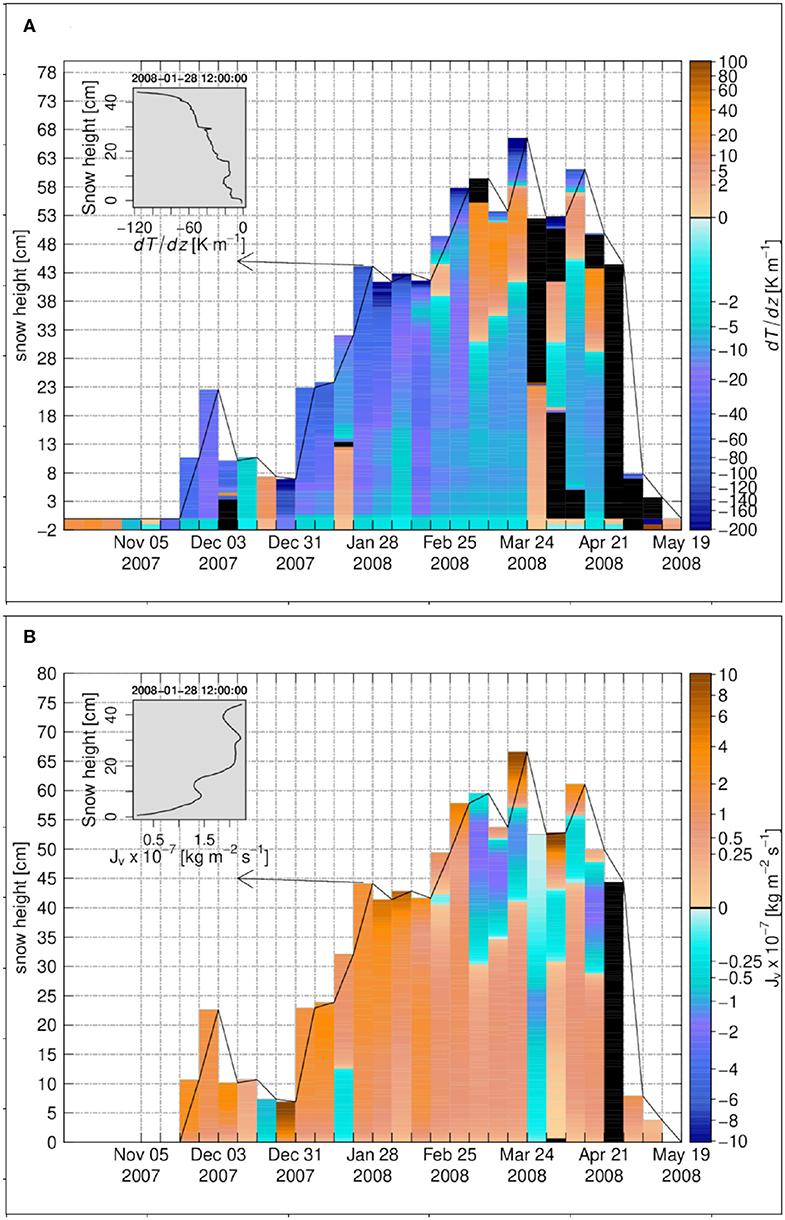
Figure 4. The weekly time series for Sodankylä 2007–2008, (A) the temperature gradient, (B) the diffusive water vapor flux. The insets in (A,B) show the vertical profiles on 28 January 2008 12:00:00. Black color refers to zero values.
Accordingly, the vapor flux is also quite small at the soil-snow interface and in the lower part of the snowpack (Figure 4B). Also, the generally smoother variations of the temperature gradient leads to less flux divergence and convergence (Figures 5A,B). Hence in general, the degree of over- or undersaturation is small at Sodankylä compared to Samoylov, with values around −2% except for some events at the beginning of the winter season (Figure 5A). Sublimation and deposition layers exhibit cumulative snow density changes of lower magnitude than at Samoylov: Most cumulative density changes are below 5 kg m−3. Only at the bottom of snowpack, sublimation layers reach cumulative density changes between −15 and −40 kg m−3 toward the end of the winter (Figure 6A). Within the snow, SNOWPACK simulates only two main deposition layers at Sodankylä, with maximum positive changes around 1.3 kg m−3, hence much smaller absolute changes than the negative ones and also smaller positive mass changes than simulated at Samoylov.
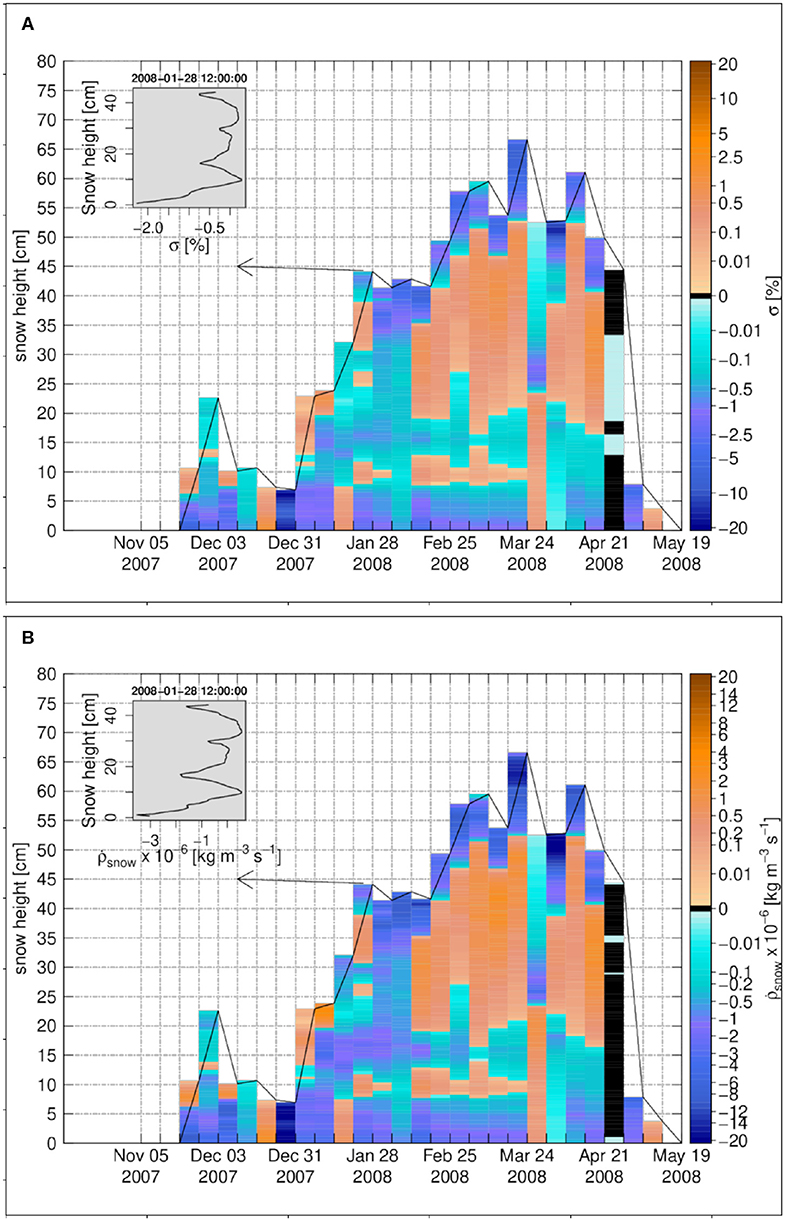
Figure 5. The weekly time series for Sodankylä 2007–2008, (A) the degree of undersaturation, (B) the snow density change rate due to water vapor transport. The insets in (A,B) show the vertical profiles on 28 January 2008 12:00:00. Black color refers to zero values.
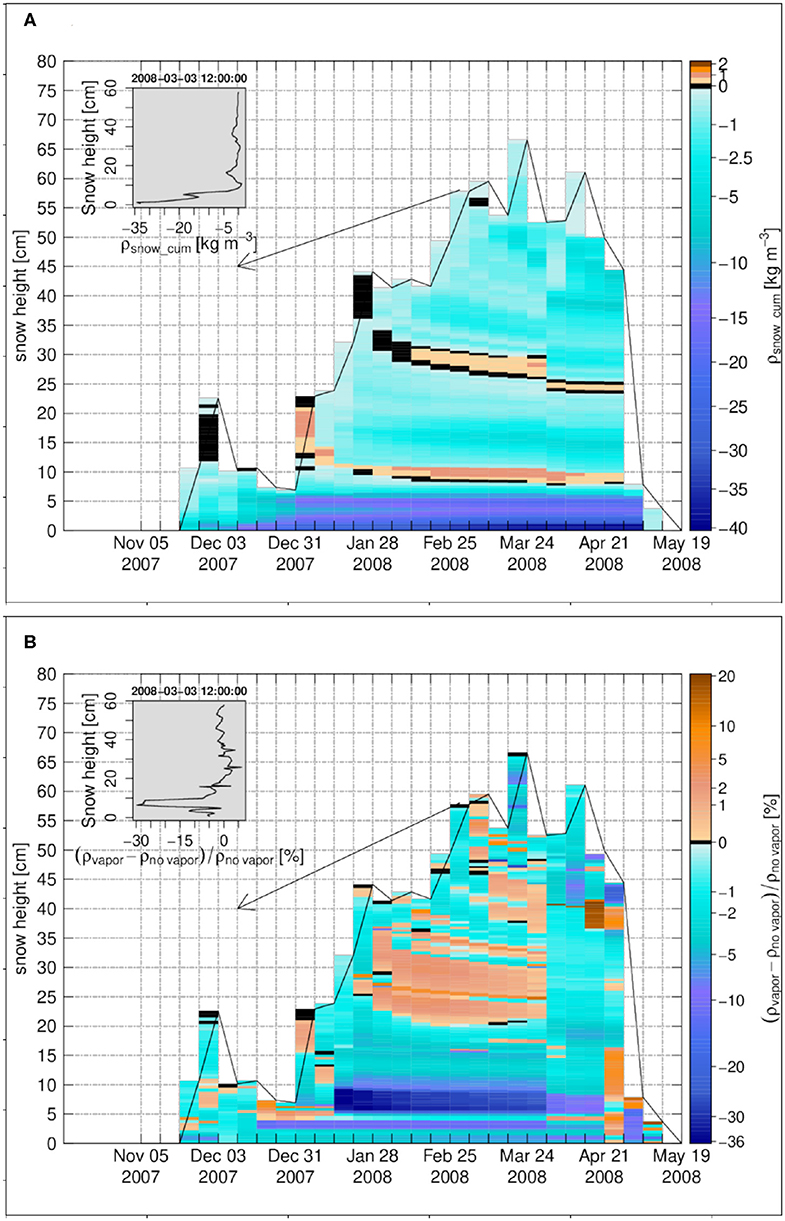
Figure 6. The weekly time series for Sodankylä 2007–2008, (A) the cumulative density change, (B) the snow density difference in percentage between the case of vapor transport and the case without vapor transport. The insets in (A,B) show the vertical profiles on 3 March 2008 12:00:00. Black color refers to zero values.
In the top layers of the snowpack however, the magnitude of the water vapor flux, its vertical change (flux divergence), and the degree of undersaturation, can reach large values, comparable or larger than at Samoylov (Figure 1B). Toward the snowpack top at Sodankylä, the temperature gradient decreases at times very fast and reaches very low values similar to minimal values occurring at Samoylov and the higher temperatures at Sodankylä lead to higher diffusive fluxes.
The snow density difference between a simulation with and a simulation without diffusive vapor transport is shown in Figure 6B. Some layers in the central, upper and basal parts of Sodankylä snowpack exhibit a larger density (by a few percent) in the case of vapor transport, sometimes for layers that did not show a positive cumulative density change due to vapor transport (Figure 6A). Actually, local sublimation and changes in density lead to complex feed-back effects affecting the final density of the snowpack. Lower density induced by sublimation does, for example, decrease the thermal conductivity, which may lead to higher temperatures and decreased viscosity, enhancing snowpack compaction. Viscosity is also directly sensitive to ice content. The melt-refreeze processes that occur at Sodankylä early in the winter season may also be affected by differences in snow density due to sublimation/deposition. This is especially visible for the layer between 5 and 10 cm, influenced by a melt-refreeze event in early January. In this layer, water vapor transport leads to a change in density of around −20 to −30%. In the end, not only the vapor transport changes the snow density by direct deposition and sublimation processes but it also leads to side effects on the temperature profile, snow viscosity (compaction rate), percolation, and the rate of melt-refreezing in a highly non-linear way, which may change the final density more significantly than just by direct deposition and sublimation.
The ratio of the diffusive latent heat flux at the snow surface to the turbulent latent heat flux between atmosphere and the snow surface, |ql,D/ql|, is calculated over the winter season for Sodankylä as 4% which is more significant than at Samoylov. As explained above, this is because the diffusive vapor flux of top layers for Sodankylä is larger than at Samoylov.
3.4. Alpine Snowpack–Weissfluhjoch
The seasonal snowpack at Weissfluhjoch builds up to a height of 2 m reached in mid March, when it features a typical multi-layered structure of alpine, high altitude snowpack as shown in Figure S23 of Wever et al. (2015): the lower half features mainly an alternation of shallow depth hoar layers, and wider layers of faceted crystals with rounded grains still present. A small melt-freeze crust persists at about 50 cm height, from an early-winter melt event. In the upper half, layers of rounded grains are more present, intertwined with some very thin melt-freeze crusts from late February. More recent snow types can be found at the snowpack's top until early April.
The temperature gradient at Weissfluhjoch is shown in Figure 7A. For most of the snowpack with exception of the uppermost layers, it takes moderate, negative values rarely reaching below −40 K m−1. This gradient is considerably smaller than at Sodankylä and Samoylov, as the snow height for Weissfluhjoch is much higher and winter air temperature are also less extreme. The temperature gradient is larger at the beginning of the winter season, which corresponds to the coldest air temperatures at Weissfluhjoch for this snow-season. At this time the gradient is also stronger in the upper half of the snowpack, where more recent snow of low thermal conductivity dominates. The temperature gradient then decreases gradually in magnitude over the winter season to reach a value around zero in the melting period. However, for top layers, its sign changes frequently based on the diurnal variations of the air and snow temperatures.
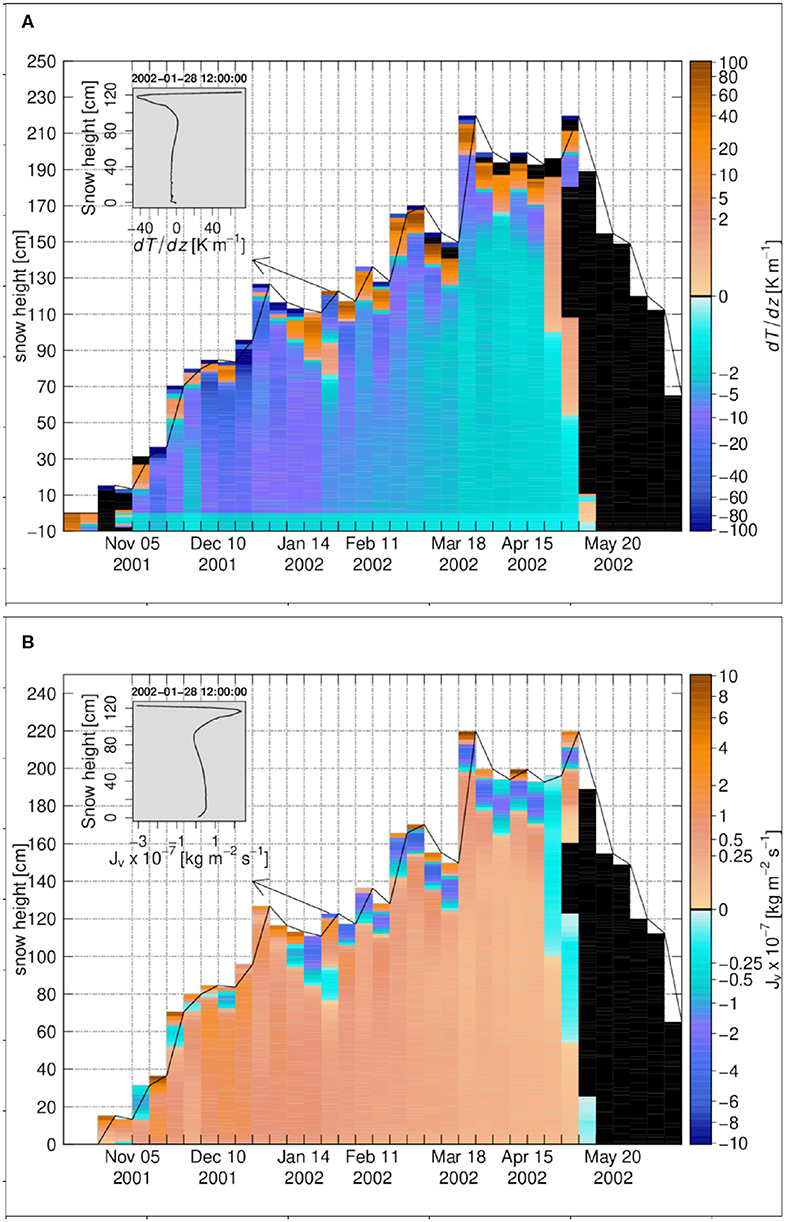
Figure 7. The weekly time series for Weissfluhjoch 2001–2002, (A) the temperature gradient, (B) the diffusive water vapor flux. The insets in (A,B) show the vertical profiles on 28 January 2002 12:00:00. Black color refers to zero values.
Figure 7B shows the weekly time series of the water vapor flux. It follows perfectly the pattern of the temperature gradient in terms of magnitude and direction. As a matter of fact, the degree of undersaturation is very small at Weissfluhjoch (Figure 8A): usually smaller than 0.1% except for a thin layer at the snowpack base and few elements on top, which are affected by the strong, cyclic temperature gradients mentioned above. As a result of lower temperature gradients than at Samoylov or Sodankylä (except close to the snow surface), the magnitude of the upward water vapor flux at Weissfluhjoch is also much lower, reaching only values comparable to Arctic or subarctic snowpacks in early winter when air temperature is the coldest, occasionally as low as −20°C. Later in the winter, between January and March, the upward vapor flux is much lower. This can be attributed both to milder air temperatures around −5°C for this period, and to the daily cycles of surface temperature under the Alpine climate which frequently changes the sign of the temperature gradient near the surface.
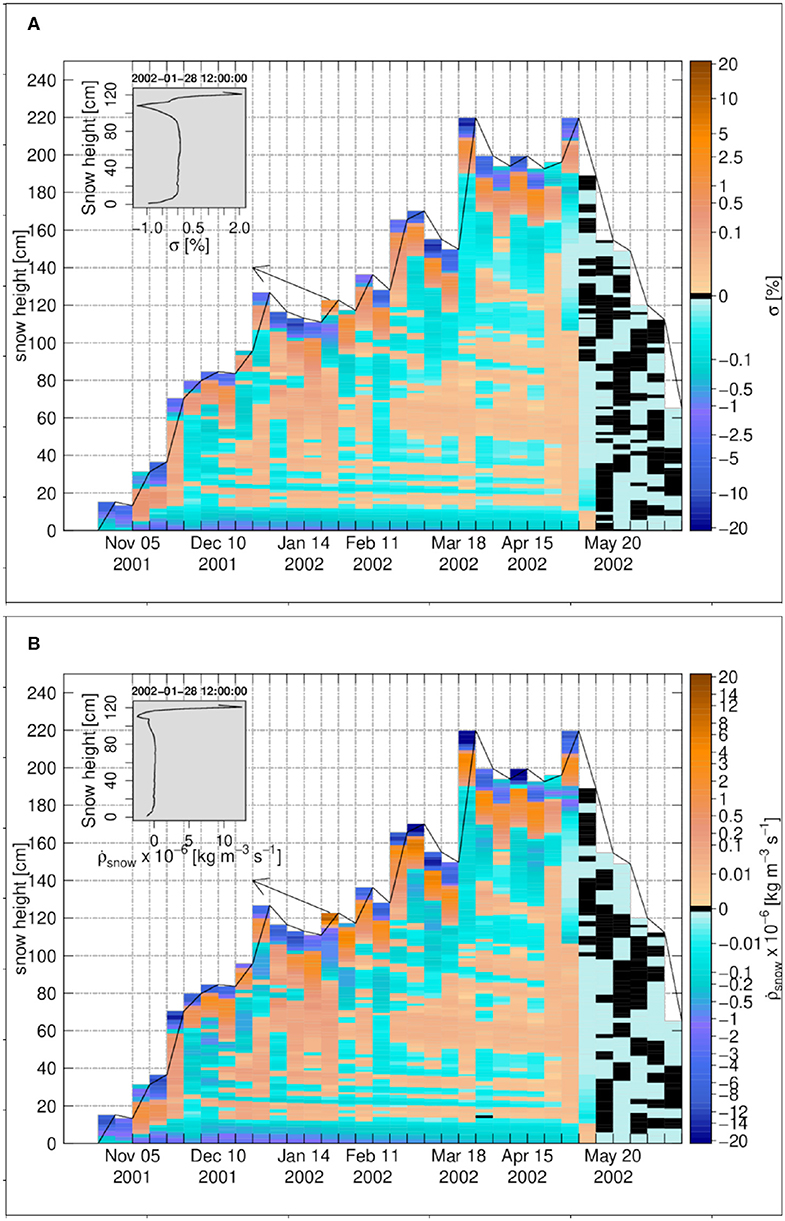
Figure 8. The weekly time series for Weissfluhjoch 2001–2002, (A) the degree of undersaturation, (B) the snow density change rate due to water vapor transport. The insets in (A,B) show the vertical profiles on 28 January 2002 12:00:00. Black color refers to zero values.
The snow density change rate, shown in Figure 8B, has the same behavior as the degree of undersaturation (Figure 8A). A small sublimation layer forms at the snowpack base, and so do a few deposition or sublimation layers close to the snowpack top, which exhibit quite significant density changes rates as a result of abrupt changes or inversions of the temperature gradients there. For the snowpack core, there are many small and less significant deposition or sublimation layers due to small changes in magnitude of the water vapor flux.
The cumulative density change for Weissfluhjoch is shown in Figure 9A. Most density changes (positive and negative) are small and below 2.5 kg m−3. For the snowpack base (soil-snow interface), the cumulative density change has a value around −5 to −26 kg m−3, resulting from sustained temperature gradients there at the interface of a more isothermal soil of lower diffusivity. In the upper layers, density decrease can be stronger in the melting period amounting to 5 to 10 kg m−3.
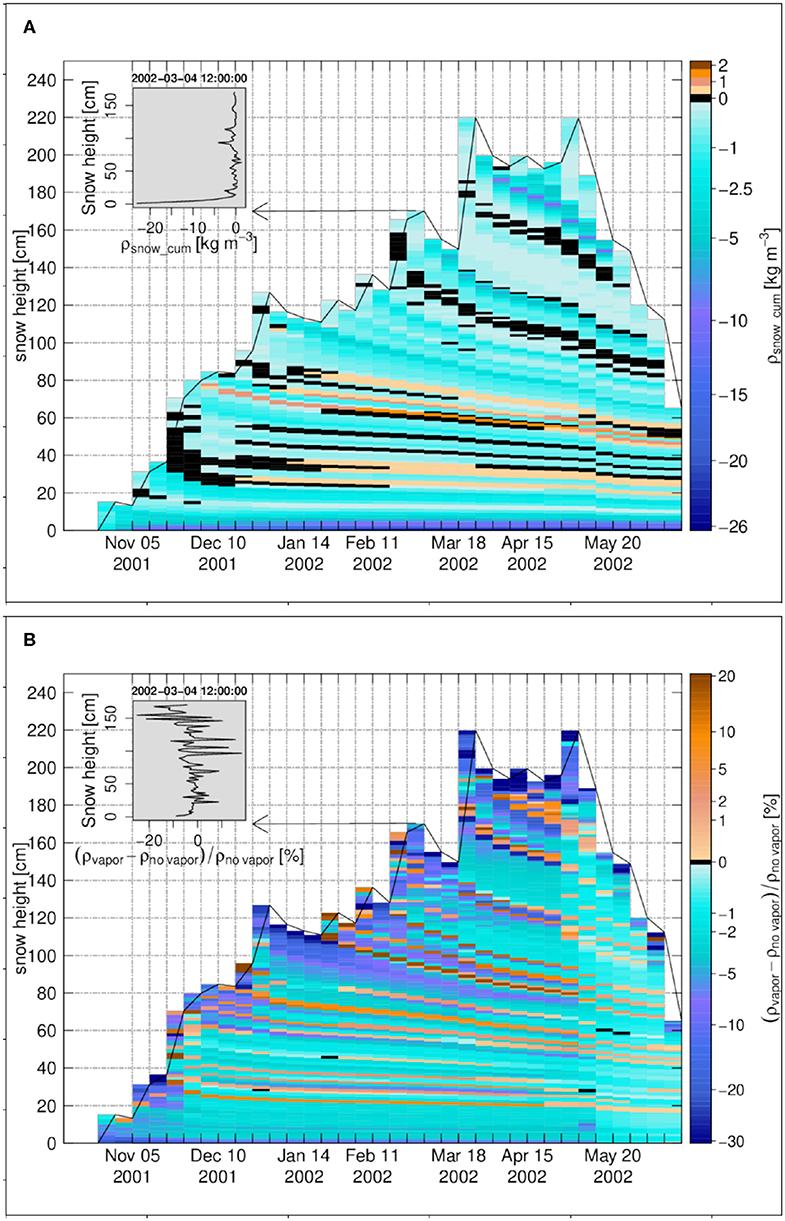
Figure 9. The weekly time series for Weissfluhjoch 2001–2002, (A) the cumulative density change, (B) the snow density difference in percentage between the case of vapor transport and the case without vapor transport. The insets in (A,B) show the vertical profiles on 4 March 2002 12:00:00. Black color refers to zero values.
The density change in percentage for Weissfluhjoch 2001 in Figure 9B confirms the dominance of density reduction, even though of low magnitude. For a few centimeters above the snowpack base (soil-snow interface), the density is decreased around 10%.
For Weissfluhjoch, the averaged ratio of the diffusive to the turbulent heat flux over the winter season, |ql,D/ql|, is 8.4% indicating that for the mass and energy balance of the snow surface, the diffusive latent heat flux is not negligible and should be considered.
3.5. Sea Ice–Snow Buoy 2016S31 (Buoy S31)
Vapor transport in sea ice is expected to be important as (often) very low surface temperatures during the polar night generate large temperature gradients through the snow-ice pack, given that the liquid water at the at the ice base remains always close to −1.8°C. Density profiles that may be affected are crucial to understand specific sea-ice processes related to brine dynamics and salinity transport. It is therefore interesting to analyze the effect of macroscopic vapor transport for the density profiles of snow on sea ice.
The snowpack over sea ice at Buoy S31 is here followed over one full year, from January to January. The coldest part of the year occurs between March and September; air temperatures are steadily below −20°C from April to early July. From January to July, precipitation are also very low, resulting in a shallow snowpack (approx. 20 cm in July): very strong temperature gradients develop during this period (Figure 10A), resulting in significant upward vapor fluxes (Figure 10B) and temperature-gradient metamorphism. As a result, during this period, the snowpack features mostly depth-hoar overlain by faceted crystals in the SNOWPACK simulations (Figure 11 of Wever et al., 2020). From August to early October, more precipitation occurs and the snowpack reaches 60 cm while air temperatures get milder, around −5°C on average. The temperature gradients within the snowpack reduce with respect to the previous period, being generally lower than 40 K m−1 in magnitude (Figure 10A) and so does the upward vapor flux (Figure 10B). As presented in Figure 11 of Wever et al. (2020), the snowpack further builds up, with new layers rapidly transforming into faceted crystals or toward October, rounded grains. Sustained melt occurs from November until mid or late January.
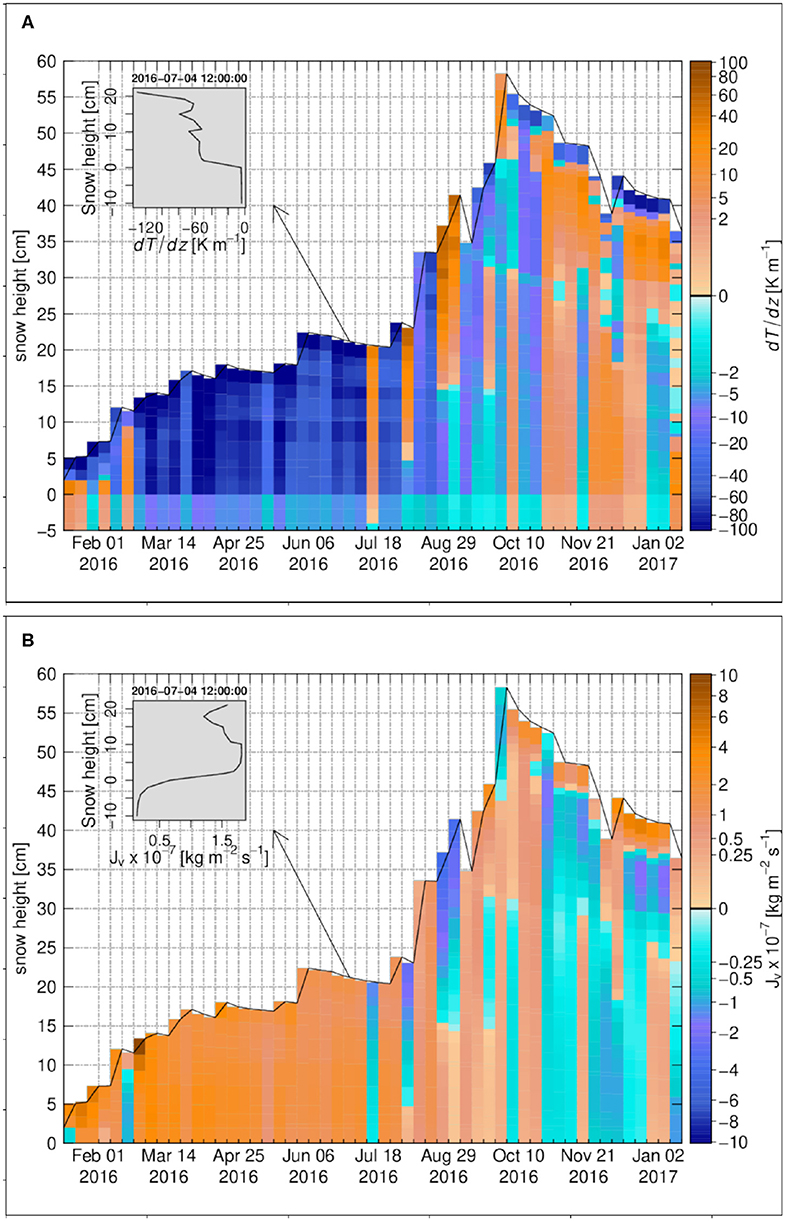
Figure 10. The weekly time series for Snow Buoy 2016S31, (A) the temperature gradient, (B) the diffusive water vapor flux. The insets in (A,B) show the vertical profiles on 4 July 2016 12:00:00. The zero-level height is the sea ice-snow interface.
The degree of undersaturation and the snow density change rate at Buoy S31 are shown in Figure 11A and Figure 11B, respectively. Similar to Samoylov, they are high at the base of the snowpack, i.e. for few centimeters above the sea ice-snow interface, from March until late July. Over this period the magnitude of temperature gradient through the ice underlying the snowpack is relatively constant and less than 10 K m−1. Again similar to Samoylov, there is a sharp change of temperature gradient at the sea ice-snow interface. This sharp change, in association with a reduced diffusivity of water vapor in ice when compared to snow, creates the basal layer of undersaturation. The cumulative density change due to vapor transport for Buoy S31 is shown in Figure 12A. Similar to Samoylov, there is a strong sublimation layer attached to the sea ice-snow interface with the largest negative change around −66 kg m−3. Deposition layers occur in the Buoy S31 snowpack with a pattern close to the one of oversaturation. They are related to vertical variations in the temperature gradient that drive vapor flux convergence (Figure 10B) and reach cumulative deposition around 11 kg m−3 at most. This makes Buoy S31 the snow cover with the highest overall magnitude of cumulative density change as a result of water vapor transport.
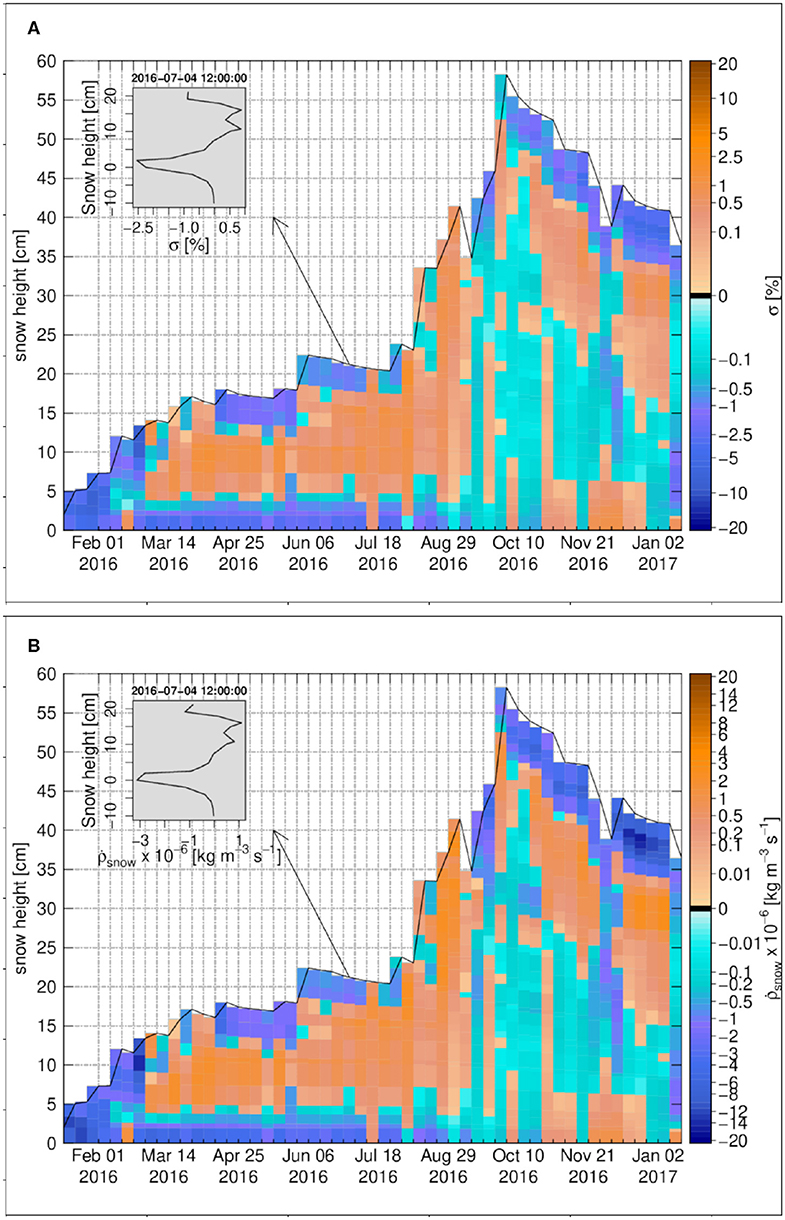
Figure 11. The weekly time series for Snow Buoy 2016S31, (A) the degree of undersaturation, (B) the snow density change rate due to water vapor transport. The insets in (A,B) show the vertical profiles on 4 July 2016 12:00:00. The zero-level height is the sea ice-snow interface.
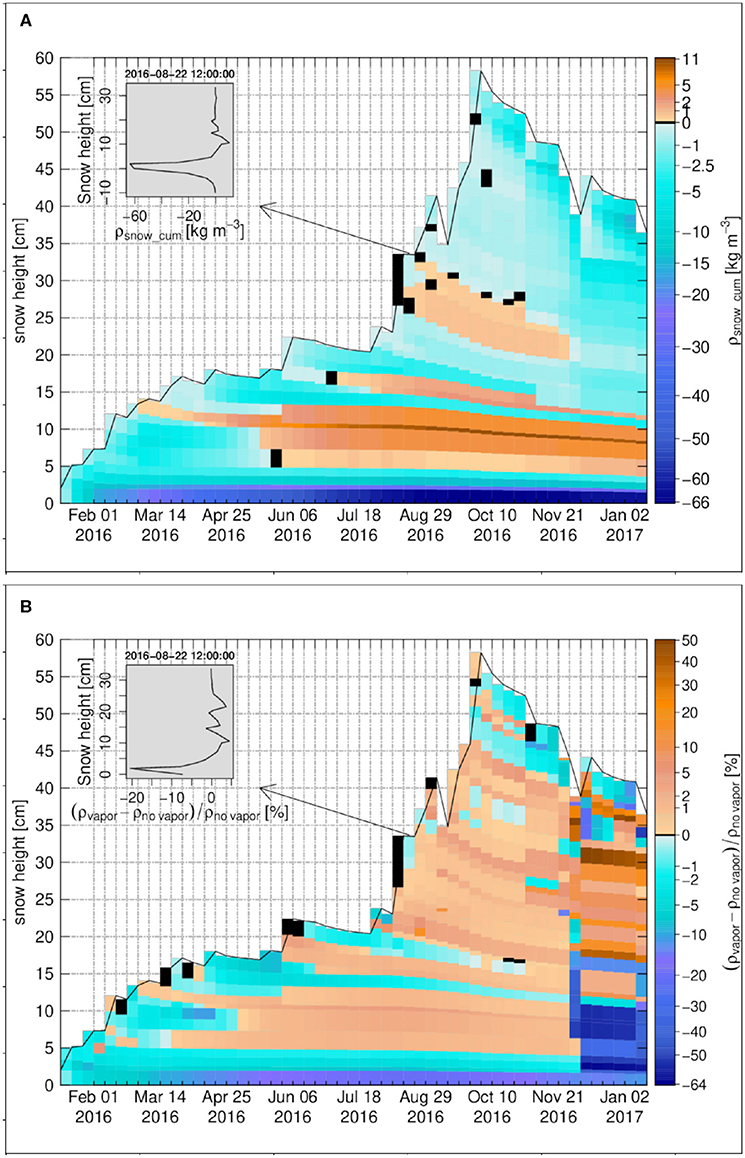
Figure 12. The weekly time series for Snow Buoy 2016S31, (A) the cumulative density change, (B) the snow density difference in percentage between the case of vapor transport and the case without vapor transport. The insets in (A,B) show the vertical profiles on 22 August 2016 12:00:00. Black color refers to zero values. The zero-level height is the sea ice-snow interface.
The density profiles for Buoy S31 for the case of vapor transport and the case of no vapor transport are compared in Figure 12B. As expected, due to the stronger effect of the vapor transport in the bottom layers above the sea ice, strongest differences can be seen in these snow layers, which are around −20% for the first sublimation layer and around 5% for the main deposition layer that develops from March to August. As for the other snow covers analyzed before, the differences in the density profiles for top layers in the accumulation period and also in general for all layers during the melting period, are not consistent with cumulative density changes due to diffusive water vapor fluxes. Therefore they are not the direct result of sublimation/deposition from the water vapor transport, but are mainly due to side effects of diffusion on the compaction and melting-refreezing rates via changes in temperature, density and viscosity described above.
The averaged ratio of the diffusive to the turbulent latent heat flux over the season, |ql,D/ql|, is calculated as 6.8% for Buoy S31, hence being the second largest among our 4 study sites after Weissfluhjoch (8.4%).
3.6. Sensitivity of Diffusion Effects to Soil Characteristics at Samoylov
Given the important role of soil in the formation of a basal sublimation layer, highlighted most strikingly at Samoylov, but also visible at Sodankylä and Weissfluhjoch, we evaluated the impact of the soil characteristics on the simulation results at Samoylov. The following sensitivity tests were performed:
(i) Enhanced diffusion in the soil was considered by changing the tortuosity parameter τ to 1 and then 5. Indeed, diffusivity in the soil is debated in the literature with some authors suggesting significant enhancement (e.g., Ho and Webb, 1998; Shokri et al., 2009). τ = 1 means no enhancement but getting rid off the effect of tortuosity, which actually changes the effective water vapor diffusivity in the soil by a factor of 18 with respect to the original formulation of diffusion in soils described in section 2.2.4.
(ii) The effect of the soil porosity was tested by setting a very porous (62.5% of porosity) soil layer in the uppermost 5 cm of the soil while keeping the default water fraction. A very porous organic soil layer can indeed be found at the top of Arctic permafrost soils (e.g., Boike et al., 2013).
(iii) The effect of soil water content was tested by considering a saturated soil in the default setup, as low-centered polygons at Samoylov can be saturated at the beginning of the winter season (Boike et al., 2013).
The results of the tests were the following, using the example of Samoylov:
(i) The increase of soil effective diffusivity leads to enhanced vapor flux from the soil to the snow basal layer. Therefore the (negative) density change in the basal snow layers is reduced, from −62 to −54 and −40 kg m−3 for cumulative density changes from default setup to enhanced setups with τ = 1 and τ = 5, respectively. The additional vapor flux is mainly deposited in the first deposition layer above the basal snow layer, which experiences an increase in its (positive) cumulative density change. This increase is of lower magnitude than the change in basal depletion. Overall we see a moderate sensitivity of snow density changes to diffusion enhancement in the soil with effects restricted to the lower half of the snowpack and mainly affecting basal depletion. Qualitatively, the results obtained with default setup remain valid for increased soil diffusivity.
(ii) A very porous uppermost soil layer has qualitatively and quantitatively an effect similar to the enhanced soil diffusivity tested in (i): vapor flux from the soil is increased, leading to less flux divergence in the basal snow layer and therefore less depletion there, while the soil is more depleted. Some enhanced deposition in the first deposition layer also occurs.
(iii) Saturated soil conditions at Samoylov did not noticeably change the density changes induced by water vapor diffusion in the snowpack.
As a conclusion, the effects of water vapor diffusion in the snowpack can be quantitatively affected by porosity and diffusive properties in the soil, but the general behavior depicted by our Samoylov simulations remains qualitatively valid.
3.7. Comparison With Measured Density Profiles
Since Samoylov showed the strongest response of the density profile to vapor transport of all snow covers over land investigated, a limited comparison with measured density profile is presented in Figure 13. This comparison is limited in the sense that few density profile data are available at the site, and they show a significant spatial variability which is in part linked to the local micro-topography. Figure 13 compares our simulations with a density profile from a polygon center, that was selected as representative for the snow conditions in the centers of the tundra polygons (Gouttevin et al., 2018). The comparison confirms that vapor transport is helping to generate a low-density for the base of this Arctic snow cover. For the middle and upper part, the effect is still small compared to the general error between observations and model. The effect of diffusive vapor transport on density for deep snow covers is weak because of the lower temperature gradients compared to thin snow covers (Samoylov). This is shown in Figure 14, which has a minor density reduction at the base due to diffusive vapor flux. The density reduction slightly improves the agreement between simulations and in-situ observations. These comparisons also show that vapor transport as simulated by the model is not a sufficient explanation for the observed density changes. This does not necessarily indicate an underestimation of diffusive vapor fluxes in the simulation, because other processes, such as fresh snow density and wind compaction also impact density profiles. However, our result is also in agreement with experimental studies (Domine et al., 2016, 2018), pointing to the significance of convective transport. We conducted a Rayleigh number analysis for all snow covers investigated and found that for Samoylov, based on maximum (Ra* = 40) and minimum (Ra* = 4) critical Rayleigh numbers from literature (Palm and Tveitereid, 1979; Powers et al., 1985; Sturm and Johnson, 1991), the time for which free convection can occur over the winter season is 29.9 and 77.2%, respectively. The other snow covers are less susceptible to convection for minimum critical Rayleigh number but still show significant time fractions, over which convection is possible. Thus, other processes such as convective vapor transport but also (non-)settling of depth hoar need to be improved in SNOWPACK and other snow models. We will attempt a more complete model validation against measured density profiles in future, after introducing convective transport in SNOWPACK.
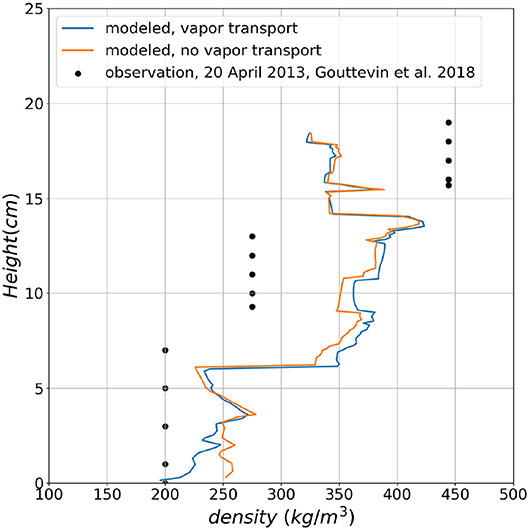
Figure 13. The comparison of simulated snow density profile with measured one for Samoylov on 20 April 2013.
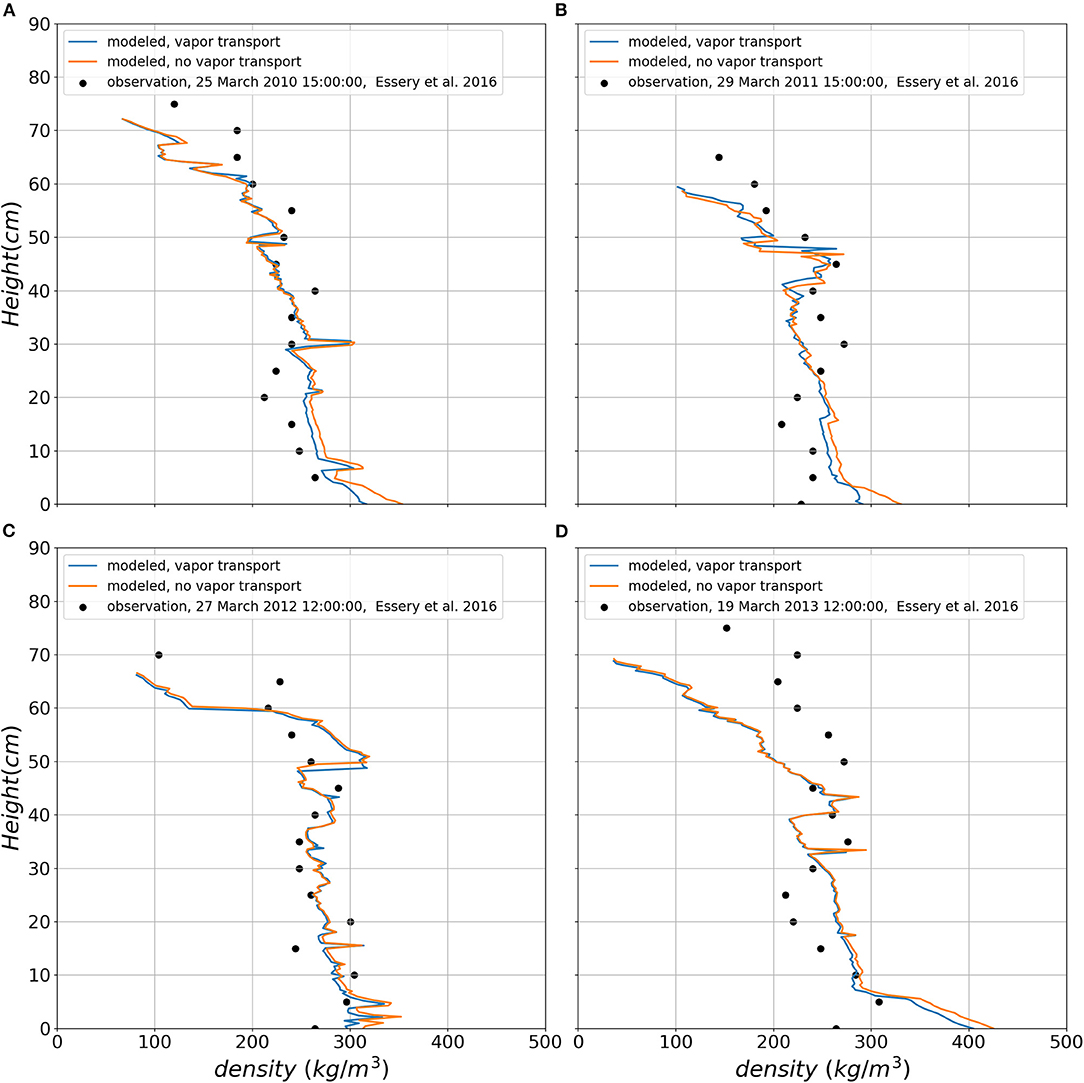
Figure 14. The comparison of simulated snow density profile with measured one for four winter seasons at Sodankylä, (A) on 25 March 2010, (B) on 29 March 2011, (C) on 27 March 2012, and (D) on 19 March 2013.
4. Conclusions, Limitations, and Outlook
In our analysis, the effects of diffusive vapor transport through four different types of snow covers, from thin Arctic and Antarctic (on sea ice) to thick Alpine, have been investigated numerically. To do so, a model to account for diffusive water vapor transport through soil and snow has been implemented in the detailed, multi-layered snowpack model SNOWPACK.
In the shallow Arctic snowpack at Samoylov, strong and sustained temperature gradients develop and the vapor transport has significant effects on the simulated density profile with a significant density decrease in the snowpack at the soil-snow interface that reaches a value of −21%. Above this layer, the density of the snowpack is generally increased up to around 7.5% by the end of season, as a result of deposition, which occurs over a larger depth of the snow cover.
At the other sites studied here, the highly non-linear side effects of original density changes induced by diffusion, on conductivity, temperature profiles, snow viscosity, compaction rate and melt-freeze processes, may change the final snowpack density more significantly than just by direct deposition and sublimation. At Sodankylä, typically, the density at the snowpack base is decreased by about 5% with dominating sublimation there, while other layers in the middle of snow cover feature a density decrease around −20 to −30%. At Weissfluhjoch, significant direct effects of diffusion happen near the surface or the base with moderate magnitude; they are even smaller in the core of the snowpack. For the sea ice, Snow Buoy 2016S31, it is found that the density decreased at the sea ice-snow interface by −20% while there is a deposition layer above it with increase in density around 5%. This result for the sea ice from Antarctic is qualitatively and quantitatively similar to Arctic snowpack at Samoylov as very low surface temperatures generate large temperature gradients through snowpack in both cases.
The simulations presented yield plausible results but validation against measurements is difficult. In general, the new simulations for thin snow covers reproduce the weak snow cover base often observed in Arctic environments better than the version without vapor transport (Sturm and Johnson, 1991; Gouttevin et al., 2012; Domine et al., 2016; Barrere et al., 2017). Errors in the density measurements are typically larger than the effect of vapor transport on density, especially in close to ground depth hoar layers in Arctic snow covers (Proksch et al., 2016). Since the settling routines in SNOWPACK have been calibrated to reproduce observed densities at Weissfluhjoch (Lehning et al., 2002a) without vapor transport, future work should construct micro-structure based snow settling laws independent of vapor transport. It should be noted that we did not change the thermal conductivity calculation in SNOWPACK in case of vapor transport despite the fact that the parameterization contains a term for the heat effect of that transport (Lehning et al., 2002b). This will be done in the future but is expected to have a very small impact on results.
The effect of vapor transport on density as discussed here is considered to be conservative and expected to be significantly larger in reality as we do not consider convective motion of vapor in the pore space (Sturm and Johnson, 1991) and neglect also arising anisotropy (Loewe et al., 2013), both of which are expected to increase vapor flux as well as effects on density. In summary, we see that diffusive transport has more local effects than what we expect from observations. It changes snow density significantly in a thin layer above ground in thin snow covers and mostly adds mass to upper layers. It will be interesting to see, how this patterns changes if convection is considered.
Future work will therefore include attempts to quantify convection and improve microstructure modeling. This should generate a solid basis for assessing isotope dynamics in snow deposition and metamorphism (Ebner et al., 2017; Touzeau et al., 2018). This paper only looked at the density effects of diffusive water vapor transport and has shown that it can affect the density profile in particular in thin snow covers.
Data Availability Statement
Publicly available datasets were analyzed in this study. This data can be found here: https://doi.org/10.1594/PANGAEA.891157, https://doi.org/10.1594/PANGAEA.891157, https://doi.org/10.1594/PANGAEA.891129, http://litdb.fmi.fi/ESMSnowMIP.php, www.meereisportal.de, https://www.envidat.ch/dataset/10-16904-1.
Author Contributions
MC has started the project, but the first author, MJ, continued the project by implementing the diffusive vapor transport in SNOWPACK and performing the simulations. MJ prepared the manuscript with contributions from all co-authors. NW, LR, MN, and NM provided the input data for the sea ice simulations and helped analyze the sea ice results. IG provided the input data for the shallow Arctic snowpack at Samoylov Island and advised how to apply it properly. IG also revised thoroughly the paper and helped discuss all the results. IG also advised to perform the sensitivity tests. VS contributed to have a correct physical concept of the phase change model applied in the new module of the diffusive vapor transport in SNOWPACK. AM revised the paper and contributed to post-processing. ML is the supervisor of the MJ (Ph.D. student) and he has proposed the main idea behind the project. ML thoroughly revised the paper for submission. All authors contributed to the article and approved the submitted version.
Funding
This project was co-supported by the Swiss National Science Foundation-SNF, grant number 200021E-154248 and the Deutsche Forschungsgemeinschaft (DFG) in the framework of the priority program Antarctic Research with comparative investigations in Arctic ice areas by grant numbers NI 1096/5-1 and KA 2694/7-1. Snow Buoy 2016S31 from 05.02.14 to 02.10.15 origin from https://www.meereisportal.de (Förderung: REKLIM-2013-04).
Conflict of Interest
The authors declare that the research was conducted in the absence of any commercial or financial relationships that could be construed as a potential conflict of interest.
Acknowledgments
We thank everyone who helped us by providing the data required for the simulations, especially Benjamin Bouchard. Mathias Bavay from WSL Institute for Snow and Avalanche Research-SLF is acknowledged for technical support regarding themeteoio package and SNOWPACK.
References
Albert, M. R., and McGilvary, W. R. (1992). Thermal effects due to air flow and vapor transport in dry snow. J. Glaciol. 38, 273–281. doi: 10.1017/S0022143000003683
Alley, R., Saltzman, E., Cuffey, K., and Fitzpatrick, J. (1990). Summertime formation of depth hoar in central Greenland. Geophys. Res. Lett. 17, 2393–2396. doi: 10.1029/GL017i013p02393
Barrere, M., Domine, F., Decharme, B., Morin, S., Vionnet, V., and Lafaysse, M. (2017). Evaluating the performance of coupled snow-soil models in surfexv8 to simulate the permafrost thermal regime at a high arctic site. Geosci. Model Dev. 10, 3461–3479. doi: 10.5194/gmd-10-3461-2017
Bartelt, P., Buser, O., and Sokratov, S. A. (2004). A nonequilibrium treatment of heat and mass transfer in alpine snowcovers. Cold Regions Sci. Technol. 39, 219–242. doi: 10.1016/j.coldregions.2004.04.005
Bird, R. B., Stewart, W. E., and Lightfoot, E. N. (1961). Transport phenomena, John Wiley and Sons, Inc., New York (1960). 780 pages. $11.50. AIChE J. 7, 5J–6J. doi: 10.1002/aic.690070245
Boike, J., Kattenstroth, B., Abramova, K., Bornemann, N., Chetverova, A., Fedorova, I., et al. (2013). Baseline characteristics of climate, permafrost and land cover from a new permafrost observatory in the Lena River Delta, Siberia (1998-2011). Biogeosciences 10, 2105–2128. doi: 10.5194/bg-10-2105-2013
Boike, J., Nitzbon, J., Anders, K., Grigoriev, M., Bolshiyanov, D., Langer, M., et al. (2018). A 16-year record (2002-2017) of permafrost, active layer, and meteorological conditions at the Samoylov island arctic permafrost research site, lena river delta, northern siberia: an opportunity to validate remote sensing data and land surface, snow, and permafrost models. Earth Syst. Sci. Data Discuss. 2018, 1–77. doi: 10.5194/essd-2018-82
Callaghan, T. V., Johansson, M., Brown, R. D., Groisman, P. Y., Labba, N., Radionov, V., et al. (2011). Multiple effects of changes in arctic snow cover. AMBIO 40, 32–45. doi: 10.1007/s13280-011-0213-x
Calonne, N., Geindreau, C., and Flin, F. (2014). Macroscopic modeling for heat and water vapor transfer in dry snow by homogenization. J. Phys. Chem. B 118, 13393–13403. doi: 10.1021/jp5052535
Calonne, N., Geindreau, C., Flin, F., Morin, S., Lesaffre, B., Rolland du Roscoat, S., et al. (2012). 3-D image-based numerical computations of snow permeability: links to specific surface area, density, and microstructural anisotropy. Cryosphere 6, 939–951. doi: 10.5194/tc-6-939-2012
Christon, M., Burns, P. J., and Sommerfeld, R. A. (1994). Quasi-steady temperature gradient metamorphism in idealized, dry snow. Num. Heat Transf. A Appl. 25, 259–278. doi: 10.1080/10407789408955948
Colbeck, S. C. (1993). The vapor diffusion coefficient for snow. Water Resour. Res. 29, 109–115. doi: 10.1029/92WR02301
Courant, R., Friedrichs, K., and Lewy, H. (1928). über die partiellen differenzengleichungen der mathematischen physik. Math. Ann. 100, 32–74. In German. doi: 10.1007/BF01448839
Crowe, C. T. (2005). Multiphase Flow Handbook. Boca Raton, FL: CRC Press. doi: 10.1201/9781420040470
Derksen, C., Silis, A., Sturm, M., Holmgren, J., Liston, G. E., Huntington, H., et al. (2009). Northwest territories and nunavut snow characteristics from a subarctic traverse: implications for passive microwave remote sensing. J. Hydrometeorol. 10, 448–463. doi: 10.1175/2008JHM1074.1
Domine, F., Barrere, M., and Sarrazin, D. (2016). Seasonal evolution of the effective thermal conductivity of the snow and the soil in high arctic herb tundra at Bylot island, Canada. Cryosphere 10:2573. doi: 10.5194/tc-10-2573-2016
Domine, F., Barrere, M., Sarrazin, D., Morin, S., and Arnaud, L. (2015). Automatic monitoring of the effective thermal conductivity of snow in a low-arctic shrub tundra. Cryosphere 9, 1265–1276. doi: 10.5194/tc-9-1265-2015
Domine, F., Belke-Brea, M., Sarrazin, D., Arnaud, L., Barrere, M., and Poirier, M. (2018). Soil moisture, wind speed and depth hoar formation in the arctic snowpack. J. Glaciol. 64, 990–1002. doi: 10.1017/jog.2018.89
Domine, F., Picard, G., Morin, S., Barrere, M., Madore, J.-B., and Langlois, A. (2019). Major issues in simulating some arctic snowpack properties using current detailed snow physics models: consequences for the thermal regime and water budget of permafrost. J. Adv. Model. Earth Syst. 11, 34–44. doi: 10.1029/2018MS001445
Ebner, P., Steen-Larsen, H. C., Stenni, B., Schneebeli, M., and Steinfeld, A. (2017). Experimental observation of transient δ18o interaction between snow and advective airflow under various temperature gradient conditions. Cryosphere. 11, 1733–1743. doi: 10.3929/ethz-b-000172998
Ebner, P. P., Andreoli, C., Schneebeli, M., and Steinfeld, A. (2015). Tomography-based characterization of ice-air interface dynamics of temperature gradient snow metamorphism under advective conditions. J. Geophys. Res. Earth Surface 120, 2437–2451. doi: 10.1002/2015JF003648
Enescu, I. I., Plattner, G.-K., Pernas, L. E., Haas-Artho, D., Bischof, S., Lehning, M., et al. (2018). The envidat concept for an institutional environmental data portal. Data Sci. J. 17:28. doi: 10.5334/dsj-2018-028
Essery, R., Kontu, A., Lemmetyinen, J., Dumont, M., and Ménard, C. B. (2016). A 7-year dataset for driving and evaluating snow models at an Arctic site (Sodankylä, Finland). Geosci. Instrum. Method Data Syst. 5, 219–227. doi: 10.5194/gi-5-219-2016
Foslien, W. E. (1994). A modern mixture theory applied to heat and mass transfer in snow (MS thesis). University of Wyoming, Laramie, WY, United States.
Gallet, J.-C., Domine, F., and Dumont, M. (2014). Measuring the specific surface area of wet snow using 1310 nm reflectance. Cryosphere 8, 1139–1148. doi: 10.5194/tc-8-1139-2014
Gouttevin, I., Langer, M., Löwe, H., Boike, J., Proksch, M., and Schneebeli, M. (2018). Observation and modelling of snow at a polygonal tundra permafrost site: spatial variability and thermal implications. Cryosphere 12, 3693–3717. doi: 10.5194/tc-12-3693-2018
Gouttevin, I., Menegoz, M., Dominé, F., Krinner, G., Koven, C., Ciais, P., et al. (2012). How the insulating properties of snow affect soil carbon distribution in the continental pan-arctic area. Journal of Geophys. Res. Biogeosci. 117. doi: 10.1029/2011JG001916
Guennebaud, G., and Jacob, B. (2010). Eigen v3. Available online at: http://eigen.tuxfamily.org
Hansen, A. C., and Foslien, W. E. (2015). A macroscale mixture theory analysis of deposition and sublimation rates during heat and mass transfer in dry snow. Cryosphere 9, 1857–1878. doi: 10.5194/tc-9-1857-2015
Ho, C. K., and Webb, S. W. (1998). Review of porous media enhanced vapor-phase diffusion mechanisms, models, and data-does enhanced vapor-phase diffusion exist? J. Porous Media. 1, 71–92. doi: 10.1615/JPorMedia.v1.i1.60
Johnson, J.B., M. S. D. P., and Bens, C. (1987). Field observations of thermal convection in a subarctic snow cover. Int. Assoc. Hydrol. Sci. Publ. 162, 105–118.
Jordan, R. (1991). A one-dimensional temperature model for a snow cover: Technical documentation for SNTHERM. 89. Technical report, Cold Regions Research and Engineering Lab, Hanover NH.
Kunii, D., and Levenspiel, O. (1991). “Chapter 11: Particle-to-gas mass and heat transfer,” in Fluidization Engineering, 2nd Edn., eds D. Kunii and O. Levenspiel (Boston, MA: Butterworth-Heinemann), 257–276. doi: 10.1016/B978-0-08-050664-7.50017-2
Lehning, M., Bartelt, P., Brown, B., and Fierz, C. (2002a). A physical snowpack model for the swiss avalanche warning: Part iii: Meteorological forcing, thin layer formation and evaluation. Cold Regions Sci. Technol. 35, 169–184. doi: 10.1016/S0165-232X(02)00072-1
Lehning, M., Bartelt, P., Brown, B., Fierz, C., and Satyawali, P. (2002b). A physical snowpack model for the swiss avalanche warning: Part II. Snow microstructure. Cold Regions Sci. Technol. 35, 147–167. doi: 10.1016/S0165-232X(02)00073-3
Lehning, M., Bartelt, P., Brown, B., Russi, T., Stöckli, U., and Zimmerli, M. (1999). Snowpack model calculations for avalanche warning based upon a new network of weather and snow stations. Cold Regions Sci. Technol. 30, 145–157. doi: 10.1016/S0165-232X(99)00022-1
Loewe, H., Riche, F., and Schneebeli, M. (2013). A general treatment of snow microstructure exemplified by an improved relation for thermal conductivity. Cryosphere 7, 1473–1480. doi: 10.5194/tc-7-1473-2013
Millington, R. J., and Quirk, J. P. (1961). Transport in porous media (in soil science). Trans. Int. Congr. Soil Sci. 7, 97–106.
Neumann, T. A., Albert, M. R., Engel, C., Courville, Z., and Perron, F. (2009). Sublimation rate and the mass-transfer coefficient for snow sublimation. Int. J. Heat Mass Transf. 52, 309–315. doi: 10.1016/j.ijheatmasstransfer.2008.06.003
Nicolaus, M., and Schwegmann, S. (2017). “Snow height on sea ice and sea ice drift from autonomous measurements from buoy 2014s9, deployed during polarstern cruise ps82 (ant-xxix/9),” in Nicolaus, Marcel; Hoppmann, Mario; Arndt, Stefanie; Hendricks, Stefan; Katlein, Christian; König-Langlo, Gert; Nicolaus, Anja; Rossmann, Leonard; Schiller, Martin; Schwegmann, Sandra; Langevin, Danielle; Bartsch, Annekathrin (2017): Snow Height and Air Temperature on Sea Ice from Snow Buoy Measurements. Alfred Wegener Institute, Helmholtz Center for Polar and Marine Research, Bremerhaven, PANGAEA. Available online at: https://doi.org/10.1594/PANGAEA.875638
Palm, E., and Tveitereid, M. (1979). On heat and mass flux through dry snow. J. Geophys. Res. Oceans 84, 745–749. doi: 10.1029/JC084iC02p00745
Pfeffer, W. T., and Mrugala, R. (2002). Temperature gradient and initial snow density as controlling factors in the formation and structure of hard depth hoar. J. Glaciol. 48, 485–494. doi: 10.3189/172756502781831098
Pinzer, B. R., Schneebeli, M., and Kaempfer, T. U. (2012). Vapor flux and recrystallization during dry snow metamorphism under a steady temperature gradient as observed by time-lapse micro-tomography. Cryosphere 6, 1141–1155. doi: 10.5194/tc-6-1141-2012
Powers, D., O'Neill, K., and Colbeck, S. C. (1985). Theory of natural convection in snow. J. Geophys. Res. Atmos. 90, 10641–10649. doi: 10.1029/JD090iD06p10641
Proksch, M., Rutter, N., Fierz, C., and Schneebeli, M. (2016). Intercomparison of snow density measurements: bias, precision, and vertical resolution. Cryosphere 10, 371–384. doi: 10.5194/tc-10-371-2016
Richards, L. A. (1931). Capillary conduction of liquids through porous mediums. J. Appl. Phys. 1, 318–333. doi: 10.1063/1.1745010
Schneider von Deimling, T., Meinshausen, M., Levermann, A., Huber, V., Frieler, K., Lawrence, D. M., et al. (2012). Estimating the near-surface permafrost-carbon feedback on global warming. Biogeosciences 9, 649–665. doi: 10.5194/bg-9-649-2012
Shokri, N., Lehmann, P., and Or, D. (2009). Critical evaluation of enhancement factors for vapor transport through unsaturated porous media. Water Resour. Res. 45. doi: 10.1029/2009WR007769
Slater, A. G., Schlosser, C. A., Desborough, C., Pitman, A., Henderson-Sellers, A., Robock, A., et al. (2001). The representation of snow in land surface schemes: results from pilps 2 (D). J. Hydrometeorol. 2, 7–25. doi: 10.1175/1525-7541(2001)002<0007:TROSIL>2.0.CO;2
Sokratov, S. A., and Maeno, N. (2000). Effective water vapor diffusion coefficient of snow under a temperature gradient. Water Resour. Res. 36, 1269–1276. doi: 10.1029/2000WR900014
Sommerfeld, R. A., Friedman, I., and Nilles, M. (1987). “The fractionation of natural isotopes during temperature gradient metamorphism of snow,” in Seasonal Snowcovers: Physics, Chemistry, Hydrology, eds H. G. Jones and W. J. Orville-Thomas (Dordrecht: Springer), 95–105. doi: 10.1007/978-94-009-3947-9_5
Sturm, M., and Benson, I. C. S. (1997). Vapor transport, grain growth and depth-hoar development in the subarctic snow. J. Glaciol. 43:42. doi: 10.3189/S0022143000002793
Sturm, M., and Johnson, J. B. (1991). Natural convection in the subarctic snow cover. J. Geophys. Res. Solid Earth 96, 11657–11671. doi: 10.1029/91JB00895
Taillandier, A.-S., Domine, F., Simpson, W. R., Sturm, M., Douglas, T. A., and Severin, K. (2006). Evolution of the snow area index of the subarctic snowpack in central Alaska over a whole season. Consequences for the air to snow transfer of pollutants. Environ. Sci. Technol. 40, 7521–7527. doi: 10.1021/es060842j
Thorpe, A. D., and Mason, B. J. (1966). The evaporation of ice spheres and ice crystals. Brit. J. Appl. Phys. 17, 541–548. doi: 10.1088/0508-3443/17/4/316
Touzeau, A., Landais, A., Morin, S., Arnaud, L., and Picard, G. (2018). Numerical experiments on vapor diffusion in polar snow and firn and its impact on isotopes using the multi-layer energy balance model crocus in surfex v8.0. Geosci. Model Dev. 11, 2393–2418. doi: 10.5194/gmd-11-2393-2018
Trabant, D., and Benson, C. (1972). Field experiments on the development of depth hoar. Geol. Soc. Am. Mem. 135, 309–322. doi: 10.1130/MEM135-p309
Wever, N., Fierz, C., Mitterer, C., Hirashima, H., and Lehning, M. (2014). Solving Richards Equation for snow improves snowpack meltwater runoff estimations in detailed multi-layer snowpack model. Cryosphere 8, 257–274. doi: 10.5194/tc-8-257-2014
Wever, N., Rossmann, L., Maaß, N., Leonard, K. C., Kaleschke, L., Nicolaus, M., et al. (2020). Version 1 of a sea ice module for the physics-based, detailed, multi-layer SNOWPACK model. Geosci. Model Dev. 13, 99–119. doi: 10.5194/gmd-13-99-2020
Wever, N., Schmid, L., Heilig, A., Eisen, O., Fierz, C., and Lehning, M. (2015). Verification of the multi-layer snowpack model with different water transport schemes. Cryosphere 9, 2271–2293. doi: 10.5194/tc-9-2271-2015
Woo, M.-K. (2012). Permafrost Hydrology. Berlin: Springer Science & Business Media. doi: 10.1007/978-3-642-23462-0
Yosida, Z., Oura, H., Kuroiwa, D., Huzioka, T., Kojima, K., Aoki, S.-i., et al. (1955). Physical studies on deposited snow.; thermal properties. J. Low Temp. Sci. 7, 19–74.
Keywords: diffusive water vapor flux, phase change, snowpack model, snow on sea ice, snow metamorphism, mass transfer coefficient
Citation: Jafari M, Gouttevin I, Couttet M, Wever N, Michel A, Sharma V, Rossmann L, Maass N, Nicolaus M and Lehning M (2020) The Impact of Diffusive Water Vapor Transport on Snow Profiles in Deep and Shallow Snow Covers and on Sea Ice. Front. Earth Sci. 8:249. doi: 10.3389/feart.2020.00249
Received: 04 November 2019; Accepted: 08 June 2020;
Published: 16 July 2020.
Edited by:
Markus Michael Frey, British Antarctic Survey (BAS), United KingdomReviewed by:
Ruzica Dadic, Victoria University of Wellington, New ZealandRichard Essery, University of Edinburgh, United Kingdom
Copyright © 2020 Jafari, Gouttevin, Couttet, Wever, Michel, Sharma, Rossmann, Maass, Nicolaus and Lehning. This is an open-access article distributed under the terms of the Creative Commons Attribution License (CC BY). The use, distribution or reproduction in other forums is permitted, provided the original author(s) and the copyright owner(s) are credited and that the original publication in this journal is cited, in accordance with accepted academic practice. No use, distribution or reproduction is permitted which does not comply with these terms.
*Correspondence: Mahdi Jafari, bWFoZGkuamFmYXJpQGVwZmwuY2g=