 Vassiliy Kapitsa
 Maria Shahgedanova
 Igor Severskiy
 Nikolay Kasatkin
 Kevin White2
 Zamira Usmanova
- 1Institute of Geography and Water Safety, Almaty, Kazakhstan
- 2Department of Geography and Environmental Science, University of Reading, Reading, United Kingdom
- 3Faculty of Geography and Environmental Management, Al-Farabi Kazakh National University, Almaty, Kazakhstan
Continuous measurements of glaciological mass balance have been conducted at the Central Tuyuksu glacier, Tuyuksu group of glaciers, Ile Alatau, northern Tien Shan since 1957, showing that cumulative mass balance was negative since the 1970s. Geodetic mass balance was calculated for the 1958–1998 and 1998–2016 periods using multi-temporal digital elevation models derived from the historic photogrammetric surveys from 1958 and 1998 and the high-resolution Pléiades satellite stereo imagery from 2016. The geodetic measurements revealed a mean surface lowering of 23.2 ± 2.2 m (0.40 ± 0.04 m a–1) and a reduction in volume of (67.7 ± 6.7) × 106 m3 in 1958–2016 at the Central Tuyuksu glacier, yielding a geodetic mass balance of −21.8 ± 2.6 m w.e. Similar trends were observed at other glaciers of the Tuyuksu group, which lost in total 83.4 × 10⁶ m3 of ice. The mass balance annual rates have not changed significantly from 1958–1998 (−0.39 ± 0.05 m w.e. a−1) to 1998–2016 (−0.35 ± 0.18 m w.e. a−1) at the Central Tuyuksu and at other glaciers of the Tuyuksu group whose maximum elevations exceed 4,000 m a.s.l. While glacier thinning intensified in the ablation zone and affected a larger area in 1998–2016, extending to 3,600–3,700 m a.s.l., the accumulation increased at higher elevations in 1998–2016. Geodetic mass balance was more negative in 1998–2016 than in 1958–1998 at the smaller glaciers with lower maximum elevations. At the Central Tuyuksu, the geodetic mass balance was in close agreement with the glaciological mass balance, particularly in 1958–1998 when the difference between the geodetic and the cumulative glaciological mass balance values did not exceed 5%. During 1998–2016, this difference increased to 14%, with the glaciological method producing a more negative mass balance. This discrepancy was attributed to a systematic bias introduced by the lack of stakes in the accumulation zone of Central Tuyuksu whose contribution to uncertainty increased in 1998–2016 in line with an increase in accumulation. The negative mass balance of the Tuyuksu group of glaciers was attributed to a continuing increase in summer temperatures and a low accumulation observed in the 1970–1980s and at the turn of the century.
Introduction
There is ample evidence for glacier wastage in Tien Shan, Central Asia (Unger-Shayesteh et al., 2013). In the last two decades, research focused mainly on documenting changes in the glacier area (Kutuzov and Shahgedanova, 2009; Narama et al., 2010; Severskiy et al., 2016) as repeated satellite imagery has become widely available. However, from the perspective of changes in global sea level (Zemp et al., 2019) and in regional water resources (Huss and Hock, 2018; Shahgedanova et al., 2018, 2020), the changes in glacier volume and in mass are most important.
These changes have been assessed using geodetic mass balance method applied on a regional scale and measurements of the mass balance of individual glaciers using the glaciological (stake) method. Estimations of geodetic mass balance in Central Asia focused on comparisons of the Shuttle Radar Topography Mission (SRTM) digital elevation model (DEM) obtained in 2000 with earlier DEM built from the declassified Corona and Hexagon imagery from the 1970s (e.g., Pieczonka and Bolch, 2015). While an advantage of this method is the wide regional coverage and a relatively long time span, the uncertainties of mass balance measurements are high. In many regions of Tien Shan, they are comparable with the estimated values of mass balance. Distributed geodetic mass balance was derived for the wider region of High Asia by Brun et al. (2017) using SRTM and DEM derived from ASTER stereo imagery for a single time step of 2000–2016. Geodetic mass balance was calculated for several glaciers in Kyrgyzstan using differencing of multiple DEMs produced from high-resolution stereo imagery (Barandun et al., 2018).
Measurements of glacier mass balance using glaciological (stake) method have been conducted on several benchmark glaciers in Tien Shan since the first International Geophysical Year of 1957–1958 (Zemp et al., 2009). However, on most glaciers, the measurements were interrupted in the 1990s, resulting in more than 20 years of gap in data. On several glaciers in Uzbekistan and Kyrgyzstan, mass balance monitoring programs were renewed in the 2010s (Hoelzle et al., 2017). The gaps in the long-term mass balance records of several glaciers were filled using a combination of mass balance modeling and analysis of satellite data (Barandun et al., 2018).
Uninterrupted measurements continued on two benchmark glaciers, the Central Tuyuksu (often referred to as Tuyuksu) in the Ile Alatau, Kazakhstan, and the Urumqi Glacier No. 1 in China. The Tuyuksu mass balance monitoring program, which started in 1957, involves regular measurements of ablation during the melt season and surveys of snow depth at the end of the accumulation season using a network of over 100 stakes. Annual values of accumulation, ablation, and the resulting mass balance are reported to the World Glacier Monitoring Service (WGMS). Geodetic surveys are a part of the monitoring program and the glacier area has been mapped annually since 2006. There are two high-resolution DEM of the Tuyuksu and the surrounding glaciers from 1958 and 1998 (Severskiy et al., 2006). These DEMs were used to assess changes in glacier surface elevation, revealing strong glacier thinning that reached 50 m on the glacier tongue (Severskiy et al., 2006), and to verify the continuing glaciological measurements (Hagg et al., 2004). The latest verification using the 1958 and the 1998 DEMs and conducted for the Central Tuyuksu glacier showed a discrepancy between the geodetic mass balance of –12.6 m w.e. and the cumulative glaciological mass balance of –16.8 m w.e. and attributed it to the uncertainties of the glaciological method amplified in the cumulative record (Hagg et al., 2004).
More recently, however, there were no assessments of geodetic mass balance of the Tuyuksu glacier and the surrounding glaciers using contemporary high-resolution DEM. Such an assessment is needed in order to (i) assess temporal changes in the rates of glacier wastage and (ii) continue the validation of mass balance measured in situ under the conditions of rapid climatic warming. The stereo imagery from the Pléiades satellites was recently used to derive high-resolution DEM of glaciers and assess changes in elevation of glacier surface with an accuracy of ±1 m or better at multiple sites in the Andes, European Alps, Himalayas, and Iceland by Berthier et al. (2014), in Central Tien Shan by Barandun et al. (2018), and in Caucasus by Kutuzov et al. (2019). Pléiades is a constellation of satellites launched by the French Space Agency (CNES) in December 2011. It is envisaged that its application, coordinated by the Pléiades Glacier Observatory project1, will complement in situ observations of glacier mass balance conducted at the WGMS reference glaciers. This study is the first attempt of deriving and using Pléiades DEM of the Tuyuksu group of glaciers.
This paper presents three high-resolution DEMs derived for the Tuyuksu group of glaciers from the photogrammetric surveys of 1958 and 1998 and from the Pléiades stereo imagery for 2016. Changes in surface elevation and geodetic mass balance are calculated for three time periods from these DEMs. Geodetic mass balance is compared with cumulative mass balance derived from stake measurements. The observed glacier change is discussed in the context of continuing climatic warming and its impact on the glaciers of the region.
Study Area
The Tuyuksu group of glaciers is located in the headwaters of the Kishi Almaty River on the northern slope of the Ile (Zailiiskiy) Alatau (Figure 1) approximately at 43°N and 77°06’ E and between 3,500 and 4,300 m a.s.l. The region is characterized by strong seasonal variations in temperature and precipitation. The westerly flow dominates in autumn and in spring, resulting in the precipitation maxima in April–May on the plains shifting toward June–July in the middle and high mountains, where snow accumulation peaks in spring and in early summer. The snow and glacier melt period is limited to June–July–August, extending to September in individual years.
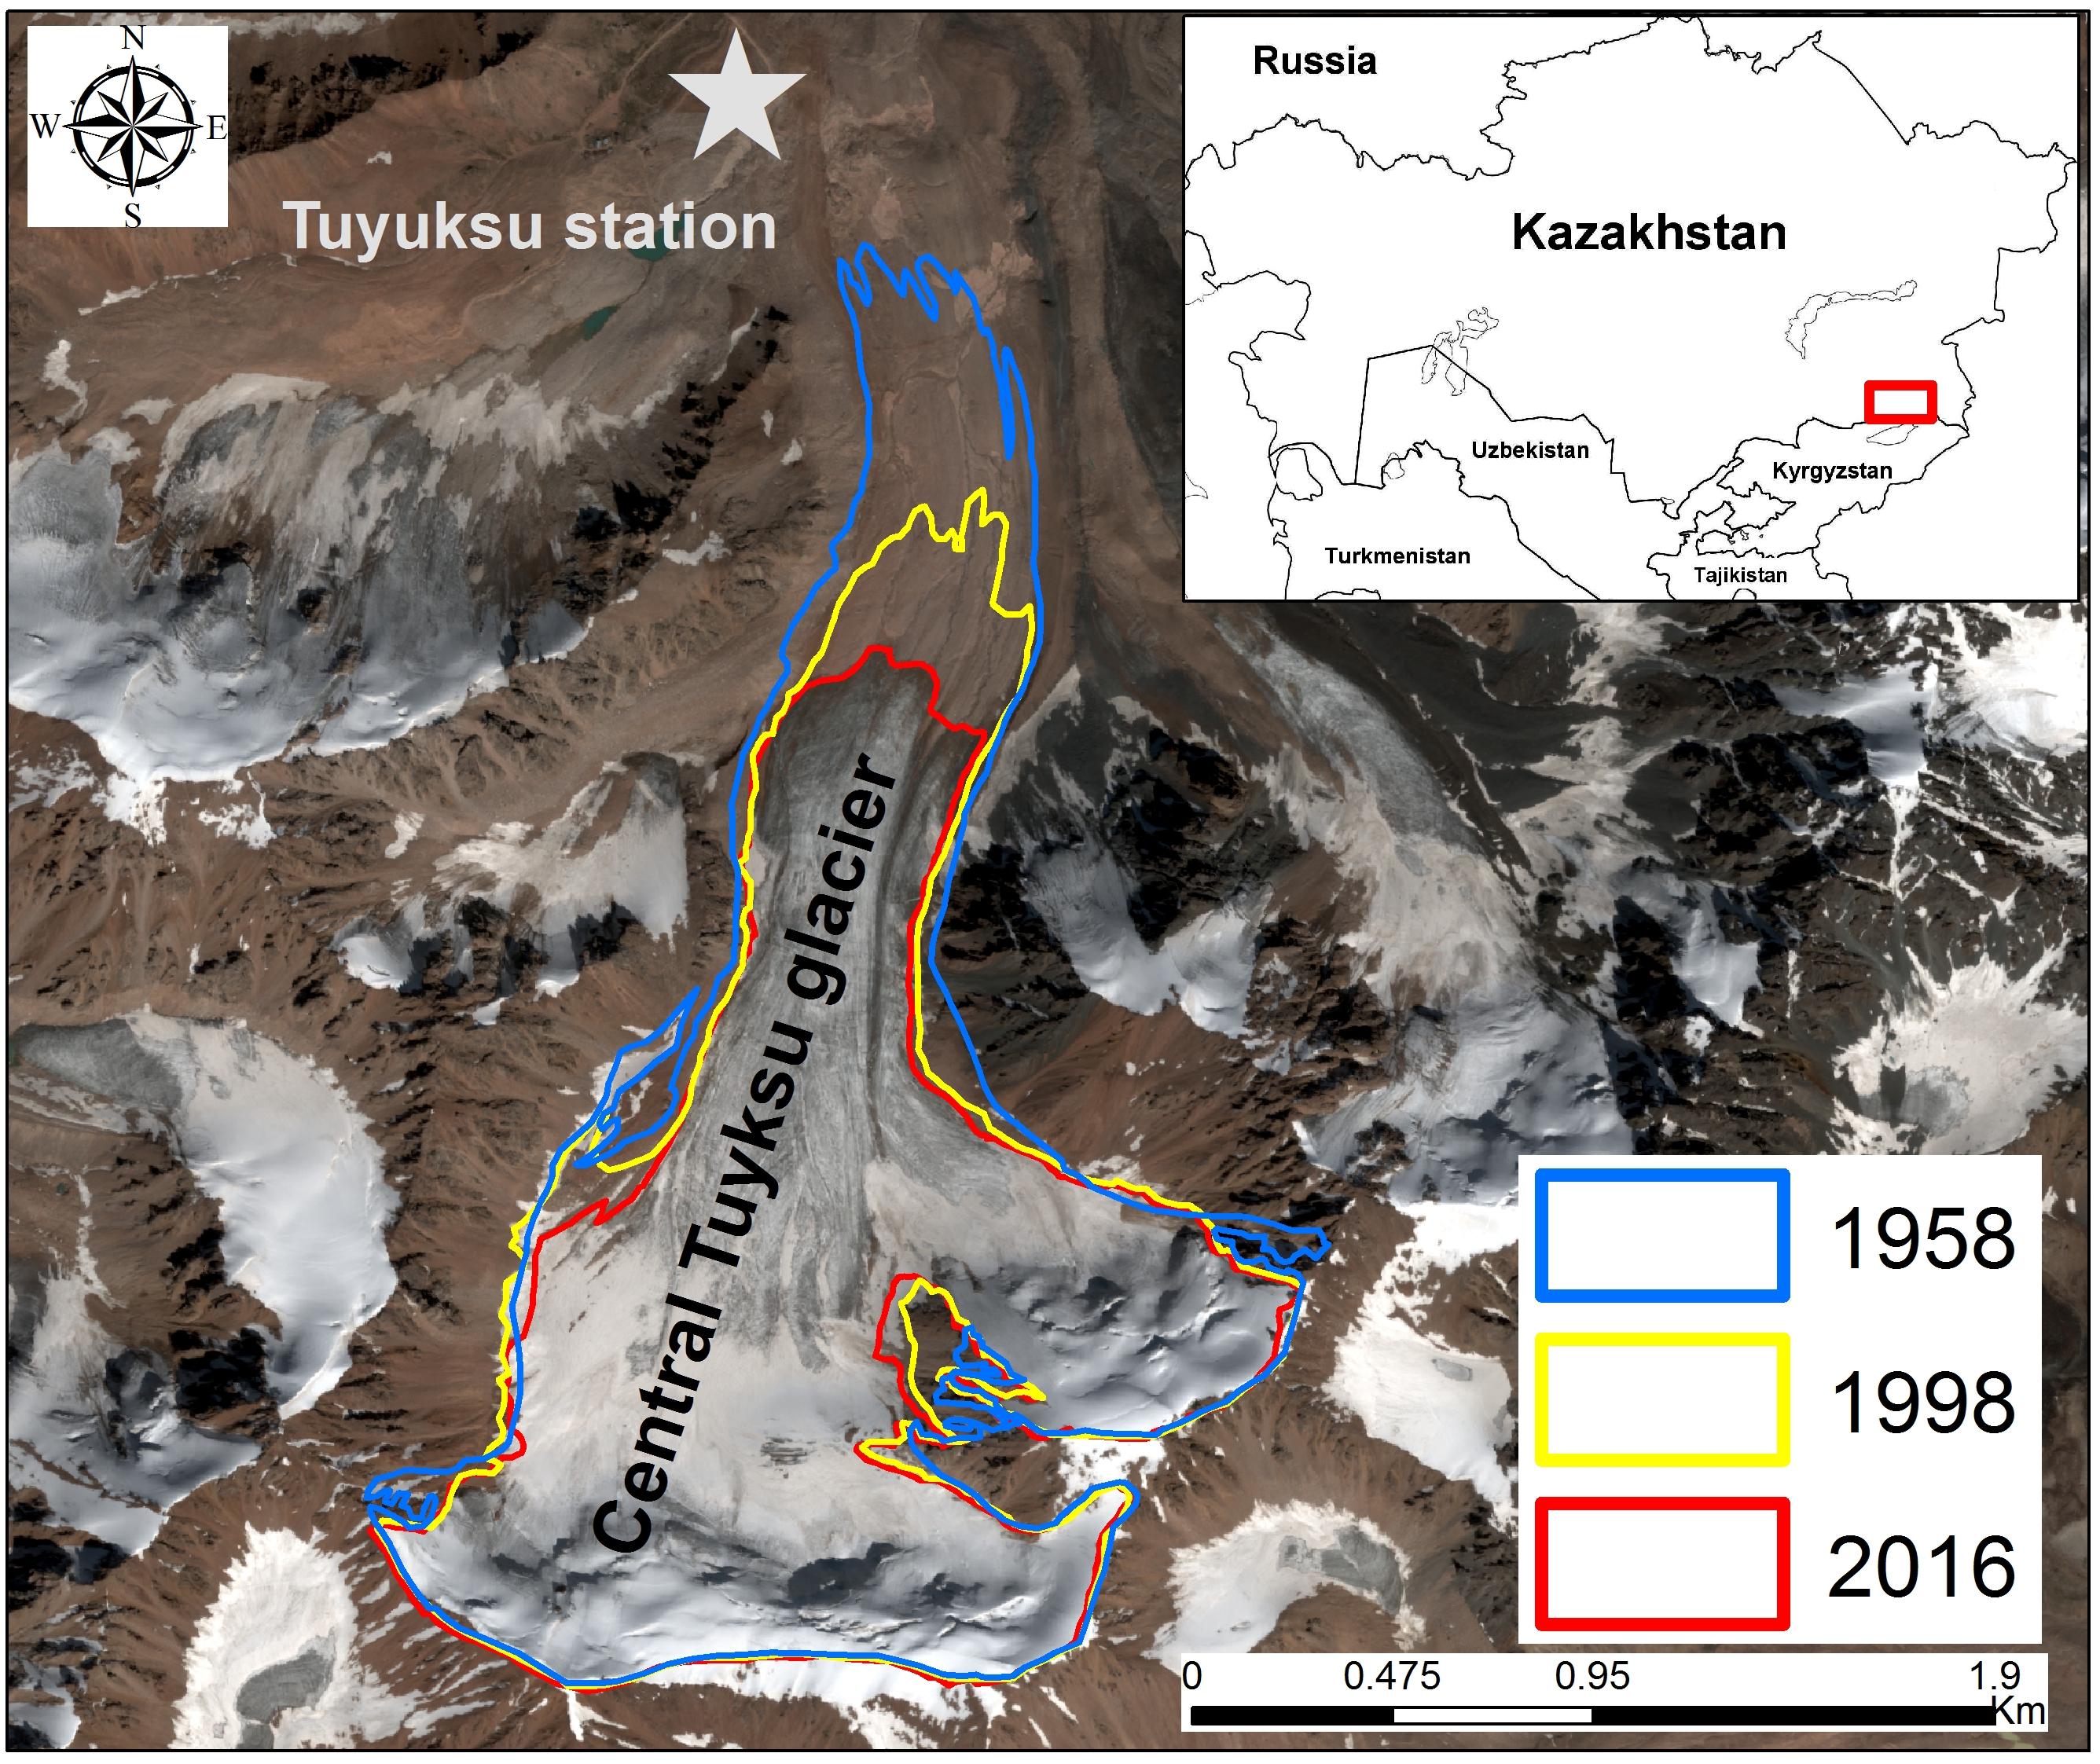
Figure 1. Study area. Outlines of the Central Tuyuksu glacier are shown for 1958, 1998, and 2016. Pléiades image is used as background.
At the beginning of the monitoring program, the Tuyuksu group included nine glaciers with a combined area of 7.6 km2 in 1958. Central Tuyuksu is the largest glacier of the mountain–valley type, with an area of 2.99 km2 in 1958 and declining to 2.28 km2 in 2016. Between 1958 and 2016, the accumulation–area ratio (AAR) averaged 41%. The equilibrium line altitude (ELA) was positioned on average at 3,830 m, with a standard deviation of ±110 m. Two other glaciers had areas in excess of 1 km2.
Between 1990 and 2008, the glaciers of the Ile Alatau were losing their area at an average rate of 0.9% a–1, although the rates vary between the catchments depending on their elevation and the size of the glaciers (Narama et al., 2010; Severskiy et al., 2016). These changes have been attributed largely to increasing air temperatures and also to a negative anomaly in precipitation observed in the 1970–1980s (Severskiy et al., 2006, 2016; Shahgedanova et al., 2018), which was forced by changes in the atmospheric circulation and affected most of Tien Shan (Cao, 1998).
The changes in area of the glaciers of the Tuyuksu group correlated well with the changes of the total glacier area in the Ile and Kungey Alatau system (Severskiy et al., 2016). The cumulative mass balance of the Central Tuyuksu remained negative and the annual mass balance was mostly negative, with the exception of 15 years, mostly in the 1960s and in the 21st century (Severskiy et al., 2016).
Data and Methods
DEM Generated From Photogrammetric Data From 1958 and 1998
A ground-based photogrammetric survey was conducted in the headwaters of Kishi Almaty River in August 1958 by the Institute of Cartography, Technical University of Dresden, Germany, and Institute of Geography, Kazakhstan. The photogrammetric survey was repeated in the same area in August 1998 by the Institute of Photogrammetry and Cartography, Munich Technical University, and the Commission for Glaciology of the Bavarian Academy of Sciences. Both surveys used the same local coordinate system and the same five ground control points (GCP) established in 1958. Two 1:10,000 maps with 10-m equidistant contours were produced from the surveys’ data (Simon et al., 1961; Eder et al., 2002, 2005). The maps covered nine glaciers, including the Central Tuyuksu itself.
Both maps were scanned with a pixel resolution of 1,200 dpi and automatically digitized using ArcScan module of Arc GIS. The centerline method of automatic vectorization was used. Following vectorization, both maps were re-projected to WGS 84, zone 43 N projection. Two DEMs were developed from the digitized and the georeferenced maps using ArcGIS 10.5 software. The elevations were interpolated on regular grids with a resolution of 10 m using the kriging method.
A network of 36 GCP (including five GCP established in 1958) obtained in August 2018 and September 2019 using Topcon and Leica DGPS, respectively, was used for co-registration and correction of DEMs. All GCP were located on the firm terrain, which did not experience a change in elevation due to ice melt or ground movement. Planimetric correction was not required. The elevation differences between the DEMs and the GCP are shown in Table 1 and these are assumed to be due to errors in DEMs. On average, GCP elevation was 2.9 m higher than the elevation of the corresponding pixels in the 1958 DEM, while the 1998 DEM showed a very close match.
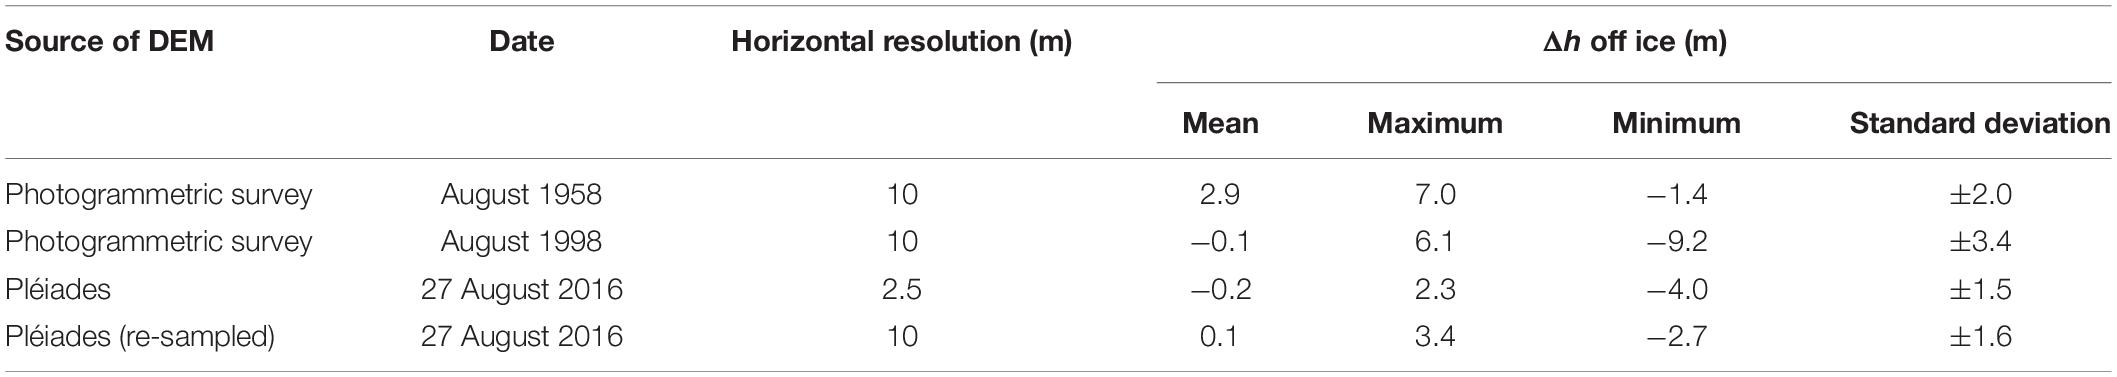
Table 1. Accuracy of digital elevation model (DEM) before bias removal relative to the ground-control points (GCP) network (GCP minus DEM).
Vertical displacement is a function of aspect and terrain slope (Nuth and Kääb, 2011) and it is desirable to assess and, if required, remove spatially varying elevation errors. In this study, the DEMs covered a relatively small area located on the northern slope of Ile Alatau. Most glaciers have northerly and westerly aspects. A small number of GCP from higher elevations did not allow us to produce a comprehensive assessment of errors due to slope steepness relative to GCP. Therefore, vertical bias was removed from both DEMs by subtracting the mean values of vertical shift registered off ice from all DEM pixels (Table 1).
Pléiades DEM From 2016
The Pléiades 1A and 1B twin satellites, launched in 2011 and 2012, respectively, generate stereo images with a pixel size of 0.5 m for the panchromatic channel and 2.5 m for the multi-spectral blue, green, red, and near-infrared channels2. For DEM generation, the multispectral data are preferred due to better point matching afforded by multi-channel images (Gim and Shin, 2015). A pair of multispectral images, obtained at the end of the ablation season on 27 August 2016, was used in this study (Figures 1, 2A).
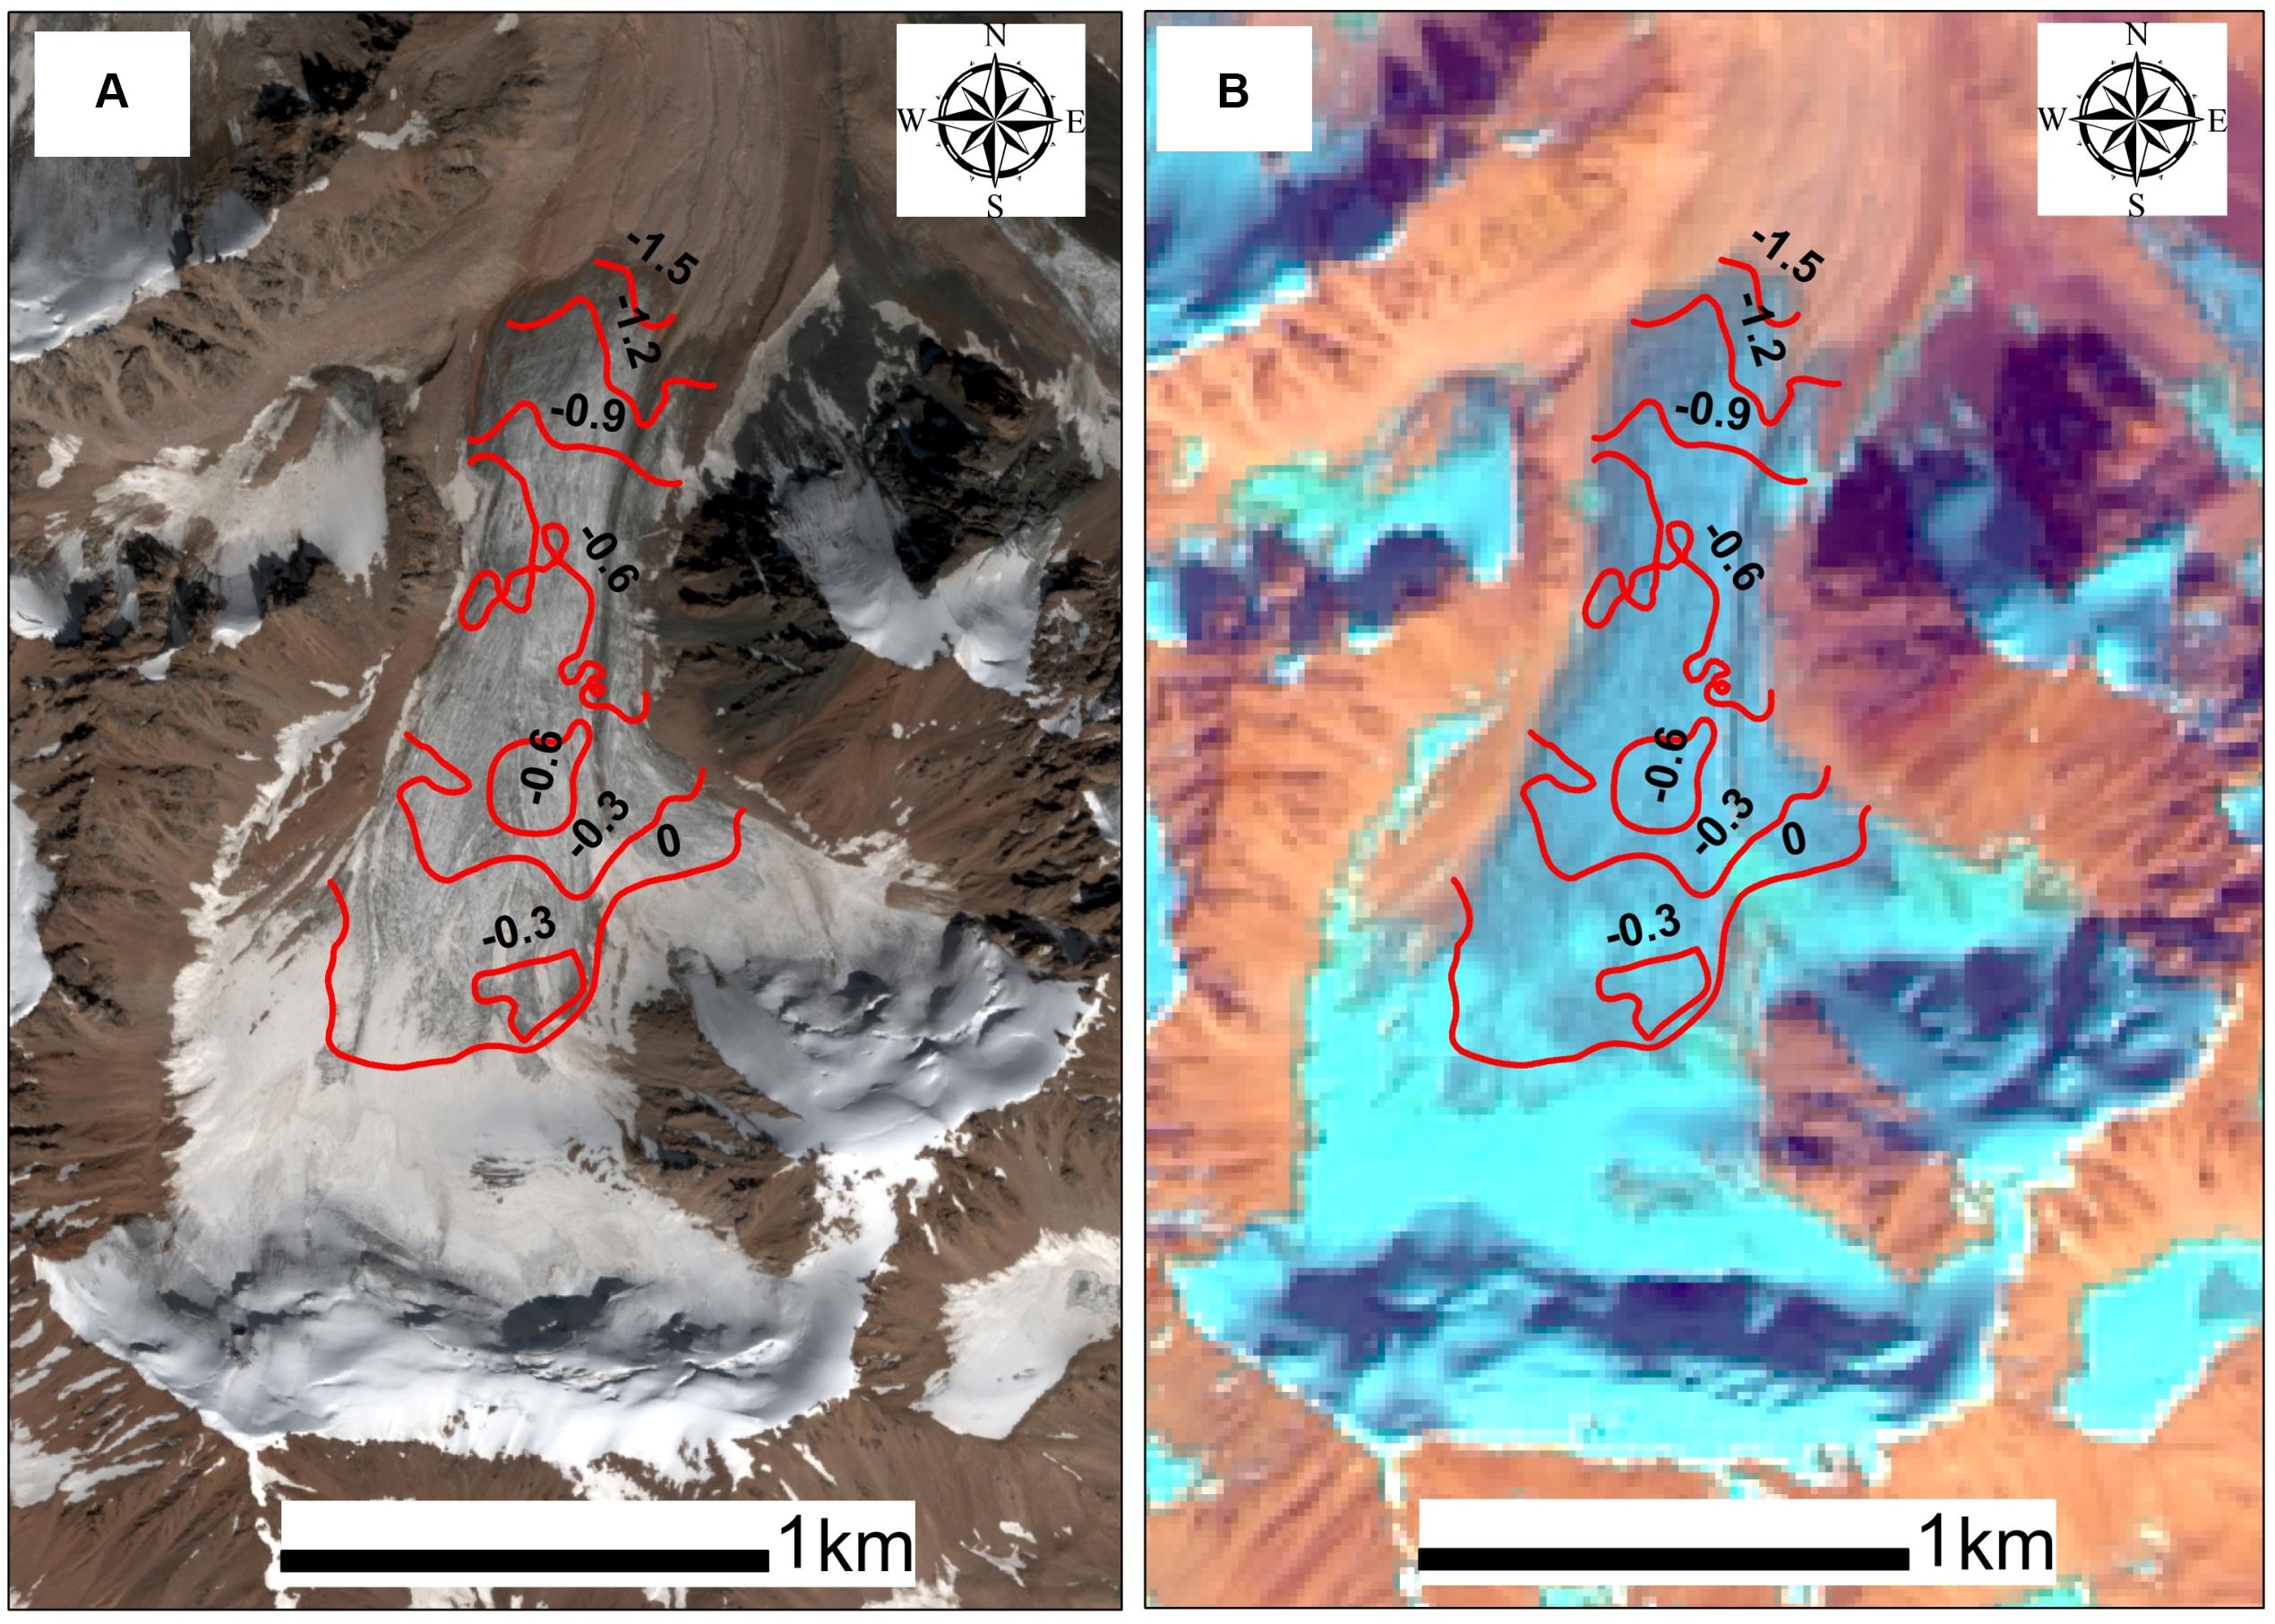
Figure 2. Extent of snow cover on the (A) Pléiades image of 27 August 2016 and (B) Landsat 8 image of 22 September 2016. Isolines show ice ablation (m w.e.) as measured by the stake method on 24 September 2016. Note that the position of the snow line has not changed significantly between 27 August and the end of the mass balance year in September.
The Pléiades DEM was generated using Leica Photogrammetry Suite software using the Automatic Terrain Extraction processing engine, with the rational polynomial coefficients distributed as metadata with the imagery. These data describe the geometric analytic model between image space and ground space and are based on the direct scene orientation derived from a combination of GNSS, star sensors, and giros (Jacobsen and Topan, 2015). We refined this model using 36 GCP distributed across the image area. A 2.5-m-resolution DEM was derived from the point cloud data derived from automatic image matching. The obtained DEM was co-registered to 36 GCPs, and statistics characterizing the uncertainties of the DEM on stable terrain were calculated following the co-registration (Table 1).
The Pléiades DEM was resampled from 2.5 m to a coarser resolution of 10 m using bilinear interpolation method in order to match the spatial resolution of the earlier DEM.
Co-registration of DEM and Accuracy Assessment
Changes in surface elevation were calculated for three time periods as defined by the DEM acquisition dates. Three pairs of co-registered DEM were produced using the re-sampled Pléiades DEMs (1958–1998, 1998–2016, and 1958–2016) to calculate changes in elevation of the terrain by subtracting a later DEM from an earlier DEM for each pair.
At this step, DEMs that was adjusted for bias following the co-registration with GCP were used. There were no planimetric shifts between the DEMs relative to each other. The accuracy of vertical fit between DEMs in each pair was evaluated by computing the pixel-by-pixel difference in elevation (bias) for the ice-free areas where no elevation change was expected (Berthier et al., 2007; Agarwal et al., 2017). As errors in DEM increase with increasing slope, the accuracy assessments are often restricted to the areas with slope less than 30° (e.g., Pieczonka et al., 2011). An analysis of error distribution with elevation in the study area confirmed this assumption and 30° slope value was used as a cutoff point for selecting pixels for accuracy assessment.
The error statistics for stable, ice-free terrain are shown in Table 2. Despite the initial correction for elevation bias using GCP, large elevation differences were still present in each pair of DEMs. Following Gardelle et al. (2013), we considered the elevation differences outside the range of mean ± three standard deviations as outliers. The outliers were removed and the relative vertical error statistics were recalculated, showing some improvement in standard deviations (Table 2).
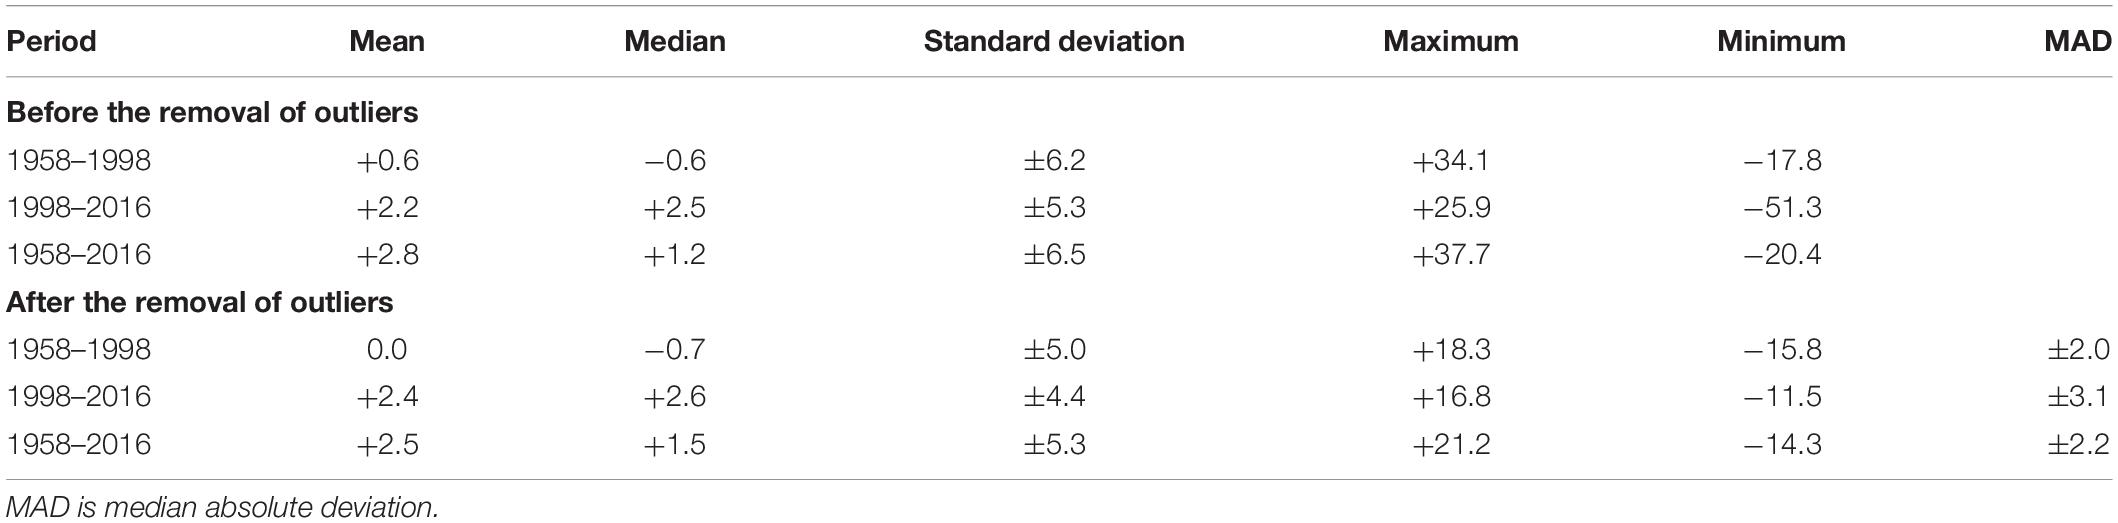
Table 2. Digital elevation model (DEM) bias statistics (m) calculated for the areas of stable, ice-free terrain and slope less than 30° following an adjustment between DEM and ground-control points.
The difference between the DEMs within stable terrain following the removal of outliers was used to quantify uncertainty in elevation change. We used median absolute deviation (MAD), calculated using Eq. (1), to quantify uncertainty in elevation change. The MAD values, shown in Table 2, were applied to the entire footprints of each pair of DEMs.
where Xn is a sample of differences in elevation between two DEMs used in the accuracy assessment.
To identify outliers within the glacierized area, statistics of elevation change were calculated for 50-m altitudinal belts (Gardelle et al., 2013). Pixels, in which elevation change exceeded mean ± three standard deviations as calculated for a given altitudinal belt, were removed. While few outliers were identified in the ablation zone (particularly at the Central Tuyuksu which has a gentle slope), unrealistic elevation differences were present in areas of steep terrain and deep shadow in the 1998–2016 and 1958–2016 pairs of DEMs built from the optical Pléiades imagery.
Assessment of Elevation Change and Calculation of Geodetic Mass Balance
Elevation changes were calculated for the glacierized areas (open parts of glaciers) including the Central Tuyuksu (Table 3) and eight other glaciers of the Tuyuksu group (Table 4). The supra-glacier debris cover is almost absent in the region. We note that the 2015–2016 mass balance year was characterized by high accumulation, resulting primarily from precipitation in April–June, and snow was present on the glaciers at the time of the Pléiades imagery acquisition on 27 August 2016. This could potentially introduce additional uncertainty to the calculation of changes in glacier surface elevation and geodetic mass balance. In order to establish whether snow cover melted between the acquisition date and the end of the mass balance year (and therefore the DEM required adjustment) or persisted into the next mass balance year (the DEM does not require adjustment), the position of the snow line on the Pléiades images was compared with the results of the glaciological measurements conducted on 31 August and 24 September 2016 and the Landsat 8 image of 22 September 2016 (Figure 2). No further melt was registered on the Central Tuyuksu after the 24 September survey, indicating the end of the 2015–2016 mass balance year. Figure 2 shows that there were no significant changes in the position of the snow line between the two images, while the snow depth measured in situ on 31 August and 24 September 2016 did not change significantly either. Therefore, no adjustments were made to the Pléiades DEM.
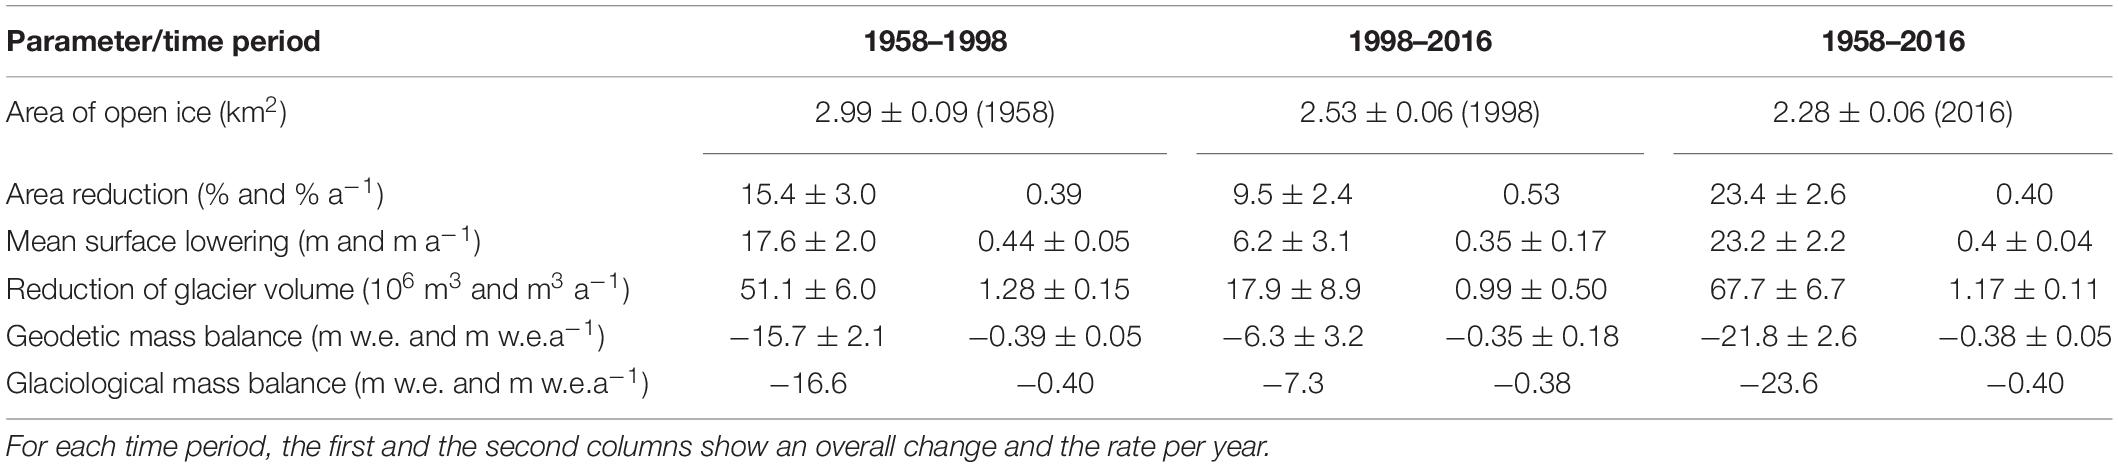
Table 3. Area, volume, and mass balance of the Central Tuyuksu glacier.
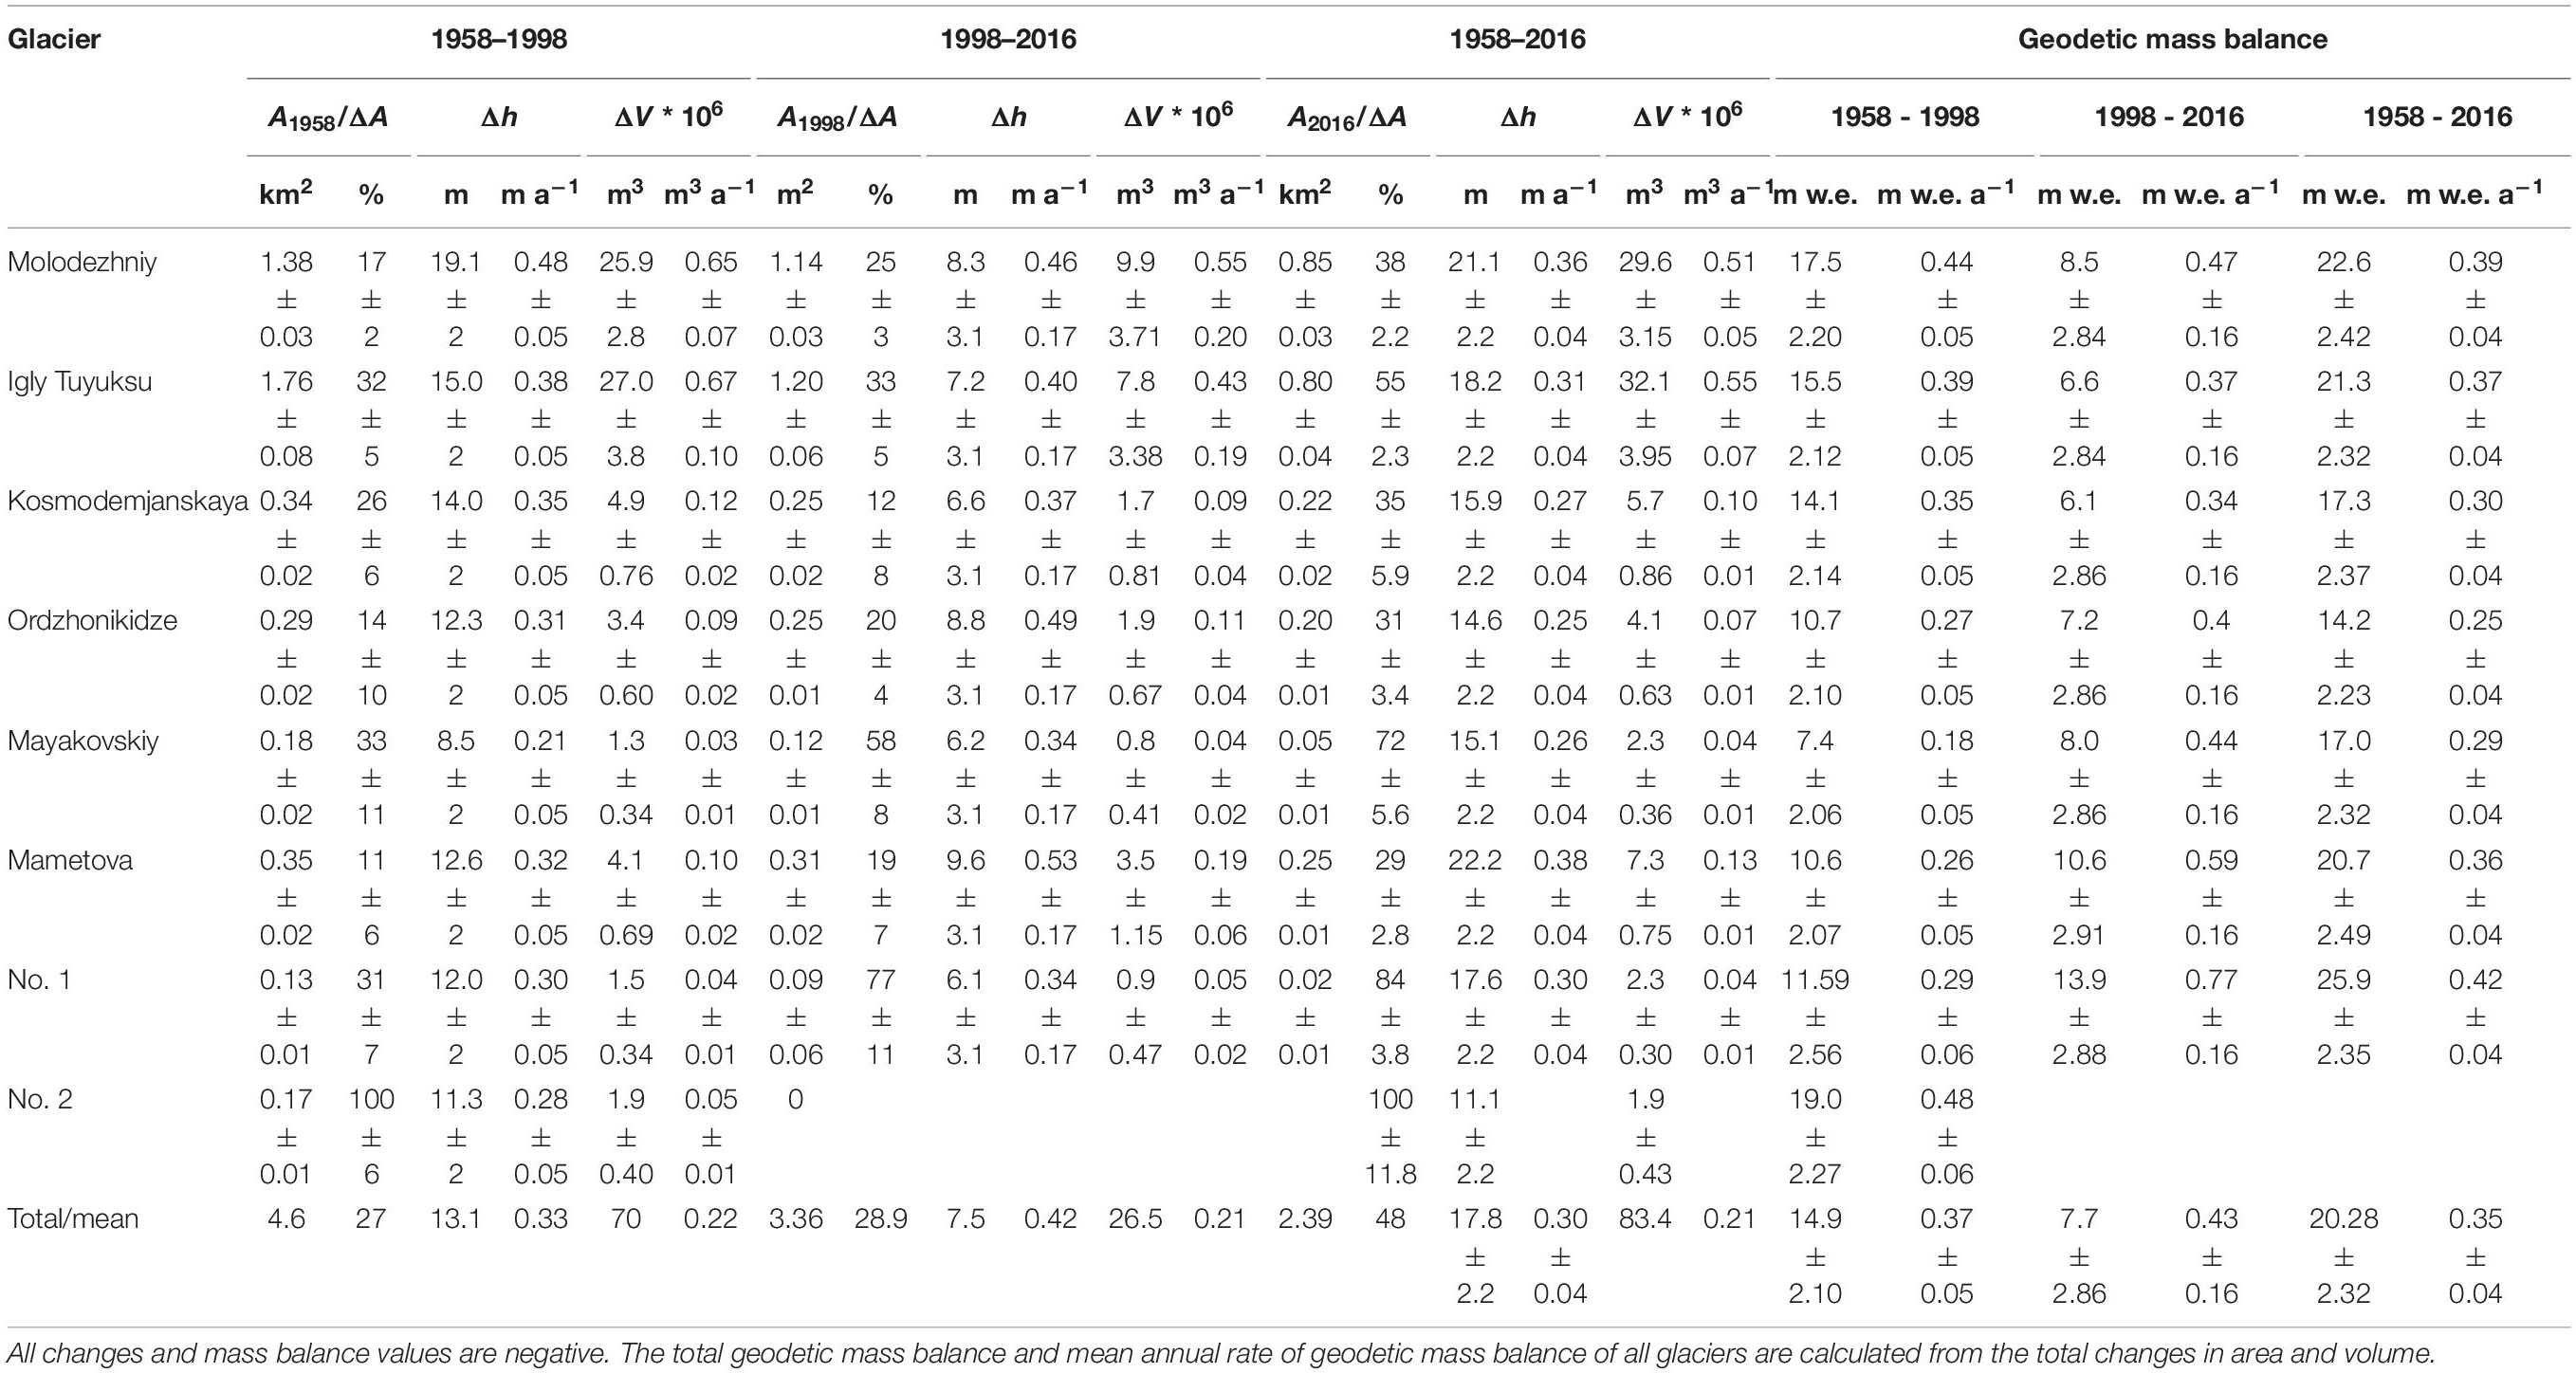
Table 4. Changes in area, surface elevation, volume, and geodetic mass balance of the glaciers of the Tuyuksu group.
The area-averaged specific geodetic mass balance was calculated using Eq. (2). The mean density of 850 ± 60 kg m–3 was used for volume-to-mass conversion for the calculation of geodetic mass balance according to the recommendations by Huss (2013) and the calculation of the geodetic mass balance of other glaciers in Tien Shan (Barandun et al., 2018).
where ΔV is change in volume (m3), is the mean of glacier area at the start and at the end of a time interval (m2), and ρ is density (kg m–3). To calculate the mass balance rate (m w.e.a–1), this value was divided by the number of years between the two DEMs in each pair.
The uncertainty in the calculation of glacier volume change included two terms: relative vertical error and uncertainty of glacier area measurement. The former was quantified using MAD (Table 2). The uncertainty in glacier area measurements was quantified using the buffer method, whereby an area of a buffer with a width of 5 m (map accuracy and half of the DEM pixel size), drawn around the glacier shapefile, was normalized by the glacier area.
The uncertainty in geodetic mass balance calculations included the vertical and the area uncertainty terms and the uncertainty due to density assumptions (Huss, 2013). The overall uncertainties in volume and mass balance were calculated according to the standard rule of error propagation as the square root of the sum of the squares of the individual uncertainty terms.
Glaciological Mass Balance
Glaciological mass balance has been measured at the Central Tuyuksu since 1957. Currently, a network of over 100 stakes is used. The maximum snow accumulation is measured at the end of the cold season (winter mass balance) and the mass decrease is measured from maximum snow accumulation until the end of the ablation season (summer mass balance). The sum of winter and summer mass balance is reported as annual mass balance. Snow density is measured on a regular basis at several snow pits located at different elevations.
Although the mass balance program has been run without interruptions, a reduced number of stakes and less frequent surveys took place in 1991–1993 and in 2002–2005. During these periods, the number of stakes declined from 140–150 used before 1991 to approximately 60 and increasing to 100–120 between these periods and after 2005. Importantly, despite a dense network of stakes, there is paucity of measurements in the accumulation zone of the glacier due to accessibility problems.
The uncertainty in glaciological mass balance measurements originates from (i) height determination, (ii) density measurement errors, (iii) presence of superimposed ice, (iv) changing location and density of stakes, (v) spatial averaging and interpolation, (vi) under-sampling in the inaccessible areas, and (vii) using a constant glacier area (Zemp et al., 2013). A large number of stakes, regular density measurements at different elevations, and annual area measurements minimize all sources of uncertainty except (iv) and (vi). Vilesov and Uvarov (2001) estimated that the absolute error of the glaciological method varied in different years between ±0.04 m w.e. and ±0.06 m w.e. in the region of direct measurements. This assessment included error sources (i)–(iii) but did not take into account the reduced number of stakes. To test the sensitivity of glaciological mass balance to a changing number of stakes, we re-calculated the annual mass balance for the whole glacier in the period 2007–2016 using those stakes which were retained in 1991–1993 and in 2002–2005. The root mean square error for annual mass balance was ±0.02 m w.e. This value represents 5% of the mean annual mass balance averaged over the whole record of glaciological measurements (−0.40 m w.e.a−1). The impact of under-sampling in the accumulation zone is more difficult to evaluate. Currently, the mass balance above 3,800 m a.s.l. is calculated using regression equations based on 20 years of direct measurements which link mass balance in the 100-m elevation bands to mass balance measured in the 3,700–3,800-m band (Makarevich, 2007).
Results
Changes in Surface Elevation, Volume, and Mass Balance of the Central Tuyuksu
The changes in elevation of the Central Tuyuksu glacier surface are presented in Figures 3, 4 and the mean statistics are summarized in Table 3. Between 1958 and 2016, the glacier surface lowered on average by 23.2 ± 2.2 m. The altitudinal distribution of elevation changes confirms the expected pattern with glacier downwasting in the ablation zone and thickening in the accumulation zone. In the glacier terminus area, downwasting exceeded 60 m. On average, the annual rates of area loss increased slightly in 1998–2016 in comparison with those in 1958–1998 (Table 3). The mean rate of glacier surface lowering decreased, but the change in the annual rates was close to the uncertainty of measurements. The altitudinal distribution of changes in the elevation of glacier surface shows that high rates of glacier downwasting (reaching 2–2.5 m a–1) affected a much larger area of the glacier in the period 1998–2016, extending to 3,600–3,700 m a.s.l. (Figures 3, 4). At the same time, glacier thickening increased in the accumulation zone in the period 1998–2016 (Figures 3–5). Overall, (67.7 ± 6.7) × 106 m3 of ice was lost from the Central Tuyuksu between 1958 and 2016, giving a negative geodetic mass balance of −21.8 ± 2.6 m w.e. The differences between the annual mass balance rates in 1958–1998 and in 1998–2016 were within the accuracy of the measurements (Table 3).
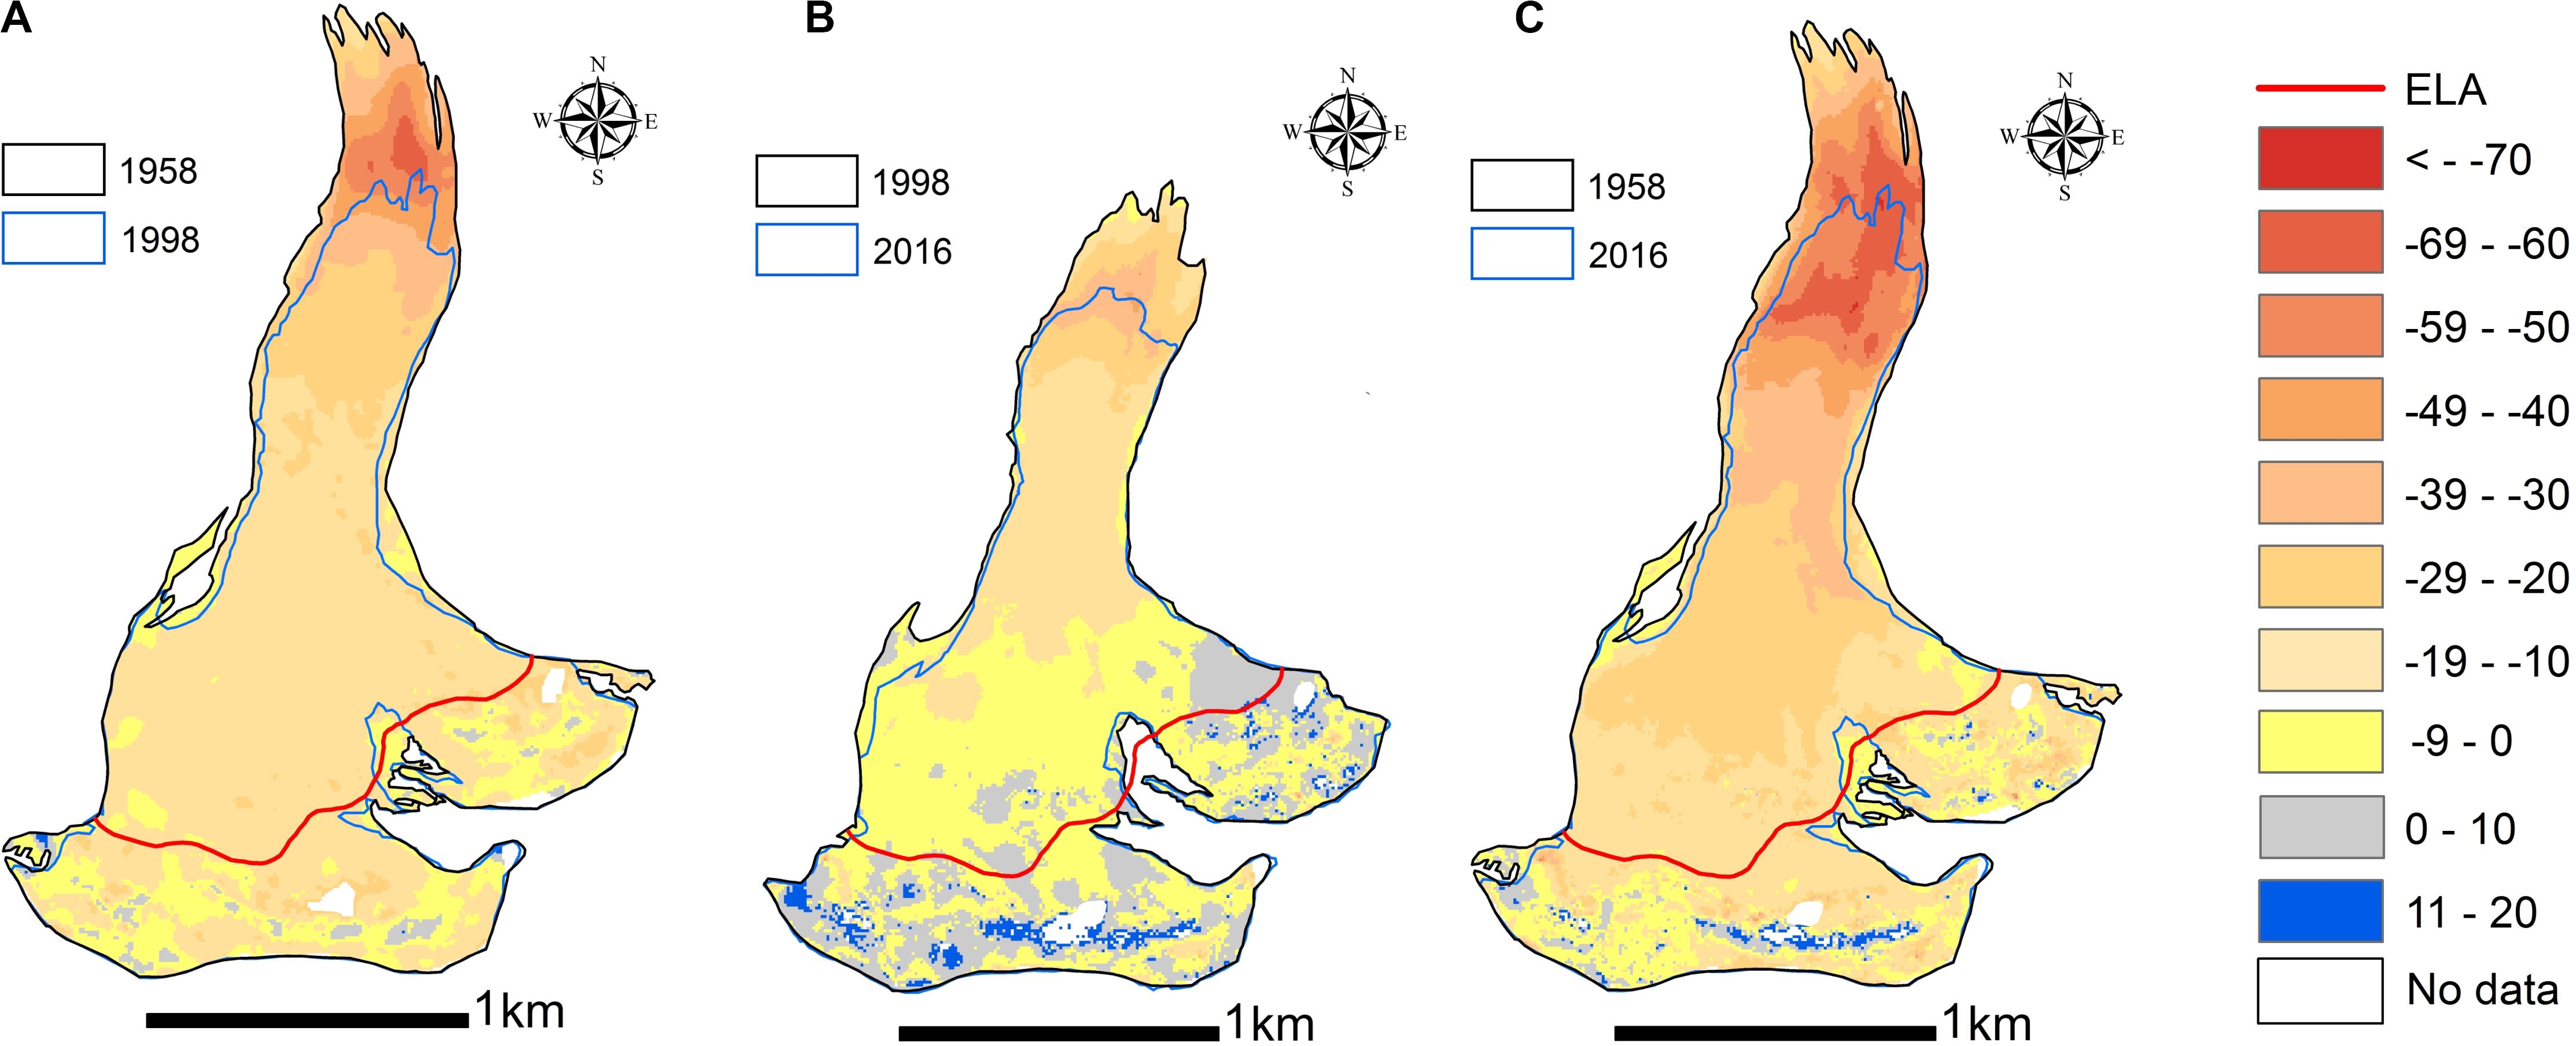
Figure 3. Changes in surface elevation of the Central Tuyuksu glacier (m): (A) 1958–1998; (B) 1998–2016; (C) 1958–2016. The solid line shows the glacier area at the beginning and at the end of each assessment period.
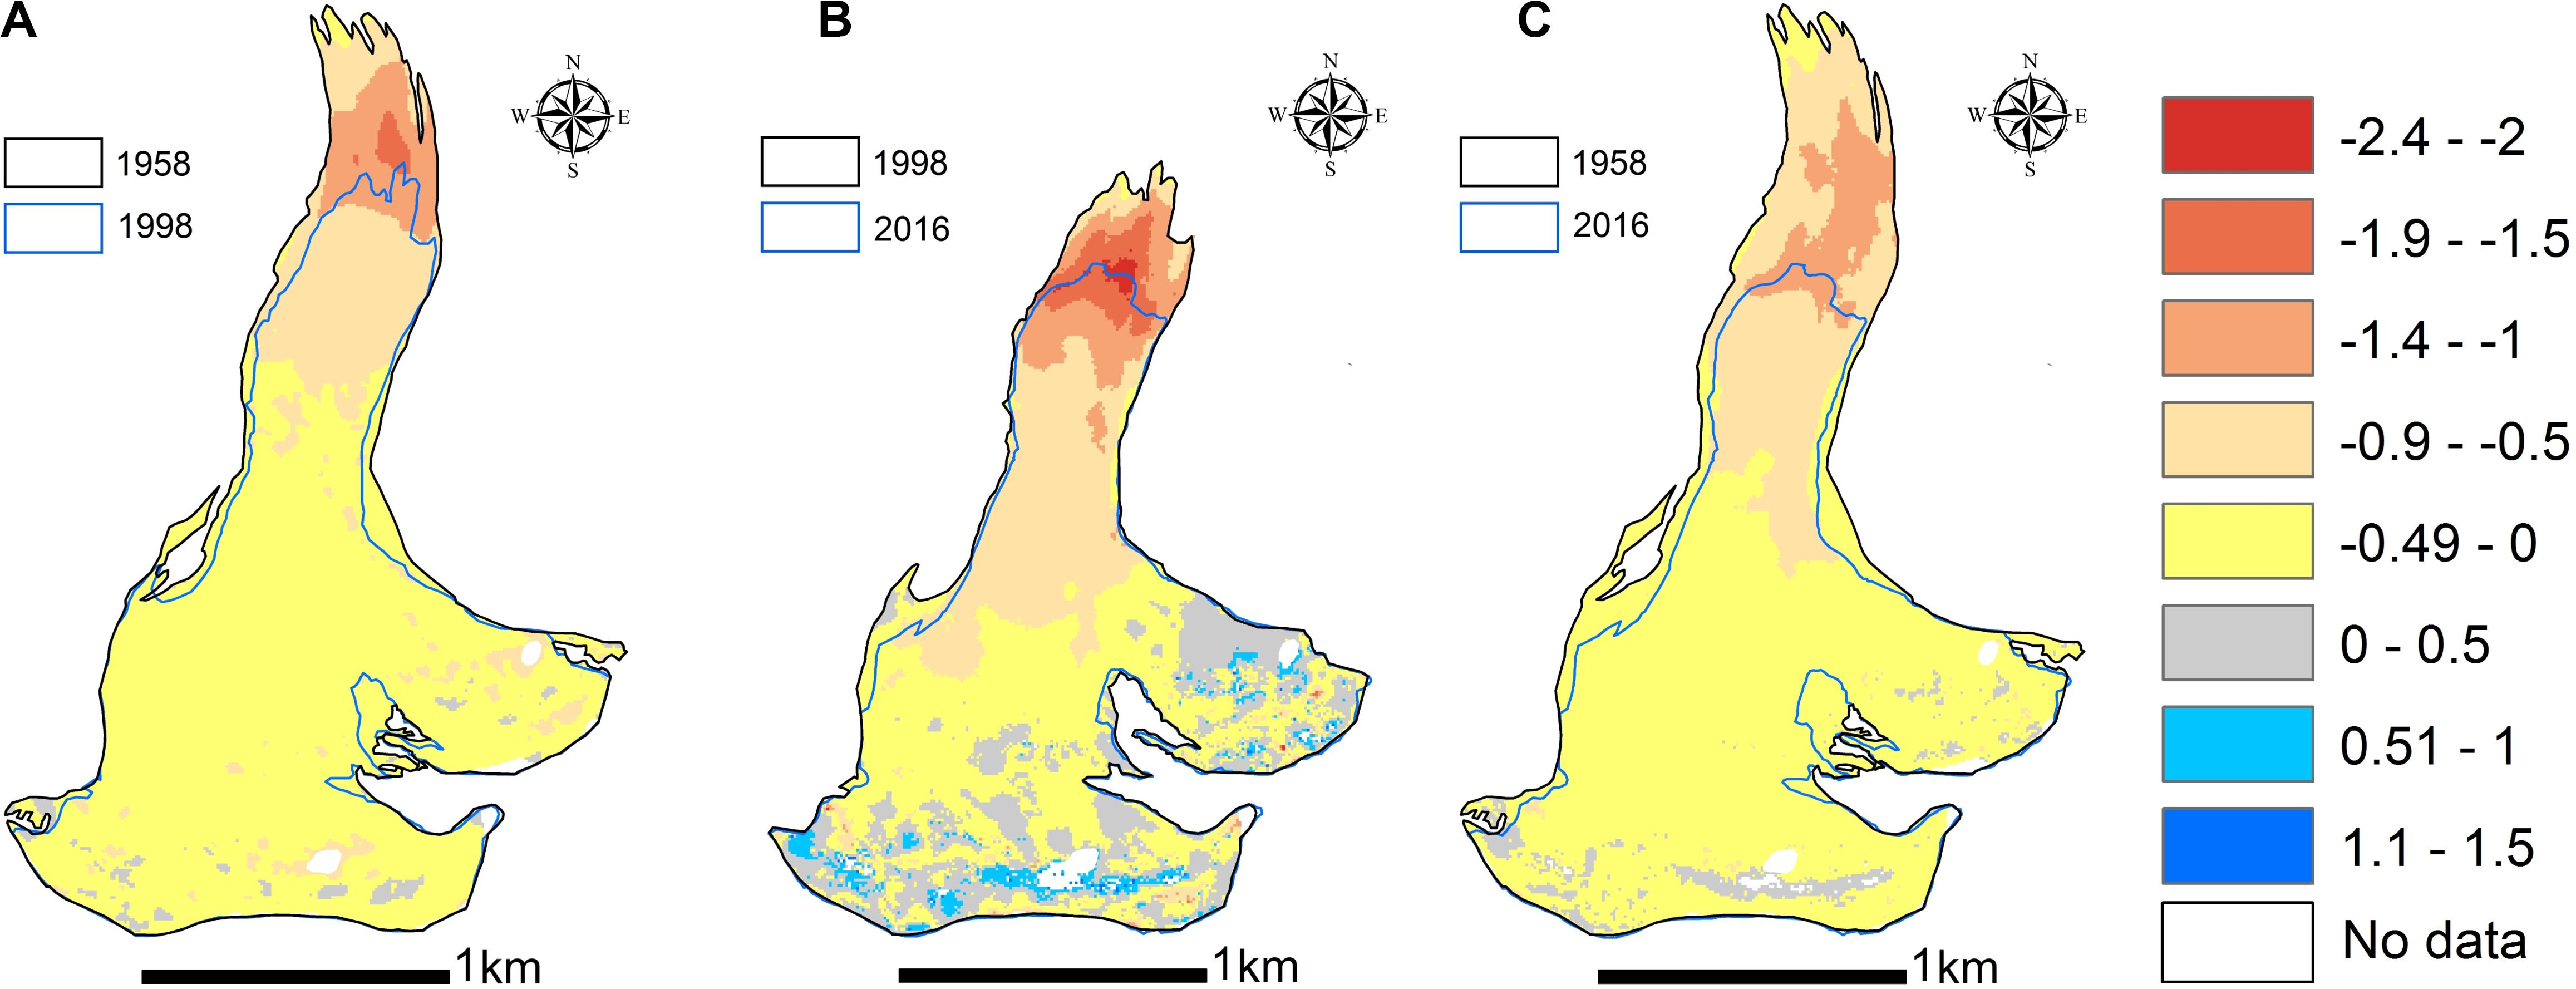
Figure 4. Annual rates of change in the surface elevation of the Central Tuyuksu glacier (m a−1): (A) 1958–1998; (B) 1998–2016; (C) 1958–2016. The solid line shows the glacier area at the beginning and at the end of each assessment period.
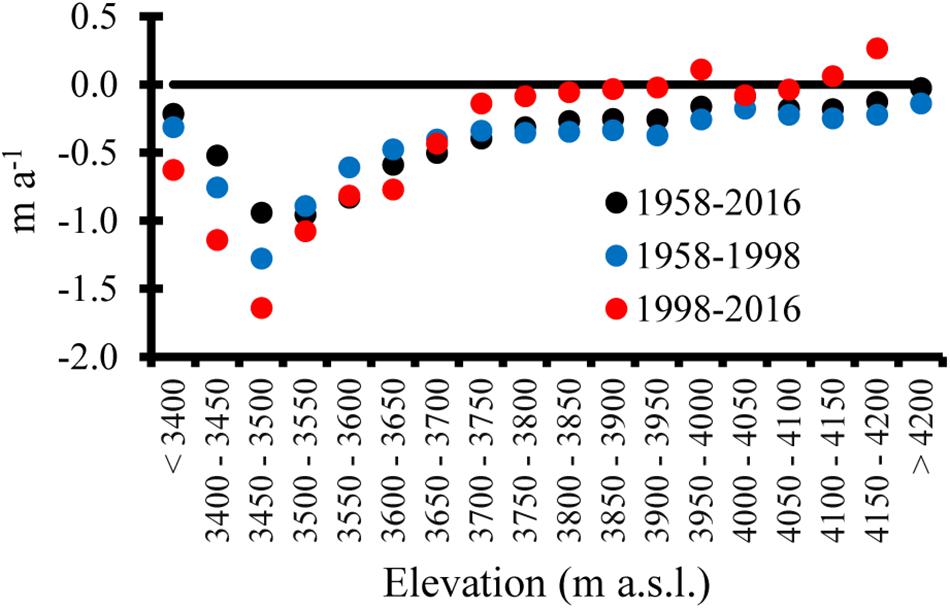
Figure 5. Annual rates of glacier surface elevation change (m a–1) for the Central Tuyuksu as a function of elevation in three assessment periods.
Changes in Surface Elevation, Volume, and Geodetic Mass Balance of the Glaciers of the Tuyuksu Group
The trends in loss of area and surface lowering of the other glaciers of the Tuyuksu group were similar to those of the Central Tuyuksu (Figures 6, 7 and Table 4). As these glaciers are smaller than the Central Tuyuksu, the mean area loss was higher, averaging 48% between 1958 and 2016 (Glacier No. 2 melted completely) against 23.4% lost by the Central Tuyuksu. The mean lowering of glacier surface was 17.8 ± 2.2 m against 23.2 ± 2.2 m (Tables 3, 4). Similarly to the Central Tuyuksu, the annual rates of surface lowering increased at lower elevations in the second assessment period (Figure 7). Glacier thickening was observed in the accumulation zone in the second assessment period, while it was close to zero in the first assessment period.
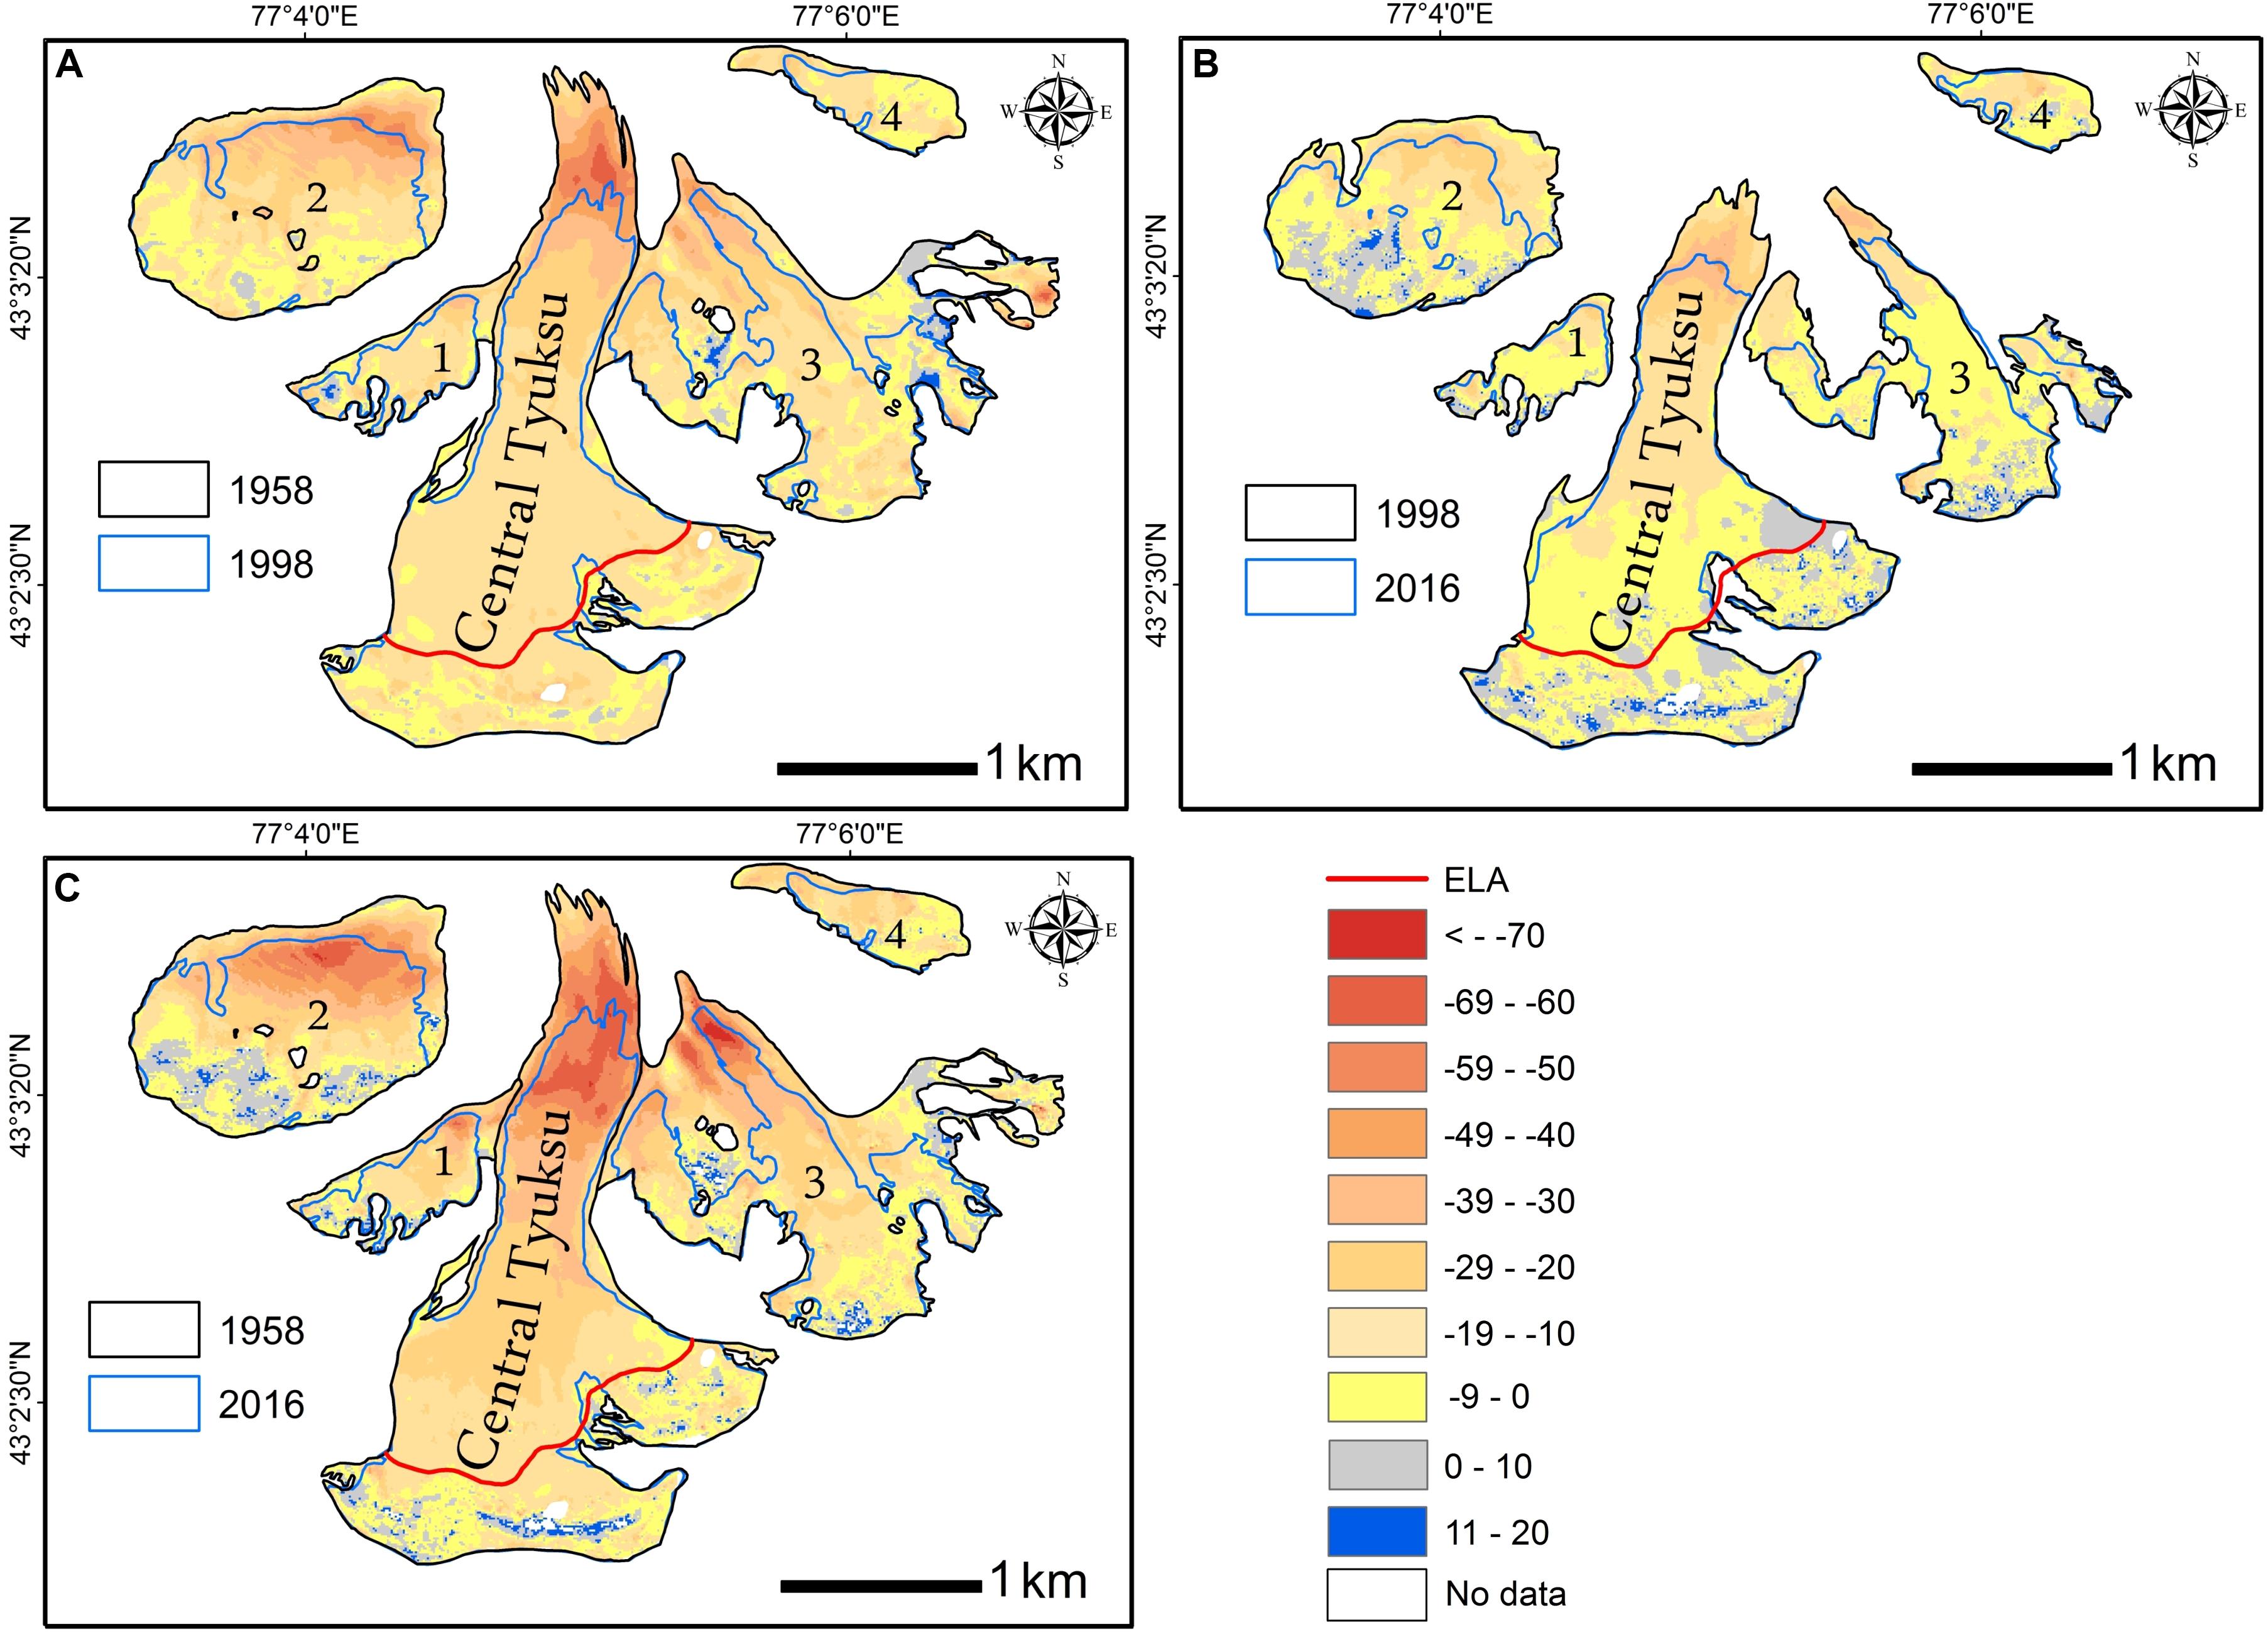
Figure 6. Changes in the surface elevation of glaciers of the Tuyuksu group (m): (A) 1958–1998; (B) 1998–2016; (C) 1958–2016. (1) Kosmodemjanskaya; (2) Molodezhniy; (3) Igly Tuyuksu; and (4) Ordzhonikidze.
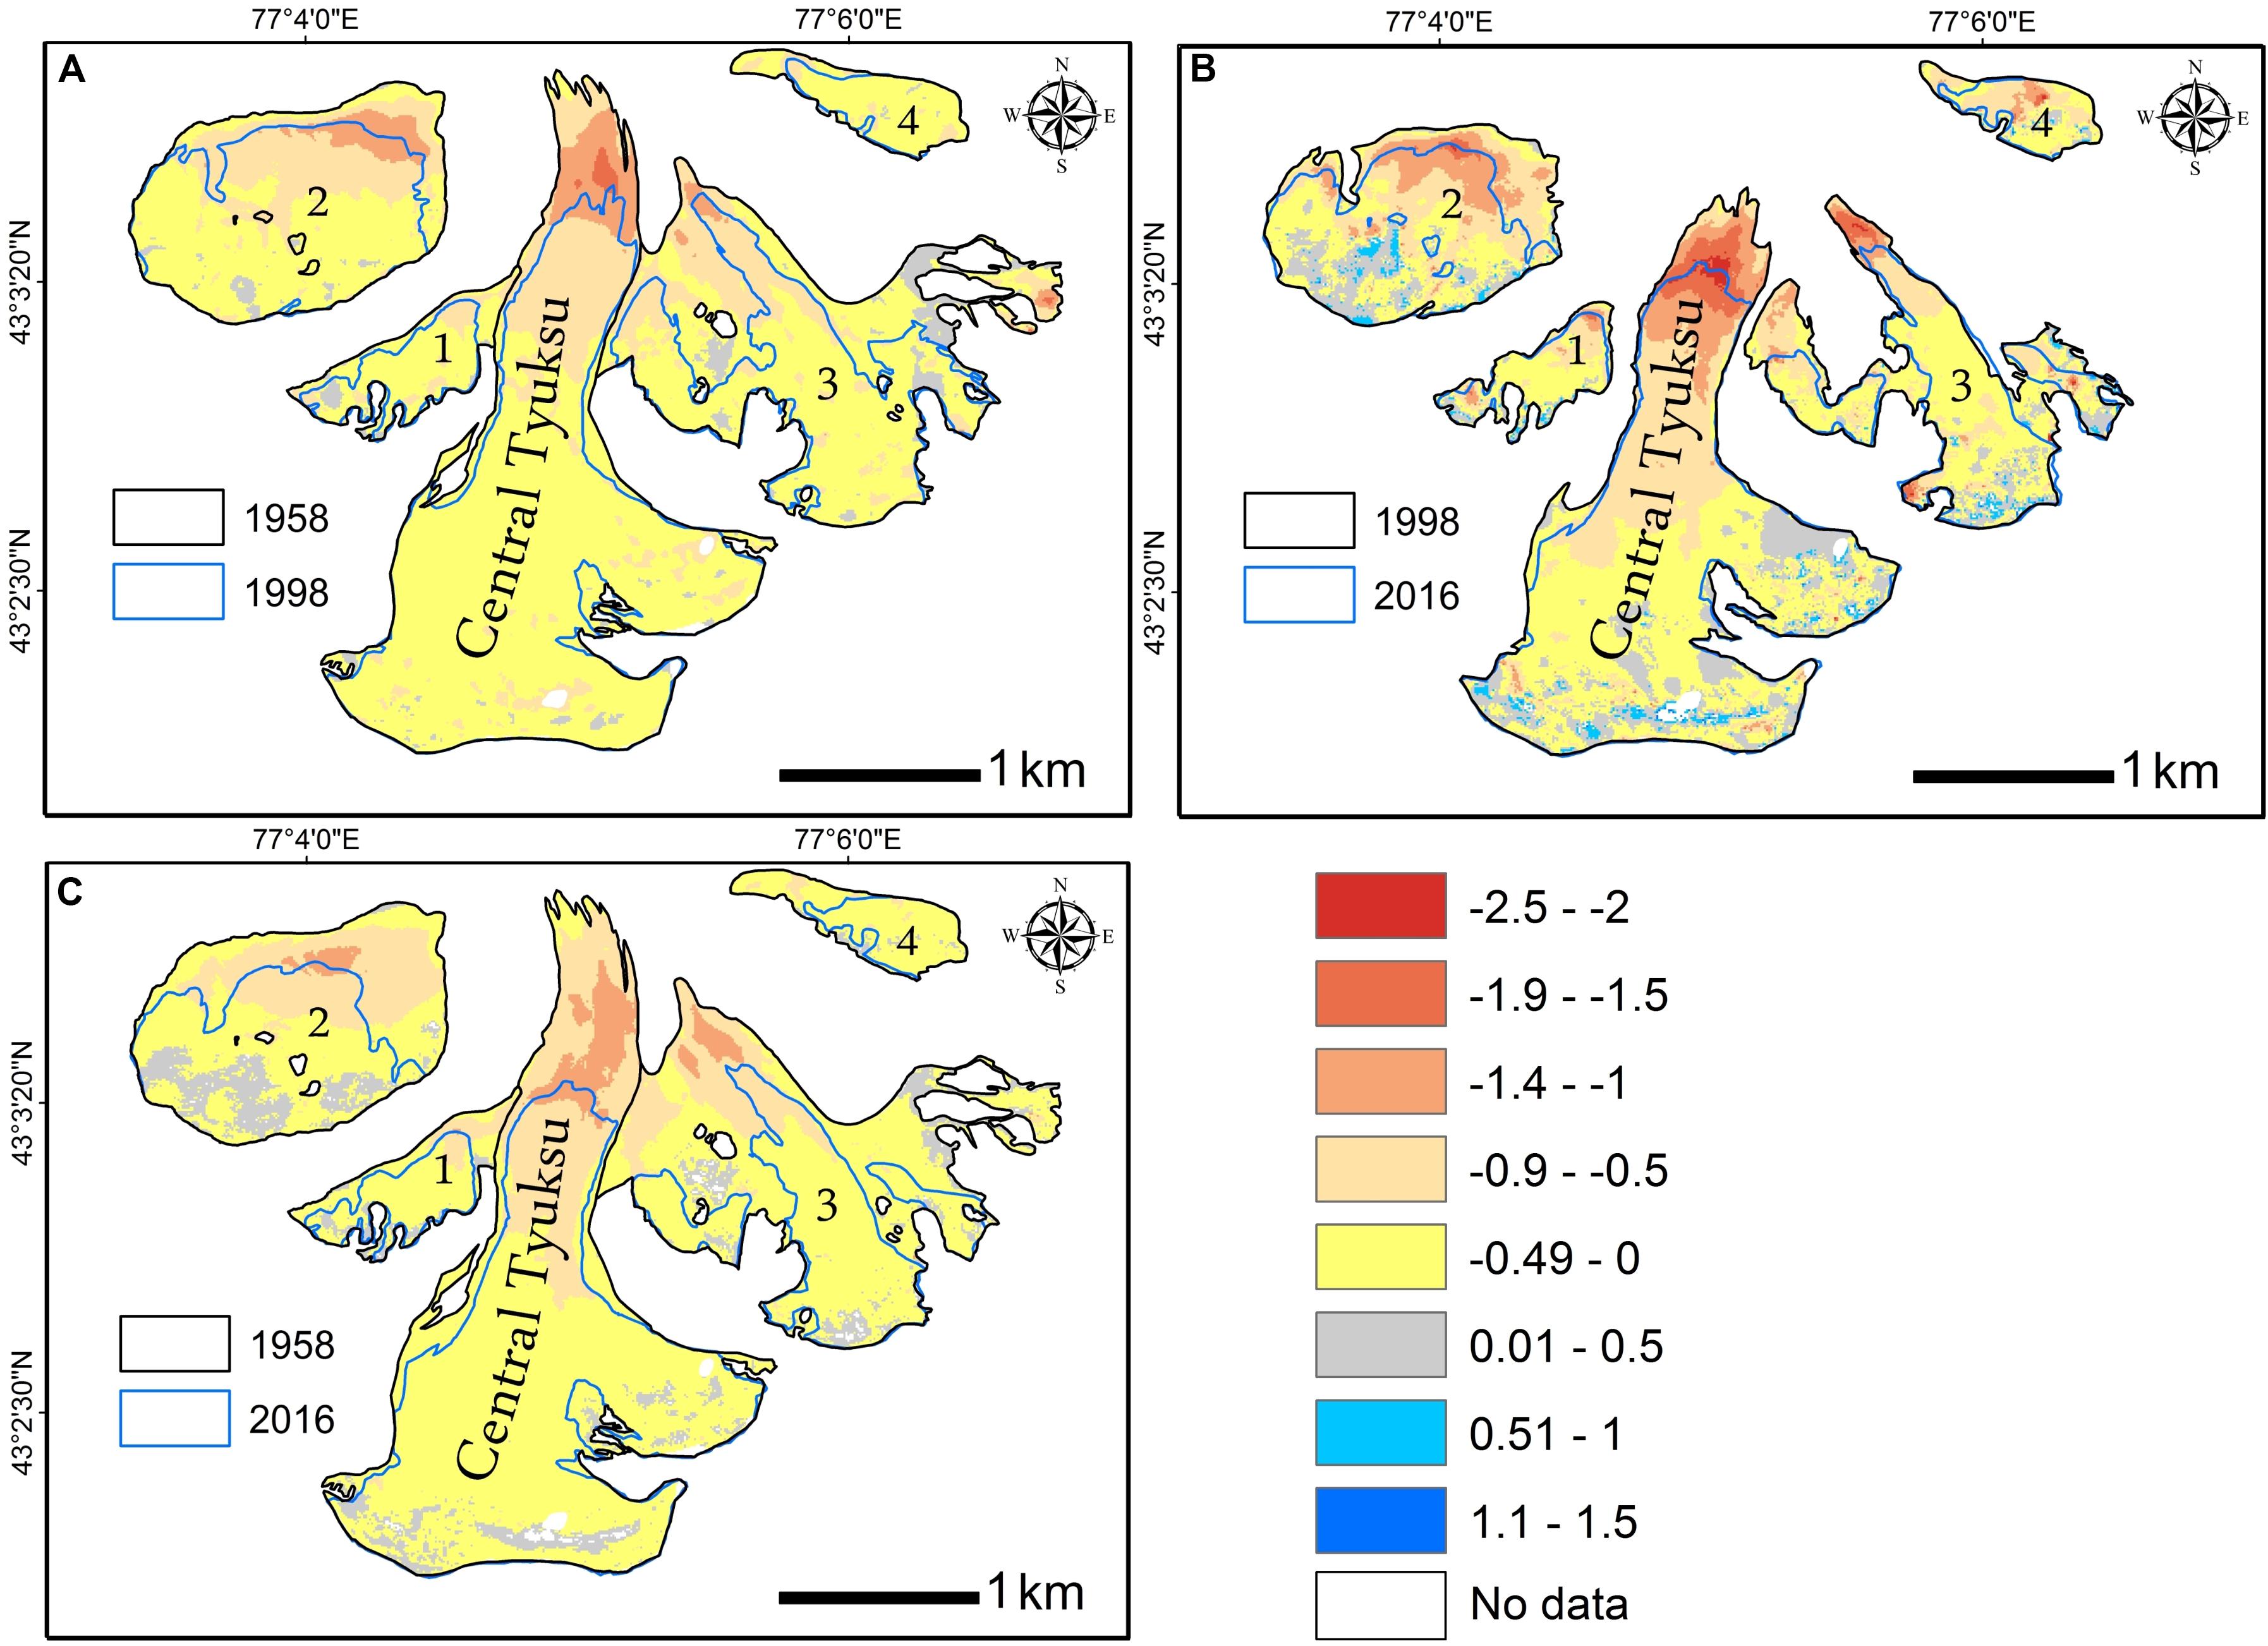
Figure 7. Annual rates of change in the surface elevation of glaciers of the Tuyuksu group (m a−1): (A) 1958–1998; (B) 1998–2016; (C) 1958–2016. The numbers are the same as in Figure 6.
The uncertainty of measurements was higher at three glaciers—Molodezhniy, Kosmodemjanskaya, and Ordzhonikidze—in comparison with the Central Tuyuksu. While at the Central Tuyuksu the changes observed during the period 1958–2016 were very close to the sum of changes measured in 1958–1998 and in 1998–2016, at these three glaciers, there were discrepancies between the changes in surface elevation and volume as measured using the 1958 and 2016 pair of DEMs and a sum of changes in the two assessment periods (Table 4). At the other glaciers (Igly Tuyuksu, Mayakovskiy, Mametova, and Glacier No. 1), the changes measured in 1958–2016 were in good agreement with the combined changes in 1958–1998 and in 1998–2016. The quality of the DEMs is the most likely explanation for the observed discrepancies as most GCP were located in proximity to the Central Tuyuksu, which was the primary focus of this study. Both Molodezhniy and Ordzhonikidze are hanging glaciers positioned on steep slopes, where errors in DEM are higher (Pieczonka et al., 2011).
Comparison Between Geodetic and Glaciological Mass Balance of the Central Tuyuksu
The differences between the geodetic mass balance for the periods 1958–1998 and 1958–2016 and the cumulative glaciological mass balance are compared in Table 3 and Figure 8. The two methods were in good agreement in both assessment periods. Overall, the geodetic mass balance was less negative than the glaciological mass balance, but the observed differences were within the uncertainty of measurements. Hagg et al. (2004) and Zemp et al. (2013) provided a comparison of geodetic and glaciological measurements at the glaciers with the well-established mass balance monitoring program, showing that the differences in annual mass balance values were within the 0.01–0.4 m w.e. a–1 range. In the case of the Central Tuyuksu, the annual values of geodetic mass balance were −0.39 ± 0.05 and −0.35 ± 0.18 m w.e.a−1 in the two assessment periods versus the glaciological mass balance of −0.40 m w.e.a–1 in both periods, which is within the range of differences obtained in other studies.
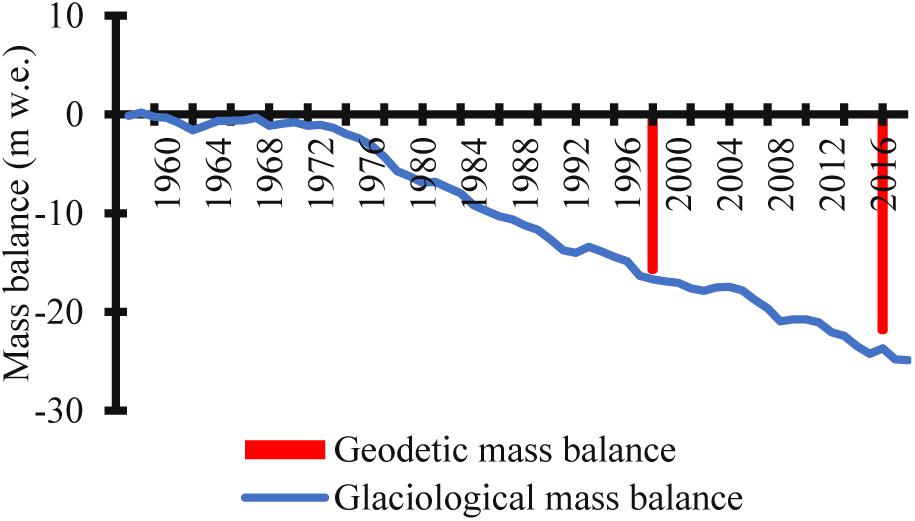
Figure 8. Cumulative glaciological and geodetic mass balances of the Central Tuyuksu glacier.
Hagg et al. (2004) used the same geodetic surveys of 1958 and 1998 to develop DEMs with a resolution of 20 m and to derive the geodetic mass balance of the Central Tuyuksu. Their value of −12.6 m w.e. showed a 33% difference with the cumulative mass balance, which was attributed to the uncertainties of the glaciological method. In our study, the geodetic mass balance of the Central Tuyuksu was calculated as −15.7 ± 2.1 m w.e. Our comparison showed 5 and 14% difference between the two methods in the 1958–1998 and the 1998–2016 assessment periods, respectively, and 8% difference overall. We attribute this improvement to the co-registration of DEMs with a network of GCP established by DGPS surveys and the subsequent correction of DEMs (Table 2). These facilities were not available previously, and Hagg et al. (2004) assumed no off-ice difference between the 1958 and the 1998 DEMs, in contrast to this study (Table 2). We note a slightly higher discrepancy between the glaciological and the geodetic mass balances in the period 1998–2016, which may be due to the lack of direct measurements in the accumulation zone and thus not capturing an increase in accumulation (Figures 3, 4).
Discussion
The record of the Central Tuyuksu glaciological mass balance is the longest continuous record in Central Asia, providing valuable data for the assessment of the impacts of climate change on glaciers and water resources in the region, which depends on glacier melt for water provision more than any other part of the world (Kaser et al., 2010; Pritchard, 2019). However, as with any long-term observations, the record of the glaciological mass balance from the Central Tuyuksu requires verification, and the best way to achieve it is through the estimation of the geodetic mass balance at regular intervals (Cogley, 2009; Hoelzle et al., 2017). The estimation of geodetic mass balance relies on the availability of high-resolution DEM. Currently, various DEMs are available, e.g., the widely used SPOT and ALOS, a more recent High Mountain Asia 8-m DEM derived from cross-track and along-track optical imagery (Shean, 2017), and Pléiades stereo imagery (Berthier et al., 2014), available through the WGMS Pléiades Glacier Observatory. For the Central Tuyuksu, two geodetic surveys, conducted in 1958 and in 1998, provided two historical DEMs which, together with the DEM derived from the 2016 Pléiades stereo imagery, enabled the calculation of geodetic mass balance for three time intervals.
The co-registration of all three DEMs with a network of GCP showed the absence of planimetric shifts and helped to reduce vertical bias. Following co-registration and bias correction, the MAD values, which were used to quantify vertical shifts between two DEMs in each pair, were reduced to ±2–3 m on ice-free, stable, exposed terrain with slope less than 30° (Table 3). Few outliers were registered in the ablation zones of the Central Tuyuksu and the other glaciers in all three DEMs. The Pléiades DEM had data voids and unrealistic values of elevation change in the 1998–2016 and the 1958–2016 time periods in the accumulation zones of the Central Tuyuksu and the other glaciers in the areas with steep slope and shading. However, the number of affected pixels was small (Figures 3, 4, 6, 7). Overall, all three DEMs showed good performance over the Central Tuyuksu, whereby the sum of changes registered in the periods 1958–1998 (two historic DEMs from photogrammetric surveys) and 1998–2016 (DEMs from 1998 photogrammetric survey and Pléiades) amounted to changes in the period 1958–2016 using DEMs from the 1958 photogrammetric survey and Pléiades (Table 3).
At three out of the other seven glaciers of the Tuyuksu group (Molodezhniy, Kosmodemjanskaya, and Ordzhonikidze), larger errors were observed (Table 4). There is a discrepancy between the mass balance values calculated for the period 1958–2016 and the two sub-periods, whereby the mass balance of all seven glaciers, calculated from 1958 and 2016 DEMs, is −20.28 ± 2.32 m w.e. and the sum of the mass balances calculated for the two sub-periods is −22.6 ± 2.50 m w.e. (Table 4). The difference is within the uncertainty margin, and we attribute it to deficiencies in co-registration due to the very steep slopes characterizing these glaciers. We will aim to resolve this problem by establishing a more even distribution of GCP, most of which are currently located in proximity to the Central Tuyuksu because it was the focus of this study.
The derived negative values of geodetic mass balance indicated a strong downwasting of all the glaciers of the Tuyuksu group (Figures 6, 7), confirming the results of the in situ measurements (Figure 8). While the mean rates of glacier surface lowering, volume loss, and annual rates of geodetic mass balance changed a little from the first to the second assessment period at the Central Tuyuksu, their altitudinal distribution and mass balance gradients did. The period 1998–2016 was characterized by stronger downwasting in the ablation zone and also by a likely increase in accumulation (Figures 4, 5), potentially indicating that mass turnover and water cycle intensified at the Central Tuyuksu in the 21st century. Similarly, for two other larger glaciers, Molodezhniy and Igly Tuyuksu, the rate of geodetic mass balance did not change, but for the smaller glaciers, whose elevations do not exceed 4,000 m a.s.l., therefore limiting accumulation (e.g., Mametova, Glacier No. 1), the annual rates of geodetic mass balance doubled in 1998–2016 due to a rapid loss of glacier area (Figure 7 and Table 4).
The registered increase in accumulation can be a result of the observed decadal variability in precipitation or a result of using DEM for 2016 when high annual precipitation was observed in Ile Alatau (Figure 9A). While seasonal snow had melted by late August of 2016 when the Pléiades imagery was obtained and did not contribute to the uncertainty of the DEM (Figure 2), the annual glaciological mass balance in 2015–2016 (0.56 m w.e.) was the second highest positive mass balance on record after 1992–1993 as a result of high accumulation (Figure 10A).
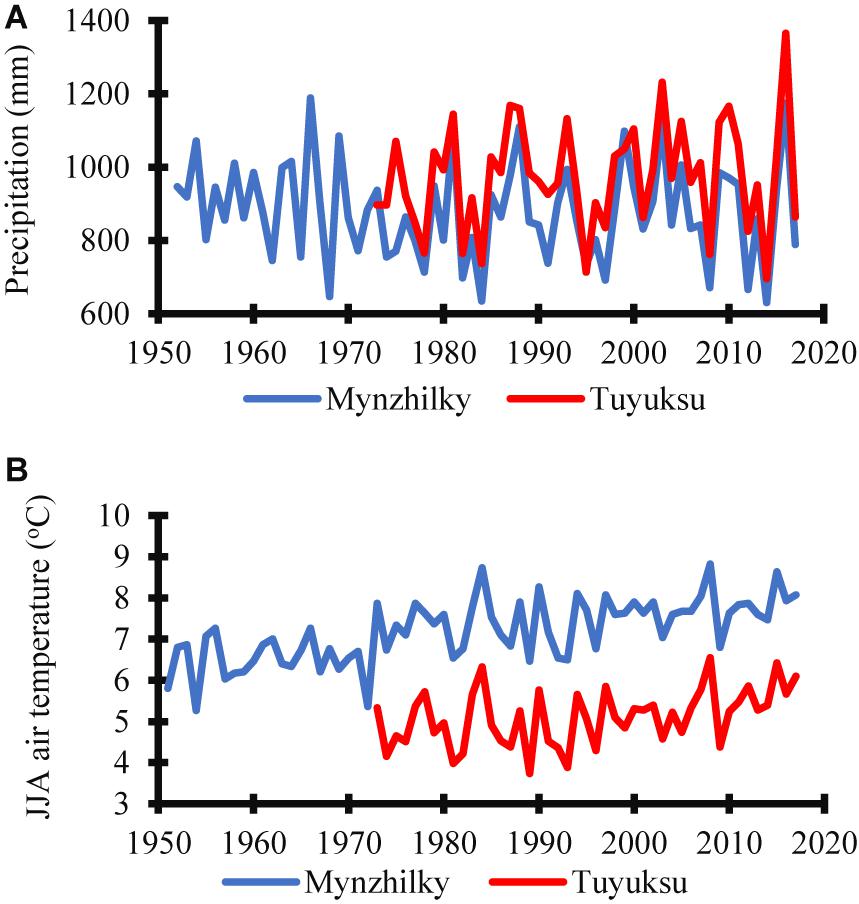
Figure 9. (A) Annual precipitation calculated for mass balance year (October–September) and (B) June–July–August temperature at the Mynzhilky (3,100 m a.s.l.) and Tuyuksu (3,438 m a.s.l.) stations.
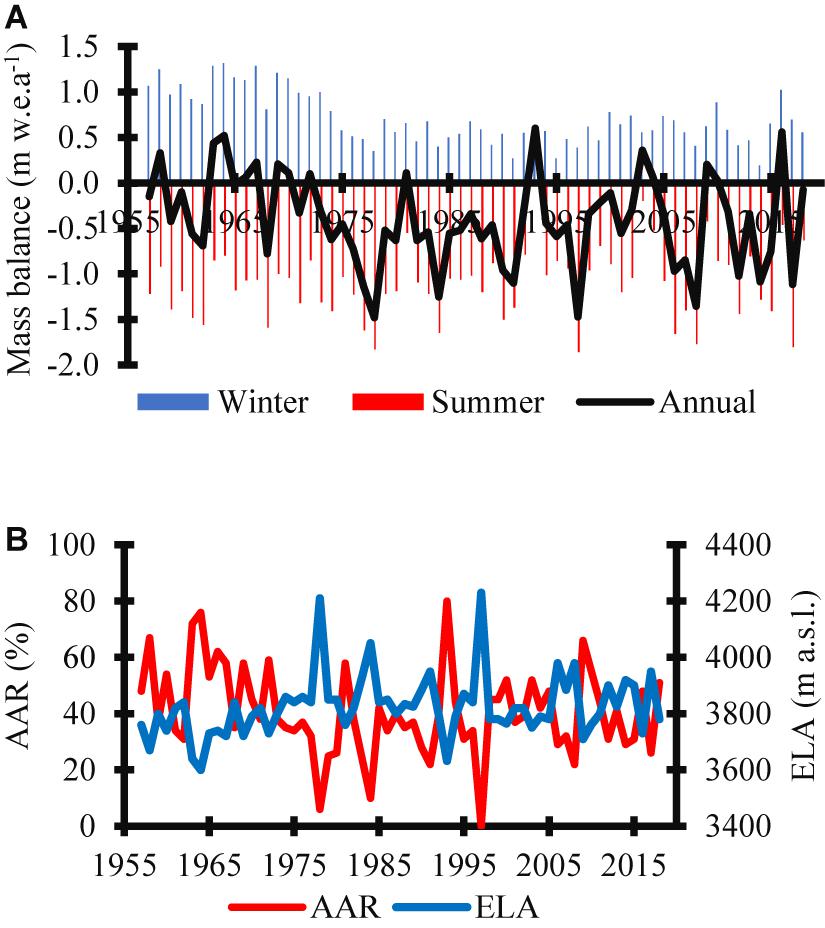
Figure 10. Time series of the (A) components of glaciological mass balance and (B) equilibrium line altitude and accumulation–area ratio for the Central Tuyuksu glacier.
The time stamp of DEM used for the calculation of geodetic mass balance is key to the interpretation of a derived elevation change (Marzeion et al., 2017). In this study, multi-decadal time periods were used, which helped to reduce the influence of the short-term climatic anomalies and reflect low-frequency climatic fluctuations. While no long-term linear trends have been detected in seasonal or in annual precipitation in northern Tien Shan (Unger-Shayesteh et al., 2013; Shahgedanova et al., 2018), a negative anomaly in regional precipitation, which was observed in the 1970–1990s (Severskiy et al., 2016; Shahgedanova et al., 2018), affected the glacier mass balance across Tien Shan (Farinotti et al., 2015). Dyurgerov (2010) assessed the mass balance for the entire Tien Shan and found that the strongest negative mass balance was observed in the 1970s (−0.61 m w.e. a–1 in 1974–1980) and in the mid-1990s (−0.65 m w.e. a–1 in 1994–1997).
A step change in precipitation in the early 1970s (Cao, 1998) was evident from the observations at the Mynzhilky meteorological station located in Kishi Almaty valley at 3,010 m a.s.l. (Figure 9A). Annual precipitation declined from an annual mean of 920 mm in 1958–1970 to 845 mm in 1971–1998 and increased to 892 mm in 1998–2016. This variability in precipitation has been accompanied by an increase in summer temperature at a rate of 0.03°C a–1, with a linear trend explaining 42% in temperature variance between 1957 and 2016 (Figure 9B). While in 1958–1970 the mean ELA and AAR values were 3,742 m a.s.l. and 52%, respectively, during the period 1971–1998, these values were 3,860 m a.s.l. and 35%, reverting to 3,825 m a.s.l. and 41% in 1998–2016 (Figure 10B), which is equal to the all-record means (section “Study Area”). In the latter period, the mass balance was positive in five mass balance years at the Central Tuyuksu (Figure 10A). This includes the 2015–2016 year when the mass balance was positive both at the Central Tuyuksu and at the Abramov and Golubin glaciers in central Tien Shan (Barandun et al., 2018). Therefore, while the impact of the positive precipitation anomaly of 2016 cannot be excluded, the observed increase in precipitation in the 21st century in comparison with the late 20th century may account for the detected increase in accumulation at higher altitudes (Figures 3, 4, 6, 7). The variability in annual precipitation (Figure 9A) explains 55% of the total variance in annual mass balance of the Central Tuyuksu, while the variability in air temperature (Figure 9B) explains 35%.
The values of geodetic glacier mass balance obtained in this study were in agreement with those obtained for the neighboring regions of Tien Shan. Thus, Barandun et al. (2018) reported annual values of geodetic mass balance, derived from the Pléiades and SPOT imagery, for the Golubina, Abramov, and No. 354 glaciers as ranging between −0.30 and −0.42 m w.e. a–1 over the period 2003–2015. Brun et al. (2017) reported annual mass balance values of −0.20 ± 0.08 and −0.40 ± 0.20 m w.e. a–1, as derived from ASTER DEM, for western and eastern Tien Shan, respectively, for the period 2000–2016. Bolch (2015) reported a geodetic mass balance of −0.42 ± 0.66 m w.e. a−1 derived from multiple imagery, ASTER, and SRTM DEM for the glaciers of the Ala-Archa basin in central Tien Shan. These assessments, except perhaps the less negative mass balance derived by Brun et al. (2017) for western Tien Shan, are close to the rates of change reported for the Central Tuyuksu (−0.35 ± 0.18 m w.e. a−1) and for the rest of the Tuyuksu group (−0.43 ± 0.16 m w.e. a−1) for 1998–2016, except the very small glaciers positioned at lower elevation (e.g., Mametova and Glacier No. 1) and whose annual geodetic mass balance was more negative at −0.59 ± 0.16 and −0.77 ± 0.16 m w.e.a−1 (Table 4).
Importantly, the estimations of geodetic mass balance derived from the stereo Hexagon KH9 imagery for the longer assessment periods are also in broad agreement with the geodetic mass balance derived for the Tuyuksu group. Bolch (2015) reported a geodetic mass balance of −0.45 ± 0.27 m w.e. a–1 for the Ala-Archa region in 1964–2010. Pieczonka and Bolch (2015) reported an annual mass loss ranging between −0.70 ± 0.24 and −0.36 ± 0.28 m w.e. a–1 for northeastern Tien Shan for 1973–1998. Given the uncertainty ranges, these rates overlap with those derived for the Tuyuksu group where the glaciers were losing mass at a rate of −0.29 ± 0.04 and −0.45 ± 0.04 m w.e. a–1 between 1958 and 2016 (Tables 3, 4). The central values of mass balance estimates (i.e., −0.68 ± 0.40 and −0.70 ± 0.24 m w.e.a−1) reported by Pieczonka and Bolch (2015) for eastern Terskey-Alatoo, the region closest to the Tuyuksu group, were more negative than the values derived for the Tuyuksu group possibly because Pieczonka and Bolch (2015) focused on the period with the strongest negative anomalies in precipitation (Figure 9A), resulting in a strongly negative mass balance across Tien Shan (Dyurgerov, 2010).
Conclusion
The geodetic mass balance of the glaciers of the Tuyuksu group was calculated for two time steps using two historical DEMs and a high-resolution DEM derived from Pléiades stereo imagery. The results confirmed a continuing mass loss at the Central Tuyuksu, where the long-term glaciological mass balance data were available, and at other the glaciers of the group where there were no direct mass balance measurements. Overall, there was a good agreement between the glaciological and the geodetic mass balance values, and the difference between the two methods was within the uncertainty margin for the Central Tuyuksu. The geodetic mass balance values of −0.35 ± 0.18 and −0.43 ± 0.16 m w.e.a−1 measured at the Central Tuyuksu and the other glaciers of the group in 1998–2016, respectively, were in agreement with those of other studies conducted in Tien Shan. An increase in accumulation in 1998–2016 in comparison with that in 1958-1998 was registered in the accumulation zone of the Central Tuyuksu, where the direct stake measurements are limited and attributed to an increase in precipitation observed in the 21st century in comparison with the last three decades of the 20th century. As a result of increasing accumulation, the mean annual geodetic mass balance rates of the Central Tuyuksu and the other glaciers extending over 4,000 m a.s.l. did not change between 1958–1998 and 1998–2016, but they became more negative at the smaller glaciers with a smaller elevation span. Following this application of the Pléiades DEM, subsequent Pléiades imagery and other high-resolution DEMs will be used in the future at regular intervals to assess the regional mass balance and, potentially, the trends in precipitation using glaciers as high-elevation gauges.
Data Availability Statement
The datasets generated for this study are available on request to the corresponding author.
Author Contributions
VK led the data collection and analysis, assisted by NK and ZU. MS and IS designed the study. MS contributed to the data collection and analysis and produced the initial draft of the manuscript. KW assisted with the production of the digital elevation models and data analysis. All the authors contributed to the discussion of the results and the final draft of the manuscript.
Funding
This work was funded by the UK–Kazakhstan Newton–al Farabi Fund (Grant No. 172722855, “Climate Change, Water Resources and Food Security in Kazakhstan”), the UK Global Challenges Research Fund (GCRF) research network Grant, the Central Asia Research and Adaptation Water Network (CARAWAN), and the Ministry of Science and Education of the Republic of Kazakhstan (Grant No. AP05133077).
Conflict of Interest
The authors declare that the research was conducted in the absence of any commercial or financial relationships that could be construed as a potential conflict of interest.
Acknowledgments
The Pléiades stereo-pair used in this study was provided to the Pléiades Glacier Observatory project via the French Space Agency’s (CNES) ISIS program. We are grateful to Dr. Etienne Berthier (LEGOS) for his assistance in obtaining the imagery. We are grateful to the reviewers for their constructive and helpful comments.
Footnotes
References
Agarwal, V., Bolch, T., Syed, T. H., Pieczonka, T., Strozzi, T., and Nagaich, R. (2017). Area and mass changes of siachen glacier (East Karakoram). J. Glaciol. 63, 148–163. doi: 10.1017/jog.2016.127
Barandun, M., Huss, M., Usubaliev, R., Azisov, E., Berthier, E., Kääb, A., et al. (2018). Multi-decadal mass balance series of three Kyrgyz glaciers inferred from modelling constrained with repeated snow line observations. Cryosphere 12, 1899–1919. doi: 10.5194/tc-12-1899-2018
Berthier, E., Arnaud, Y., Kumar, R., Ahmad, S., Wagnon, P., and Chevallier, P. (2007). Remote sensing estimates of glacier mass balances in the Himachal Pradesh (Western Himalaya, India). Remote Sens. Environ. 108, 327–338. doi: 10.1016/j.rse.2006.11.017
Berthier, E., Vincent, C., Magnússon, E., Gunnlaugsson, P., Pitte, P., Le Meur, E., et al. (2014). Glacier topography and elevation changes derived from Pléiades sub-meter stereo images. Cryosphere 8, 2275–2291. doi: 10.5194/tc-8-2275-2014
Bolch, T. (2015). Glacier area and mass changes since 1964 in the Ala Archa Valley, Kyrgyz Ala-Too, northern Tien Shan. Ice Snow 55, 28–39. doi: 10.15356/2076-6734-2015-1-28-39
Brun, F., Berthier, E., Wagnon, P., Kääb, A., and Treichler, D. (2017). A spatially resolved estimate of High Mountain Asia glacier mass balances, 2000-2016. Nat. Geosci. 10, 668–673. doi: 10.1038/NGEO2999.A
Cao, M. S. (1998). Detection of abrupt changes in glacier mass balance in the Tien Shan Mountains. J. Glaciol. 44, 352–358. doi: 10.1017/s0022143000002677
Cogley, J. G. (2009). Geodetic and direct mass-balance measurements: comparison and joint analysis. Ann. Glaciol. 50, 96–100. doi: 10.3189/172756409787769744
Dyurgerov, M. B. (2010). Reanalysis of glacier changes: from the IGY to the IPY, 1960–2008. Data Glaciol. Stud. 108, 1–116.
Eder, K., Geiss, T., Rentsch, H., Kokarev, A., and Uvarov, V. (2005). “Surveying and mapping of the Tuyuksu Glacier Region, Kazakhstan, 1:10,000,” in Fluctuations of Glaciers 1995-2000, eds W. Haeberli, J. Noetzli, M. Zemp, S. Baumann, and R. Frauenfelder (Zurich: World Glacier Monitoring Service), 72–73.
Eder, K., Geiß, T., Hornik, H., Rentsch, H., and Tremel, H. (2002). Neukartierung und DGM aufbau für das Tujuksu Gletschergebiet im Tian Shan. Z. Gletscherkd. Glazialgeol. 38, 129–138.
Farinotti, D., Longuevergne, L., Moholdt, G., Duethmann, D., Mölg, T., Bolch, T., et al. (2015). Substantial glacier mass loss in the Tien Shan over the past 50 years. Nat. Geosci. 8, 716–722. doi: 10.1038/ngeo2513
Gardelle, J., Berthier, E., Arnaud, Y., and Kääb, A. (2013). Region-wide glacier mass balances over the Pamir-Karakoram-Himalaya during 1999-2011. Cryosphere 7, 1263–1286. doi: 10.5194/tc-7-1263-2013
Gim, J. H., and Shin, S. H. (2015). Evaluating positional accuracy of Pléiades 1A satellite imagery in exploiting foreign natural resources. Spat. Inf. Res. 24, 85–92. doi: 10.1007/s41324-016-0009-y
Hagg, W., Braun, L. N., Uvarov, V. N., and Makarevich, K. G. (2004). A comparison of three methods of mass-balance determination in the Tuyuksu glacier region, Tien Shan, Central Asia. J. Glaciol. 50, 505–510. doi: 10.3189/172756504781829783
Hoelzle, M., Azisov, E., Barandun, M., Huss, M., Farinotti, D., Gafurov, A., et al. (2017). Re-establishing glacier monitoring in Kyrgyzstan and Uzbekistan, Central Asia. Geosci. Instrument. Methods Data Syst. Discuss. 6, 397–418. doi: 10.5194/gi-2017-31
Huss, M. (2013). Density assumptions for converting geodetic glacier volume change to mass change. Cryosphere 7, 877–887. doi: 10.5194/tc-7-877-2013
Huss, M., and Hock, R. (2018). Global-scale hydrological response to future glacier mass loss. Nat. Clim. Chang. 8, 135–140. doi: 10.1038/s41558-017-0049-x
Jacobsen, K., and Topan, H. (2015). DEM generation with short base length Pléiades triplet. Int. Arch. Photogramm. Remote Sens. Spat. Inf. Sci. ISPRS Arch. 40, 81–86. doi: 10.5194/isprsarchives-XL-3-W2-81-2015
Kaser, G., Großhauser, M., Marzeion, B., and Barry, R. G. (2010). Contribution potential of glaciers to water availability in different climate regimes. Proc. Natl. Acad. Sci. U.S.A. 107, 21300–21305.
Kutuzov, S., Lavrentiev, I., Smirnov, A., and Nosenko, G. (2019). Volume changes of elbrus glaciers from 1997 to 2017. Front. Earth Sci. 7:153. doi: 10.3389/feart.2019.00153
Kutuzov, S., and Shahgedanova, M. (2009). Glacier retreat and climatic variability in the eastern Terskey – Alatoo, inner Tien Shan between the middle of the 19th century and beginning of the 21st century. Glob. Planet. Change 69, 59–70. doi: 10.1016/j.gloplacha.2009.07.001
Makarevich, K. G. (2007). Methodological Aspects of Research in Mass Balance and Fluctuations of Mountain Glaciers (Metodiheskie Aspekty Issledovanii Balansa Massy i Kolebanij Gornyh Lednikov). Almaty: Kazakhstan Institute of Geography.
Marzeion, B., Champollion, N., Haeberli, W., Langley, K., Leclercq, P., and Paul, F. (2017). Observation-based estimates of global glacier mass change and its contribution to sea-level change. Surv. Geophys. 38, 105–130. doi: 10.1007/s10712-016-9394-y
Narama, C., Kääb, A., Duishonakunov, M., and Abdrakhmatov, K. (2010). Spatial variability of recent glacier area changes in the Tien Shan Mountains, Central Asia, using Corona (∼1970), Landsat (∼2000), and ALOS (∼2007) satellite data. Glob. Planet. Change 71, 42–54. doi: 10.1016/j.gloplacha.2009.08.002
Nuth, C., and Kääb, A. (2011). Co-registration and bias corrections of satellite elevation data sets for quantifying glacier thickness change. Cryosphere 5, 271–290. doi: 10.5194/tc-5-271-2011
Pieczonka, T., and Bolch, T. (2015). Region-wide glacier mass budgets and area changes for the Central Tien Shan between ~1975 and 1999 using Hexagon KH-9 imagery. Glob. Planet. Change 128, 1–13. doi: 10.1016/j.gloplacha.2014.11.014
Pieczonka, T., Bolch, T., and Buchroithner, M. (2011). Generation and evaluation of multitemporal digital terrain models of the Mt. Everest area from different optical sensors. ISPRS J. Photogr. Remote Sens. 66, 927–940. doi: 10.1016/j.isprsjprs.2011.07.003
Pritchard, H. D. (2019). Asia’s shrinking glaciers protect large populations from drought stress. Nature 569, 649–654. doi: 10.1038/s41586-019-1240-1
Severskiy, I., Vilesov, E., Armstrong, R., Kokarev, A., Kogutenko, L., and Usmanova, Z. (2016). Changes in Glaciation of the Balkhash - Alakol basin over the past decades. Ann. Glaciol. 57, 382–394. doi: 10.3189/2016AoG71A575
Severskiy, I. V., Kokarev, A. L., Severskiy, S. I., Tokmagambetov, T. G., Shagarova, L. B., and Shesterova, I. N. (2006). Contemporary and Prognostic Changes of Glaciation in Balkhash Lake Basin. Almaty: Institute of Geography.
Shahgedanova, M., Afzal, M., Hagg, W., Kapitsa, V., Kasatkin, N., Mayr, E., et al. (2020). Emptying water towers? Impacts of future climate and glacier change on river discharge in the Northern Tien Shan, Central Asia. Water 12:627. doi: 10.3390/w12030627
Shahgedanova, M., Afzal, M., Severskiy, I., Usmanova, Z., Saidaliyeva, Z., Kapitsa, V., et al. (2018). Changes in the mountain river discharge in the northern Tien Shan since the mid-20th Century: results from the analysis of a homogeneous daily streamflow data set from seven catchments. J. Hydrol. 564, 1133–1152. doi: 10.1016/j.jhydrol.2018.08.001
Shean, D. (2017). High Mountain Asia 8-meter DEMs Derived from Cross-track Optical Imagery, Verson 1.
Simon, M., Töppler, J., and Pillewizer, W. (1961). Zur kartographischen aufnahme des gletschergebietes tujuksu. Petermanns Geogr. Mitt. 105, 309–316.
Unger-Shayesteh, K., Vorogushyn, S., Farinotti, D., Gafurov, A., Duethmann, D., Mandychev, A., et al. (2013). What do we know about past changes in the water cycle of Central Asian headwaters? A review. Glob. Planet. Change 110, 4–25. doi: 10.1016/j.gloplacha.2013.02.004
Vilesov, E. I., and Uvarov, V. N. (2001). Evolution of Contemporary Glaciation of the Ile Alatau in the XX Century (Evolyutsiya Sovremennogo Oledeneniya Zailijskogo Alatau v XX Veke). Amaty: Kazakh State University.
Zemp, M., Hoelzle, M., and Haeberli, W. (2009). Six decades of glacier mass-balance observations: a review of the worldwide monitoring network. Ann. Glaciol. 50, 101–111. doi: 10.3189/172756409787769591
Zemp, M., Huss, M., Thibert, E., Eckert, N., McNabb, R., Huber, J., et al. (2019). Global glacier mass changes and their contributions to sea-level rise from 1961 to 2016. Nature 568, 382–386. doi: 10.1038/s41586-019-1071-0
Keywords: glacier, mass balance, Pléiades, climate change, Tien Shan, Central Asia
Citation: Kapitsa V, Shahgedanova M, Severskiy I, Kasatkin N, White K and Usmanova Z (2020) Assessment of Changes in Mass Balance of the Tuyuksu Group of Glaciers, Northern Tien Shan, Between 1958 and 2016 Using Ground-Based Observations and Pléiades Satellite Imagery. Front. Earth Sci. 8:259. doi: 10.3389/feart.2020.00259
Received: 18 February 2020; Accepted: 10 June 2020;
Published: 28 July 2020.
Edited by:
Fanny Brun, Université Grenoble Alpes, FranceReviewed by:
Gennady Andreevich Nosenko, Institute of Geography (RAS), RussiaNinglian Wang, Chinese Academy of Sciences (CAS), China
Copyright © 2020 Kapitsa, Shahgedanova, Severskiy, Kasatkin, White and Usmanova. This is an open-access article distributed under the terms of the Creative Commons Attribution License (CC BY). The use, distribution or reproduction in other forums is permitted, provided the original author(s) and the copyright owner(s) are credited and that the original publication in this journal is cited, in accordance with accepted academic practice. No use, distribution or reproduction is permitted which does not comply with these terms.
*Correspondence: Maria Shahgedanova, bS5zaGFoZ2VkYW5vdmFAcmVhZGluZy5hYy51aw==