 Sasha Z. Leidman1*
 Åsa K. Rennermalm1
 Anthony J. Broccoli2
 Dirk van As3
 Michiel R. van den Broeke4Konrad Steffen5
 Alun Hubbard6,7
- 1Department of Geography, Rutgers, The State University of New Jersey, New Brunswick, NJ, United States
- 2Department of Environmental Sciences, Rutgers, The State University of New Jersey, New Brunswick, NJ, United States
- 3Department of Glaciology and Climate, Geological Survey of Denmark and Greenland, Copenhagen, Denmark
- 4Institute for Marine and Atmospheric Research Utrecht, Utrecht University, Utrecht, Netherlands
- 5Swiss Federal Institute for Forest, Snow and Landscape Research (WSL), Birmensdorf, Switzerland
- 6Centre for Arctic Gas Hydrate, Environment and Climate, University of Tromsø, Tromsø, Norway
- 7Kvantum Institute, University of Oulu, Oulu, Finland
Every year, numerous field teams travel to remote field locations on the Greenland ice sheet to carry out polar research, geologic exploration, and other commercial, military, strategic, and recreational activities. In this region, extreme weather can lead to decreased productivity, equipment failure, increased stress, unexpected logistical challenges, and, in the worst cases, a risk of physical injury and loss of life. Here we describe methods for calculating the probability of a “scienceable” day defined as a day when wind, temperature, snowfall, and sunlight conditions are conducive to sustained outdoor activity. Scienceable days have been calculated for six sites on the ice sheet of southern Greenland using meteorological station data between 1996-2016, and compared with indices of large scale atmospheric circulation patterns: the Greenland Blocking Index (GBI) and the North Atlantic Oscillation (NAO). Our findings show that the probability of a scienceable day between 2010 and 2016 in the Greenland Ice Sheet.'s accumulation zone was 46 ± 17% in March-May and 86 ± 11% in July-August on average. Decreases in scienceability due to lower temperatures at higher elevations are made up for by weaker katabatic winds, especially in the shoulder seasons. We also find a strong correlation between the probability of a scienceable day and GBI (R = 0.88, p < 0.001) resulting in a significant decrease in April scienceability since 1996. The methodology presented can help inform expedition planning, the setting of realistic field goals and managing expectations, and aid with accurate risk assessment in Greenland and other harsh, remote environments.
1. Introduction
Greenland is prone to intense and dangerous storm events. Extreme events such as the mature lee cyclones which cause hurricane force winds and extensive icing were observed in 2007 (Innes et al., 2009) and katabatic winds (locally known as piteraqs) as high as 90 m s−1 were observed in 1970 (Oltmanns et al., 2014). Strong orographic effects exacerbate windy conditions contributing to tip jet and barrier flows that frequently exceed 25 m s−1 (Moore and Renfrew, 2005). Annual mean temperature is strongly tied to elevation, reaching −19°C at 2022 m.a.s.l. and multiple weather stations recording February mean temperature below −40°C (Steffen and Box, 2001). Frequent harsh conditions make the margin of error in dealing with weather related hazards exceptionally large. Foul weather poses physical, psychological, logistical, and economic stresses on a field teams. Even so, there is a significant lack of research on the risks associated with poor weather conditions.
Greenland field teams are often faced with weather conditions that intensify the physical risks of cold related illnesses and injury. Strong winds and low temperatures rapidly escalates the risk of frost bite, frost nip, and hypothermia (Imray et al., 2009). Foul weather also increases the physiological impacts of fieldwork on researchers. Prolonged poor conditions often necessitates confining oneself to tents or shelters and can lead to sleep deprivation, impaired cognitive ability, and interpersonal tension and conflict (Palinkas and Suedfeld, 2008). Drawn-out field campaigns have also been linked to an increase in winter-over syndrome, the polar T3 syndrome, and subsyndromal seasonal affective disorder (Palinkas and Suedfeld, 2008).
Inclement weather also leads to logistical challenges. Helicopters and airplanes that usually transport researchers to and from their field sites cannot operate during storm events further increasing risks of prolonged exposure during medical emergencies. Iridium satellite communications can also be impaired in adverse weather conditions so that researchers are unable to contact logistics personnel (Choi and Chan, 2002). An inability to communicate with team members and limited equipment designed for harsh conditions can also lead to logistical challenges especially for groups unaware of potential weather dangers.
Improper assessment of weather risks can lead to serious economic stress. In a study from the early 1990s, the National Research Council determined that Arctic ice camps can cost anywhere from $948 to $6320 per person per day (costs adjusted for inflation between 1995 and 2017) (Arctic Ocean Research and Supporting Facilities: National Needs and Goals, 1995). According to the United States National Science Foundation's Budget Report, Arctic research logistics and support totaled $44.27 million in 2016 for the nearly 1000 researchers working with the US program. This suggests that decreased productivity from foul weather has a significant impact on the overall costs of Arctic field research.
Here we design a methodology to assess the probability of a scienceable day for field expeditions in remote and extreme environments. We demonstrate the methodology by investigating meteorological data collected at six different sites in the accumulation zone of southern Greenland, an area often visited by scientific expeditions. Our study period started between 1996 and 2010 depending on the availability of meteorological data and ended in 2016. A scienceable day is defined as a day in which weather conditions are conducive to prolonged work in an outdoor setting for relatively fit and active field teams. This includes non-science-based work on the ice sheet that requires amicable weather conditions. By calculating which days had conditions that were too cold, too windy, too dark, or too snowy, we were able to determine how often scienceable days occurred.
2. Material and Equipment
Calculations of the probability of a scienceable day requires accurate meteorological data for the area in question including wind speed, air temperature, snow height, and GPS location. In this study, we use snow depth changes as a proxy for visibility. Measurements need to be taken at a high temporal resolution (ideally hourly) and within 2 m of the ice surface. In-situ measurements were used for this study.
3. Methods
3.1. Meteorological Data
The probability of scienceability of a given day was calculated using meteorological observations from six weather stations in southwest Greenland's accumulation zone (Figure 1). The KAN_U, S-9, S-10, and DYE-2 sites are further west and at lower elevation compared the NASA_SE and Saddle sites near the Greenland Ice Sheet divide. Meteorological data were gathered from three different sources for five field locations (the KAN_U and S-10 stations are practically at the same location) within the accumulation zone of southwest Greenland; PROMICE for KAN_U (van As et al., 2014), GC-Net for DYE-2, Saddle, and NASA_SE (Steffen and Box, 2001), and IMAU-AWS for the S-9 and S-10 sites (Smeets et al., 2018). While there are several additional stations operated by these networks, these sites were representative of the study region in south Greenland and serve as a case study for this methodology being applied to other datasets and study regions. The datasets for KAN_U, DYE-2, S-9, S-10, NASA_SE, and Saddle are nearly continuous from April 2009, July 1996, January 2010, August 2010, May 2005, and April 1997, respectively, until the end of the study period in May 2016. Smaller gaps in the data (≤3 h) were filled with linear interpolation of the nearest existing data in the time series. When available, gaps in wind speed and temperature data were filled with values from a linear relationship between the primary and secondary wind and temperature sensors on the station.
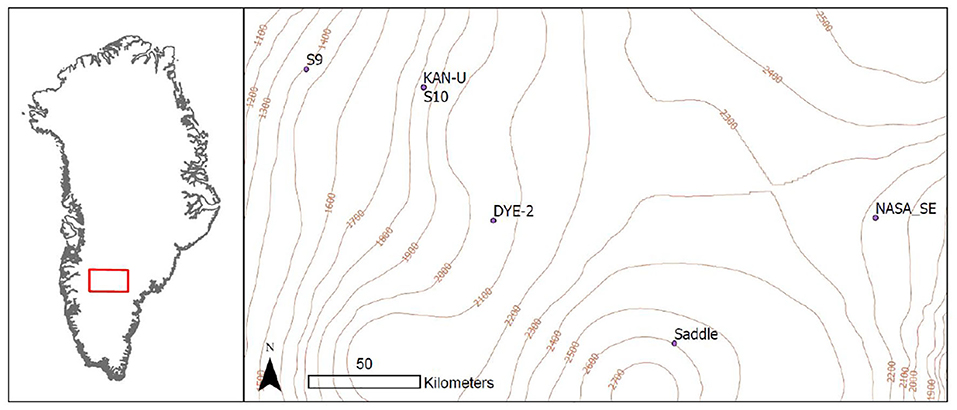
Figure 1. Map of study area and the site locations of the six automatic weather stations used in this study. The red box represents the study area in view. KAN_U and Site 10 are only 30 m apart from one another.
3.2. Scienceability Algorithm
Our algorithm incorporates four factors: wind, temperature, snow driven visibility decreases, and total sunlight hours, and is similar to the classification system used for weather danger at the McMurdo Research Station (Keaveney, 2004). In contrast to Antarctic researchers at McMurdo, Greenland field researchers are often expected to conduct their work for extended periods of time with no access to shelter (other than tents) or advanced medical care. Therefore, we adopt more stringent criteria for Greenland scienceability. A particular day was considered scienceable if it met the following criteria:
1. Wind speed criteria: Mean hourly wind speeds that do not exceed 14.4 ms−1.
2. Temperature criteria: The “felt temperature” with wind chill does not drop below −33.3°C.
3. Snowfall driven visibility criteria: Snowfall (calculated as a function of snow depth changes) does not exceed 0.01989 m/h. This is equivalent to a drop in visibility below 400 m (Rasmussen et al., 1999).
4. Daylight criteria: There is at least 8 h of daylight.
The wind speed criterion was determined with NOAA's classification of “near gale force” winds which are considered strong enough to knock someone off their feet. Weather station design necessitated different anemometer heights so that wind speed measurements were recorded at 2.5, 3.1, and 2.2 m for S-9/S-10, KAN_U, and DYE-2/NASA_SE/Saddle, respectively, when the stations were installed. Snow accumulation rates vary between all of the sights and while each station is visited and maintained periodically, these differences are expected to cause wind and temperature measurements to be taken at slightly different heights at all of the stations. The temperature criteria were set to fall within the Canadian Board of Environmental Protection's classification of “High Risk” conditions (Environment and Climate Change Canada, 2015). These temperatures are able to induce frost bite within 10–30 min of exposure (Danielsson, 1996; Biem et al., 2003). The “felt” temperature was determined with a wind chill index that was calculated based on NOAA's standard formula (Brice and Hall, 2001; Osczevski and Bluestein, 2005) where Wind Chill = 35.74 + (0.3453(T − 32)) − (31.43U0.16) + (0.2090(T − 32)U0.16) where T is the 2 m temperature in Celsius and U is the 2 m wind speed in meters per second. The wind chill index was only applied to air temperature for hourly wind speeds greater than 1.34 ms−1. Snowfall driven visibility decreases were calculated from changes in snow surface height. Positive surface height changes were assumed to be only the result of fresh snowfall. Snowfall rates from these positive surface height changes were then converted to meters of visibility using a formula developed for dry snow (Rasmussen et al., 1999). Our snowfall criteria are likely a limited assessment of visibility in our study region since it does not consider reductions in visibility due to wind blown snow and fog. However, those aspects of visibility were excluded because the six weather stations did not have reliable measurements of cloud cover or downward shortwave flux. Instead, we assumed that our conservative wind speed threshold also identified days with severe visibility losses from wind blown snow as non-scienceable. Hours of sunlight was determined by adding up the total number of positive solar azimuth hours per day simulated with the Pysolar module (http://pysolar.org/). While an 8 h threshold is somewhat conservative considering that visual flight rules allow for non-instrumented aircraft to fly up to the point when the sun is 6 degrees below the horizon, the criterion is met in this region between mid February and late October and rarely results in additional loss of calculated scienceability. All of these thresholds are based on conservative estimates of unworkable conditions. Research teams may need to abate these thresholds to meet the risks associated with extreme weather events that they find acceptable. The sensitivity of scienceability to altering threshold values was determined at the DYE-2 site by adjusting all thresholds by a fixed percentage and plotting the resulting mean number of scienceable days.
The probability of a scienceable day was only calculated for days where there were no missing temperature or wind speed data due to instrument error. For example, on average, data were available for each day of the year 84% of the time at the DYE-2 site resulting in the probability of scienceability on a particular day being calculated using an average of 16.6 and a minimum of 4 day measurements. Not including partially measured days is unlikely to affect the findings and would lead to similar results as calculating scienceability with interpolated values for missing days.
Scienceability assessed from weather station data was compared with field notes and photographs taken over a five research expeditions to the study area between 2010 and 2019. The authors recorded in the field if weather conditions were conducive to working during each expedition undertaken within the accumulation zone (>1,500 m asl) of the K-transect between S9 and DYE-2 spanning from late March through to the end of May.
3.3. Relationship With Large Scale Atmospheric Conditions
The relationship between scienceability and large scale atmospheric conditions was examined on seasonal and annual scale at the DYE-2 station, which has the longest time series of the six stations. Large scale atmospheric conditions were characterized with the Greenland Blocking Index (GBI) and North Atlantic Oscillation (NAO). The GBI, first defined by Fang (2004) and further popularized by Hanna et al. (2016), is the average 500 hPa geopotential height over the 60–80°N and 20–80°W region. GBI has shown to be a reliable indicator of atmospheric conditions in Greenland (Hanna et al., 2016). NAO is a measure of the difference in sea level pressure between the subtropical high and the sub-polar low. NAO has been closely linked to precipitation patterns (Bromwich et al., 1999; Mosley-Thompson et al., 2005) as well as regional wind and temperature conditions in Greenland (Qu et al., 2012). Daily values for GBI and NAO were obtained from NOAA's Earth System Research Laboratory Physical Sciences Division at: https://www.esrl.noaa.gov/psd/data/timeseries/daily/.
4. Results
4.1. Current Conditions
Winter temperatures average at −26°C at the DYE-2 site (1996 to 2015) with frequent large temperature swings (Figure 2). Hourly 2 m air temperatures dropped as low as −59°C and exceeded 0°C for only 1% of the study period at DYE-2. These conditions match well with the overall climate of the region (van As et al., 2014). The mean annual temperatures at the six sites was −16.3± 2.4°C with the greatest monthly variability in temperature in February followed by January and June. March-October temperatures at S-9 (the warmest site during the study period) were 6.3°C warmer than the at Saddle (the coldest site). Mean wind speed for all six sites was 5.8±1.4 m/s (Figure 2). The NASA_SE site and Saddle had significantly lower wind speeds than the other four more western sites with the greatest difference in wind speed in January. March-October wind speeds at NASA_SE and Saddle were on average, 2.0 m/s less than the other sites.
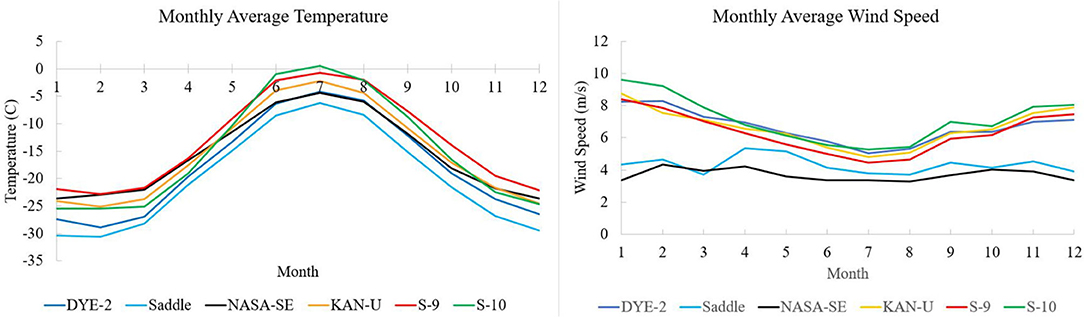
Figure 2. Mean monthly temperature and wind speed for each site revealing that the southeast stations (NASA_SE and Saddle) have lower wind speeds compared to the southwest stations (S-9, S-10, KAN_U, DYE-2.) [Asa: ADD: Averaging periods differ between the stations because all available data in the time period X to Y].
With the exception of NASA_SE, seasonal variability in scienceability is similar for all of the stations with the highest values from June to August (>86%), and distinctive local minima in mid to late April (21–65%) (Figure 3). The range of the number of scienceable days between the six stations vary month by month, with the greatest variability in April. For April, the S-10 site has about half the number of scienceable days compared to S-9 showing that scienceability can vary significantly over relatively small distances (53 km), especially in spring and fall. The NASA_SE site has significantly higher scienceability in March and April (77%) compared to the other sites (28%) mainly due to the decreased mean wind speed compared the more western sites (Figure 4).
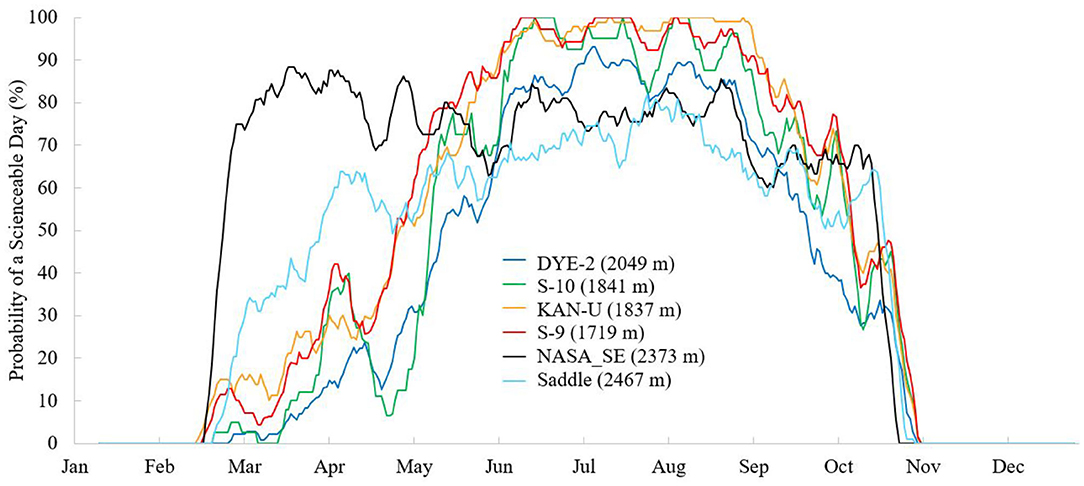
Figure 3. The probability of a scienceable day for each day of the year for the six field sites shown with 10 day moving averages using data from 2010 to 2016. Values next to site names represent the elevation of the weather station in m above sea level. [Asa: ADD: Data availability between 2010 and 2016 varied between the stations].
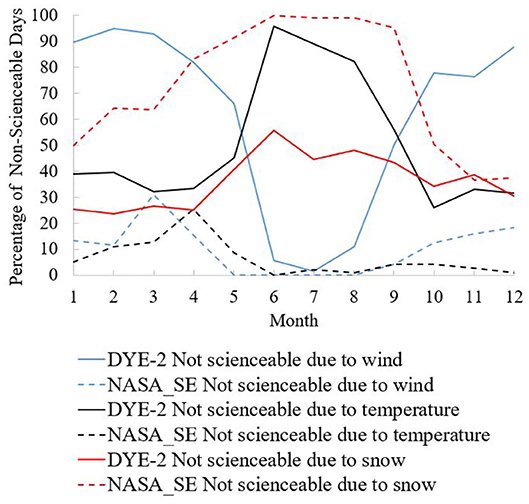
Figure 4. Attribution of non-scienceable days at the DYE-2 and NASA_SE sites due to wind speed (blue), temperature (black), and snowfall (red). DYE-2 had 3910 non-scienceable days (64% of total days) whereas NASA_SE had 1893 non-scienceable days (48% of total days).
The pattern of each criterion is significantly different for the east and west sites, as represented by DYE-2 and NASA_SE (Figure 4). The majority of the days deemed non-scienceable at NASA_SE were due to the snowfall driven visibility criterion, especially in the summer months. In contrast, the DYE-2 site switches from scienceability mainly driven by temperature in the summer to driven mainly by wind in the shoulder seasons. Temperature and wind rarely caused decreases in scienceability in the summer at NASA_SE.
Decreases in scienceability due to lower temperatures at higher elevations (Figure 2) seemed to be counterbalanced by the increases in scienceability due to decreased wind at higher elevations. As a result, a linear regression model showed that average annual scienceability had an insignificant dependence on elevation only increasing by 3.6% per 1,000 m of elevation gain (R2 = 0.025, p = 0.76).
Despite the proximity of the KAN_U and S-10 stations daily average probabilities of scienceable conditions is 9% lower at S-10 compared to KAN_U between March and October. The two stations are only 30 m apart and located in a relatively flat region of the ice sheet. The observed discrepancy in number of scienceable days is therefore likely due to the measurement errors and/or different data availability. The KAN_U station uses an aspirated temperature sensor compared to the unventilated temperature sensor used on the S-10 station. These different sensor types have shown to cause significant errors in temperature measurements (Huwald et al., 2009). Additionally, potential frost build up on the sensors might have causes errors in the anemometer measurements. The two stations had a wind sensor boom height of 3.1 m for KAN_U and 2.5 m for S-10 at the time of installation. However, snow accumulation and different maintenance intervals during which the station instrument heights were adjusted caused the boom height to be 1.5 m higher at S-10 than at KAN_U during the study period on average. The combination of these issues (i.e., instrumentation, measurement height, different data coverage, and potential frost buildup) caused the maximum daily wind speed at KAN_U to be 2.6 m/s lower and the felt temperature 1.2°C higher than S-10 on average. Applying a logarithmic wind gradient correction to the dataset using a surface roughness value of 1 mm (Broeke et al., 2008), results in an average correction factor of 1.103. Thus, these calculations show that the differences in measurement heights caused only slight differences scienceability and that instrument type and measurement error are more responsible for the observed differences with KAN_U being the more reliable station. The differences in scienceability at these co-located sites therefore gives a rough estimate of the error in scienceability due to instrumentation.
Predicted scienceability are conservative compared to data from research expeditions in the area in April and May of 2010, 2011, 2012, 2018, and 2019. During the expeditions, despite challenging conditions, 100% of the days in 2010, 96% of the days in 2011, 100% of the days in 2012, 60% of the days in 2018, and 77% of the days in 2019 had weather conditions suitable for fieldwork. Applying the scienceability criteria to meteorological data from the closest stations (S-9 for 2010 and 2011 and KAN_U for 2012, 2018, and 2019) taken on the exact same days as the field observations shows that scienceability was 72% in 2010, 25% in 2011, 50% in 2012, 31% in 2018, and 76% in 2019, meaning that scienceability was predicted correctly 72% of the time in 2010, 29% of the time in 2011, 50% of the time in 2012, 43% of the time in 2018, and 82% of the time in 2019. Mean scienceability for the expedition dates was 85%, roughly equal to the average calculated scienceability 19 days later in the season. Notably, while sciencability was poorly predicted in 2011, the expedition worked through severe conditions that resulted in discomfort and cold-related injuries. In 2018, an additional 5% of the days were lost to reestablishing the camp (mostly digging out tents and equipment from the snow) when the storms were particularly harsh. Relaxation of the criteria would yield an improved agreement between expedition and calculated scienceability however, in some instances, the criteria would have be adjusted to a degree that falls far from ECCC or McMurdo weather thresholds. For the 2011 expedition for example, low felt temperatures were responsible for all of the calculated non-scienceable days yet, the temperature threshold would have to be 130% more lenient in order to produce the same number of days observed in the field. Of the 20 expedition days in 2012, three were calculated as non-scienceable due to wind and 7 days calculated as non-scienceable due to temperature. The wind threshold would have had to be 20% more lenient and the temperature threshold 75% more lenient in order for the calculated scienceability to match observations.
The sensitivity analysis of scienceability showed that changes in criteria thresholds result in fairly linear changes in scienceability at the DYE-2 site (R2 = 0.99). Making all of the criteria 10% more lenient results in mean March-October scienceability increasing by 7%. This indicates that expedition teams willing to work in more arduous conditions could likely change threshold values and scienceability would change in a predictable manner.
4.2. Changing Scienceability From 1996 to 2016 at DYE-2
At DYE-2, where weather station observations date back to 1996, mean scienceability for most months peaked in the late 1990s, dropped sharply to reach a low in the 2004-2007 period, and has steadily increased since then (Figure 5). An exception to this pattern is seen in March, April, and May where scienceability did not rebound after the 1996–1999 peak. A two sample t-test showed that yearly mean scienceability since 2001 has been significantly lower than pre-2001 (p = 0.0021). However, low probabilities of scienceability in 2004–2007 compared to the high in 2012–2016 result in an overall linear rise in probability at a rate of 2.8 days per year (R2 = 0.68, p = 0.0017). This positive trend is mostly attributed to lessened windy storm conditions after 2012 more than any other factor (Figure 5). In contrast, low sunlight hours only results in a characterization of non-scienceability for 8 additional days over the entire study period.
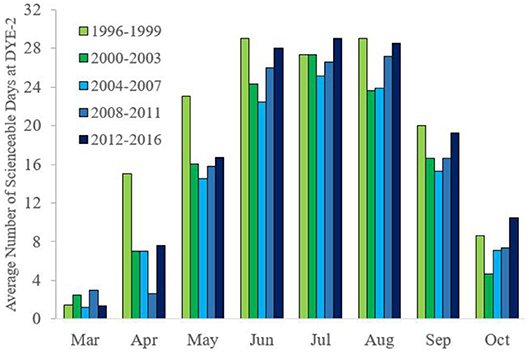
Figure 5. Mean number of scienceable days per month at DYE-2 calculated for five 4 year time periods between 1996 and 2016. Days with missing wind or temperature data were excluded from both plots resulting in data being available for 87% of days used for each day of the year of the left plot and 83% of days for the columns of the right plot.
4.3. Effect of Large Scale Weather Patterns at DYE-2
Greenland Blocking Index (GBI) is a better predictor of scienceability than the North Atlantic Oscillation (NAO) likely due to the more seasonally varying nature of GBI. Monthly probability of a scienceable day is significantly correlated with the GBI for March, May, August, September, and October at the DYE-2 station (R varied between 0.37–0.69, and p < 0.04) (Figure 6). Monthly scienceability for DYE-2 was only significantly correlated with NAO in May, September, and October (R = 0.39, p < 0.04). The lower correlation with NAO suggests that temperature compared to geostrophic wind speed is the main driver of scienceable days in the study region. The sharp decrease in scienceability in April (Figure 3) corresponds well with a fall in April GBI of 4 m/yr between 1996 and 2016. In summer months, GBI tends to increase while sciencability stays constant due to near fully scienceable conditions throughout the data record. On average, a 100 m increase in monthly averaged GBI has resulted in an increase in DYE-2 scienceability by 20% (R2 = 0.78, p < 0.0001) for the entire DYE-2 time series. An increase in NAO of 10 produces an increase in scienceability of 4.6% (R2 = 0.068, p < 0.0001).
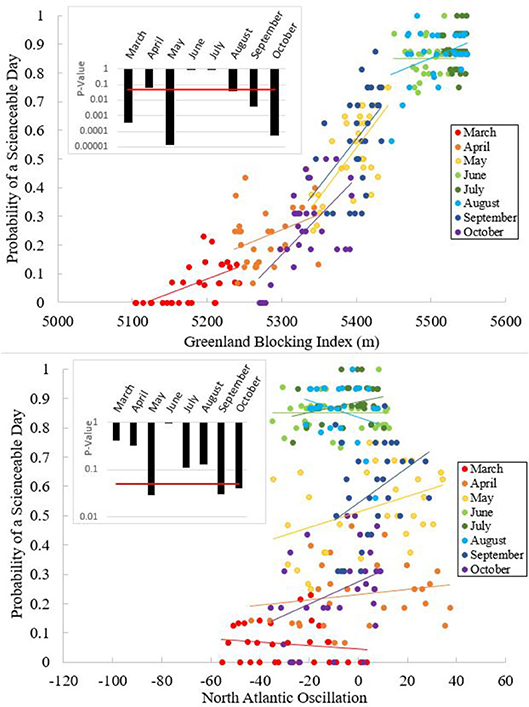
Figure 6. Relationship between scienceability and GBI (top) and NAO (bottom) for each month of the year at DYE-2. Circles represent data between 1996 to 2016 with each month separated by color. Solid lines show linear regression for each month (same color scale as data points). The inset figures show the p-values of the linear relationships in the associated panels of the figure. The red line in each inset figure indicates a p-value of 0.05.
5. Discussion
Our work shows that harsh weather conditions results in very low probabilities of scienceable days in the accumulation zone of southwest Greenland from March-May (28–46%, i.e., KAN_U, S-9, S-10, DYE-2). In contrast, the eastern sites have higher probabilities for March-May scienceability (55–75%, i.e., NASA_SE, Saddle) mainly related to lower wind speeds. The criteria described results in calculated scienceability values that are somewhat more conservative than data from five field expeditions carried out in the area between 2010 and 2019. During the longer expeditions in 2018-19, weather was favorable for 66–76% of the days, 17% more than calculated values on average. Annual scienceability in 2016 dropped by 37.7 days compared to the late 1990s but has been steadily rising since its early 2000s low point. The rise in June-August scienceability and fall of March-May scienceability correlate well with trends in Greenland Blocking Index (Hanna et al., 2016). Continued low scienceability in March-May is largely due to spring extreme wind events suggesting that a lowered 500 hp geopotential height over Greenland might exacerbate these conditions. The significantly higher March-May scienceability at NASA_SE and Saddle, the highest elevation sites, is caused by decreased wind speeds during these months. Decreased katabatic winds in this area cause consistently lower winds in this region than lower down on the ice sheet (van Angelen et al., 2011; Moore et al., 2013). Additionally, snowfall was significantly more impactful at reducing scienceability at the higher elevation sites than the lower elevation sites (Figure 5).
Here we calculated scienceability with conservative thresholds for acceptable temperatures, winds, snow driven visibility, and daylight hours targeting research expeditions living in tent camps under primitive conditions. Experienced research teams able and willing to accept increased risk from weather conditions may want to set thresholds for scienceability more leniently. For example, the day-light criterion could be lessened for groups able to work in darker conditions. Field teams looking at a particular phenomenon may also want to tailor their scienceability thresholds to specific meteorological conditions not considered in this study. For example, while scienceability increases up to 86.4% in the summer months in our study area, many field expeditions require sub-freezing weather for ice core drilling and subsequently deploy in spring months. Ice core drilling teams unable to operate in above freezing conditions could add an additional sub-freezing temperature requirement. Teams requiring clear sky conditions could take into account cloud conditions and decreased visibility resulting from wind blown snow or fog. Small field teams may want to factor in the loss of scienceable days to prepare camp for storms, and post-storm camp maintenance. The large difference in scienceability between KAN_U and S-10 stations, which are only 30 m apart, suggest that instrument errors, and to a lesser extent differences in sensor heights, may influence scienceability assessments. Our study only addresses how harsh weather conditions may affect research expeditions. Many other factors will ultimately determine the success of an expedition, including the team's experience levels and aptitude for fieldwork, group dynamics that facilitate cohesiveness and prevent interpersonal conflicts, bullying, and harassment, the nature of the scientific work, logistical issues, and more. This study is limited to the use of meteorological data records to determine scienceability, however, we acknowledge that calculated scienceability may not perfectly align with records of when previous expeditions were able to accomplish fieldwork. Information from other expeditions, local communities, and historic records about days of scienceability are not readily available for comparison. Finally, the incorporation of weather data from regional climate models such as Regional Atmospheric Climate Model (RACMO) (Noël et al., 2015) or Modèle Atmosphérique Régionale (MAR) (Fettweis et al., 2017) could lead to an understanding of scienceability in all of Greenland, or in regions without automatic weather stations.
Greenland scienceability is likely to be impacted in the future because of climate change. Greenland is currently experiencing altered patterns in temperature, wind speed, and other meteorological parameters (Steffen and Box, 2001; van As et al., 2014; Hanna et al., 2016). North Atlantic atmospheric conditions may be affected by the changing latitude of the Gulf Stream due to increased freshwater input from the Greenland Ice Sheet (Taylor et al., 1998). Increasing temperatures and changing cloud conditions may also be strengthening low pressure fronts causing higher wind speeds although it is unclear how they might influence katabatic winds in southwest Greenland (Heinemann and Klein, 2002). While weather conditions will likely change in response to climate forcings, it is unclear how these changes will impact scienceability within Greenland's accumulation zone. The strong correlation between scienceability and GBI, especially in the spring and fall months, as well as the significant correlation between scienceability and NAO in the fall, may give some predictive power for future scienceability in the accumulation zone. However, large scale atmospheric pressure signatures may not be indicative of small scale wind, temperature, and visibility variations (Hanna et al., 2013) relevant for field expeditions. Regardless, should current trends continue, research teams need to more carefully assess the feasibility of spring research projects within Greenland's accumulation zone.
6. Conclusions
Field researchers and workers in the polar regions frequently experience harsh weather conditions. These conditions have the potential to significantly disrupt work schedules and hinder the progress of field expeditions. Here, we present a methodology to determining the scienceability of study regions through the use of local weather station monitoring for increasing team safety and productivity. Alternative data sources such as regional climate models could be used in conjunction with weather station data. Additional parameters can be applied to this framework of threshold prediction in order to meet the scope and goals of the campaign objective. For example, teams that require below freezing temperatures for ice core drilling can incorporate positive degree days into scienceability calculations. Through this proactive approach to field logistics planning, researchers and other end-users will be able to better adjust to current and future pressures to their field operations.
Data Availability Statement
The datasets generated for this study are available on request to the corresponding author. Weather station data can be downloaded or requested from their host organizations. KAN_U weather station data is available from PROMICE at http://promice.dk. DYE-2, Saddle, and NASA SE weather station data is available from GC-Net at http://cires1.colorado.edu/steffen/gcnet/order/admin/station.php). S-9 and S-10 weather station data is available upon request from IMAU at https://www.projects.science.uu.nl/iceclimate/aws/.
Author Contributions
SL: consolidated and analyzed the data, wrote the majority of the manuscript, and edited the manuscript based on co-author and editor responses. ÅR: collected field data, input scientific ideas, and contributed to editing and writing draft manuscripts. AH: provided meteorological data, expedition observations, and edited draft manuscripts. AB: provided scientific input. DA: provided meteorological data and edited draft manuscripts. MB: provided meteorological data, aided in log wind calculations, and provided comments on manuscript drafts. KS: provided meteorological data and provided comments on manuscript drafts.
Funding
Funding for this research was provided by the National Science Foundation Graduate Research Fellowship Program and the National Science Foundation Grant #1604058. AH kindly acknowledges support from the Research Council of Norway (project 223259) and an Academy of Finland ArcI visiting fellowship to the University of Oulu.
Conflict of Interest
The authors declare that the research was conducted in the absence of any commercial or financial relationships that could be construed as a potential conflict of interest.
Acknowledgments
Special thanks to Polar Field Services, the Rutgers Geography Department, Federico Covi, Regine Hock, Jonathan Kingslake, Michael MacFerrin, Clemént Miège, Steven Munsell, Iva Radivojevic, and Kierin Rogers. Thanks to the Cooperative Institute for Research in Environmental Sciences (CIRES), the Programme for Monitoring of the Greenland Ice Sheet (PROMICE), and the Institute for Marine and Atmospheric Research Utrecht (IMAU) for hosting data used in this study.
Supplementary Material
The Supplementary Material for this article containing the calculated scienceability values can be found online at: https://www.frontiersin.org/articles/10.3389/feart.2020.00260/full#supplementary-material
References
Biem, J., Koehncke, N., Classen, D., and Dosman, J. (2003). Out of the cold: management of hypothermia and frostbite. Can. Med. Assoc. J. 168, 305–311.
Broeke, M. V. D., Smeets, P., and Ettema, J. (2008). Surface layer climate and turbulent exchange in the ablation zone of the west Greenland ice sheet. Int. J. Climatol. 29, 2309–2323. doi: 10.1002/joc.1815
Bromwich, D. H., Chen, Q.-S., Li, Y., and Cullather, R. I. (1999). Precipitation over Greenland and its relation to the north Atlantic oscillation. J. Geophys. Res. Atmos. 104, 22103–22115. doi: 10.1029/1999JD900373
Choi, J. P., and Chan, V. W. S. (2002). Predicting and adapting satellite channels with weather-induced impairments. IEEE Trans. Aerospace Electron. Syst. 38, 779–790. doi: 10.1109/TAES.2002.1039399
Danielsson, U. (1996). Windchill and the risk of tissue freezing. J. Appl. Physiol. 81, 2666–2673. doi: 10.1152/jappl.1996.81.6.2666
Environment and Climate Change Canada (2015). Wind Chill - The Chilling Facts. Technical report. Environment and Climate Change Canada.
Fang, Z.-F. (2004). “Statistical relationship between the northern hemisphere sea ice and atmospheric circulation during wintertime,” in Observation, Theory and Modeling of Atmospheric Variability, ed X. Zhu (Chengdu: World Scientific Publishing Co. Pte. Ltd.), 131. doi: 10.1142/9789812791139_0006
Fettweis, X., Box, J. E., Agosta, C., Amory, C., Kittel, C., Lang, C., et al. (2017). Reconstructions of the 1900-2015 Greenland ice sheet surface mass balance using the regional climate MAR model. Cryosphere 11, 1015–1033. doi: 10.5194/tc-11-1015-2017
Hanna, E., Cropper, T. E., Hall, R. J., and Cappelen, J. (2016). Greenland blocking index 1851-2015: a regional climate change signal. Int. J. Climatol. 36, 4847–4861. doi: 10.1002/joc.4673
Hanna, E., Jones, J. M., Cappelen, J., Mernild, S. H., Wood, L., Steffen, K., et al. (2013). The influence of North Atlantic atmospheric and oceanic forcing effects on 1900-2010 Greenland summer climate and ice melt/runoff. Int. J. Climatol. 33, 862–880. doi: 10.1002/joc.3475
Heinemann, G., and Klein, T. (2002). Modelling and observations of the katabatic flow dynamics over Greenland. Tellus Ser. A Dyn. Meteorol. Oceanogr. 54, 542–554. doi: 10.3402/tellusa.v54i5.12167
Huwald, H., Higgins, C. W., Boldi, M.-o., Bou-zeid, E., Lehning, M., and Parlange, M. B. (2009). Albedo effect on radiative errors in air temperature measurements. Water Resour. Res. 45, 1–13. doi: 10.1029/2008WR007600
Imray, C., Grieve, A., Dhillon, S., Caudwell, T., and Everest, X. (2009). Cold damage to the extremities: frostbite and non- freezing cold injuries. Postgrad. Med. J. 85, 481–488. doi: 10.1136/pgmj.2008.068635
Innes, H. M., Kristjánsson, J. E., Schyberg, H., and Røsting, B. (2009). An assessment of a Greenland lee cyclone during the Greenland Flow Distortion experiment: An observational approach. Q. J. R. Meteorol. Soc. 135, 1968–1985. doi: 10.1002/qj.524
Keaveney, S. R. (2004). Antarctic Operational Weather Forecasting. Maryland University College Park Department of Meteorology (CI04-386).
Moore, G., and Renfrew, I. (2005). Tip jets and barrier winds: a QuikSCAT climatology of high wind speed events around greenland. J. Clim. 18, 3713–3725. doi: 10.1175/JCLI3455.1
Moore, G. W. K., Renfrew, I. A., and Cassano, J. J. (2013). Greenland plateau jets. Tellus A Dyn. Meteorol. Oceanogr. 65:17468. doi: 10.3402/tellusa.v65i0.17468
Mosley-Thompson, E., Readinger, C., Craigmile, P., Thompson, L., and Calder, C. (2005). Regional sensitivity of Greenland precipitation to NAO variability. Geophys. Res. Lett. 32:L24707. doi: 10.1029/2005GL024776
Noël, B., Berg, W. J. V. D., Meijgaard, E. V., Munneke, P. K., and Wal, R. S. W. V. D. (2015). Evaluation of the updated regional climate model RACMO2.3: summer snowfall impact on the Greenland Ice Sheet. Cryosphere 9, 1831–1844. doi: 10.5194/tc-9-1831-2015
Oltmanns, M., Straneo, F., Moore, G., and Mernild, S. H. (2014). Strong downslope wind events in Ammassalik, Southeast Greenland. J. Clim. 27, 977–993. doi: 10.1175/JCLI-D-13-00067.1
Osczevski, R., and Bluestein, M. (2005). The new wind chill equivalent temperature chart. Bull. Am. Meteorol. Soc. 86, 1453–1458. doi: 10.1175/BAMS-86-10-1453
Palinkas, L. A., and Suedfeld, P. (2008). Psychological effects of polar expeditions. Lancet 371, 153–163. doi: 10.1016/S0140-6736(07)61056-3
Qu, B., Gabric, A. J., Zhu, J., Lin, D., Qian, F., and Zhao, M. (2012). Correlation between sea surface temperature and wind speed in Greenland sea and their relationships with NAO variability. Water Sci. Eng. 5, 304–315. doi: 10.3882/j.issn.1674-2370.2012.03.006
Rasmussen, R. M., Vivekanandan, J., Cole, J., Myers, B., and Masters, C. (1999). The estimation of snowfall rate using visibility. J. Appl. Meteorol. 38, 1542–1563. doi: 10.1175/1520-0450(1999)038<1542:TEOSRU>2.0.CO;2
Smeets, P. C. J. P., Munneke, P. K., As, D. V., Den, M. R. V., Boot, W., Oerlemans, H., et al. (2018). The K-transect in west Greenland: Automatic weather station data (1993-2016). Arctic Antarctic Alpine Res. 50:S100002. doi: 10.1080/15230430.2017.1420954
Steffen, K., and Box, J. (2001). Surface climatology of the Greenland ice sheet. J. Geophys. Res. 106, 33951–33964. doi: 10.1029/2001JD900161
Taylor, B. A. H., and Stephens, J. A. (1998). The North Atlantic Oscillation and the latitude of the Gulf Stream. Tellus A Dyn. Meteorol. Oceanogr. 50, 134–142. doi: 10.3402/tellusa.v50i1.14517
van Angelen, J. H., Van den Broeke, M., and Van de Berg, W. (2011). Momentum budget of the atmospheric boundary layer over the Greenland ice sheet and its surrounding seas. J. Geophys. Res. Atmos. 116:D10101. doi: 10.1029/2010JD015485
Keywords: fieldwork, Greenland, polar science, scienceability, cold injuries, Greenland blocking index, climatology, glaciology
Citation: Leidman SZ, Rennermalm ÅK, Broccoli AJ, van As D, van den Broeke MR, Steffen K and Hubbard A (2020) Methods for Predicting the Likelihood of Safe Fieldwork Conditions in Harsh Environments. Front. Earth Sci. 8:260. doi: 10.3389/feart.2020.00260
Received: 10 November 2019; Accepted: 10 June 2020;
Published: 30 July 2020.
Edited by:
Christoph Schneider, Humboldt-Universität zu Berlin, GermanyReviewed by:
Xavier Fettweis, University of Liège, BelgiumGünther Heinemann, University of Trier, Germany
Copyright © 2020 Leidman, Rennermalm, Broccoli, van As, van den Broeke, Steffen and Hubbard. This is an open-access article distributed under the terms of the Creative Commons Attribution License (CC BY). The use, distribution or reproduction in other forums is permitted, provided the original author(s) and the copyright owner(s) are credited and that the original publication in this journal is cited, in accordance with accepted academic practice. No use, distribution or reproduction is permitted which does not comply with these terms.
*Correspondence: Sasha Z. Leidman, c2FzaGEubGVpZG1hbkBydXRnZXJzLmVkdQ==