 Valentin Gueugneau
 Karim Kelfoun
 Sylvain Charbonnier
 Aurelie Germa
 Guillaume Carazzo
- 1School of Geosciences, University of South Florida, Tampa, FL, United States
- 2Université Clermont Auvergne, Centre National de la Recherche Scientique (CNRS), Institut de Recherche Pour le Developpement (IRD), Observatoire de Physique du Globe de Clermont (OPGC), Laboratoire Magmas et Volcans, Clermont-Ferrand, France
- 3Université de Paris, Institut de Physique du Globe de Paris, CNRS, Paris, France
The Mount Pelée May 8th, 1902 eruption is responsible for the deaths of more than 29,000 people, as well as the nearly-complete destruction of the city of Saint Pierre by a single pyroclastic current, and is, sadly, the deadliest eruption of the 20th century. Despite intensive field studies on the associated deposit, two conflicting interpretations of the pyroclastic current dynamics (either a blast or a simple ash-cloud surge) emerged in the 90’s and have been paralyzing research ever since, leaving numerous unknowns (i.e., source conditions, volume). This study is the first to investigate numerically the May 8th, 1902 pyroclastic current, using the new two-phase version of VolcFlow that simulates more accurately both parts of pyroclastic currents (i.e., the block-and-ash flow and the ash-cloud surge). Physical flow parameters are either extracted from field data or estimated empirically when no value was found in the literature. Among the two interpretations, only the simple ash-cloud surge is tested, generated from a block-and-ash flow initially supplied from the artificially recreated 1902 crater. The block-and-ash flow overflows from the southern V-shaped crater outlet and stays confined into the Rivière Blanche, whereas the ash-cloud surge expands radially and spreads westward, seaward, and eastward, ultimately reaching St Pierre 8 km away, within 330 s. The extent of both parts of the simulated current, as well as the thickness and the direction of the ash-cloud surge are accurately reproduced for a total volume of 32 × 106 m3, for which a significant part (one third) is deposited in the sea (not recorded in previous studies). Simulations demonstrate that the pear-like shape of the ash-cloud surge deposit is explained by a late surge production along the Rivière Blanche but also that a blast-like event may be required at the initial stage of the explosion, which in some way reconciles the two conflicting past interpretations. Results also highlight the role played by the topography in controlling transport and deposition mechanisms of such pyroclastic currents especially the lateral spreading of the ash-cloud surge. Our study improves the assessment of pyroclastic current-related hazards at Mount Pelée, which could be helpful for future eruptions.
Introduction
The 1902–1905 Mount Pelée eruption is a classic example often cited by volcanologists and media to demonstrate the hazards caused by the generation and rapid emplacement of a violent and unpredicted pyroclastic current. On May 8th, 1902, a powerful “nuée ardente” (term used by Lacroix, 1904 to describe the pyroclastic current) coming from the crater traveled down the volcano and nearly destroyed the city of Saint Pierre, 8 km away. On May 20th, a second powerful pyroclastic current occurred in the same area and achieved the total destruction of St Pierre. The two events were responsible for at least 29,000 deaths (Lacroix, 1904), culminating in the deadliest volcanic eruption of the last century. As such, past studies have mainly focused on reconstructing the eruptive sequence in order to better understand the potential hazards of Mount Pelée. One of the first records of this event was compiled by Lacroix (1904), who arrived on Martinique Island 2 months later and described with great detail the features of the May 8th pyroclastic current (i.e., deposit characteristics, damage in St Pierre, and various bodily injuries found in the town). Our understanding of the May 1902 Mount Pelée pyroclastic currents was improved decades later with the 1980 Mount St Helens eruption (Lipman and Mullineaux, 1981) and the subsequent advances the eruption brought to the understanding of explosive dome collapse processes. With new insight from the St. Helens eruption, numerous studies reinterpreted the deposits of the May 1902 eruption (Fisher et al., 1980; Fisher and Heiken, 1982, 1983, 1990; Sparks, 1983; Boudon and Lajoie, 1989; Bourdier et al., 1989; Charland and Lajoie, 1989; Lajoie et al., 1989; Boudon et al., 1990) to better constrain the eruptive source conditions and flow propagation dynamics. Two conflicting interpretations emerged from these studies: (i) St Pierre was destroyed by the ash-cloud surge component of a pyroclastic current derived from a primarily block-and-ash flow (BAF) traveling down the Rivière Blanche (Fisher et al., 1980; Fisher and Heiken, 1982), oriented in the southern direction initiated from a pre-eruption crater outlet (Chrétien and Brousse, 1989; Tanguy, 1994; Tanguy, 2004); (ii) the eruption consisted of a laterally oriented dome explosion, leading to the generation of a blast that traveled directly toward St Pierre destroying the city (Lacroix, 1904; Sparks, 1983; Boudon and Lajoie, 1989; Bourdier et al., 1989; Charland and Lajoie, 1989; Lajoie et al., 1989; Boudon et al., 1990).
The debate, focusing on whether or not a blast occurred during the May 8th, 1902 eruption, (Boudon et al., 1990; Fisher and Heiken, 1990) highlights the difficulties in identifying characteristic features of such a process due in part to large differences with the May 18th, 1980 Mount St Helens blast as well as the lack of a general blast model at that time. Later, Belousov et al. (2007) proposed a broad description of a volcanic blast, based on a review of three well-documented eruptions (Bezymianny, 1956; Mount St. Helens, 1980; Soufrière Hills, 1997): “a violent explosion of a magma body (internal or external) that releases a high energetic flow with high velocities (>100 m s–1) that covers a remarkably broad area, causing significant damage.” The authors also identified four criteria to distinguish a blast from a simple pyroclastic current: (i) a typical deposit stratigraphy in three layers – unit A, consisting of a mixture of accidental material (substratum rocks, vegetation fragments,…) eroded from the passage of the blast; unit B, fine-depleted layer, composed of coarse particles (few millimeters to few centimeters); unit C, laminated, composed of lapilli and ash – together with a debris avalanche deposit, (ii) a broad area of inundation with substantial damage due to high dynamic pressures, (iii) evidence of intense erosion at the base of the blast deposit sequence, and (iv) extreme velocities (>100 m s–1). Recent numerical modeling of the Soufrière Hills Volcano (Esposti Ongaro et al., 2008) and Mount St Helens blasts (Esposti Ongaro et al., 2012) show that the dynamics seem to be composed of three main phases: a short burst phase at the beginning during which the magma is fragmented and transported by the overpressure of the volcanic gas, a collapse phase during which gravity surpasses the pressure and becomes the driving force, and a PDC phase in which the flow turns to a pyroclast-laden density current. Several other eruptions have produced pyroclastic currents that share some blast criteria including Mount Unzen in 1991 (Taniguchi and Suzuku-Kamata, 1993), Chaitén in 2008 (Major et al., 2013), Arenal in 1968 (Alvarado et al., 2006), and Merapi in 2010 (Komorowski et al., 2013). Thus, Komorowski et al. (2013) proposed a modified blast description of Belousov (2007) by distinguishing three categories of blast-like flow: (1) very extensive blasts associated with flank collapses (Bezymianny, 1956; Mount St. Helens, 1980; Lipman et al., 1981; Belousov et al., 2007); (2) vertically-directed blasts of intermediate intensity (Lamington, 1951; Taylor, 1958); and (3) low intensity blasts produced by dome collapse (Soufrière Hills, 1997; Sparks et al., 2002; Voight et al., 2002; Merapi, 2010; Komorowski et al., 2013). With this new description of a volcanic blast, we revisit the May 8th, 1902 eruption at Mount Pelée.
Since the debate in the early 90s, no consensus has emerged and consequently some key aspects of the Mt. Pelée eruption remain unclear. The lack of an unambiguous scenario describing the proper source conditions, internal dynamics, and volume of material deposited by the pyroclastic current constitutes an obstacle in the assessment of hazards and risks posed by such flows at the active Mount Pelée volcano.
To provide new insight, this study simulates the May 8th, 1902 pyroclastic current at Mount Pelée using the two-layer version of the numerical model VolcFlow (Kelfoun, 2017). Because of the model framework, only the scenario from which an ash-cloud surge is generated from a block-and-ash flow (Fisher et al., 1980) is simulated. The source and boundary conditions are set according to field data: the pyroclastic current is generated by imposing a mass flux at the Mount Pelée summit crater, reconstructed with a synthetic pre-eruptive morphology (Tanguy, 1994), that overflows through the southern crater outlet into the Rivière Blanche. Quantitative assessment of the modeling results is performed by comparing the simulation outputs to a compilation of field data (Lacroix, 1904; Fisher et al., 1980; Fisher and Heiken, 1982, 1983, 1990; Sparks, 1983; Boudon and Lajoie, 1989; Bourdier et al., 1989; Charland and Lajoie, 1989; Lajoie et al., 1989). The comparison focuses on variation in deposit thickness, areas inundated by the flows, types of deposits, local direction of the current, and dynamic pressure of the ash-cloud surge. The volume of the simulated flow is adjusted by trial and error in order to obtain the best fit with real deposits. A realistic deposit volume is proposed, and the mass flux of the pyroclastic current that entered the sea is estimated. With the model reliability and eruptive scenario tested, we discuss the source conditions of the eruption, as well as the occurrence of a blast-like event.
This study clarifies some important features of the famous May 8th, 1902 eruption and better explains why Saint Pierre was heavily destroyed by the pyroclastic current on that day. The numerical modeling results give important insights into the dynamics of the pyroclastic current, as well as the general eruptive sequence and improve the assessment of pyroclastic current-related hazards at Mount Pelée, helpful for the mitigation of future eruptive crises. This work also constitutes another validation/confirmation case study for the numerical code VolcFlow, as it has already been conducted for the November 5th, 2010 Merapi eruption (Kelfoun et al., 2017) and for the June 25th, 1997 Soufrière Hills Volcano eruption (Gueugneau et al., 2019).
Geological Setting
Martinique Island and Mount Pelée
Martinique, in the central part of the Lesser Antilles, emerged about 25 Ma ago, in response to the subduction of the Atlantic plate beneath the Caribbean plate. On the island, volcanism migrated westward and built nine complexes, with compositions ranging from basalts to rhyolites. Plio-pleistocene volcanoes align north-south along the western coast. Mount Pelée, the youngest volcano, is characterized by an evolution from effusive to explosive dynamics since it emerged about 550 ka ago (Germa et al., 2011). The western flank of the volcano was destroyed by three successive collapses, 125, 25, and 9 ka ago (Le Friant, 2003; Boudon et al., 2007; Germa et al., 2011), leaving imbricate horseshoe-shaped structures within which the modern cone sits (dashed lines Figure 1). Volcanic activity at Mt. Pelée over the past 5,000 years is characterized by a heterogeneous succession of sub-Plinian/Plinian and dome-forming (Pelean) eruptions (Westercamp and Traineau, 1983; Boudon et al., 2005; Carazzo et al., 2012; Michaud-Dubuy et al., 2019). Among these events, the P6 (4,610 BP) and P4 (2,440 BP) Plinian eruptions produced small explosive fountains associated with pyroclastic currents (Westercamp and Traineau, 1983), whereas the P5 (4,060 BP), P3 (79 cal CE), P2 (280 cal CE) and P1 (1300 cal CE) Plinian eruptions formed 20–30 km high stable Plinian columns that underwent total or partial collapse with associated pyroclastic currents at some stage (Carazzo et al., 2012, 2019, 2020). Numerous eruptions involved formation and/or destruction of lava domes often with a blast-like phase identified, including the P2, P1, 1902–1905 CE (Lacroix, 1904) and the 1929–1932 CE eruptions (Perret, 1935). Historical events at Mt. Pelée volcano also include two minor phreatic eruptions in 1792 CE and 1851 CE (Jaggar, 1903), and at least since the late 19th century recurrent non-eruptive lahars have occurred in the Rivière du Prêcheur valley (Aubaud et al., 2013).
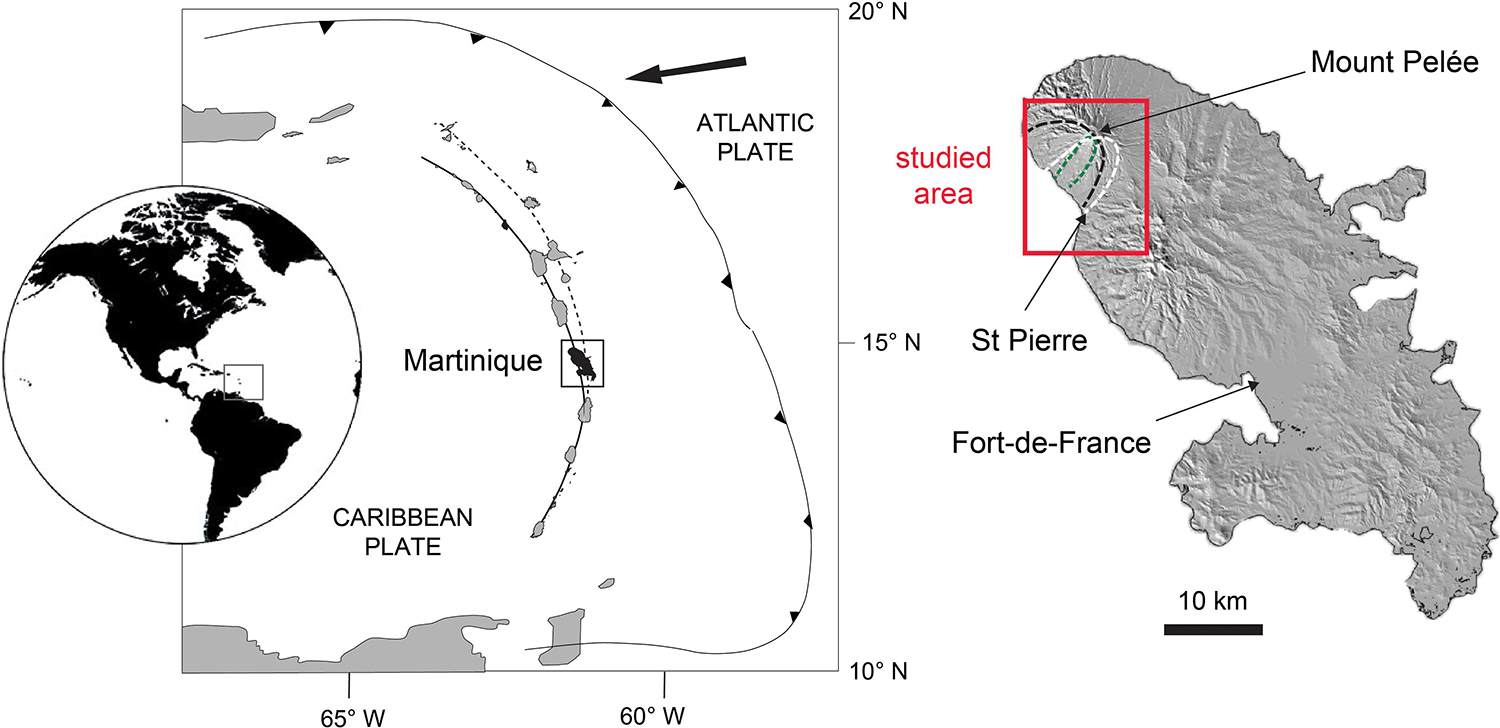
Figure 1. Regional setting of Martinique Island in the central part of the Lesser Antilles. The dashed line north of Martinique represents the Oligocene arc front, the bold line represents the Plio-Pleistocene arc front. The black arrows point in the direction of subduction of the Atlantic plate beneath the Caribbean Plate. The Mount Pelée volcano is located in the northern part of the island, and the study area is within the red rectangle, described in Figure 2. The dashed lines within the study area refer to imbricate horseshoe-shaped structures left by flank collapses of the volcano 125, 25, and 9 ka ago (Le Friant, 2003; Boudon et al., 2007; Germa et al., 2011).
The 1902–1905 CE eruption is well-documented in a series of contemporary reports that describe the eruptive products and their impacts on the towns of St Pierre and Morne-Rouge (Lacroix, 1904). The climactic phase of the eruption on May 8th was followed by major pyroclastic currents on May 20th, 26th, June 6th, July 9th, and August 30th. Then, a dome-forming phase characterized by the great spine and a decrease in activity of explosive events continued until September 1903. Small recurrent pyroclastic currents associated with the lava dome building stage occurred until the end of the eruption but were mostly contained within the Rivière Blanche valley (Lacroix, 1904).
The May 8th, 1902 Explosion: From Precursors to the Pyroclastic Current
According to Roobol and Smith (1975); Chrétien and Brousse (1989), and Lacroix (1904), precursors of the May 1902 eruption began more than 10 years before the eruption, in 1889, when fumaroles were observed in the Etang Sec caldera for the first time. The fumarolic activity slowly intensified until 1902, and on April 23rd to 25th phreatic explosions occurred inside the caldera, releasing ash without showing any sign of magma. This phreatic activity was observed sporadically until May 1st and 2nd when it reached its paroxysm. On May 5th, after a 3 day lull, the caldera, recently filled with hot water and likely weakened by the fumaroles, collapsed sending lahars seaward via the Rivière Blanche, isolating the Le Prêcheur village. The collapse left an empty crater with a south-facing V-shaped outlet. On May 6th, the magmatic activity started with the onset of an explosion marked by a high dark plume accompanied by lightning. Magma had likely reached the surface and a lava dome was visible on May 7th (Chrétien and Brousse, 1989). On May 8th at about 8 am, the newly formed lava dome, clearly visible but topped by a high column of white steam, exploded and a large pyroclastic current, likely exploiting the V-shaped outlet, flowed into the Rivière Blanche. Emerging from the crater, the current flowed seaward expanding laterally leaving the inundated area in the form of a cone-like shape, with the eastern-most and western-most radius at an angle of approximately 90 degrees, reaching St. Pierre 8 km from the summit at 8:02 a.m. Figures 2C,D are pictures taken on May 11th from a boat showing the Center and Mouillage districts partially demolished (Lacroix, 1904). Despite the precursors, no evacuation had been ordered. Lacroix (1904) estimated the death toll to be between 28,000 and 29,000, all due to a single pyroclastic current. On May 20th, another strong explosion triggered a large pyroclastic current that traveled the same route, this time completely destroying St Pierre. Figures 2A,B show St Pierre, viewed from Morne Abel (A) and Morne d’Orange (B) in August 1902 (Lacroix, 1904), and the consequences of the passage of the May 8th and 20th pyroclastic currents: blown down buildings and only a few partially remaining walls, mostly those parallel to the coastline, in the southern part of the city.
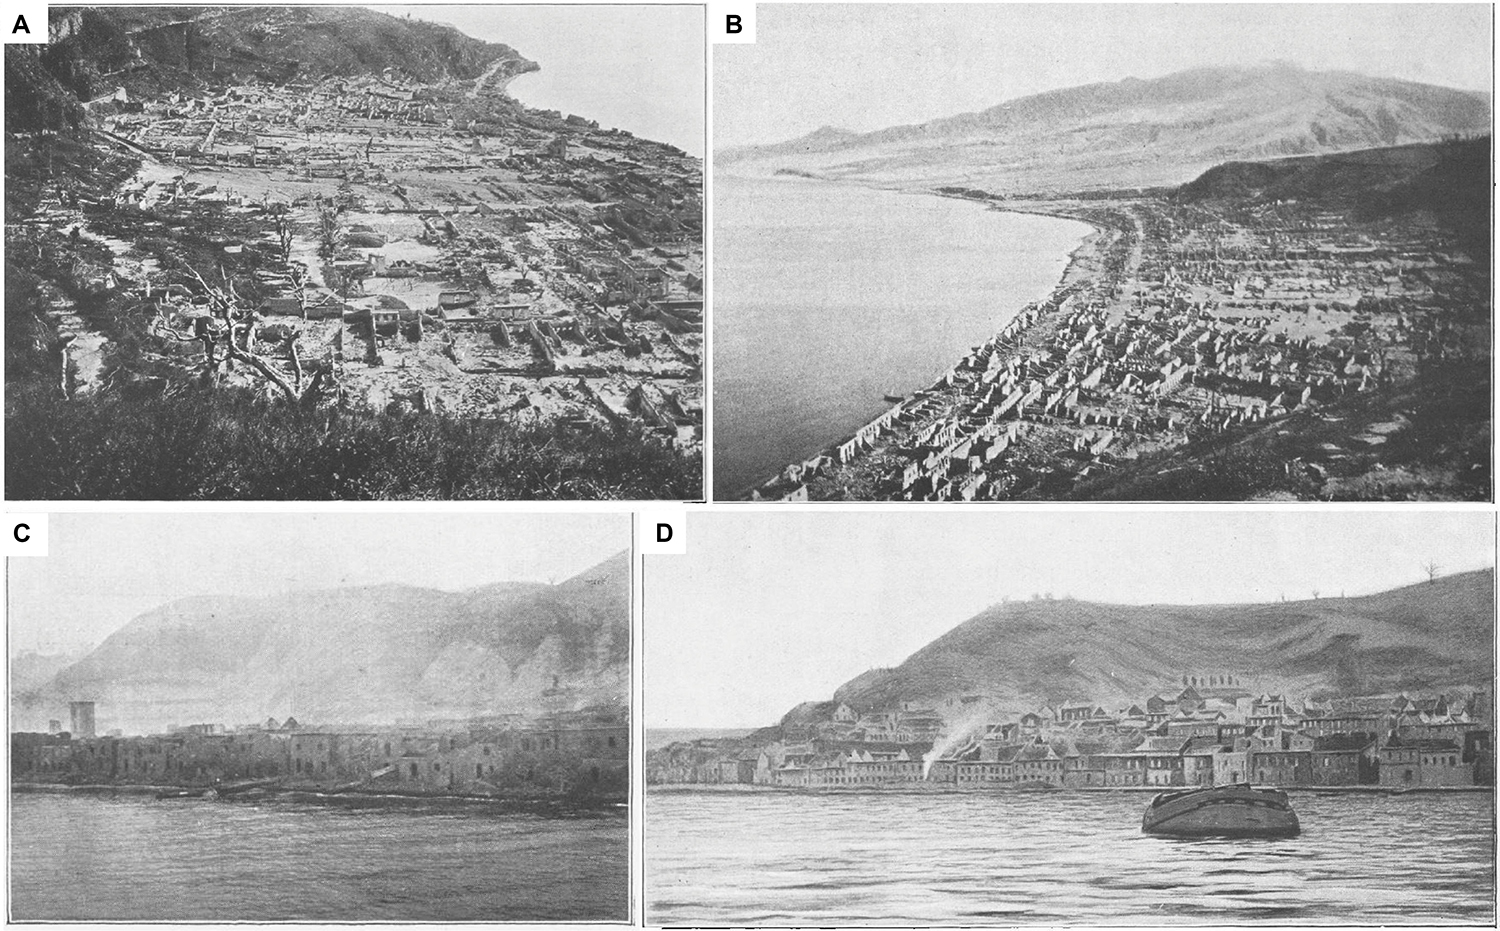
Figure 2. Pictures of St Pierre after the eruption, from Lacroix (1904). (A,B) Were taken in August 1902 from Morne Abel looking south (A) and from Morne d’Orange looking north (B). (C,B) Were taken in May 11th, 1902, 3 days after the passage of the pyroclastic current, from a boat a few hundred meters off the coast. It shows the Mouillage and Center districts only partially destroyed. See Figure 9 for a closer view of St Pierre city map.
Pyroclastic Current Deposit Characteristics
Several studies have focused on the 1902 pyroclastic current deposits and their sedimentological characteristics, and are compiled in the deposit distribution map of the May 8th, 1902 eruption (Figure 3) and also listed in Table 1. Two types of pyroclastic current deposits have been identified:
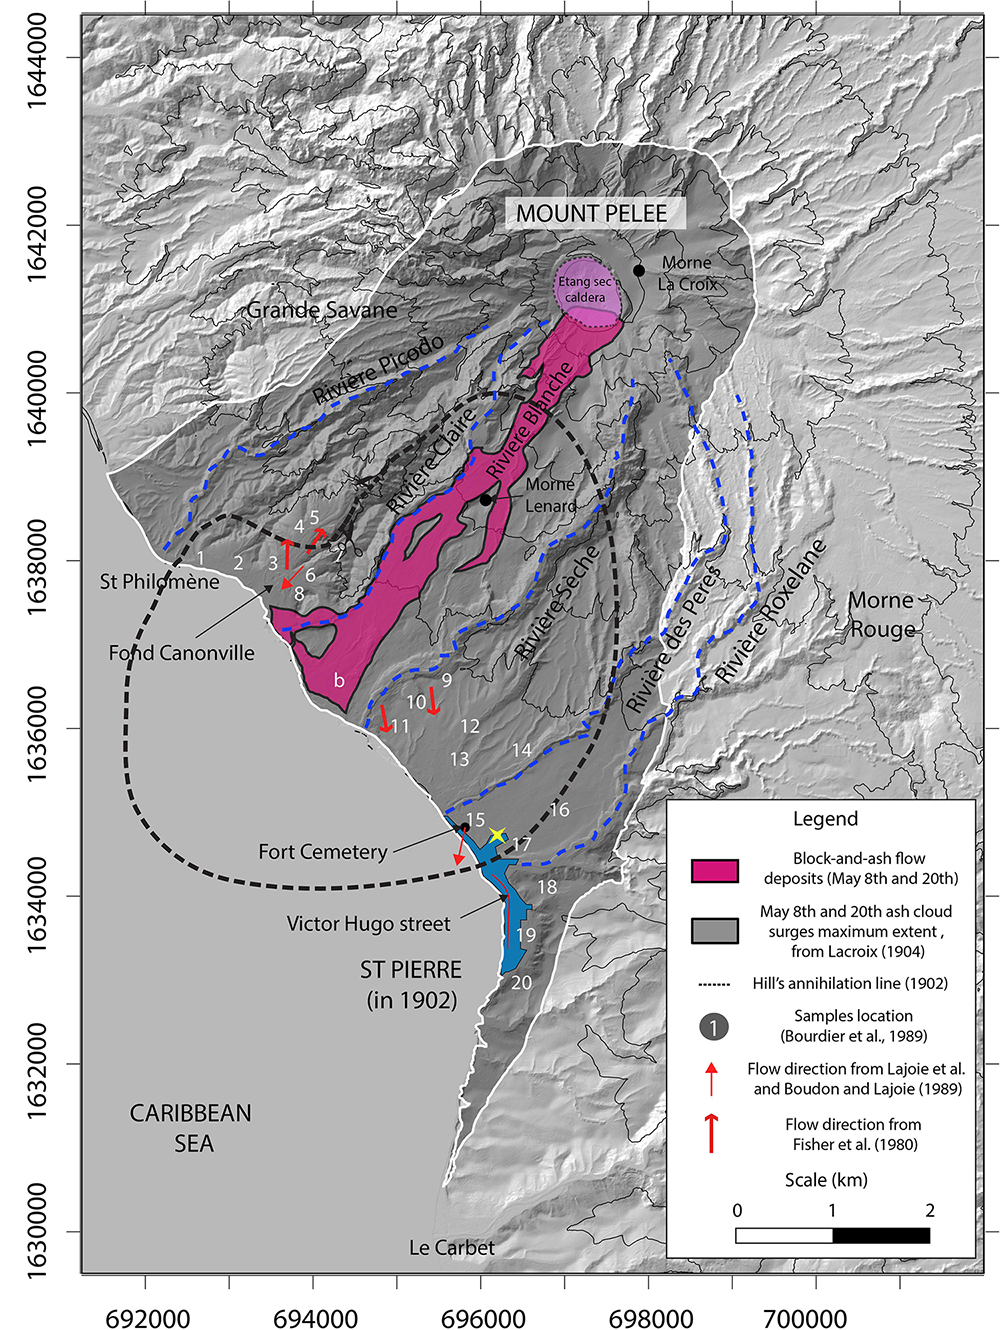
Figure 3. Distribution map of the May 8th, 1902 eruption, with the ash-cloud surge and the block-and-ash flow inundated areas shown in gray and pink, respectively (modified after Bourdier et al., 1989; Hill, 1902; Lacroix, 1904; and BRGM Geological map). Main rivers are marked by blue dashed lines. The Hill’s annihilation line is represented by a black dotted circle. The pre-eruptive extent of the city of St Pierre is represented by the blue area. Current direction from Fisher and Heiken (1982), and Boudon and Lajoie (1989) – Lajoie et al. (1989) are represented by thick and thin red arrows, respectively. The location of samples used in this study are represented by the white numbers (from Bourdier et al., 1989).
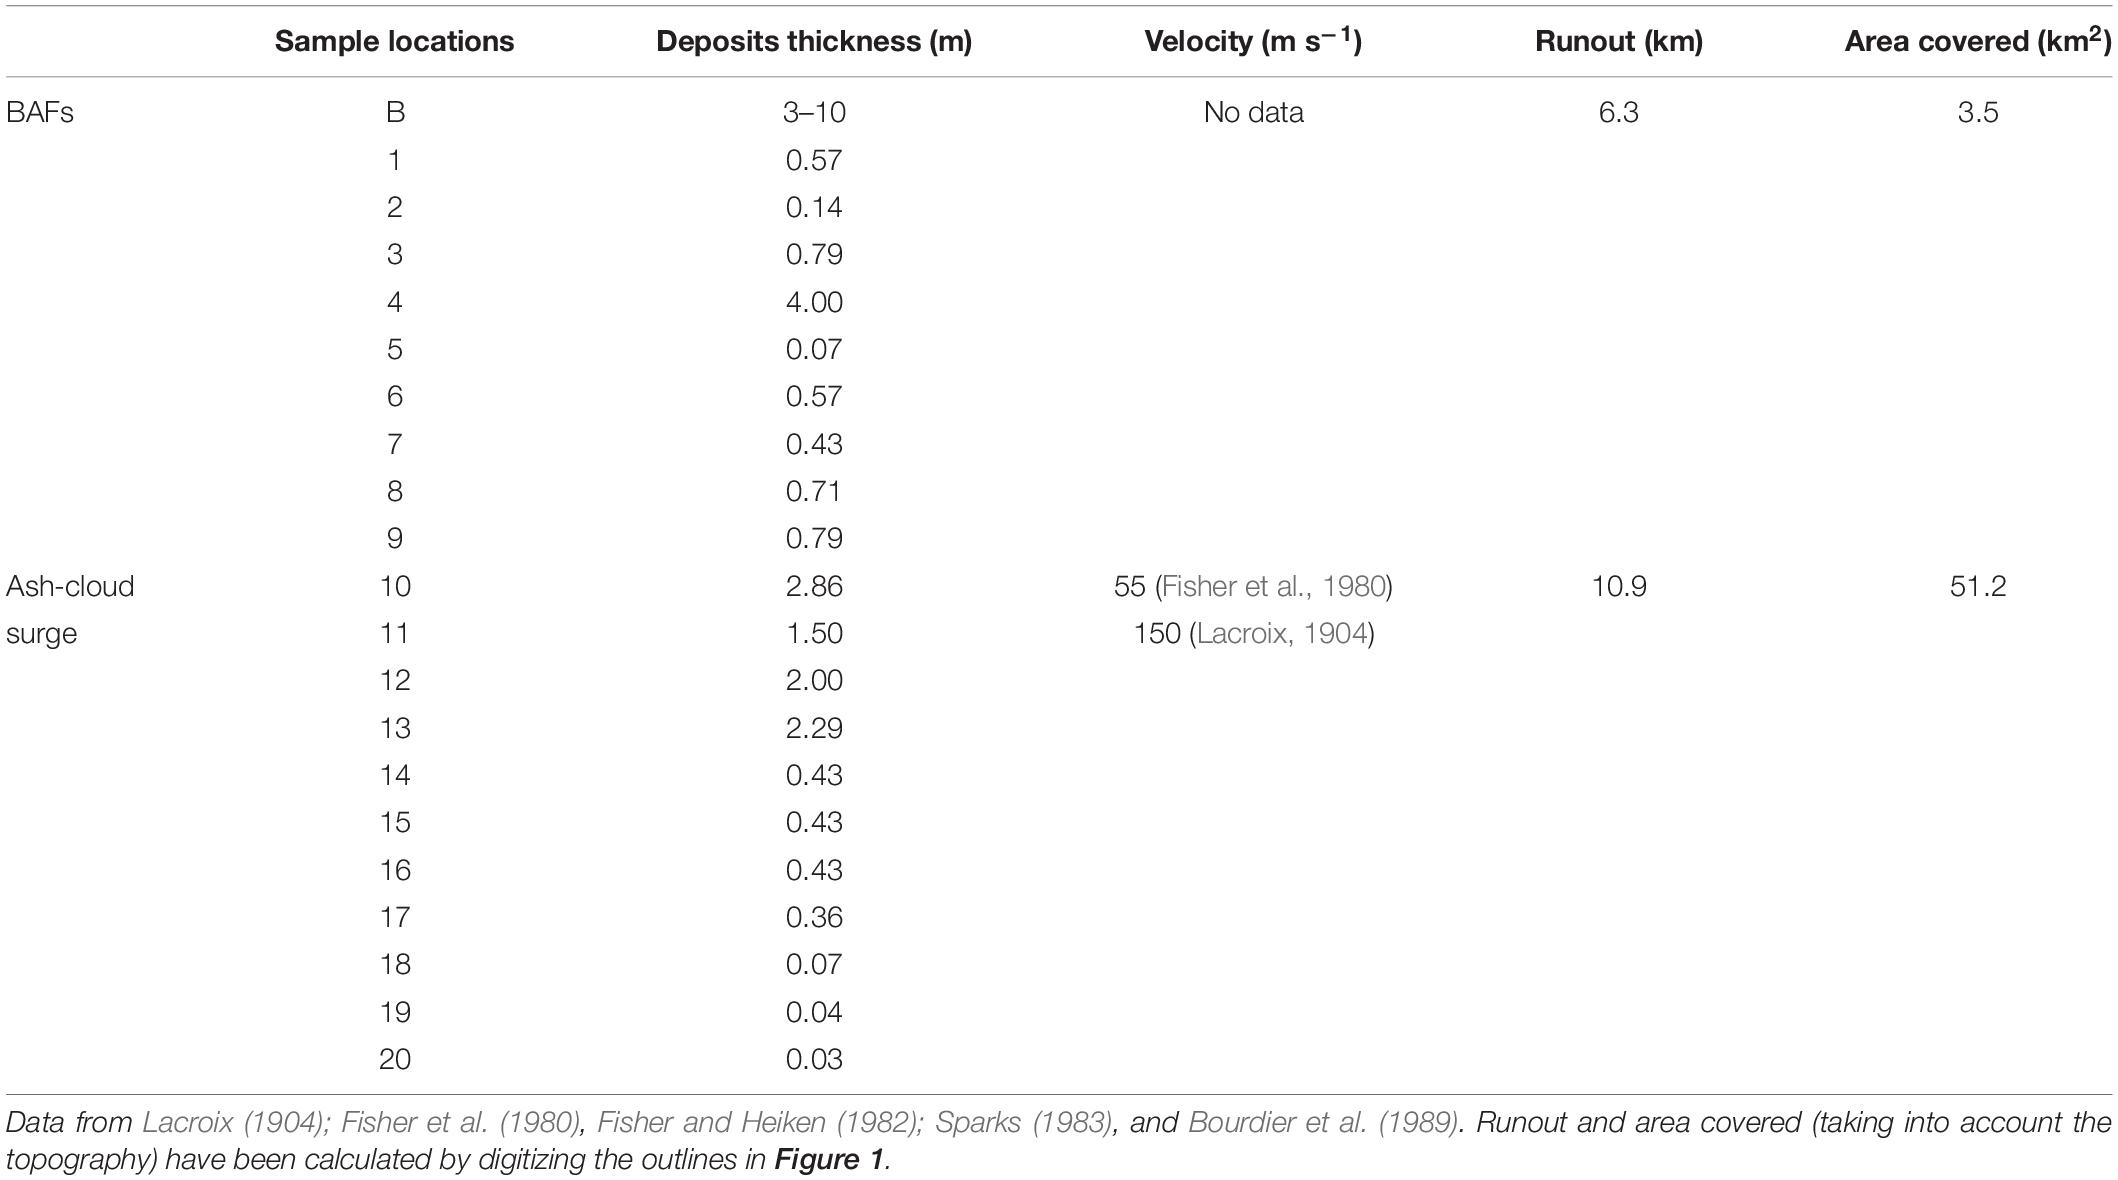
Table 1. Compilation of field data of the May 8th, 1902 eruption at Mount Pelée. Sample locations refer to the white numbers in Figure 1.
– A several-meter thick, unsorted bed of coarse particles in a fine-grained matrix channelized within the Rivière Blanche, described later as a block-and-ash flow deposit (delimited by the pink area in Figure 3) which covers about 3.5 km2 (Fisher et al., 1980; Fisher and Heiken, 1982; Boudon and Lajoie, 1989; Bourdier et al., 1989; Charland and Lajoie, 1989; Lajoie et al., 1989). The deposit is massive, with weak grading and poor clast organization/segregation, and seemingly filled the entire valley (Lacroix, 1904).
– A thin, stratified bed of finer particles (lapilli-ash) covering a large area (delimited in Figure 3 by the white line), corresponding to the devastated area outlined in Lacroix’s map (black line, p. 223, 1904). Roobol and Smith (1975) estimated the devastated area at 58 km2, but using a geo-referenced digital elevation model we obtained a value of 51.2 km2. This deposit surrounds the crater to the north for about 1 km and extends 500 m past St Pierre to the south and to St Philomène to the west. Fisher et al. (1980); Fisher and Heiken (1982), Bourdier et al. (1989), and Lajoie et al. (1989) identified three principal units in this deposit: (i) a lower unit composed of coarse, dark-gray lithic clasts, often normally graded and fine-depleted at the base (Figure 4) and composed of numerous degassing pipes in the upper part (called secondary block-and-ash flow deposit by Fisher and Heiken, 1982), (ii) a middle unit generally massive but locally laminated (Figure 4) composed of lapilli and ash (called secondary ash-cloud surge deposit by Fisher and Heiken, 1982), and (iii) a thin upper unit not continuous within the deposit area (unit is missing in St Pierre, Figure 4) composed of ash and accretionary lapilli (called airfall tuff by Fisher and Heiken, 1982). The mean grain size is relatively homogeneous in each of the three units and varies between 0 and 2 ϕ (2–0.25 mm). Total thickness of this stratified bed varies by more than a meter at Fond Canonville to a few millimeters south of St Pierre. The cumulated thickness of the 3 units, measured from twenty different locations by Bourdier et al. (1989), are presented in Table 1 and reported on the map in Figure 3. One striking feature is the sharp decrease in deposit thickness from the Rivière Sèche valley (locations 9–11 in Figure 3) to the edge of the devastated area (locations 14–20 in Figure 2) in the eastern part of St Pierre. All studies attribute this deposit to a turbulent ash-cloud surge (Fisher et al., 1980; Fisher and Heiken, 1982; Sparks, 1983; Bourdier et al., 1989; Boudon and Lajoie, 1989; Charland and Lajoie, 1989; Lajoie et al., 1989). The debated and confusing terminology used by Fisher and Heiken (1982) (called “secondary block-and-ash flow”) was later clarified by Fisher and Heiken (1990) with the term “single ash-cloud surge” deposit.
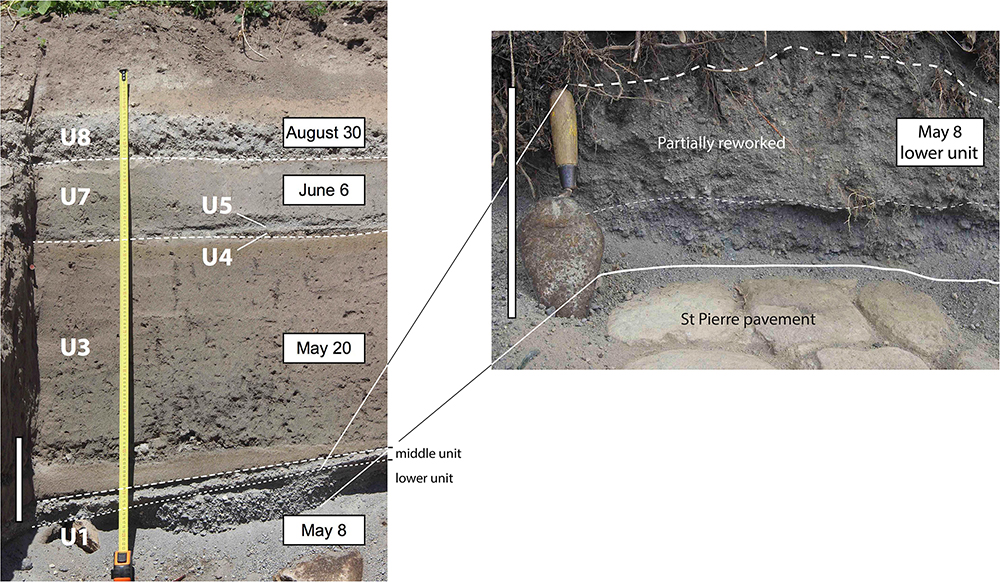
Figure 4. Fine-grained facies of the May 8th, May 20th, June 6th, and August 30th deposits in the Fort district (St Pierre). Units U1 to U8 are from Bourdier et al. (1989). Unit U1, corresponds to the May 8th deposit, separated in three layers, i.e., the lower, middle and upper unit (see text for description). Only the middle and lower unit are visible at St Pierre. The picture on the right is a closer view of the U1 lower layer, sampled in the northern part of St Pierre (yellow star in Figure 2) where the deposit is directly in contact with the pavement of the city. The white scale bar is 20 cm long.
Using a variety of indicators, the local direction of propagation of the ash-cloud surge was reconstructed. Lacroix (1904) estimated the direction of the ash-cloud surge to be parallel to Victor Hugo Street in St Pierre (red line in Figure 3) using the N-S orientation of the remaining standing walls and the N-S alignment of the dead bodies in the streets. From measurements in cross-bedded deposits, Fisher et al. (1980); Lajoie et al. (1989), and Charland and Lajoie (1989) identified flow directions in Fond Canonville and on the east of the Rivière Blanche, close to the coast (red arrows in Figure 3). However, authors disagreed on the direction, either being from north to south or from the block-and-ash flow to the southwest. Using twisted iron bars from the passage of both the May 8th and 20th pyroclastic currents through Fort Cemetery in St Pierre, Boudon and Lajoie (1989) measured the mean direction of N200° supporting the flow direction measurement of Charland and Lajoie (1989) pointing to the crater.
The dynamic pressure of the ash-cloud surge can be estimated from its effects on buildings, especially in St Pierre, following the study of Jenkins et al. (2013). The pressure in the proximal zone of the Rivière Blanche was very high; Lacroix (1904) mentions a total destruction and disappearance of houses and factories along the coast at Fond Coré. Comparing the damage at Merapi volcano (Jenkins et al., 2013), the dynamic pressure likely exceeded 10 kPa in this area. Pressure decreased away from the Rivière Blanche to the periphery of the devastated area, attested by the partial damage observed on infrastructure located in this peripheral zone, especially in St Pierre. Based on the dynamic pressure calculation method of Jenkins et al. (2013) for brick walls (their equation Figure 6B) we can infer that the northern part of the city (i.e., Fort district), for which walls are almost completely destroyed, was exposed to a dynamic pressure greater than 2 kPa. The rest of the city, only partially damaged, was exposed to a dynamic pressure less than 2 kPa, as deduced from the presence of standing walls in the Center and Mouillage districts, and then pressure drops under 1 kPa in the southernmost part of the city attested by the standing cathedral towers in Figures 3C,D. The 2 kPa limit can be approximated by the “annihilation line” of Hill (1902) (represented in Figure 3 by the black dashed line).
Interpretations of the Source Conditions and Dynamics of the Pyroclastic Current
Following these extensive field studies, various interpretations of the May 8th, 1902 pyroclastic current source conditions and its internal dynamics have been inferred. We regroup them in two main theories:
– Highly turbulent ash-cloud surge coming from the crater, the blast: Based on eye-witness accounts (p. 248), Lacroix (1904) interpreted the origin of the pyroclastic current as coming from the collapse of a dark/gray plume above the crater, exiting the crater through the V-shaped outlet. Lacroix’s interpretation was revised by Sparks (1983), after the 1980 Mount St Helens eruption, as a laterally-oriented dome explosion leading to a blast flow, an interpretation that was confirmed a few years later by Boudon and Lajoie (1989); Bourdier et al. (1989), Charland and Lajoie (1989); Lajoie et al. (1989), and Boudon et al. (1990). The blast hypothesis is based on: (1) estimated velocities > 100 m s–1 (Lacroix, 1904; Lajoie et al., 1989); (2) the unusually large size of pyroclasts (several centimeters) transported by the surge (Bourdier et al., 1989; Lajoie et al., 1989; Boudon et al., 1990); (3) the 90° spreading angle of the deposits in a cone-like shape (Sparks, 1983); and 4) the direction of the current in a straight line from the crater outlet (Boudon and Lajoie, 1989; Charland and Lajoie, 1989; Lajoie et al., 1989).
– Ash-cloud surge derived from the block-and-ash flow: a second group championed the idea that St Pierre was destroyed by an ash-cloud surge derived from the block-and-ash-flow. This concentrated flow is thought to have been generated from the collapse of a short column formed by an intra-crater vertical explosion (Fisher et al., 1980; Fisher and Heiken, 1982, 1983, 1990), and then, due to the shape of the crater, was transported into the outlet downstream toward the south. This idea came from Hill (1902) who initially located the source to be approximately at Morne Lenard (2.8 km SW from the current vent, see Figure 3). Later, Fisher et al. (1980) and Fisher and Heiken (1982) re-examined this model finding that the source identified by Hill (1902) corresponds to the source of the ash-cloud surge rather than the source of the block-and-ash flow, which is confirmed by the measurement of cross-bedded flow directions pointing to the Rivière Blanche instead of the crater (thick red arrows, Figure 3). The authors also defended a roll-back movement of the ash-cloud surge around Fond Canonville, where they inferred that the ash-cloud surge flowed up-valley in the opposite direction of the rest of the flow, after being confined in the Rivière Blanche valley by a high ridge (see Figure 3 in Fisher et al., 1980), following flow direction measurements in the cross-bedded deposit (Figure 3).
Missing and Unclear Data
Because of the two differing interpretations outlined above, the exact nature of the eruption source conditions (i.e., lateral dome explosion or column collapse) and the dynamics of the dilute part of the pyroclastic current (i.e., blast or surge) remain unclear and need further clarification in order to better understand the May 8th, 1902 eruption.
Moreover, despite insightful descriptions of the 1902 pyroclastic current deposits, the total deposit volume is still missing. No study has estimated the volume of each separate current (May 8th and 20th, June 6th, or August 30th) as the field studies conducted following the eruption compiled the effects of the individual currents. Tanguy (2004) estimated the lava dome volume, which may have filled the Etang Sec caldera prior to the eruption, at 18–23 × 106 m3. Nevertheless, the total volume of the May 8th pyroclastic current, as well as the volume portions of the block-and-ash flow and ash-cloud surge components, are still unknown.
Numerical Modeling
VolcFlow
The numerical model used in this study is the newer two-layer version of VolcFlow, which was developed to more accurately simulate the dynamics and extent of pyroclastic currents (Kelfoun, 2017). This version was used to simulate: (i) block-and-ash flows and ash-cloud surges at Merapi Volcano (Kelfoun et al., 2017), (ii) surge-derived pyroclastic flows at Soufrière Hills Volcano in Montserrat (Gueugneau et al., 2019), and (iii) for probabilistic hazard assessment at Misti Volcano in Peru (Charbonnier et al., 2020, this issue). The code is based on two coupled, depth-averaged currents: one for the basal concentrated flow (also called block-and-ash flow in this study) and one for the overriding ash-cloud surge. The dynamics of each current are modeled using depth-averaged equations of mass and momentum balance in the x and y directions. The ash-cloud surge requires an additional equation, as density varies in time and space due to loss of mass through sedimentation. The two layers are then coupled and exchange mass and momentum following two exchanges laws (arrows in Figure 5). The complete description of the physical model, the equations, and all the parameters used in VolcFlow are summarized in Supplementary Material. The reader can also refer to Kelfoun (2017) and Gueugneau et al. (2019, Supplementary Material) for detailed code description.
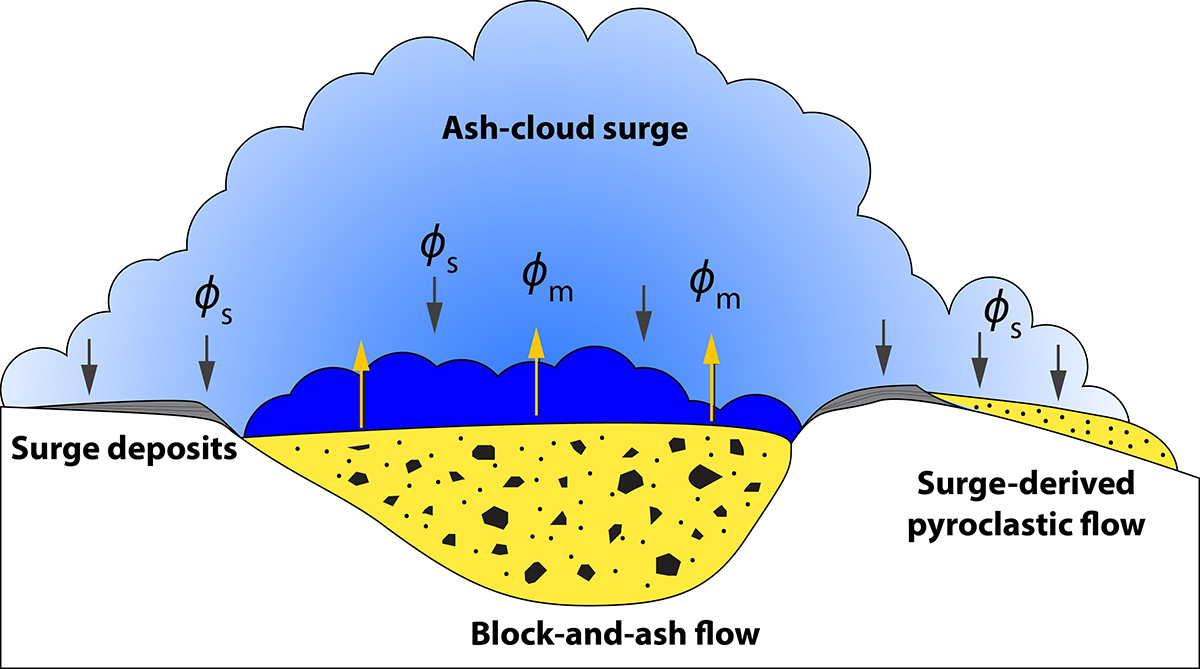
Figure 5. Sketch of the general model of the two-phase version of VolcFlow (Kelfoun, 2017). The first layer simulating the block-and-ash flow feeds the second layer simulating the ash-cloud surge through the mass flux ϕm. The second layer can either settle on the ground to form deposits or surge-derived pyroclastic flows, or incorporate back into the block-and-ash flow following the settling law ϕs.
To simulate stresses applied to the concentrated flow during transport using a depth-averaged approach, the plastic rheological law is used, involving a constant retarding stress T (see Supplementary Material). Despite the lack of physical explanation for applying this rheology to pyroclastic currents, several studies have demonstrated the ability of the constant retarding stress to reproduce various features of such currents and their deposits (Kelfoun et al., 2009, 2017; Kelfoun, 2011; Charbonnier and Gertisser, 2012; Ogburn and Calder, 2017; Gueugneau et al., 2019). The ash-cloud surge is simulated as a turbulent continuum that loses momentum due to turbulent drag stresses.
Topography
To perform the numerical simulations, the Observatoire Volcanologique et Sismologique de Martinique provided a 5 m resolution LiDAR DEM of Martinique Island, constructed in 2012, that was down-sampled to 10 m to save computational time. The original DEM was also cropped to the southwest corner of Mount Pelée volcano, including the crater, the coastline and the city of St Pierre, with an area of 15 × 11 km (red rectangle in Figure 1). Despite the passage of more than a hundred years between the eruption and the DEM acquisition, the topography does not seem to have changed much in this area when compared to Lacroix’s topographic map (p. 223, 1904), with the exception of the summit and the Rivière Blanche valley, which were rapidly filled with the 1902-05 and 1929-32 deposits. Intense erosion by the Rivière Blanche has carved a new channel through the soft pyroclastic deposit, deepening the valley floor to a pre-1902 depth.
Source Conditions and Input Parameters
Despite the current debate regarding the source conditions that generated the May 8th pyroclastic current (i.e., either column collapse or dome collapse), a common feature of both scenarios is that all the pyroclastic current volume was constrained within crater outlet. The crater shape seems to have reoriented the expansion of the fragmented material into this V-shaped outlet. In order to numerically reproduce these source conditions as accurately and realistically as possible, the DEM of the summit area was artificially modified to reproduce the topography of the Etang Sec caldera, as estimated by Lacroix (1904), Chrétien and Brousse (1989), and Tanguy (1994). This caldera is approximated in the DEM by a bowl-shape of 860 m wide for 300 m deep, and centered roughly on the 1929 lava dome, as illustrated in Figure 6. With this modification, the outlet on the southern part of the crater rim is reconstructed at the same location as it was prior to May 1902 (Figure 6). Because of all the uncertainties related to the source conditions during the May, 8th 1902 eruption, the source of our simulation was simplified to a constant volume rate supplied for a duration Δt directly into the synthetic crater. This simplified source can thus model the collapse of either a short column or a lava dome. The volume rate is calculated by dividing the total volume of material supplied in the crater Vini by the duration Δt (Figure 6C, orange curve). Consequently, the mass accumulates in the crater until its level reaches the lowest elevation point of the crater rim, the V-shaped outlet (Figure 6), and overflows, leading to the formation of the block-and-ash flow channelized in the Rivière Blanche valley. The resulting overflow is self-regulated and dependent on the supply rate in the crater, as illustrated in Figure 6C (blue curve). Since the total volume of the eruption is unknown, the input values for the initial volume of material Vini and the supply duration Δt (ranges shown in Table 2) were explored by trial and error to determine the most realistic value, following the calibration procedure described in the next section. Because of the synthetic crater, a large part of the deposit volume remains stuck inside the depression and does not feed the simulated pyroclastic current. Therefore, we distinguished the volume of material supplied in the crater Vini to the total volume of deposit V that escaped through it to constitute the pyroclastic current. The best-fit simulation was obtained with an initial volume of material supplied in the crater Vini = 45 × 106 m3 during Δt = 200 s yielding a total deposit volume V = 32 × 106 m3 and a volume of material remaining in the crater of 13 × 106 m3.
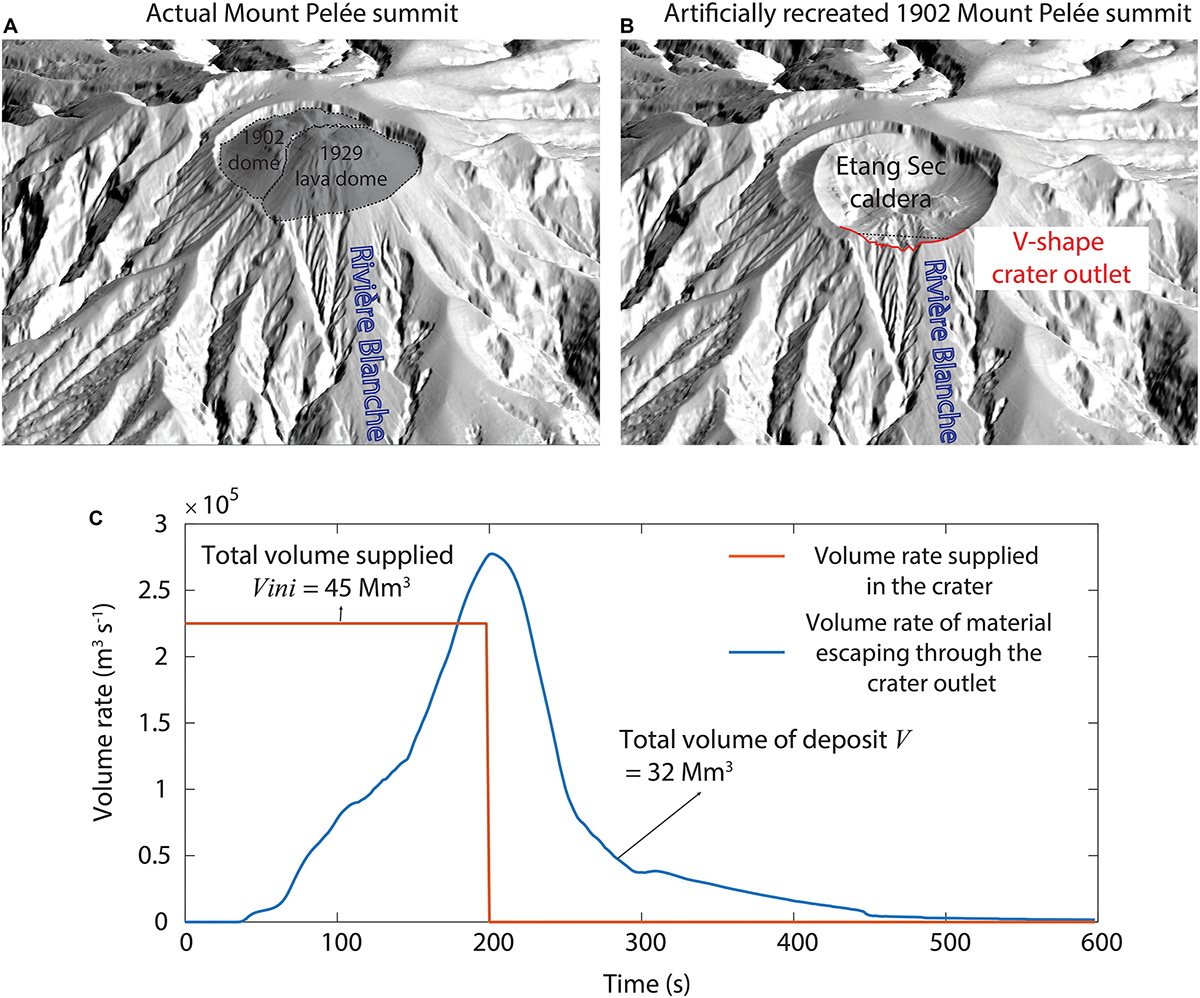
Figure 6. Illustration of the digital topographic modifications performed for this study between the actual Mount Pelée summit (A) and the DEM used in the simulations with the new synthetic 1902 Etang Sec caldera topography (B). The red line in B highlights the position of the newly formed V-shape crater outlet. (C) Illustrates the variation of the volume rate supplied in the crater (red line) and the resulting volume rate of block-and-ash flow that overflows to the Rivière Blanche through the crater outlet (blue line) during the VolcFlow simulations.
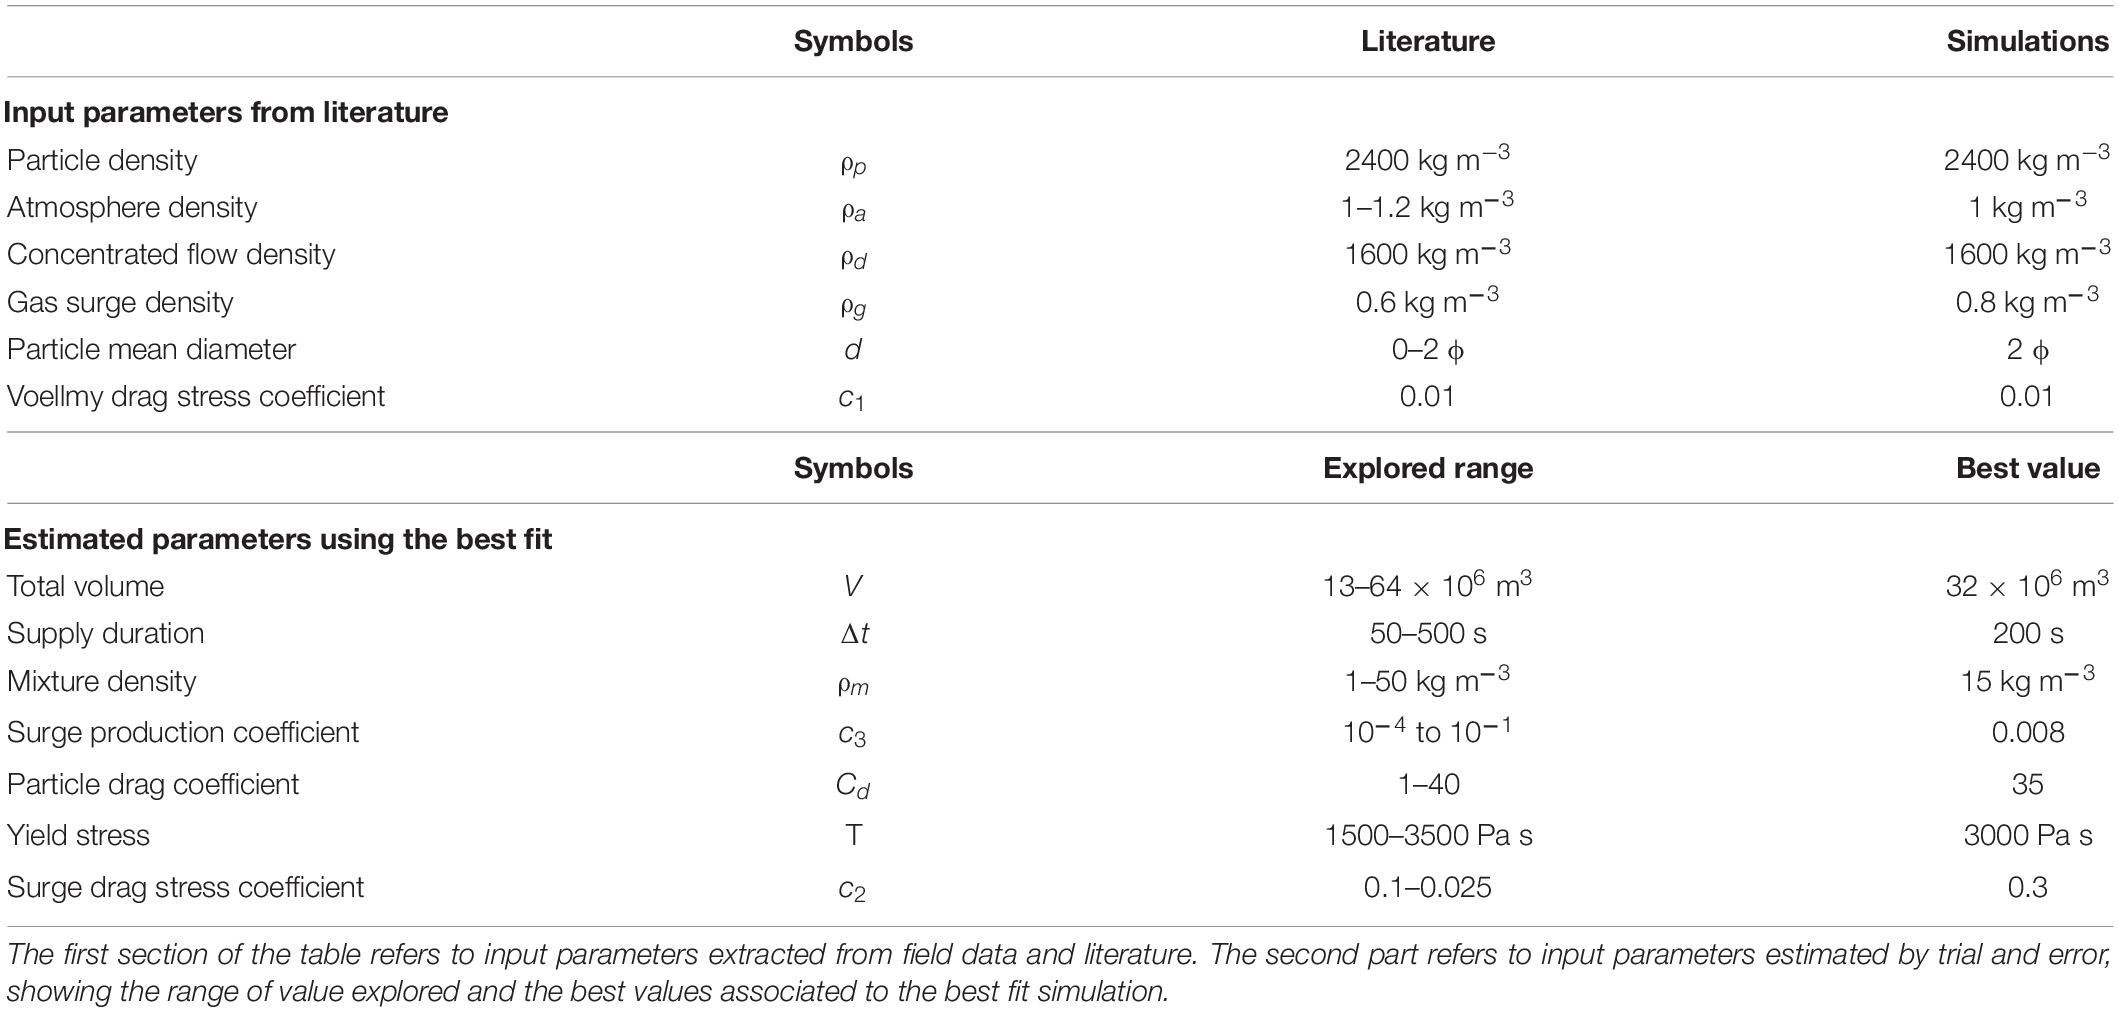
Table 2. Input parameters for the best-fit VolcFlow simulation presented in Figure 7.
Only the scenario of Fisher et al. (1980) was tested, with the ash-cloud surge generated solely by the block-and-ash flow coming from the crater outlet, and its feasibility and realism in reproducing the real flows is assessed. The formation and development of the simulated ash-cloud surge is dictated by the surge production law [ϕm (Eq. 9), Supplementary Material], which is a function of the velocity of the concentrated flow. Consequently, the higher the block-and-ash flow velocity, the higher the surge production. The simulated ash-cloud surge then evolves with its own dynamics and spreads laterally around the Rivière Blanche as it is less sensitive to the topography than the valley-confined concentrated flow. To model such complex dynamics of the pyroclastic current, the code requires 11 input parameters for each simulation (see Supplementary Material). Six parameters were extracted from field data or the literature: particle density ρp, atmosphere density ρa, concentrated flow density ρd, gas surge density ρg, particle mean diameter d, and Voellmy drag stress c1 (values presented in Table 2) (see Gueugneau et al., 2019). The other five parameters, the initial volume, the surge production parameter c3, the constant retarding stress of the concentrated flow T, the density of the mixture transferred from the concentrated flow to the surge ρm, the surge drag stress c2, and the particle drag coefficient Cd, are empirical or unconstrained from field data and must be adjusted by trial and error. Each of these parameters has a clear influence on the morphology of the simulated flows and on the resulting deposit footprint, which makes it relatively easy to estimate the best fit. To better see the influence of each parameter on the model dynamics, the reader can refer to Kelfoun et al. (2017) and Gueugneau et al. (2019, Supplementary Material) for two examples of a comparative table highlighting the sensitivity of simulated flows to each of these parameters, for similar small-volume pyroclastic currents.
Quantification of the Differences Between Model and Observed Data
To quantitatively evaluate the simulation results and to identify a best fit simulation, the differences between simulated and observed flows are calculated using validation metrics, which compare areas inundated by the simulation (Asim) to the real deposit (Aobs). The matching area between simulated and observed flows is called true positive (TP), the over-simulated area is called false positive (FP) and the missing simulated area is called false negative (FN). Three coefficients were used:
(1) the Jaccard similarity coefficient (RJ) uses TP and the union of areas inundated by observed and simulated flows:
(2) the model sensitivity (RMS) uses TP and the area inundated by simulated flows:
(3) the model precision (RMP) uses TP and the area inundated by observed flows:
The reader can refer to Charbonnier et al. (2018) for a more detailed description of these metrics. Values obtained for the best-fit simulation are included in Table 3.
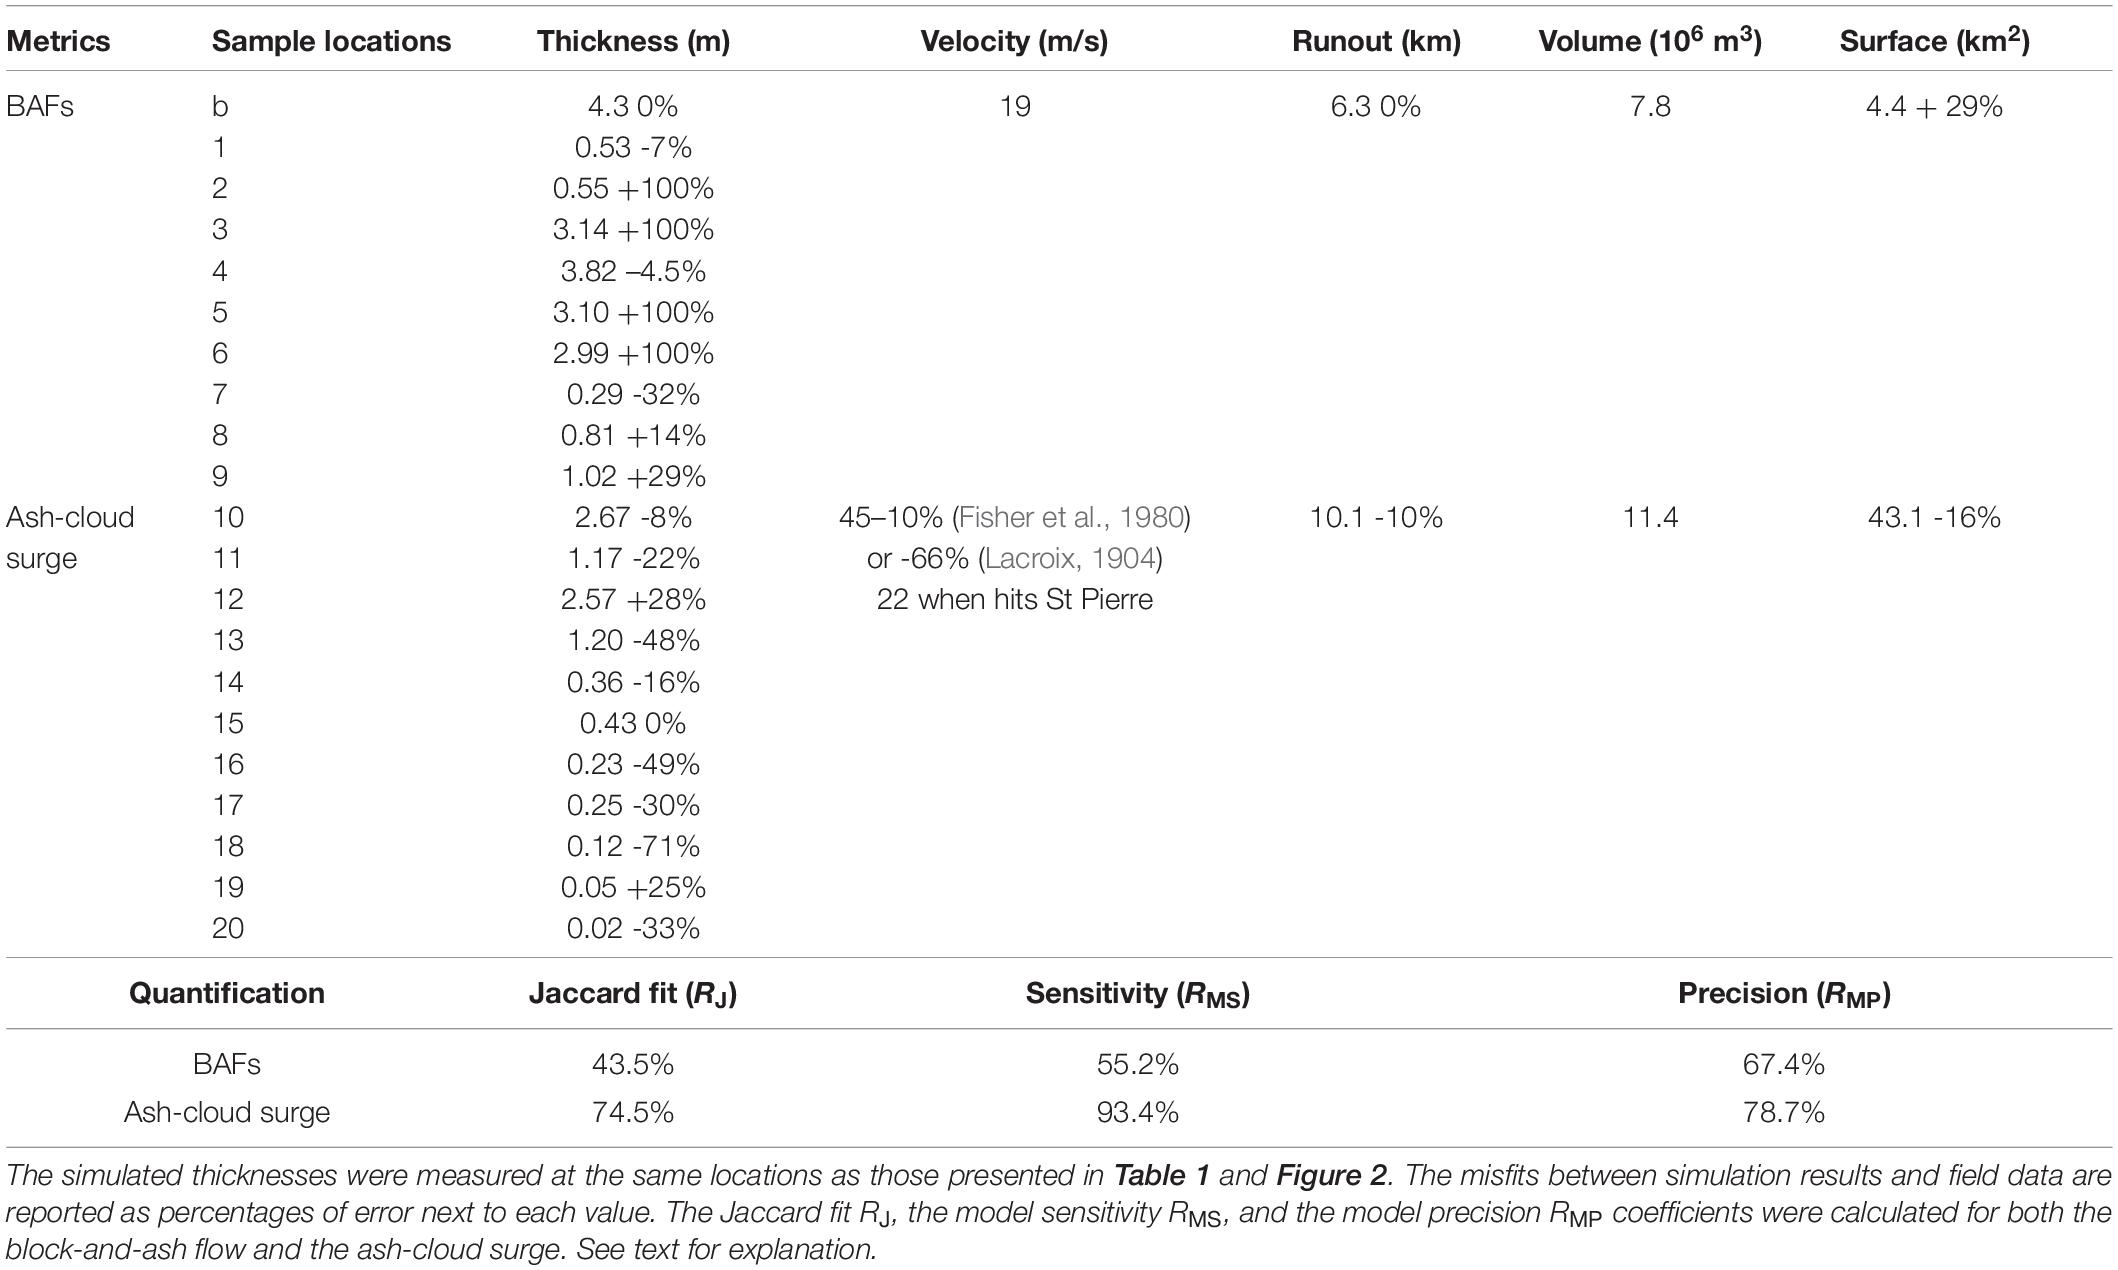
Table 3. Values of validation metrics used for evaluating the best-fit simulation.
For more than a hundred simulations of 10–20 h each, seven unconstrained input parameters (Table 2) were adjusted to obtain a combination of highest possible values for the three metrics, obtained for the 90th simulation. The volume of material in the crater and the supply duration are first adjusted by matching the general aerial distribution and thicknesses of the simulated deposits to the real one. Then, the surge characteristics (production and sedimentation parameters) as well as the constant retarding stress of the concentrated flow are adjusted to find the combination of highest values for the three metrics for the area covered by the ash-cloud surge only. The choice to focus primarily on the ash-cloud surge was motivated by the fact that: (1) its extent and limits, as extracted from the field, are based on robust evidence and therefore only contain small uncertainties, and (2) it covered a much larger area than the block-and-ash flow, restricted to valleys. In addition, other flow/deposit parameters like deposit thicknesses, flow velocities and runouts are compared to those measured in the field (Table 1).
Volcflow Simulation Results
Extent and Thickness
Overall the fit was good between the area covered by the simulated ash-cloud surge and the real one (Figure 7), as shown by the high values obtained for all three metrics used (>75% for the ash-cloud surge Jaccard fit, Table 3). However, the maximum runout in the south of St Pierre is underestimated where the simulated ash-cloud surge traveled 600 m less that the real flow. Also, a large part of the area inundated by the ash-cloud surge around the northern part of the crater is not reproduced by the simulations. Since the location of the initial mass flux in the simulations was set to be in the southern crater outlet, the simulated ash-cloud surge derived from the block-and-ash flow in the proximal area was unable to spread northward and inundate that part of the crater.
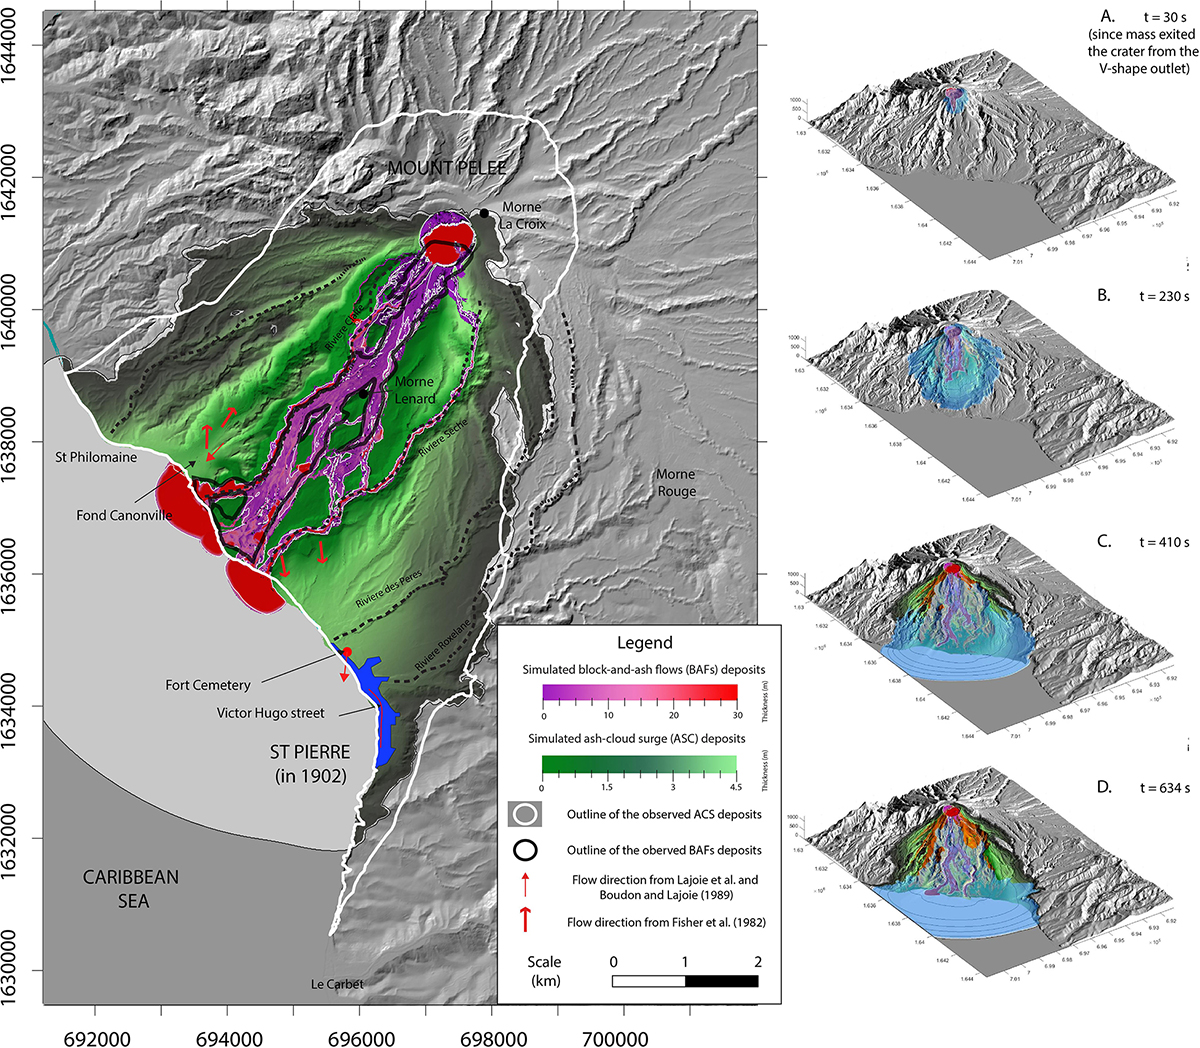
Figure 7. Results of the best fit simulation obtained using the input parameters presented in Table 2. (A) Final distribution of the simulated deposits from the best-fit simulation, which include the extent of the simulated ash-cloud surge (green color scale for the thickness) and the simulated block-and-ash flow (pink color scale). For ease of comparison, outlines of the observed ash-cloud surge and block-and-ash flow, as extracted from the field, have been added with a white and black outline, respectively. (B–E) Sequence of four snap shots of the best-fit simulation at 30, 230, 410, and 634 s after the mass starts to overflow through the crater outlet, showing the propagation of the flows overlain on the DEM.
Comparisons between the simulated surge deposit thicknesses with those measured at 20 locations in the field (Bourdier et al., 1989) show relatively good agreement (Table 3). Apart from some model overestimations in Fond Canonville area (locations 2–6), simulated surge thicknesses are less than ±50% of error. Surge velocities are either in good agreement or underestimated by a factor of 3, depending on the reference value taken (Table 3) but are within the typical range of 40–90 m s–1 for ash-cloud surge estimations elsewhere (Calder et al., 1999; Cronin et al., 2013; Ogburn et al., 2014). The simulated surge requires 330 s to reach St Pierre, more than twice Lacroix’s estimation (around 120 s), and travels through the entire city in roughly 200 s (see Figures 7A–D).
The block-and-ash flow simulation also provides a relatively good fit (Figure 7), although the values obtained for the three validation metrics are lower than for the surge (between 43 and 67%). Indeed, the simulated flow inundated an area similar to the real flow (with a model precision coefficient of 67.4%) but with a few false positives, leading to a total surface 30% larger and therefore to a lower Jaccard fit coefficient (43%). Nevertheless, four important block-and-ash flow features observed in the field and reproduced in the simulation paradoxically highlight the success of the simulation: (i) the confinement of the block-and-ash flow in the Rivière Blanche, (ii) the divergence of the flow into two branches at the passage of Morne Lenard, (iii) the presence of two deposit-free pockets on the southwest of Morne Lenard and on the east of the Rivière Blanche valley along the coast, and (iv) a relatively constant average deposit thickness of a few meters along the inundated area that increases close to the sea and gives a delta-like shape to the deposit. The simulated block-and-ash flow travels at an average velocity of 19 m s–1, relatively common for this type of flow, as described elsewhere (Calder et al., 1999; Ogburn et al., 2014).
Surge Dynamic Pressure and Direction
Figure 8 presents the maximum dynamic pressure and the mean direction of the ash-cloud surge extracted from the best-fit simulation. In VolcFlow, the dynamic pressure Pdyn is calculated following Valentine (1998):
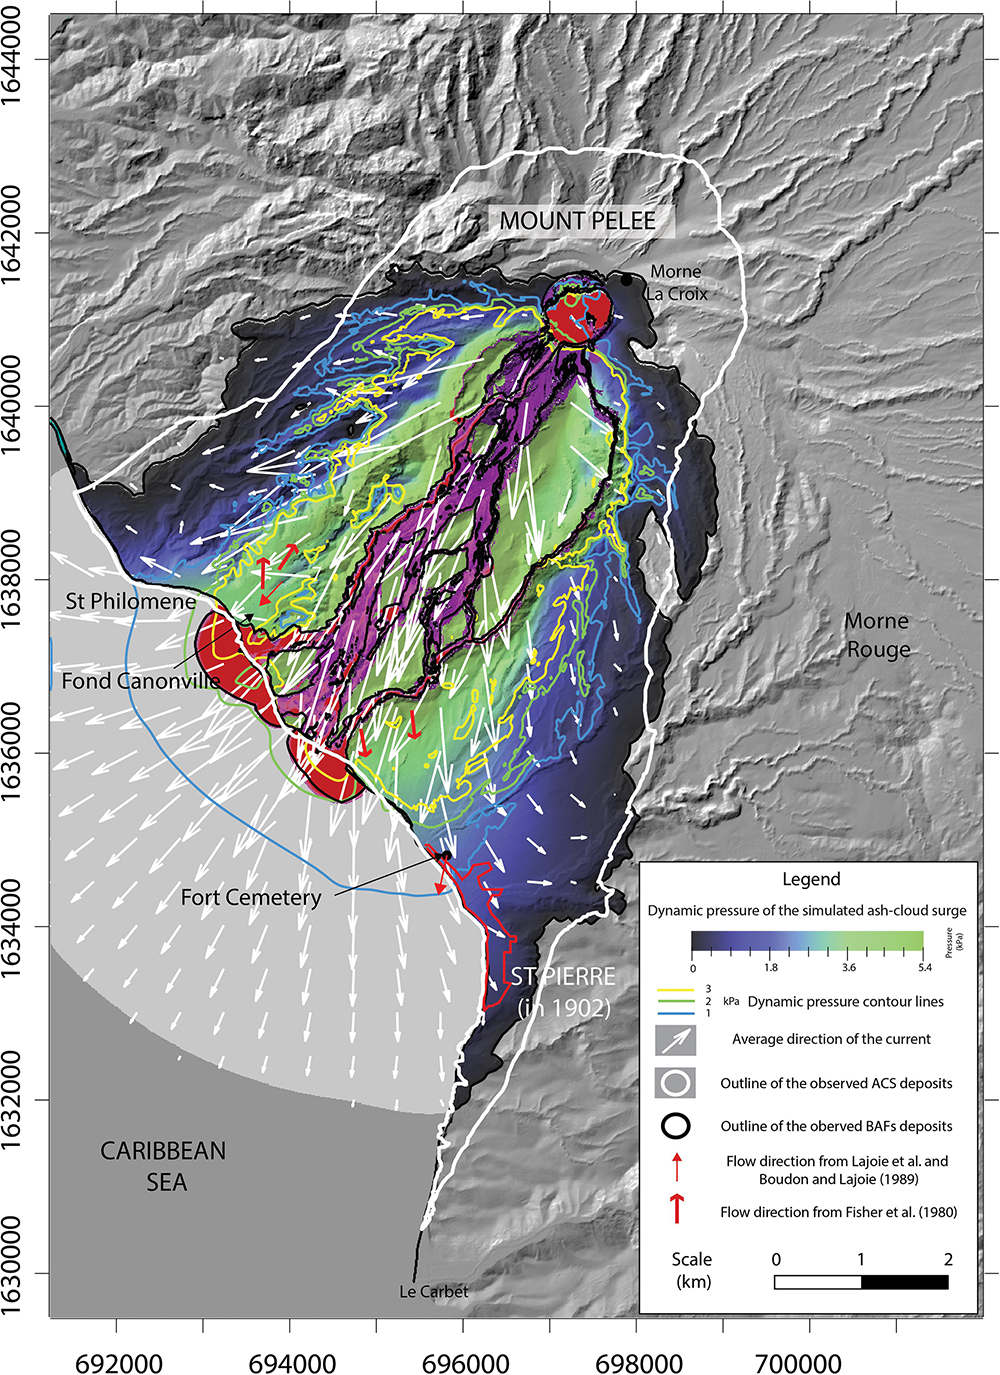
Figure 8. Map of the maximum dynamic pressure and a mean direction of the ash-cloud surge from the best fit simulation. The distribution of the dynamic pressure is shown as a color scale, and isobar lines indicate the 1,2 and 3 kPa (blue, green and yellow lines, respectively) pressure fields. The average direction of the current is represented by white arrows, whose lengths correspond to the velocity of the ash-cloud surge, calculated from the center of the arrow.
where v is the velocity of the simulated surge and ρsits density. Because the ash-cloud surge is generated from the block-and-ash flow during its transport downstream, the variation of its dynamic pressure follows the path of the Rivière Blanche. Values gradually decrease from more than 5 kPa toward the block-and-ash flow to a few Pa only toward the edges. This gradual pressure decrease is not linear and accelerates with distance from the Rivière Blanche, indicated by the presence of clustered isobar lines from 3 to 1 kPa over a few hundred meters which contrasts with those < 1 kPa that spread over an area 2 or 3 times larger (Figure 8). This pattern was also observed at Merapi volcano by Jenkins et al. (2013) and Kelfoun et al. (2017). The mean direction of the simulated surge is radially dispersed around the block-and-ash flow and perfectly matches the direction measured in the field by Fisher et al. (1980) to the east of the Rivière Blanche and those measured by Charland and Lajoie (1989) to the west. However, the model does not match the backward direction measured by Fisher et al. (1980) at Fond Canonville. Toward the east, especially in the St Pierre area, flow directions slowly change from south to southeast as the simulated surge expanded eastward. The same observation can be made on the western side of the area inundated by the surge with a flow direction that changes from southwest to west. The passage of the simulated ash-cloud surge over the flat sea surface promotes its lateral spreading as it covers a larger area to the west of St. Philomène and to the south toward St Pierre, giving a pear-like shape to the inundated area.
To better investigate the behavior of the simulated ash-cloud surge toward St Pierre, Figure 9A shows a snapshot of the simulated flow dynamics in this area over the DEM while Figure 9B superimposes these simulation results and field observations over the topographic map of St Pierre in 1902 from Lacroix (1904). The external, low dynamic pressure zone of the simulated surge (with a maximum pressure of 1.5 kPa) reaches only the northern part of the city, whereas field estimations made in 1902 give values of more than 2 kPa at this location. In Figure 9B, the Hill’s annihilation line should roughly correspond to the 2 kPa dynamic pressure field, but our simulations give a maximum dynamic pressure of only 1 kPa at this location (blue line in Figure 8). Thus, the dynamic pressure in St Pierre seems to be underestimated by the model compared to field observations. Concerning the surge direction toward St Pierre, we notice that the western deflection of the current by the sea seems to be counterbalanced by the topographic barrier to the east of the city, from Morne Abel to Morne d’Orange (Figure 9A). In this area, the surge direction changes from southeast to south as it propagates toward the southern part of the city (Figures 7A,B), matching approximately the direction of the Victor Hugo street (red line) as observed by Lacroix (1904). However, the mean direction of the simulated surge does not match the surge direction measured in Fort Cemetery by Boudon and Lajoie (1989). In summary, after entering the sea at Fort district, the simulated surge is first deflected to the east toward St Pierre, and then further deflected to the south by the hills on the east of St Pierre (south of Morne Abel, Figure 8). The direction of the simulated surge seems to be highly variable when it passes through St Pierre due to high turbulence induced by the complex pattern of the city infrastructures.
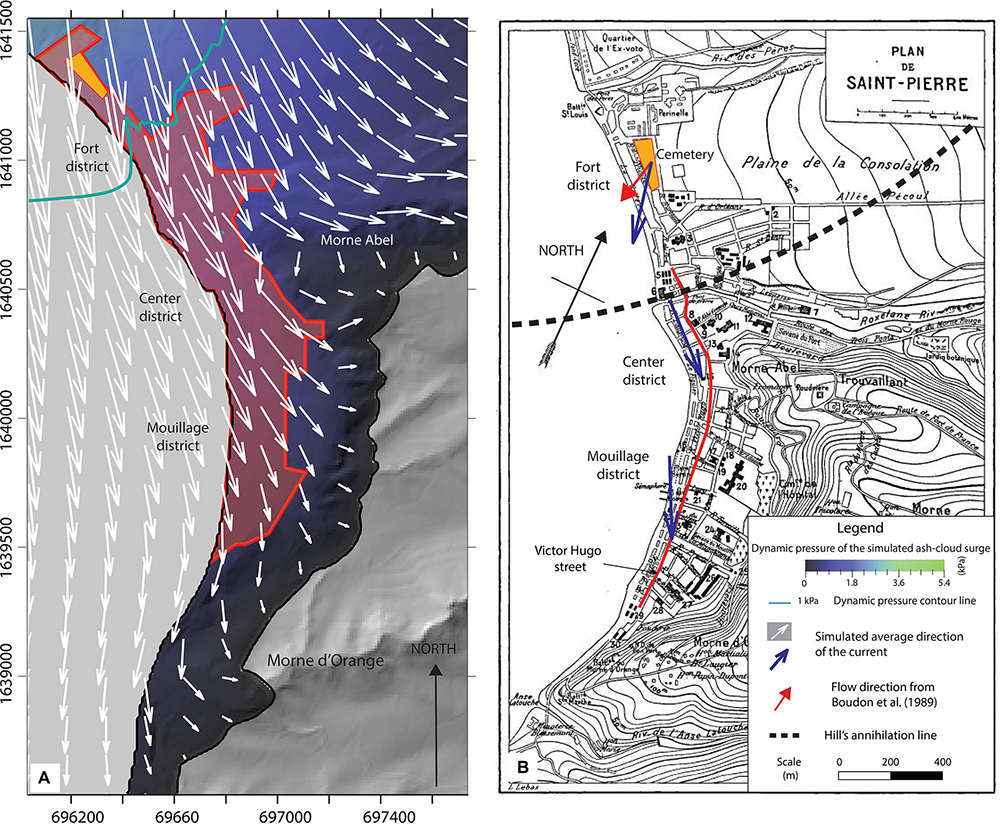
Figure 9. Zoom of St Pierre’s area showing the maximum dynamic pressure and the mean direction of the ash-cloud surge from the best-fit simulation: (A) superimposed over the DEM and polygon of the city as mapped by Lacroix (1904), (B) superimposed over the topographic map of the city, showing directions of the simulated current (blue arrows) facing Victor Hugo street (red line).
Flow Volumes: Total Mass Flux and Mass Flux Released in the Sea
When the simulated block-and-ash flow entered the sea, it formed unrealistic thick and large lobes (Figure 7). Because the sea corresponds to a planar surface of 0 m elevation in the DEM, it causes a brutal break in slope at the coastline and a strong deceleration of the block-and-ash flow, artificially increasing the flow thickness in the coastal area around the Rivière Blanche, the Rivière Claire and the Rivière Sèche. At the end of the simulation, the total volume deposited on land represents 19 × 106 m3, whereas the volume accumulated offshore is 13 × 106 m3, representing more than a third of the total deposit volume. The offshore volume was deposited within ∼1000 s, with an estimated average volumetric rate of material of 13,000 m3 s–1 carried offshore.
Interpretation: New Insights to the Eruptive Model
Reproduction of the First-Order Dynamics and Deposit Characteristics
The good fit obtained between our simulations and the May 8th, 1902 pyroclastic current deposits seems consistent with a depositional model where a channelized block-and-ash flow emplaced in the Rivière Blanche progressively filled the valley with thick deposits, together with an unconfined ash-cloud surge that spread laterally to produce a relatively thin deposit that thinned away from its source. Focusing all the mass through the crater outlet as the primary source condition for our simulations, as previous workers have commonly hypothesized from field observations, results in good correlations with the real event. The resulting self-regulated volume rate (Figure 6), generated by passive overflowing of the mass through the lowest elevated part of the crater rim, produces a realistic simulated pyroclastic current. The direction of the ash-cloud surge seems to corroborate quite well with the field direction measurements and the damage in St Pierre. However, simulations did not reproduce the up-valley movement of the surge at Fond Canonville, inferred by Fisher et al. (1980). The simulated ash-cloud surge was not confined in the Rivière Blanche valley and inundated the Fond Canonville area with a north-east to south-west direction, consistent with the measurements of Charland and Lajoie (1989) and Lajoie et al. (1989). Charland and Lajoie (1989) questioned the reliability of the flow directions measured by Fisher et al. (1980), pointing out that directions measured in a cross-bedded deposit are strongly dependent on the methodology used. But beyond these conflicting measurements, the landward flow direction obtained by Fisher et al. (1980) could also be explained by the rapid thermal expansion of the surge entering the sea, flashing seawater into steam and generating a landward dilute current, as described by Herd et al. (2005) at Montserrat, or by Dufek and Bergantz (2007) for the Kos Plateau Tuff eruption. Unfortunately, if such a process had occurred, our simulations did not capture it because VolcFlow does not model such flow temperature and energy variations.
While the deposit extent and paleo-current directions are well reproduced by our simulations, the dynamic pressure seems to be underestimated. Given the equation used here to calculate the dynamic pressure (Eq. 4), either the velocity of the simulated surge v or its density ρs are underestimated. Simulated flow velocities seem to be accurate if we compare them with the field estimations from Fisher et al. (1980) but are underestimated compared to the estimated value of 150 m s–1 given by Lacroix (1904). Underestimation of the dynamic pressure could also be explained by an underestimation of the surge density at the base of the flow. In fact, the shallow-water modeling approach used in VolcFlow implies the use of an averaged density across the entire current depth, which provides accurate reproduction of the general surge dynamics but constitutes an important simplification from natural density-stratified surges (Valentine, 1987). Therefore, the actual density at the base of surges (the part that interacts with buildings) is much higher than a depth-averaged value. This density difference could potentially explain the resulting underestimation of the dynamic pressures in our simulations.
In order to reproduce the actual runout of the ash-cloud surge, the particle drag coefficient Cd used in our simulations had to be set to an unrealistically high value (see Table 2). In fact, the chosen value of 35 does not match any previous estimation of this coefficient for volcanic particles (0.47–1; Dellino et al., 2005) and is overestimated by a factor of at least 30. Cd has been tuned in our model because it is the only parameter linked to the settling velocity (Eq. 11, Supplementary Material) that can be modified to change the sedimentation rate, with the mean grain size d already considered the smallest value recorded in the deposit (2ϕ). With a smaller settling velocity, the simulated ash-cloud surge settles much slower, keeping particles in suspension for a longer time, and subsequently covers a larger area before becoming buoyant. Therefore, some process seems to have hindered sedimentation in the May 8th pyroclastic current. A similar process has already been inferred for the simulation of the November 5th, 2010 pyroclastic current at Merapi by Kelfoun et al. (2017) for which the occurrence of a blast-like phase is also discussed (Charbonnier et al., 2013; Komorowski et al., 2013). However, no such issue arises when a similar approach was used to simulate the June 25th, 1997 pyroclastic currents at Soufrière Hills Volcano (Gueugneau et al., 2019), where no blast-like phase is mentioned. Different hypotheses are proposed to explain the hindering of the sedimentation: (i) if the base of the May 8th, 1902 ash-cloud surge was relatively dense, as suggested by the high dynamic pressures obtained from field observations, particle settling in the density-stratified surge could have been reduced and particles transported further away (i.e., hindered settling, Druitt, 1995). The factor of 30 obtained for the best-fit value of Cd could be applied to the surge density instead, thus giving similar modeling results. (ii) the air entrainment and subsequent thermal expansion of the ash-cloud surge, neglected in VolcFlow, can also reduce the sedimentation and increase the runout of the current, as suggested by Bursik and Woods (1996); Doyle et al. (2008) and demonstrated numerically by Benage et al. (2016). With the inability to reproduce thermal effects in our model, neglecting air entrainment might be limiting, especially at Mount Pelée where the presence of high ridges can enhance air entrainment, as Andrews and Manga (2011) have demonstrated experimentally. Moreover, the resuspension of soft material (i.e., ash), deposited with the onset of the 1902 eruptive phase, can also enhance air entrainment in the surge. Further model development is needed to include air entrainment in VolcFlow and to investigate whether this process has a significant influence on the dynamics of two-layer, depth-averaged simulated currents, as recently proposed by Shimizu et al. (2005) with their model.
Despite such approximations and simplifications made in the model, the VolcFlow simulations allow us to discuss the first-order dynamics controlling the main behavior of the May 8th, 1902 Mount Pelée pyroclastic current. The model of Fisher et al. (1980) tested in this study, inferring a surge formation from the concentrated flow, seems adequate to reproduce the pear-like shape of the area inundated. This proves that most of the surge production has to be initiated outside of the crater, along the Rivière Blanche, with a peak after Morne Lenard, as discussed by Fisher and Heiken (1982). To illustrate the importance of generating a surge along the Rivière Blanche, an additional VolcFlow simulation was performed, in which the surge production from the block-and-ash flow is suppressed. Instead, the two different layers of the simulated pyroclastic current (i.e., ash-cloud surge and block-and-ash flow) are supplied independently into the synthetic crater, with the same duration and volumes as those obtained from the best-fit simulation outlined above (i.e., 11.4 × 10⁶ m3 for the ash-cloud surge and 20.8 × 10⁶ m3 for the block-and-ash flow, including the 13 × 106 m3 stuck in the crater). Results of this complementary simulation (Figure 10) show that without a surge production along the Rivière Blanche valley, the ash-cloud surge is unable to reach St Pierre. Indeed, the simulated surge spreads radially around the crater without following the southward spreading of the block-and-ash flow. The development of a significant portion of the surge in the Rivière Blanche is likely facilitated by the crater outlet. Moreover, the shape of the simulated ash-cloud surge area differs from the pear-like shape characterizing our best-fit simulation as well as the May 8th, 1902 surge area (Figure 8). The progressive generation of an ash-cloud surge during the southward propagation of the main block-and-ash flow seems to be the more suitable process to explain both the shape of the inundated area and maximum runout of the surge toward St Pierre, as inferred by previous field investigations (Fisher et al., 1980; Fisher and Heiken, 1982). Thus, this also shows that simulating only one of the two conflicting scenarios to investigate the dynamic of the May 8th, 1902 pyroclastic current was satisfactory. Indeed, regarding our results, simulating the pyroclastic current as a blast flow appears to be unnecessary since a blast is exclusively formed in the crater, as the complementary simulation, and would probably have been unable to reproduce the pear-like shape of the surge deposit.
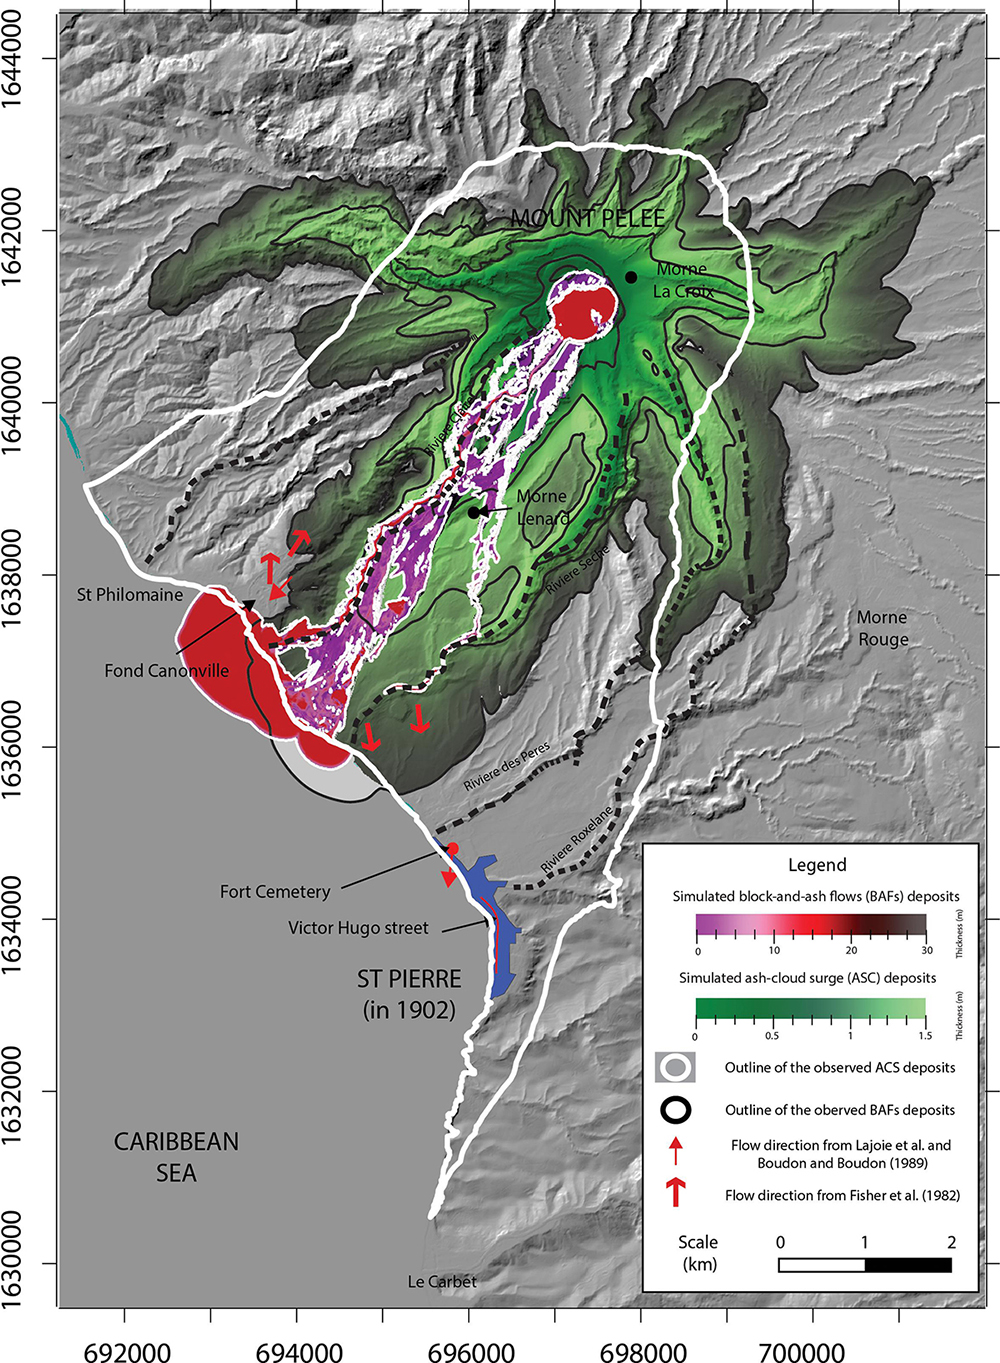
Figure 10. Result of a complementary simulation with the ash-cloud surge and the block-and-ash flow supplied directly into the crater, without any surge production from the block-and-ash flow during the transport. The source conditions are adapted to supply 11.4 × 10⁶ m3 of ash-cloud surge and 20.8 × 10⁶ m3 of block-and-ash flow for the same duration (i.e., 200 s).
Another interesting outcome of the complementary simulation (Figure 10) is that the vertical mass flux in the crater generated a surge covering the northern part of the crater, although it does not accurately match Lacroix’s outline. A source with an initial vertical component, like an explosion, that collapses and spreads volcanic products radially around the crater seems to be required in order to inundate this area. This corroborates witnesses’ accounts of the eruption collected by Hill (1902) and Lacroix (1904) from the Morne Rouge village. If an explosion had occurred on May 8th 1902, it was most likely from the sudden decompression of a dome, resulting in a block-and-ash flow deposit similar to those described at Merapi (Charbonnier et al., 2013; Komorowski et al., 2013), Colima (Macorps et al., 2018), Soufrière Hills Volcano (Calder et al., 1999; Loughlin et al., 2002), or Unzen (Ui et al., 1999). Thus, we hypothesize that the source of the May 8th, 1902 pyroclastic current was most likely an explosive dome collapse, during which the shape of the crater enhanced the lateral spreading of the pyroclastic current by redirecting the products of the explosion through the crater outlet to the south. The remaining portion of the vertical jet formed during the explosion collapsed, providing enough lateral momentum for a dilute current to form and overflow the northern rim of the crater, inundating a small area downslope before rapidly stopping and becoming buoyant.
May 8th Pyroclastic Current Dynamics: The Blast Discussion
The occurrence of a blast during the May 8th, 1902 eruption has been strongly debated (Fisher and Heiken, 1983, 1990; Sparks, 1983; Boudon et al., 1990). The idea of a blast like Mount St Helens was first rejected by Fisher and Heiken (1983, 1990), mainly from field evidence (i.e., discordant flow directions, slower flow velocities, differences in deposit facies between the 1902 surge deposit and the blast deposit from May 18th, 1980 at Mount St Helens) but later supported by Boudon and Lajoie (1989); Bourdier et al. (1989), Lajoie et al. (1989), and Boudon et al. (1990) (using a different stratigraphy, flow directions and velocities). When using the more recent blast description of Belousov et al. (2007), the May 8th, 1902 pyroclastic current appears to be clearly different from the Mount St Helens blast: the debris avalanche deposit as well as layer A are missing in the stratigraphy, the area covered is one order of magnitude lower (51 km2 instead of 623 km2 for Mount St Helens, Lipman and Mullineaux, 1981), the flow volume is much smaller (32 × 106 m3 instead of 94 × 106 m3, Lipman and Mullineaux, 1981) and the shape of the area is relatively different too.
Paradoxically, discarding the hypothesis of a violent decompressive phase as a source condition for the May 8th, 1902 pyroclastic current is limiting. In fact, the May 8th, 1902 pyroclastic current exhibits remarkable features that can be attributed to a decompressive blast-like event as described nowadays:
– The northern part of the crater requires a source with an initial vertical component to be inundated, compatible with a short burst phase.
– The ash-cloud surge deposit facies from May 8th, 1902 at Mount Pelée is similar to the deposit facies of units U1L1 and U1L2 from the November 5th, 2010 Merapi unconfined deposit, which was interpreted as a low intensity blast by Komorowski et al. (2013). The lower unit in the May 8th deposit is composed of relatively coarse particles, which require a high level of turbulence to be sustained in suspension for a long time (Lajoie et al., 1989) and is fine-depleted, as is the unit U1L1 at Merapi. Moreover, even if the deposit stratigraphy does not match the blast stratigraphy of Belousov et al. (2007) exactly, the lower and middle unit of the May 8th, 1902 deposit (and the U1L1 and U1L2 units at Merapi) are in fact relatively close to their B and C units.
– The mass flux of material released at the source and needed to correctly simulate the May 8th, 1902 pyroclastic current is comparable to mass fluxes calculated during previous blast-like events. The average volume rate of overflowing material calculated from the blue curve in Figure 6C is 64 × 103 m3 s–1 with a density ρd = 1600 kg m–3 yielding a mass flux of 108 kg s–1, similar to the 108 kg s–1 deduced at Soufrière Hills Volcano for the December 26th, 1997 event (Sparks et al., 2002) or to the 107–108 kg s–1 calculated at Merapi for the November 5th, 2010 eruption (Komorowski et al., 2013; Kelfoun et al., 2017), and much higher than the average mass rate for a regular dome-collapse pyroclastic current at Soufrière Hills in June 25th, 1997, estimated at 8 × 10⁶ kg s–1 (Loughlin et al., 2002; Gueugneau et al., 2019).
In summary, a few arguments support the fact that the initiation of the May 8th, 1902 pyroclastic current could have been partially driven by a decompressive blast-like phase, however, most of the characteristics of the current and its deposits are accurately reproduced by an ash-cloud surge generated from the block-and-ash flow, for which the surge production increases gradually with the spreading of the concentrated flow. Since our model is currently unable to simulate a laterally-directed blast and its associated initial burst phase, our results show instead that: (i) such a lateral explosion was not a compulsory component of the source conditions needed to correctly reproduce the characteristics of the May 8th pyroclastic current numerically, and (ii) the May 8th events can be modeled with relatively simple physics, commonly attributed to small-scale eruptions generating small-volume pyroclastic currents. A sudden decompression of the lava dome with a small vertical component could have likely taken place in the first few seconds of the eruption, explaining the presence of surge deposits on the northern part of the upper flank of the volcano, as well as the coarser nature of the basal layer in the deposit sequence, likely responsible for the high dynamic pressure of the distal surge. However, this potential initial blast-like phase at Mount Pelée does not compare with the May 18th, 1980 Mount St Helens blast sequence. Moreover, with such a short period between the May 20th pyroclastic current and the May 8th event with similar characteristics, it seems unlikely and too complex for a new pressurized and voluminous lava dome to grow and generate another blast (the pressurized phase was estimated at a few months at Soufrière Hills, 1997; Sparks et al., 2002). The May 8th, 1902 pyroclastic current may fit instead inside a spectrum between a blast (i.e., Belousov et al., 2007 definition) and an ash-cloud surge commonly associated with small-volume pyroclastic currents, most likely within the low-intensity, third group of blast-like events as defined by Komorowski et al. (2013). The physical behavior of such a blast is likely not dissimilar to one of a simple ash-cloud surge. This idea is reinforced by the work of Esposti Ongaro et al. (2008, 2012) demonstrating that, even if the December 26th, 1997 Soufrière Hills blast and the May 18th, 1980 Mount St Helens blast started with a decompression phase (burst phase), they quickly collapsed and transformed into powerful turbulent ash-cloud surges (PDC phase) in only a few tens of seconds.
Estimating the Total Volume of the Pyroclastic Current Deposit
Using results from our numerical simulations, we found 32 × 106 m3, including 19 × 106 m3 on land, to be the best input value for total deposited volume needed to reproduce the extent and thickness of the observed deposits. This corresponds, to our knowledge, to the first estimation of the total volume of the May 8th, 1902 pyroclastic current deposit. Nevertheless, because of the simplified physics used in our model, this value should be considered with caution and rather corresponds only to a first-order estimation. A rounded value of 30 × 106 m3 can be used as an order of magnitude for comparison. Nevertheless, the relatively good correlations of the best-fit simulation with the observed deposit in terms of thickness distribution and repartition (Figure 7 and Table 3) support the validity of the total deposit volume proposed here. This volume corresponds to almost one and a half times the total volume of extruded lave dome prior to the May 8th eruption, estimated at 18–23 × 106 m3 by Tanguy (2004). This indicates that the volume of the dome in the crater prior to the May 8th eruption was smaller than the volume of the May 8th event alone, somewhat supporting the theory of Fisher and Heiken (1982, 1983) of an initial explosion of the superficial magma plug/dome that opened the magma conduit and supplied fresh magma during the May 8th eruption. This is also supported by the componentry analysis by Bourdier et al. (1989) with an average of only 5–10% of non-juvenile clasts. Modeling results also show that the volume of simulated block-and-ash flow deposit that reached the sea represents an important part of the total volume of the deposit (13 × 106 m3), yielding a ratio of about one third. Again, this ratio must be taken with caution due to simplifications made in the model to simulate the sea surface. Nevertheless, measuring only the volume deposited on land to estimate the total volume of the eruption is too restrictive and underestimates the value.
New Insights for Hazards Assessment
Results of simulations highlight the important role that topography played in promoting the spreading of the May 8th, 1902 pyroclastic current in the direction of St Pierre. First of all, due to the proximity of the sea from the Mount Pelée crater, which acts as a flat and smooth surface, any surge produced by a block-and-ash flow, that propagates mostly southward, will be diverted when material flows over the sea surface. Secondly, the plains and gentle slopes to the north of St Pierre (Figure 8) allow the surge to keep its momentum for a long period of time in the eastern direction. Finally, the ridge on the eastern part of St Pierre (Figure 8) redirects the flow from eastward to southward. These observations corroborate with numerous studies showing the high sensitivity of small-volume pyroclastic currents to the topography at Unzen (Yamamoto et al., 1993), Merapi (Charbonnier and Gertisser, 2008; Lube et al., 2011; Gertisser et al., 2012; Kelfoun et al., 2017), Montserrat (Ogburn et al., 2014; Gueugneau et al., 2019), or Colima (Macorps et al., 2018).
The key input parameters used for the best-fit simulations (i.e., surge production, mixture density, constant retarding stress) are similar to those used in previous studies for modeling small-volume pyroclastic currents from June 25th, 1997 eruption at Soufrière Hills Volcano, Montserrat (Gueugneau et al., 2019) and those from November 5th, 2010 at Merapi Volcano in Indonesia (Kelfoun et al., 2017). This demonstrates that the May 8th, 1902 pyroclastic current at Mount Pelée was more likely a relatively common phenomenon that can be modeled at first-order as a regular small-volume pyroclastic current. This also demonstrates that the city of St Pierre cannot be exclusively destroyed by eruptions involving catastrophic phenomenon, like a Plinian column collapse or a laterally-directed blast explosion, but also by pyroclastic currents coming from the sudden decompression of a lava dome with dimensions similar to the one formed during the 1902-05 eruption. The probability of an occurrence of a destructive pyroclastic current in St Pierre then becomes higher than previously stated. In the last 5,000 years of activity, the occurrence of a blast-like event at Mt Pelée is currently estimated at one every 500 years (Westercamp and Traineau, 1983; Carazzo et al., 2012), but the probability increases to one every 300 years if we combine these events with more frequent eruptions associated with small-volume block-and-ash flows. With such an increased probability of a similar pyroclastic current reaching St Pierre during future eruptions at Mount Pelée, the increased risk should be revised accordingly and included in short-term mitigation plans at this volcano.
Conclusion
The numerical simulation of the Mount Pelée May 8th, 1902 pyroclastic current confirmed numerous inferred flow and deposit characteristics previously suggested by various field studies. The model reproduced accurately both the block-and-ash flow and the associated ash-cloud surge component of the current, for an estimated total deposit volume of ∼32 × 106 m3, with ∼19 × 106 m3 on land and ∼13 × 106 m3 deposited in the sea. The tested scenario, an ash-cloud-surge produced from the emplacement of a block-and-ash flow in the Rivière Blanche, seems realistic and opens some discussion about the internal dynamics of the current. Our study brings new evidence to support the occurrence of such a scenario:
– The pear-like shape of the surge inundated area seems to be associated with the late formation of the ash-cloud surge during the southward propagation of the block-and-ash flow.
– The computed directions of the simulated currents that show an initial southward propagation of both the block-and-ash flow and surge, and late diversion of the surge toward the east, correlate with most of the measured flow directions obtained in the field.
However, a few claims support the presence of a decompressive blast-like event:
– The surge deposit facies is similar to those described for the November 5th, 2010 Merapi blast-like deposits (fine-depleted and coarse nature of the basal layer).
– The surge propagation in the northern part of the upper flank could be associated with a short explosion at the beginning of the eruption, analogous to a “low-intensity” burst phase.
Based on results obtained from our VolcFlow simulations and previous field data, the May 8th eruption can be interpreted as a sudden decompression of the lava dome growing in the crater, leading to a small vertical column that quickly collapsed into a powerful pyroclastic current, focused mainly by the shape of the southern crater outlet. Immediately after, a dense block-and-ash flow developed in the Rivière Blanche and generated an overriding ash-cloud surge during its southward propagation. The surge became more and more voluminous and powerful as it moved seaward and spread westward and eastward. When both currents reached the sea, the ash-cloud surge traveled over the northern plains of St Pierre and sea, promoting its lateral spreading. Moving eastward, it reached St Pierre and was progressively diverted southward through the city.
Results of simulations also highlights the important role played by the main topographic features of the southern flank of Mount Pelée during the eruption, which enhanced the lateral spreading of the surge, further exposed St Pierre to the path of the flow. With similar characteristics as in previous case studies elsewhere, the May 8th, 1902 event is considered as a small-scale explosive event for this volcano, associated with high-energy, small-volume pyroclastic currents for which the probability of occurrence is higher than a catastrophic blast event (one every 300 years). Thus, our study subsequently improves the assessment of hazards posed by pyroclastic currents at Mount Pelée, helpful for future eruptions, and can be replicated for similar pyroclastic currents elsewhere on Earth where the dynamic is also debated (i.e., Merapi, Indonesia; Unzen, Japan; Chaiten, Chile; Arenal, Costa Rica). It finally brings new claims supporting that the generation of the ash-cloud surge in small-volume pyroclastic currents is mostly coming from the block-and-ash flow.
Data Availability Statement
The raw data supporting the conclusions of this article will be made available by the authors, without undue reservation, to any qualified researcher.
Author Contributions
VG performed the simulations, interpreted the data, and drafted the work. SC helped to interpret the data and revised thoroughly the whole manuscript. AG wrote the Martinique Island geological history and revised the work. GC wrote the Mount Pelée recent eruptive history, provided the deposits pictures at St Pierre, and revised the work. KK helped to interpret the data and revised the work, mostly the numerical modeling, results, and discussion sections. VG, KK, and SC designed the work. All authors contributed to the article and approved the submitted version.
Funding
The development of the numerical code was funded by the Domerapi-ANR (French Agence Nationale de la Recherche) Project (ANR-12-BS06-0012). This research was supported by the National Science Foundation CAREER award #1751905. This research was also partly supported by the French Government Laboratory of Excellence initiative no. ANR-10-LABX-0006, the Région Auvergne and the European Regional Development Fund. This was Laboratory of Excellence ClerVolc contribution number 423. GC was partially funded by the PREST Interreg Project.
Conflict of Interest
The authors declare that the research was conducted in the absence of any commercial or financial relationships that could be construed as a potential conflict of interest.
Acknowledgments
We thank the editor and the two reviewers who have contributed to improve this work with their insightful comments and suggestions. We would like also to thank Judy McIlrath for having kindly revised the English of the manuscript and subsequently greatly improved it. We finally acknowledge the Observatoire Volcanologique et Sismologique de Martinique for having provided us the DEM of the Martinique Island.
Supplementary Material
The Supplementary Material for this article can be found online at: https://www.frontiersin.org/articles/10.3389/feart.2020.00279/full#supplementary-material
References
Alvarado, G. E., Soto, G. J., Schmincke, H.-U., Bolge, L. L., and Sumita, M. (2006). The 1968 andesitic lateral blast eruption at Arenal volcano, Costa Rica. J. Volcanol. Geotherm. Res. 157, 9–33. doi: 10.1016/j.jvolgeores.2006.03.035
Andrews, B. J., and Manga, M. (2011). Effects of topography on pyroclastic density current runout and formation of coignimbrites. Geology 39, 1099–1102. doi: 10.1130/G32226.1
Aubaud, C., Athanase, J. E., Clouard, V., Barras, A. V., and Sedan, O. (2013). A review of historical lahars, floods, and landslides in the Prêcheur river catchment (Montagne Pelée volcano, Martinique island, Lesser antilles). Bull. Soc. Geol. Fr. 184, 137–154. doi: 10.2113/gssgfbull.184.1-2.137
Belousov, A., Voight, B., and Belousova, M. (2007). Directed blasts and blast-generated pyroclastic density currents: a comparison of the Bezymianny 1956, Mount St Helens 1980, and Soufrière Hills, Montserrat 1997 eruptions and deposits. Bull. Volcanol. 69, 701–740. doi: 10.1007/s00445-006-0109-y
Benage, M. C., Dufek, J., and Mothes, P. A. (2016). Quantifying entrainment in pyroclastic density currents from the Tungurahua eruption, Ecuador: Integrating field proxies with numerical simulations. Geophys. Res. Lett. 43, 6932–6941. doi: 10.1002/2016GL069527
Boudon, G., and Lajoie, J. (1989). The 1902 Peleean deposits in the Fort Cemetery of St. Pierre, Martinique : a model for the accumulation of turbulent nuees ardentes. J. Volcanol. Geotherm. Res. 38, 113–129. doi: 10.1016/0377-0273(89)90033-90034
Boudon, G., Bourdier, J. L., Gourgaud, A., and Lajoie, J. (1990). The may 1902 eruptions of mount pelée: high-velocity directed blasts or column-collapse nuées ardentes? J. Volcanol. Geotherm. Res. 43, 359–364. doi: 10.1016/0377-0273(90)90062-K
Boudon, G., Le Friant, A., Komorowski, J.-C., Deplus, C., and Semet, M. P. (2007). Volcano flank instability in the Lesser Antilles Arc: Diversity of scale, processes, and temporal recurrence. J. Geophys. Res. 112:B08205. doi: 10.1029/2006JB004674
Boudon, G., Le Friant, A., Villemant, B., and Viode, J. P. (2005). “Martinique,” in Volcanic Atlas of the Lesser Antilles, ed. J. M. Lindsay, (Jamaica: University of the West Indies), 65–102.
Bourdier, J. L., Boudon, G., and Gourgaud, A. (1989). Stratigraphy of the 1920 and 1929 nuée-ardente deposits. Mt. Pelée, Martinique. J. Volcanol. Geotherm. Res. 38, 77–96. doi: 10.1016/0377-0273(89)90031-0
Bursik, M. I., and Woods, A. W. (1996). The dynamics and thermodynamics of large ash flows. Bull. Volcanol. 58, 175–193. doi: 10.1007/s004450050134
Calder, E. S., Cole, P. D., Dade, W. B., Druitt, T. H., Hoblitt, R. P., Huppert, H. E., et al. (1999). Mobility of pyroclastic flows and surges at the Soufriere Hills Volcano. Montserrat. Geophys. Res. Lett. 26, 537–540. doi: 10.1029/1999GL900051
Carazzo, G., Tait, S., and Kaminski, E. (2019). Marginally stable recent Plinian eruptions of Mt. Pelée volcano (Lesser Antilles): the P2 AD 280 eruption. Bull. Volcanol. 81, 1–17. doi: 10.1007/s00445-018-1265-1266
Carazzo, G., Tait, S., Kaminski, E., and Gardner, J. E. (2012). The recent Plinian explosive activity of Mt. Pelée volcano (Lesser Antilles): The P1 AD 1300 eruption. Bull. Volcanol. 74, 2187–2203. doi: 10.1007/s00445-012-0655-654
Carazzo, G., Tait, S., Michaud-Dubuy, A., Fries, A., and Kaminski, E. (2020). Transition from stable column to partial collapse during the 79 cal CE P3 Plinian eruption of Mt. Pelée volcano (Lesser Antilles). J. Volcanol. Geotherm. Res. 392:106764. doi: 10.1016/j.jvolgeores.2019.106764
Charbonnier, S. J., Connor, C. B., Connor, L. J., Sheridan, M. F., Oliva Hernández, J. P., and Richardson, J. A. (2018). Modeling the October 2005 lahars at Panabaj (Guatemala). Bull. Volcanol. 80:4. doi: 10.1007/s00445-017-1169-x
Charbonnier, S. J., Germa, A., Connor, C. B., Gertisser, R., Preece, K., Komorowski, J. C., et al. (2013). Evaluation of the impact of the 2010 pyroclastic density currents at Merapi volcano from high-resolution satellite imagery, field investigations and numerical simulations. J. Volcanol. Geotherm. Res. 261, 295–315. doi: 10.1016/j.jvolgeores.2012.12.021
Charbonnier, S. J., and Gertisser, R. (2008). Field observations and surface characteristics of pristine block-and-ash flow deposits from the 2006 eruption of Merapi Volcano, Java, Indonesia. J. Volcanol. Geotherm. Res. 177, 971–982. doi: 10.1016/j.jvolgeores.2008.07.008
Charbonnier, S. J., and Gertisser, R. (2012). Evaluation of geophysical mass flow models using the 2006 block-and-ash flows of Merapi Volcano, Java, Indonesia: Towards a short-term hazard assessment tool. J. Volcanol. Geotherm. Res. 23, 87–108. doi: 10.1016/j.jvolgeores.2012.02.015
Charbonnier, S. J., Thouret, J-C., Gueugneau, V., and Constantinescu, R. (2020). New insights into the c.2070 yr BP pyroclastic currents at El Misti volcano (Peru) from field observations, optical imagery and probabilistic modeling. Front. Earth Sci.
Charland, A., and Lajoie, J. (1989). Characteristics of Pyroclastic Deposits At the Margin of Fond-Canonville, Martinique, and Implications for the Transport of the 1902 Nuees-Ardentes of Mt Pelee. J. Volcanol. Geotherm. Res. 38, 97–112. doi: 10.1016/0377-0273(89)90032-90032
Chrétien, S., and Brousse, R. (1989). Events preceding the great eruption of 8 May, 1902 at Mount Pelée. Martinique. J. Volcanol. Geotherm. Res. 38, 67–75. doi: 10.1016/0377-0273(89)90030-90039
Cronin, S. J., Lube, G., Dayudi, D. S., Sumarti, S., Subrandiyo, S., and Surono, A. (2013). Insights into the October–November 2010 Gunung Merapi eruption (Central Java, Indonesia) from the stratigraphy, volume and characteristics of its pyroclastic deposits. J. Volcanol. Geotherm. Res. 261, 244–259. doi: 10.1016/j.jvolgeores.2013.01.005
Dellino, P., Mele, D., Bonasia, R., Braia, G., La Volpe, L., and Sulpizio, R. (2005). The analysis of the influence of pumice shape on its terminal velocity. Geophys. Res. Lett. 32, 1–4. doi: 10.1029/2005GL023954
Doyle, E. E., Hogg, A. J., Mader, H. M., and Sparks, R. S. J. (2008). Modeling dense pyroclastic basal flows from collapsing columns. Geophys. Res. Lett. 35:L04305. doi: 10.1029/2007GL032585
Druitt, T. H. (1995). Settling behaviour of concentrated dispersions and some volcanological applications. J. Volcanol. Geotherm. Res. 65, 27–39. doi: 10.1016/0377-0273(94)00090-94
Dufek, J., and Bergantz, G. W. (2007). Dynamics and deposits generated by the Kos Plateau Tuff eruption: Controls of basal particle loss on pyroclastic flow transport. Geochem. Geophys. Geosyst. 8:Q12007. doi: 10.1029/2007GC001741
Esposti Ongaro, T., Clarke, A. B., Neri, A., Voight, B., and Widiwijayanti, C. (2008). Fluid dynamics of the 1997 Boxing Day volcanic blast on Montserrat. West Indies. J. Geophys. Res. 113:B03211. doi: 10.1029/2006JB004898
Esposti Ongaro, T., Clarke, A. B., Voight, B., Neri, A., and Widiwijayanti, C. (2012). Multiphase flow dynamics of pyroclastic density currents during the May 18, 1980 lateral blast of Mount St. Helens. J. Geophys. Res. Solid Earth 117:B06208. doi: 10.1029/2011JB009081
Fisher, R. V., and Heiken, G. (1982). Mt. Pelée, Martinique: May 8 and 20, 1902, pyroclastic flows and surges. J. Volcanol. Geotherm. Res. 13, 339–371. doi: 10.1016/0377-0273(83)90132-90134
Fisher, R. V., and Heiken, G. (1983). Mt. Pelée, Martinique: May 8 and 20, 1902, pyroclastic flows and surges — Reply. J. Volcanol. Geotherm. Res. 19, 180–184. doi: 10.1016/0377-0273(83)90132-90134
Fisher, R. V., and Heiken, G. (1990). Discussion of four papers in the Mount Pel6e Special Issue (J. Volcanol Geotherm. tinique, by J. L. Bourdier, G. Boudon and A. Gourgaud. 2. Characteristics of pyroclastic deposits at the margin of Fond Canonville, Martinique, and implications. J. Volcanol. Geotherm. Res. 43, 353–364.
Fisher, R. V., Smith, A. L., and Roobol, M. J. (1980). Destruction of St. Pierre, Martinique, by ash-cloud surges, May 8 and 20, 1902. Geology 8:472. doi: 10.1130/0091-761319808<472
Germa, A., Quidelleur, X., Labanieh, S., Chauvel, C., and Lahitte, P. (2011). The volcanic evolution of Martinique Island: Insights from K–Ar dating into the Lesser Antilles arc migration since the Oligocene. J. Volcanol. Geotherm. Res. 208, 122–135. doi: 10.1016/j.jvolgeores.2011.09.007
Gertisser, R., Cassidy, N. J., Charbonnier, S. J., Nuzzo, L., and Preece, K. (2012). Overbank block-and-ash flow deposits and the impact of valley-derived, unconfined flows on populated areas at Merapi volcano. Java, Indonesia. Nat. Hazards 60, 623–648. doi: 10.1007/s11069-011-0044-x
Gueugneau, V., Kelfoun, K., and Druitt, T. (2019). Investigation of surge-derived pyroclastic flow formation by numerical modelling of the 25 June 1997 dome collapse at Soufrière Hills Volcano. Montserrat. Bull. Volcanol. 81:25. doi: 10.1007/s00445-019-1284-y
Herd, R. A., Edmonds, M., and Bass, V. A. (2005). Catastrophic lava dome failure at soufrière hills volcano, montserrat, 12–13 July 2003. J. Volcanol. Geotherm. Res. 148, 234–252. doi: 10.1016/j.jvolgeores.2005.05.003
Hill, R. T. (1902). A study of Pelée: impressions and conclusions of a trip to Martinique. Century Magazine 64, 764–785.
Jaggar, T. A. Jr. (1903). The eruption of Mount Pelée, 1851. Am. Nat. 38, 51–73. doi: 10.1086/278377
Jenkins, S., Komorowski, J. C., Baxter, P. J., Spence, R., Picquout, A., Lavigne, F., et al. (2013). The Merapi 2010 eruption: An interdisciplinary impact assessment methodology for studying pyroclastic density current dynamics. J. Volcanol. Geotherm. Res. 261, 316–329. doi: 10.1016/j.jvolgeores.2013.02.012
Kelfoun, K. (2011). Suitability of simple rheological laws for the numerical simulation of dense pyroclastic flows and long-runout volcanic avalanches. J. Geophys. Res. 116, 1–14. doi: 10.1029/2010JB007622
Kelfoun, K. (2017). A two-layer depth-averaged model for both the dilute and the concentrated parts of pyroclastic currents. J. Geophys. Res. Solid Earth 122, 1–19. doi: 10.1002/2017JB014013
Kelfoun, K., Gueugneau, V., Komorowski, J.-C., Cholik, N., and Merciecca, C. (2017). Simulation of block-and-ash flows and ash-cloud surges of the 2010 eruption of Merapi volcano with a two-layer model. J. Geophys. Res. Solid Earth 122, 1–16. doi: 10.1002/2017JB013981
Kelfoun, K., Samaniego, P., Palacios, P., and Barba, D. (2009). Testing the suitability of frictional behaviour for pyroclastic flow simulation by comparison with a well-constrained eruption at Tungurahua volcano (Ecuador). Bull. Volcanol. 71, 1057–1075. doi: 10.1007/s00445-009-0286-286
Komorowski, J. C., Jenkins, S., Baxter, P. J., Picquout, A., Lavigne, F., Charbonnier, S., et al. (2013). Paroxysmal dome explosion during the Merapi 2010 eruption: Processes and facies relationships of associated high-energy pyroclastic density currents. J. Volcanol. Geotherm. Res. 261, 260–294. doi: 10.1016/j.jvolgeores.2013.01.007
Lajoie, J., Boudon, G., and Bourdier, J. (1989). Depositional mechanics of the 1902 pyroclastic nuee-ardente deposits of Mr. Pelee, Martinique. J. Volcanol. Geotherm. Res. 38, 131–142. doi: 10.1016/0377-0273(89)90034-6
Le Friant, A. (2003). Numerical simulation of the last flank-collapse event of Montagne Pelée, Martinique, Lesser Antilles. Geophys. Res. Lett. 30, 3–6. doi: 10.1029/2002GL015903
Lipman, P. W., Moore, J. G., and Swanson, D. A. (1981). Bulging of the north flank before the May 18 eruption: Geodetic data. US Geol. Surv. Prof. Pap. 1250, 143–155.
Lipman, P. W., and Mullineaux, D. R. (1981). The 1980 eruptions of Mount St. Helens, Washington. Geological. Washington, DC: US Government Printing Office.
Loughlin, S. C., Calder, E. S., Clarke, A., Cole, P. D., Luckett, R., Mangan, M. T., et al. (2002). Pyroclastic flows and surges generated by the 25 June 1997 dome collapse, soufrière hills volcano, Montserrat. Geol. Soc. London, Mem. 21, 191–209. doi: 10.1144/GSL.MEM.2002.021.01.09
Lube, G., Cronin, S. J., Thouret, J. C., and Surono, S. (2011). Kinematic characteristics of pyroclastic density currents at merapi and controls on their avulsion from natural and engineered channels. Bull. Geol. Soc. Am. 123, 1127–1140. doi: 10.1130/B30244.1
Macorps, E., Charbonnier, S. J., Varley, N. R., Capra, L., Atlas, Z., and Cabré, J. (2018). Stratigraphy, sedimentology and inferred flow dynamics from the July 2015 block-and-ash flow deposits at Volcán de Colima. Mexico. J. Volcanol. Geotherm. Res. 349, 99–116. doi: 10.1016/j.jvolgeores.2017.09.025
Major, J. J., Pierson, T. C., Hoblitt, R. P., and Moreno, H. (2013). Pyroclastic density currents associated with the 2008-2009 eruption of Chaitén Volcano (Chile): Forest disturbances, deposits, and dynamics. Andean Geol. 40, 324–358. doi: 10.5027/andgeoV40n2-a09
Michaud-Dubuy, A., Carazzo, G., Tait, S., Le Hir, G., Fluteau, F., and Kaminski, E. (2019). Impact of wind direction variability on hazard assessment in Martinique (Lesser Antilles): The example of the 13.5 ka cal BP Bellefontaine Plinian eruption of Mount Pelée volcano. J. Volcanol. Geotherm. Res. 381, 193–208. doi: 10.1016/j.jvolgeores.2019.06.004
Ogburn, S. E., and Calder, E. S. (2017). The relative effectiveness of empirical and physical models for simulating the dense undercurrent of pyroclastic flows under different emplacement conditions. Front. Earth Sci. 5:83. doi: 10.3389/feart.2017.00083
Ogburn, S. E., Calder, E. S., Cole, P. D., and Stinton, A. J. (2014). The effect of topography on ash-cloud surge generation and propagation. Geol. Soc. Lond. Mem. 39, 179–194. doi: 10.1144/M39.10
Perret, F. (1935). The Eruption of Mt. Pelée, 1929-1932. Washington, DC: Carnegie institution of Washington.
Roobol, M. J., and Smith, A. L. (1975). A comparison of the recent eruptions of Mt. Pelée, Martinique and Soufrière, St. Vincent. Bull. Volcanol. 39, 214–240. doi: 10.1007/BF02597829
Shimizu, H. A., Koyaguchi, T., and Suzuki, Y. J. (2019). The run-out distance of large-scale pyroclastic density currents: a two-layer depth-averaged model. J. Volcanol. Geotherm. Res. 381, 168–184. doi: 10.1016/j.jvolgeores.2019.03.013
Sparks, R. S. J. (1983). Mont Pelee, Martinique: may 8 and 20, 1902, pyroclastic flows and surges - discussion. J. Volcanol. Geotherm. Res. 19, 175–184.
Sparks, R. S. J., Barclay, J., Calder, E. S., Herd, R. A., Komorowski, J.-C., Luckett, R., et al. (2002). Generation of a debris avalanche and violent pyroclastic density current on 26 December (Boxing Day) 1997 at Soufriere Hills Volcano, Montserrat. Geol. Soc. London, Mem. 21, 409–434. doi: 10.1144/GSL.MEM.2002.021.01.18
Tanguy, J.-C. (2004). Rapid dome growth at Montagne Pelée during the early stages of the 1902-1905 eruption: a reconstruction from Lacroix’s data. Bull. Volcanol. 66, 615–621. doi: 10.1007/s00445-004-0344-z
Tanguy, J.-C. C. (1994). The 1902-1905 eruptions of Montagne Pelée, Martinique: anatomy and retrospection. J. Volcanol. Geotherm. Res. 60, 87–107. doi: 10.1016/0377-0273(94)90064-90067
Taniguchi, H., and Suzuku-Kamata, K. (1993). Direct measurement of over pressure of volcanic blast on the June 1991 eruption at Unzen volcano. Japan. Geophys. Res. Lett. 20, 89–92. doi: 10.1029/92gl02720
Taylor, G. A. (1958). The 1951 eruption of Mount Lamington, Papua. Aust. Bur. Miner. Resour. Geol. Geophys. Bull. 38, 1–117.
Ui, T., Matsuwo, N., Sumita, M., and Fujinawa, A. (1999). Generation of block and ash flows during the 1990-1995 eruption of Unzen Volcano. Japan. J. Volcanol. Geotherm. Res. 89, 123–137. doi: 10.1016/S0377-0273(98)00128-120
Valentine, G. A. (1987). Stratified flow in pyroclastic surges. Bull. Volcanol. 49, 616–630. doi: 10.1007/BF01079967
Valentine, G. A. (1998). Damage to structures by pyroclastic flows and surges, inferred from nuclear weapons effects. J. Volcanol. Geotherm. Res. 87, 117–140. doi: 10.1016/S0377-0273(98)00094-98
Voight, B., Komorowski, J.-C., Norton, G. E., Belousov, A. B., Belousova, M., Boudon, G., et al. (2002). The 26 December (Boxing Day) 1997 sector collapse and debris avalanche at Soufriere Hills Volcano, Montserrat. Geol. Soc. London, Mem. 21, 363–407. doi: 10.1144/GSL.MEM.2002.021.01.17
Westercamp, D., and Traineau, H. (1983). The past 5,000 years of volcanic activity at Mt. Pelée Martinique (F.W.I): Implications for assessment of volcanic hazards. J. Volcanol. Geotherm. Res. 57, 159–185. doi: 10.1017/CBO9781107415324.004
Keywords: Mount Pelée, pyroclastic current, numerical modeling, simulation, surge, blast
Citation: Gueugneau V, Kelfoun K, Charbonnier S, Germa A and Carazzo G (2020) Dynamics and Impacts of the May 8th, 1902 Pyroclastic Current at Mount Pelée (Martinique): New Insights From Numerical Modeling. Front. Earth Sci. 8:279. doi: 10.3389/feart.2020.00279
Received: 17 April 2020; Accepted: 17 June 2020;
Published: 22 July 2020.
Edited by:
Andrea Bevilacqua, National Institute of Geophysics and Volcanology (INGV), ItalyReviewed by:
E. Bruce Pitman, University at Buffalo, United StatesMichael Manga, University of California, Berkeley, United States
Copyright © 2020 Gueugneau, Kelfoun, Charbonnier, Germa and Carazzo. This is an open-access article distributed under the terms of the Creative Commons Attribution License (CC BY). The use, distribution or reproduction in other forums is permitted, provided the original author(s) and the copyright owner(s) are credited and that the original publication in this journal is cited, in accordance with accepted academic practice. No use, distribution or reproduction is permitted which does not comply with these terms.
*Correspondence: Valentin Gueugneau, dmd1ZXVnbmVhdUB1c2YuZWR1