 Katherine J. Dobson1,2*
 Anja Allabar3Eloise Bretagne2Jason Coumans2Mike Cassidy4Corrado Cimarelli5Rebecca Coats6Thomas Connolley7Loic Courtois8Donald B. Dingwell5Danilo Di Genova9,10Benjamin Fernando4Julie L. Fife11Frey Fyfe4Stephan Gehne12Thomas Jones2,6Jackie E. Kendrick6Helen Kinvig2Stephan Kolzenburg5,13Yan Lavallée6Emma Liu14Edward W. Llewellin2Amber Madden-Nadeau4Kamel Madi8Federica Marone11Cerith Morgan15Julie Oppenheimer10Anna Ploszajski16Gavin Reid17Jenny Schauroth5,6Christian M. Schlepütz11Catriona Sellick2Jérémie Vasseur5Felix W. von Aulock6Fabian B. Wadsworth2,5Sebastian Wiesmaier5Kaz Wanelik7
- 1Department of Civil & Environmental Engineering, University of Strathclyde, Glasgow, United Kingdom
- 2Department of Earth Sciences, Durham University, Durham, United Kingdom
- 3Department of Geosciences, Eberhard Karls University of Tuebingen, Tuebingen, Germany
- 4Department of Earth Sciences, University of Oxford, Oxford, United Kingdom
- 5Department of Earth and Environment Science, Ludwig-Maximilians-Universität, Munich, Germany
- 6Department of Earth, Ocean and Ecological Sciences, University of Liverpool, Liverpool, United Kingdom
- 7Diamond Light Source, Harwell Campus, Didcot, United Kingdom
- 83Dmagination, Harwell Campus, Didcot, United Kingdom
- 9Bayerisches Geoinstitut, Universität Bayreuth, Bayreuth, Germany
- 10School of Earth Sciences, University of Bristol, Bristol, United Kingdom
- 11Swiss Light Source, Paul Scherrer Institut, Villigen, Switzerland
- 12School of Earth and Environmental Sciences, University of Portsmouth, Portsmouth, United Kingdom
- 13Department of Geology, University at Buffalo, Buffalo, NY, United States
- 14Department of Earth Sciences, University College London, London, United Kingdom
- 15Lancaster Environment Centre, Lancaster University, Lancaster, United Kingdom
- 16Institute of Making, University College London, London, United Kingdom
- 17Independent Researcher, Aberdeen, United Kingdom
Many of the grand challenges in volcanic and magmatic research are focused on understanding the dynamics of highly heterogeneous systems and the critical conditions that enable magmas to move or eruptions to initiate. From the formation and development of magma reservoirs, through propagation and arrest of magma, to the conditions in the conduit, gas escape, eruption dynamics, and beyond into the environmental impacts of that eruption, we are trying to define how processes occur, their rates and timings, and their causes and consequences. However, we are usually unable to observe the processes directly. Here we give a short synopsis of the new capabilities and highlight the potential insights that in situ observation can provide. We present the XRheo and Pele furnace experimental apparatus and analytical toolkit for the in situ X-ray tomography-based quantification of magmatic microstructural evolution during rheological testing. We present the first 3D data showing the evolving textural heterogeneity within a shearing magma, highlighting the dynamic changes to microstructure that occur from the initiation of shear, and the variability of the microstructural response to that shear as deformation progresses. The particular shear experiments highlighted here focus on the effect of shear on bubble coalescence with a view to shedding light on both magma transport and fragmentation processes. The XRheo system is intended to help us understand the microstructural controls on the complex and non-Newtonian evolution of magma rheology, and is therefore used to elucidate the many mobilization, transport, and eruption phenomena controlled by the rheological evolution of a multi-phase magmatic flows. The detailed, in situ characterization of sample textures presented here therefore represents the opening of a new field for the accurate parameterization of dynamic microstructural control on rheological behavior.
The Need for in situ Observation in Magmatic Research
Magmas are generally a constantly evolving mixture of silicic melt, crystals, and bubbles, with the magmatic behavior during mobilization, flow, fragmentation, and eruption fundamentally controlled by the evolution of the melt viscosity and interactions between the suspended crystal and bubble phases. Dynamics are key in volcanology. Most of our research focuses on how magmatic systems have, are, and will continue to evolve. We use a wide range of field, laboratory, theoretical, and numerical approaches, but understanding the dynamic and highly heterogeneous nature of magmatic systems, defining the behavioral tipping points, and identifying the markers we should be monitoring remains difficult because we cannot fully interrogate or observe magma at depth. The spatial and temporal heterogeneity of the system means that while empirical relationships can be defined for a given set of conditions, the rheological evolution of magma remains complex and understanding the magmatic and volcanic processes influenced by the rheology requires a knowledge of the interaction microphysics that we currently lack.
The samples we collect in the field inherently contain a complex series of textural and chemical overprints acquired during the entire evolution from formation to eruption/emplacement. The behavior of the magma at any point in time and space will have been influenced by evolution prior to that point. Likewise, when we try to reproduce sub-surface magmatic conditions in the laboratory, experimental charges capture only a small piece of that evolution, usually starting from an ideal condition in order to capture a specific behavior – a condition unlikely to be found in the natural magmatic system. Our inability to observe processes under realistic conditions is a key limitation in developing our understanding. In the natural system, many complex and interacting processes operate simultaneously, and experiments generally aim to simplify and isolate phenomena. However, even if we manage to capture and describe all the individual phenomena, there will still be interactions in the natural system that are missed. The in situ approach with both natural and synthetic materials allows us to see what those interacting phenomena look like in a new way.
The Need for in situ Observation in Rheological Research
Recent efforts into developing an understanding of the rheology of magmatic suspensions has focused on deriving models that capture the rheology of magmatic suspensions as a function of intrinsic (melt- and crystal-composition, texture, etc.) and extrinsic (temperature, shear rate, etc.) parameters (Ryerson et al., 1988; Spera et al., 1988; Stein and Spera, 1992; Pinkerton, 1994; Sato, 2005; Ishibashi and Sato, 2007; Vona et al., 2011; Vona and Romano, 2013; Chevrel et al., 2015; Campagnola et al., 2016; Soldati et al., 2016; Morrison et al., 2020). We understand that changes in magma viscosity and the transition from Newtonian to non-Newtonian behavior, observed during crystallization and vesiculation, depend fundamentally on the crystal and bubble content, shape, surface texture, and size distribution as well as the imposed strain rates (Mader et al., 2013). However, characterization of sample textures in rheological studies, which is crucial for the derivation of these rheological laws, is, without exception, restricted to snapshots before and after an experiment.
While the importance of disequilibrium effects on crystal growth has inspired recent studies investigating the dynamic rheology of crystallizing silicate melts at conditions close to those expected during emplacement in nature (Kouchi et al., 1986; Ryerson et al., 1988; Giordano et al., 2007; Vona and Romano, 2013), studies under disequilibrium conditions are few, and systematic descriptions of the effects of cooling (Giordano et al., 2007; Kolzenburg et al., 2019; Vetere et al., 2019), deformation (Kolzenburg et al., 2018b; Tripoli et al., 2019), and oxygen fugacity (Kolzenburg et al., 2018a), as well as their interdependence, are limited. Textural characterization of experiments performed under these conditions has been impossible because the high rates of diffusion and crystal growth at high undercooling make it impossible to quench the experimental charges fast enough to preserve the textures under experimental conditions. As a result, dynamic changes in crystallization and vesiculation kinetics, sample textures during flow or during disequilibrium processes, and the associated responses in rheology remain unconstrained.
In recent years, we have seen a dramatic increase in the ability to perform non-destructive observation in situ using the high-speed capability of X-ray tomography synchrotron facilities. The development has been largely led by the research needs of the material science community (e.g., Maire and Withers, 2014), but with the development of sample environments suitable for geological materials, and high temperature apparatus we are now capable of making certain key observations. The X-Rheo system described here now permits detailed, in situ characterization of these sample textures, a crucial factor for accurate parameterization of the rheological data, and thus opens up an entirely new field of study in magma rheology.
Recent Advances in Synchrotron Capability
Several synchrotron facilities now have the capability to acquire 3D images of geological materials with moderate (10–5 μm) or high (<5 μm) spatial resolution. Several tomography beamlines can achieve fast (defined here as <10 s to collect a single 3D tomographic dataset) tomography of these samples, and those focusing on imaging dynamic systems can routinely perform ultra-fast or real-time (defined here as <1 s to collect a single 3D tomographic dataset) tomography on geological specimens (e.g., Marone et al., 2020). For 3D tomographic acquisition, a frequency of up to 20 tomographies per second (TPS) is now possible (Dobson et al., 2016). These same detector systems can achieve over 5000 fps when used to collect 2D radiography.
Imaging at sub-optimal conditions can lead to a reduction in data quality but can also deliver higher temporal resolution. This usually takes the form of reducing the number of angles from which the 2D projections are acquired and/or underexposing the images. With large volume onboard camera storage this can enable 10s or 100s of high frequency images to be acquired in a single experimental run. Cropped projection image areas can further increase the TPS (reducing data transfer time) and number of tomographies (smaller data volume per image) that can be collected. Data transfer, rather than experimental speed, is now often the bottleneck. This has led to investment in novel continuous read out detectors with real-time data transfer to network storage (Mokso et al., 2017; Marone et al., 2020), and at some beamlines there is no theoretical limit to the number of 3D datasets that can be obtained.
On most systems the sample can be made to rotate continuously in a single direction with acquisition triggered at specific angle(s) by the rotational encoder. For the highest speed experiments, the last projection of the first data set (collected from 0 to 180°) can essentially be the first of the second dataset (collected from 180 to 360°). Alternatively, acquisition “gapped” (e.g., Dobson et al., 2016) can be triggered every time the 0° encoder location is passed, or every n-th time it is passed, allowing very high-speed acquisition with a lower image frequency. This method has the added advantage that all the reconstructed tomographies are in the same orientation, removing a registration step from the post processing workflow.
Recent Applications to Volcanology
Areas within volcanology where real-time in situ synchrotron X-ray tomography could prove transformative include (but are not limited to) bubble nucleation, growth, and coalescence; crystallization; crystal alignment and physio-chemical interaction; multiphase magma deformation and rheology (including strain localization reactive transport, and fragmentation); magma-rock-fluid interaction; rock mechanics; etc. Work has now begun in some of these areas, such as bubble growth and permeability (Baker et al., 2012, 2019; Colombier et al., 2018; Pleše et al., 2018), gas driven filter pressing (Pistone et al., 2015), deformation (Okumura et al., 2013), sintering (Wadsworth et al., 2016, 2019), and crystallization (Polacci et al., 2018; Arzilli et al., 2019).
When coupled to advances in furnace capability (presented here) (Bai et al., 2008; Fife et al., 2012; Kudrna Prasek et al., 2018; Polacci et al., 2018) and apparatus for tensional and compressional deformation (Kareh et al., 2012; Philippe et al., 2016), experiments that elucidate how volcanic and magmatic processes occur are now possible. We can observe and quantify their rates; we can systematically explore the relationships that control the timing of these events and start to define the critical causes and consequences.
One area where this is critical is in understanding magmatic mobilization, mobility, and flow. Magmas are complex multiphase suspensions with non-Newtonian rheological properties. Testing rheological behavior of natural and synthetic samples is challenging in the laboratory (McBirney and Murase, 1984; Caricchi et al., 2007; Lavalleìe et al., 2007; Cimarelli et al., 2011; Picard et al., 2011; Vona et al., 2011; Pistone et al., 2012, 2013; Chevrel et al., 2015; Vona et al., 2016), but understanding how the microscopic behavior of the suspended phases are controlling the macroscopic behavior remains even more so. As such, analog materials offer an excellent solution to scrutinize key rheological controls properties (Llewellin et al., 2002; Mader et al., 2013; Truby et al., 2014), not permissible during experiments on magma which is commonly enclosed in furnaces and pressure vessels. However, even when working with well controlled analog materials, samples are generally opaque and traditional methods cannot observe the nature or 4D distribution of the suspended phase interactions. Thus, the microphysics controlling fluid behavior is not constrained at the scale of the processes and rheological models remain incomplete. In situ X-ray tomography is ideally suited to meet this kind of challenge, as it reveals previously unrecognized phenomena and their temporal relationships.
In situ imaging of deformation experiments is a relatively new technique within the volcanological community, and performing these experiments has many unique challenges. We therefore give an overview of the considerations that must be made when designing or planning volcanological research using in situ imaging. We present the XRheo system and associated high temperature furnace for performing in situ rheological experiments on magmatic samples: providing cutting edge capabilities for understanding real-time evolution of microstructures and how this affects rheological behavior. We show the quality of the data that can be obtained and highlight the kind of salient features that can be observed before presenting an implementation of new volume correlation analysis methods that enable the extraction of quantitative information on the displacements within deforming samples.
Designing in situ Experiments
In situ imaging can be demanding, especially when working at high temperatures or with complex experimental setups. Careful design to allow integration between synchrotron imaging systems and the in situ apparatus is critical to experimental success.
Sample Holders and Encasement
In the volcanic and magmatic context, the high temperatures needed for experiments under natural conditions is a key challenge. Many environmental cells used in standard laboratory experiments are made of substantially thick Pt or stainless steel. These materials have high X-ray attenuation coefficients and cannot easily be used with tomographic imaging. Many materials with low X-ray attenuation have limited thermal stability, cannot accommodate loading, or will react with the melt, changing the composition and behavior of the sample during the experiment. Optimal imaging may result in deviation from optimal experimental conditions, or vice versa.
The need for encasement of molten samples using materials with low X-ray attenuation and good thermal properties makes boron nitride (BN) and Al2O3 the widely used materials of choice for high temperature experiments. BN is easy to machine and is stable to temperature of ∼1,000°C. Al2O3 can be used to higher temperatures (1,200–1,400°C) and has better mechanical properties under compression, but is harder to machine and can still be susceptible to thermal shock. Graphite could also be used under reducing experimental conditions. For heating schedules typical for volcanic and magmatic experiments (10–20°C/min), the chance of fracture through thermal shock is low. With some natural melt compositions and environments, reaction between the BN or Al2O3 sample holder and the enclosed melt may still occur. Where off-line testing is able to demonstrate that some container-sample reaction is tolerable, the progression can usually be observed in real-time during acquisition, or defined a posteriori in the reconstructed 3D images. Non-reactive high (or low) temperature magmatic analogs may have to be substituted. In such cases, other experimental parameters (temperature, deformation rate) may also have to be adjusted to allow for investigation of specific phenomena. Other encasement materials such as thin Pt foil (Polacci et al., 2018) and boro-epoxy (Berg et al., 2017) are also possible, but make sample preparation more complex and can limit the range of mechanical experimental conditions that can be tested.
Imaging Moving Magma
When working with changing multiphase materials, easy quantification requires sufficient contrast between melt and the different mineral phases while maintaining low enough overall attenuation to ensure high X-ray fluxes reaching the detector and with good signal quality. In all X-ray tomography, the attenuation differences between the mineral phases should be carefully checked prior to scanning (Hanna and Ketcham, 2017) to ensure the features of interest are visible, and with fast synchrotron tomography it is usually possible to use a monochromatic beam at an energy chosen to maximize the attenuation differences or extract data at two energies bridging an absorption edge. For some minerals it is possible to determine mineral composition from calibrated reconstructed 3D data, even from a polychromatic “white” or “pink” beam (Pankhurst et al., 2018), but this should be considered before starting experimental work so beamline conditions and calibrations standards can be identified.
To achieve the fastest projection acquisition rates for real-time or ultra-fast synchrotron tomography, magmatic sample densities may limit users to a white or pink beam on the lower energy hard X-ray imaging beamlines (e.g., TOMCAT, Swiss Light Source; Marone et al., 2020), but still allow monochromatic imaging on higher energy beamlines (e.g., i12-JEEP, Diamond Light Source; Drakopoulos et al., 2015). The attenuation differences between most rock-forming minerals are greatest at lower energies (Hanna and Ketcham, 2017).
When working with dynamic systems, the changes in total attenuation that will occur during the experiment (nucleation of crystals and associated changes in melt composition can cause a dynamic redistribution and therefore local and bulk attenuation) should also be considered, and the imaging parameters adjusted accordingly to allow adequate image quality at all stages of the experiment. Imaging crystal precipitation from a melt (Polacci et al., 2018), or crystals with a similar density (Arzilli et al., 2016) can be improved if phase contrast retrieval methods are used, but quantitative data analysis is still likely to be challenging and can be time-consuming and hard to automate. The enhanced phase boundaries achieved in phase contrast enhanced topography can make the small volumes of melt between crystals and/or bubbles harder to observe and quantify, and after preliminary testing was not deployed in this study.
The XRheo and High Temperature Apparatus
The XRheo system is designed to be compatible with almost all large enclosure laboratory scanning systems and to function on all synchrotron imaging beamlines. Its development was possible by long-term access to both the TOMCAT beamline at the Swiss Light Source and the I12-JEEP beamline at Diamond Light Source. The XRheo takes a standard high precision low-torque rheometric testing apparatus (Di Genova et al., 2016) and integrates it with the high temperature sample environment and the imaging beamline.
The XRheo can perform the same suite of experiments that can be achieved during rotational rheological testing in the laboratory, but does so during 3D X-ray tomography acquisition, allowing the internal structural evolution to be captured in situ during the experiment while “traditional” rheological data are being collected. In standard rheological testing, the lower plate or cup is a fixed reference frame and the upper plate or spindle rotates with the torque required to rotate at a given speed recorded. The XRheo uses the rotation needed for 3D image acquisition (i.e., a rotating cup) as the reference frame. In this study, we use the XRheo in a wide gap concentric cylinder (Couette) configuration, but all other rotational rheological testing configurations are possible. The system (Figure 1) is conceptually and operationally simple, but technically challenging to design and set up. To acquire 3D data during the deformation, the XRheo uses the beamline rotation stage to control the cup. During the initial period, the rheometer head is set to keep a constant value of zero load and the coupled spindle therefore accelerates with and then rotates at the same velocity as the cup (to prevent development of any shear stress and internal deformation ahead of the experiment).
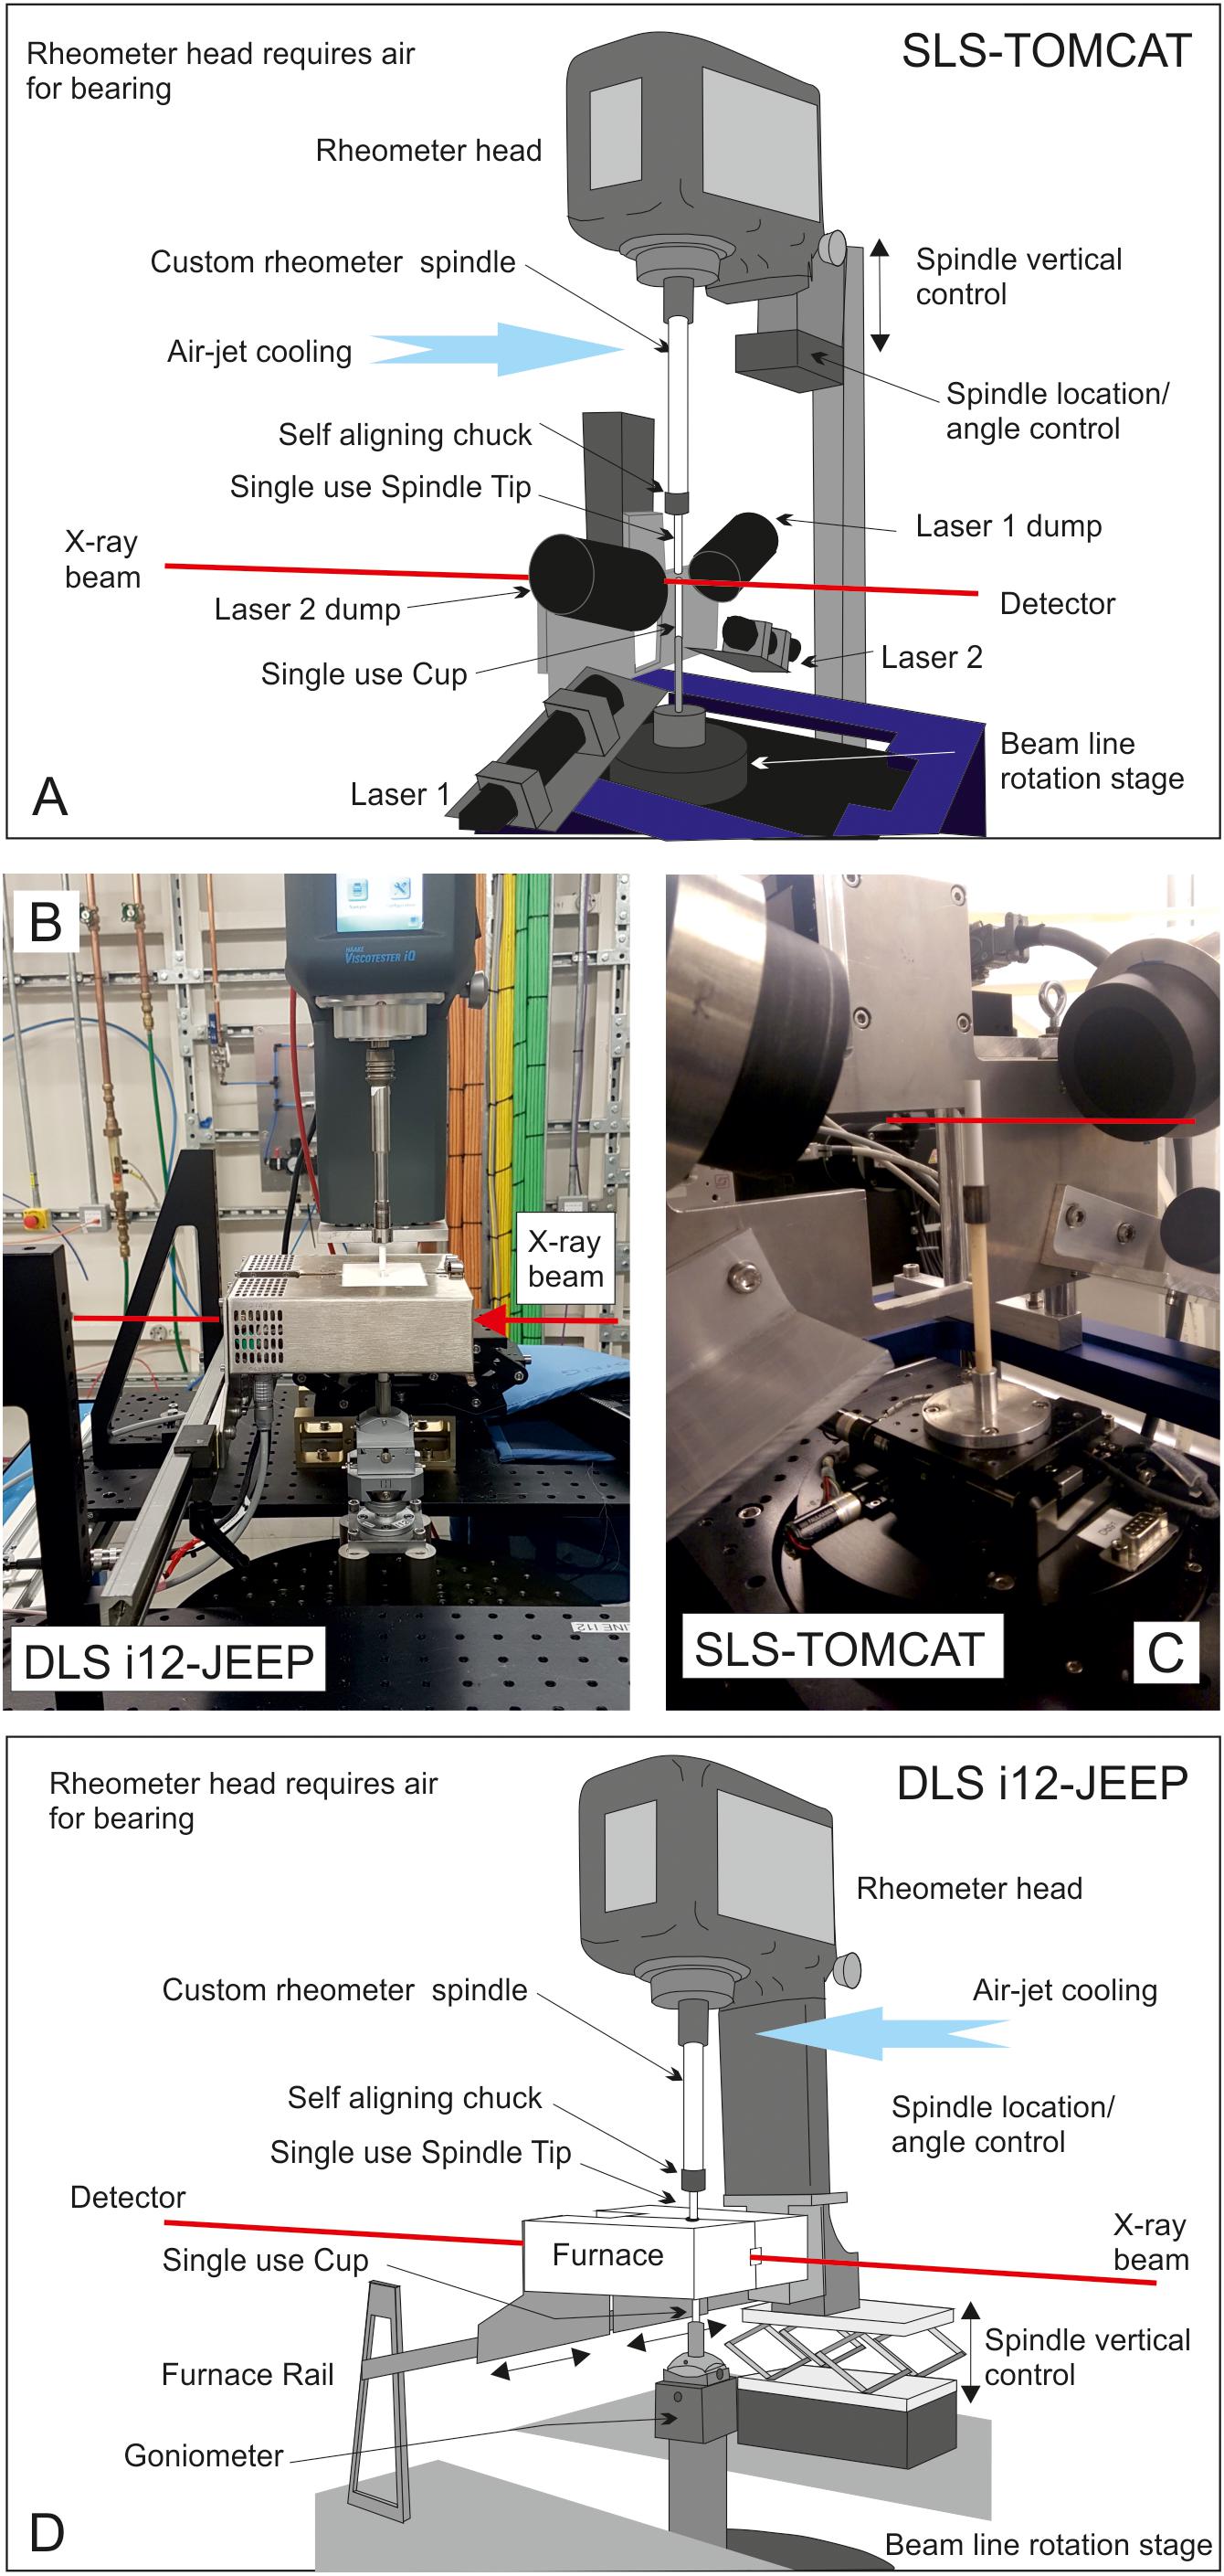
Figure 1. Schematics of the XRheo and its installation at the TOMCAT (Swiss Light Source) (A,C) and at i12 (Diamond Light Source) (D,B) beamlines. This mounting system can be easily adapted to other synchrotron or laboratory systems, and the system can be used ex situ for laboratory bench testing.
Once the system rotation is established and the desired experiment temperature reached, the beamline rotation stage and cup continue at the same rotation speed, while the rheometer is initiated and the spindle accelerated at a user-defined rate to a differential velocity with respect to the cup. As soon as the acceleration starts, the sample begins to experience internal deformation. Image acquisition from before the start of deformation through to steady state deformation or a given number of relative spindle rotations allows the microstructural evolution to be tracked.
Most rheometer systems allow the torque to be recorded throughout the experiment (both zero deformation and acceleration/constant deformation parts of the sequence) and allow a series of programmable accelerations and decelerations as required by the user. All equipment is safeguarded by an over torque failure condition set at a load well below the maximum operating conditions of the rheometer and beamline rotation stages. Should the load hit this threshold, the rheometer automatically moves back to operating at zero load, returning to the zero-torque condition, i.e., with the spindle rotation the at the velocity as the sample.
The precise setup is somewhat beamline-specific and gives flexibility to adapt to different sample and equipment mounting systems, the size of the sample, and the temperature range over which the system will be operated. Installation and operation of the XRheo system can vary depending on need and the auxiliary furnace equipment available, and the set-ups used at both TOMCAT and I12-JEEP are described here.
The XRheo
The XRheo is highly adaptable and can operate with the rheometer head most suitable for any given experiment, requiring only alteration of the fixing plate. Here we present data acquired using both Anton Paar and Thermo Fisher Scientific air bearing (nNm sensitivity) rheometric testers. The head is mounted on a set of high load manual translation stages that allows adjustment of the location of the rheometer spindle over the center of the beamline rotation stage. A second set of stages can be used to level the spindle. The rheometer is controlled in the beamline control room via a USB connection to a laptop and remote desktop control.
At TOMCAT (Figures 1A,C), the rheometer head and translation stages are mounted on a rigid horizontal support bar, which is in turn mounted onto a vertical support bar, which is bolted to the base table. A manual vertical translation stage is included at the bar intersection to allow the head and horizontal bar assembly to be raised for sample changing and then lowered back into imaging position. At I12-JEEP (Figures 1B,D) the rheometer mounting block is closer, attached to a split optical breadboard on a frame around the sample stage for mounting custom sample environments. The same breadboard supports the Pele furnace (see Figures 1B,D).
Alignment of the rotation axis of the spindle with that of the imaging stage is critical to both imaging and rheological data quality in standard testing. While the tolerances in machining and the alignment of the manufacturer supplied components may be adequate for a spindle or bob on a larger volume laboratory rheological tester, it should be checked before use on a high-resolution imaging beamline. A disposable BN or Al2O3 tip is attached to a steel spindle and attached the rheometer head (Figure 1D). The spindle tip diameters (and potentially geometry) can be varied according to the experiment. The spindle is lowered to the imaging position with the tip close to the bottom of the field of view and its alignment checked. Initial alignment is achieved using the beamline rotation stage mounting pin, raised to just below the spindle tip, as a visual reference. After that initial alignment, the X-ray hutch is closed, and radiographs taken to quantify any alignment adjustment needed and assessed by eye using multiple micrometer accuracy dial gages.
Samples
Here we use two samples that have already been employed in experimental volcanology. Synthetic magmatic samples formed from sintered soda lime glass beads of known rheological properties (Wadsworth et al., 2016, 2017, 2019) and low temperature magmatic analogs (oils and syrups). Other analog materials could also be used when appropriate to address a specific experimental question. When needed, inert marker crystals are mixed into the fluid. Here we use rutile crystals in the synthetic magma because they have significantly higher density (attenuation) than the molten glass and can be considered nonreactive with the melt under these experimental conditions over the time scale of these experiments. We use olivine or plagioclase as the particles in the low temperature analogs (Figure 2). Initial tests showed that there is no measurable settling of the crystals or rise of the bubbles on the timescale of the experiments.
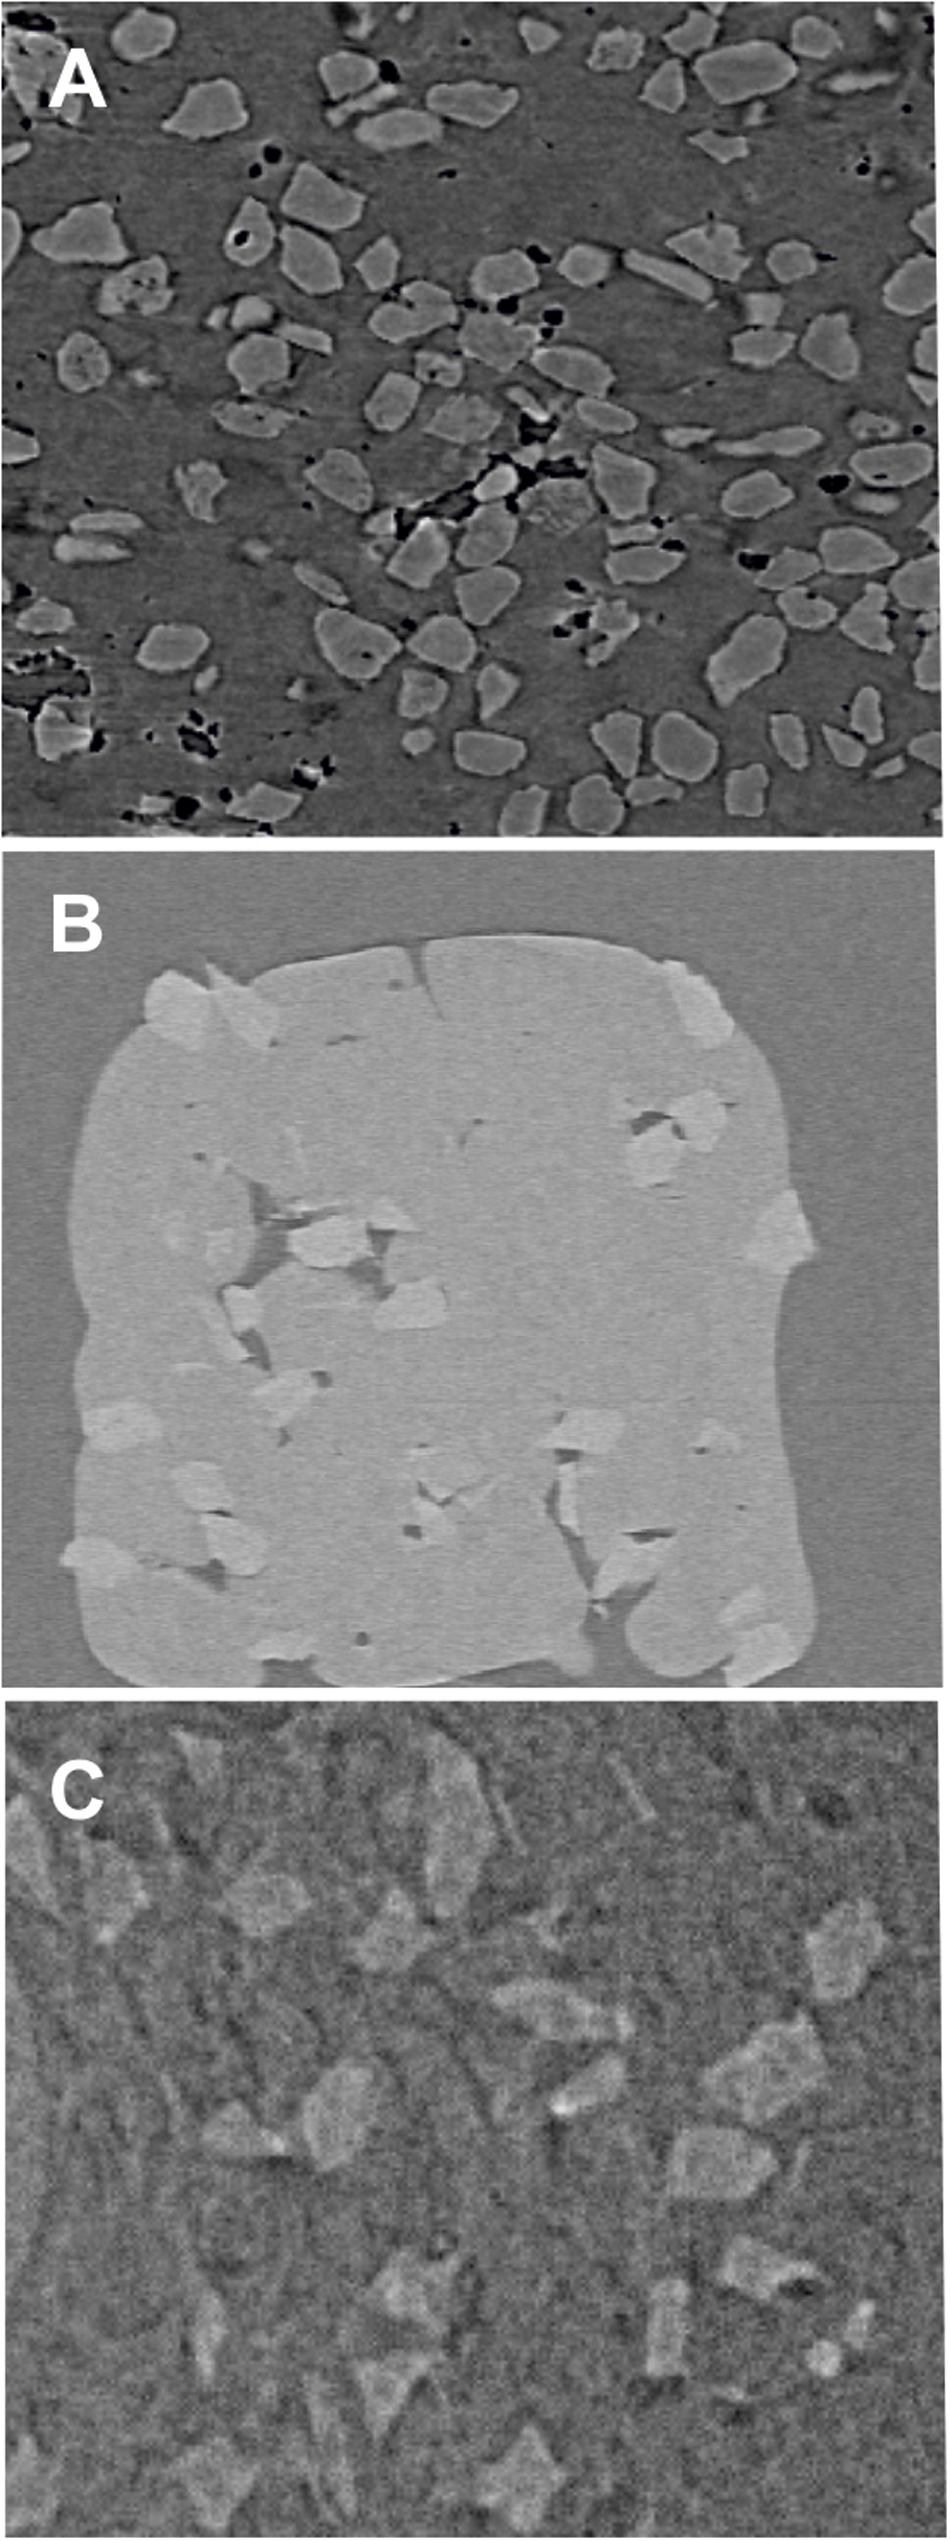
Figure 2. Two-dimensional slices through 3D datasets showing the contrast between (A) rutile in borosilicate (filtered pink beam, SLS-TOMCAT, max energy ∼40 keV), (B) olivine in the borosilicate (DLS-i12-JEEP, monochromatic beam 53 keV), and (C) olivine in Canon N2700000 viscosity standard mineral oil (DLS-i12-JEEP, monochromatic beam 53 keV). The low contrast between olivine and borosilicate (shown in B) makes data processing and quantitative analysis extremely challenging when working at short detector distances (minimizing phase contrast to allow accurate rendering of thin bubble wall films). Experiments that have used quartz, wollastonite and feldspars in synthesized haplogranitic and dioritic melts have even lower contrasts, and the particles cannot be observed even with the lower energy at SLS-TOMCAT. The crystals in all three samples are in the 90–180 μm size fraction. Red line shows X-ray beam path.
Sinter in place
Some of the synthetic magmas were sintered in place. The beamline mounting pin (fixed to the rotation stage) is then lowered and the sample cup mounted. The cups used here were BN, 5–8 mm internal diameter, 0.5 mm wall thickness, and a 10 mm depth (Figure 3). Below the cup, the ceramic extended ∼20 mm to a standard pin for attaching to the rotation stage. The cup is raised and aligned in the field of view of imaging such that the base of the cup is ∼2 mm below the bottom of the image, and the rotation axis of the cup and spindle are aligned. Powdered samples were then loaded into the cup using a pipette tip, taking care not to knock the spindle and to fill the cup evenly from all sides. Once filled to the rim, the cup was tapped gently to allow settling and increase packing tightness.
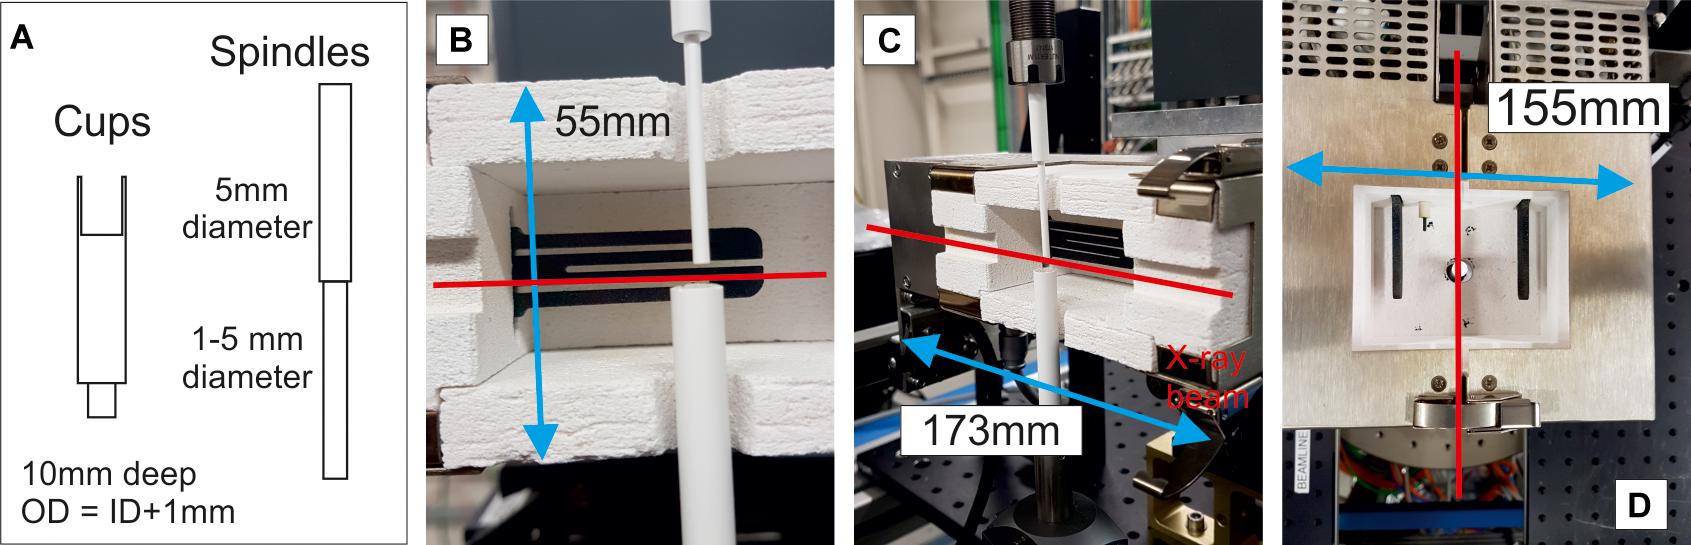
Figure 3. (A) The sample cups and spindles used with the XRheo for high temperature experiments. (B,C) The Pele in situ furnace (see also Figure 1) as mounted and used with the XRheo. (D) The Pele in situ furnace with the upper insulation plates removed, this also shows the apertures set to accept the spindles/cups (as shown) could also be used as the X-ray window, mounting the sample from the bottom of this image for high temperature (no deformation) scanning in laboratory scanning systems.
Pre-sintered or natural samples
Sintered-in-place, powder-loaded samples at 1 bar typically exhibit a minor and variable amount of porosity. Although the porosity can be carefully characterized prior to any deformation, pre-sintered synthetic samples of known crystal and bubble content can often be produced with higher reproducibility ex situ. Small cores cut from natural samples or larger blocks of pre-sintered material can also be used in the XRheo set-up; however, it can be harder to ensure good thermal and mechanical coupling between the cup, sample, and spindle. Cores were ground slightly smaller than the inner diameter of the cup to allow for thermal expansion of the melt during heating without promoting large stresses that may fracture the cup. Finely ground (<60 μm) material of the melt composition was then added to the cup to bridge the sample to the cup and encourage mechanical coupling. In some samples, smaller diameter drills were used to excavate a channel into the center of the core to accommodate the spindle, and additional ground material added over the center of the sample once the spindle was in place.
The best results were achieved when the spindle was raised 10 mm from the spindle imaging position and the cup aligned as for the powdered samples (above). For the drilled samples, the spindle can then be lowered back to image position prior to heating. For the un-drilled samples, the sample is heated prior to the spindle being lowered into the molten material. Immersing the spindle into the sample is done slowly to allow outward movement of the melt and accommodation of the spindle without breaking the tip. Some samples fail to form continuous bubble-free contacts between the melt, the cup, and the spindle. In these cases, large bubbles are usually visible in the reconstructed data and the sample can be changed prior to performing the experiment. In some cases (including some test samples which were loaded into the cups and heated ex situ before loading), the samples appear to form a good mechanical contact but decouple from either the cup or spindle as soon as deformation begins. The precise reason for this is unclear, especially when acceleration to deformation speed is low and the sample is thermally equilibrated. It should be noted that the need for rotation during heating means it is not possible to run solid undrilled samples at TOMCAT using the laser system and the current XRheo set-up.
Low temperature analogs
The XRheo can also be used to perform experiments on low temperature magmatic analogs (e.g., oils syrups, waxes). Loading these samples follows the pre-sintered protocol, with the fluids loaded into the sample cup in the laboratory prior to transfer onto beam. While Al2O3 and BN cups and spindles can be used for the high temperature experiments, BN cups and spindles are preferred when using low temperature analogs because of the lower attenuation of the fluid phase. Use of an encapsulation material that is denser than the sample generally makes image processing more challenging. BN is also lower cost and easier to machine, so more suitable for the shorter experiment times (no long heating periods) when working with analog systems.
Working at Magmatic Temperatures on Synchrotron Beamlines
Maintaining thermal stability across the sample volume can also be difficult in the configurations required on a beamline. Heat losses are largely governed by the geometry of the experimental apparatus and the heating system used. Some beamlines have their own furnaces for direct integration with the beamline controls, and this integration permits accurate and complete capture of the processes under investigation if they are strongly temperature dependent. In most cases, furnace volumes, hot zones, or focused heating spots are relatively small and samples can experience a substantial heat sink through the mounting pin. This effect can be seen and quantified in some tests such as during sintering experiments, where the powder material in contact with the BN mounting plate sinters at a slower rate than the material in the central part of the furnace. The volume of the hot zone and the effect of the heat loss on the experiment can sometimes be tested off beam, but in some experimental geometries, rotation and rotation speed can have an effect that is challenging to test in the laboratory.
At TOMCAT (SLS) the XRheo is compatible with the laser heating system (Figure 1; Fife et al., 2012; Marone et al., 2020). This system has two lasers mounted on opposite sides of the sample, each generating a 6 mm × 4 mm portrait spot on the sample holder. The lasers are initiated after rotation has begun and rotation continues while the lasers are heating. The system works well with small volume samples, but high thermal gradients are present away from the laser spot (i.e., above and below the imaging field of view and may affect behaviors for larger samples. The furnace is operated through the beamline control system.
The Pele Furnace
When working at I12-JEEP (DLS), existing beamline furnaces are incompatible with the XRheo; instead we use the bespoke Pele furnace (Figure 3), fabricated by Severn Thermal Solutions, who adapted a concept previously developed for a uniaxial deformation press (Lamur et al., 2018) and a rotary-shear apparatus (Wallace et al., 2019). This rail mounted 1 kW furnace has an operating range of 200–1,250°C, and the split design allows easy sample loading and a large hot zone (Figure 3) suitable for samples up to 20 mm in diameter. Thermal variability across the 30 mm (vertical) × 30 mm (across split) × 50 mm (along split) hot zone is better than 2°C and thermal stability is better than ±2°C. The furnace is powered and controlled by a Eurotherm programmable control unit (at present operated independently of the beamline control system).
The split design allows the upper and lower insulation panels to be removed (Figure 3B) and replaced according to the apertures required for any given experiment. The soft ceramic also allows for insertion of additional thermocouples for monitoring internal temperatures if needed, or fitting of a gas line to allow heating under a controlled atmosphere. In the XRheo setup, the upper and lower insulation plates were drilled to give a central circular aperture, with the diameter of the hole kept to ∼1 mm larger than that of the cup (lower) or spindle (upper) (Figure 3B). To minimize heat losses a second pair of insulation plates were placed on the closed furnace at 90° to the furnace closure (not shown in figure). The insulation pieces that allow X-ray transmission, holding the X-ray windows upstream and downstream from the sample, are equally versatile and can be square cut (for tomography) or fanning outward (The Pele furnace has been used for high temperature diffraction studies on i12-JEEP). It is also possible to insert a solid high transmission window into the ceramic insulation should heat losses need to be minimized or atmospheric conditions within the furnace volume controlled.
The height (55 mm), length (173 mm), and width (155 mm) of the furnace enclosure makes it highly versatile. The system can be mounted above or below (as shown here, Figures 1, 3) the rail, and the rail can be located upstream or downstream (as shown here, Figures 1, 3) of the sample. When mounted below the rail, the thermocouple control and power cables for the furnace connect to the bottom of the unit, allowing space above for user access or additional equipment. The furnace rail can be mounted on the optical breadboard that supports the XRheo or can be integrated with other in situ apparatus. The furnace has been successfully mounted on the Deben open frame 10 kN deformation cell. It can also be used in a vertical configuration, hanging from the rail or a custom mounting system. This makes it compatible with laboratory scanning systems. In the vertical orientation the ram apertures and X-ray windows are switched. This enables source-sample and sample-detector distances to be reduced (minimum of 30 mm) to the distances necessary for high resolution laboratory scanners, although additional heat protection for the source and detector would be needed and would increase this distance slightly.
With the heat sinks of the XRheo cup and rams in place, the sample and spindle rotating, and additional air cooling focused on the upper part of the spindle to prevent overheating of the rheometer head air bearing (Figure 1) there is a reproducible differential between control loop temperature and sample temperature of ∼50°C for sample temperature of 500–1,200°C. This was calibrated from the rate of sintering in the boro-silicate bead pack, as we have thorough understanding of, and accurate control on, sintering (Wadsworth et al., 2017). This differential will vary with sample and cup materials as should be calibrated for a different experimental set-up.
Heating Schedules With the XRheo
On both beamlines, the hot zone of the furnace system is centered on the imaging field of view. The samples were heated to the chosen dwell temperature at 10–20°C/min and held there until the end of the experiment. In cases where solid samples were loaded the sample was heated to temperatures 1,000°C, usually much higher than target experimental temperatures to increase the speed of equilibration around the spindle and promote coupling. At the end of the experiments, the temperature can be ramped back down or quenched by turning off the furnaces and allowing the samples to cool in place before sample change. All cups and ceramic spindle tips are single use consumables for all high temperature experiments. The two high temperature experiments described here [see sections “Bubble Bearing Magma (High Temperature)” and “Three-Phase Magma (High Temperature)”] were performed at a dwell temperature of 900°C.
Image Acquisition
While the tomography acquisition condition can be changed for each sample, this increases the chance of human error, especially when calculating rheometer control in terms of relative difference in rotation speed. Therefore, for simplicity, we define image acquisition parameters (rotation speed, exposure time, and project number) at the start of the experiment using a high-density sample. Reducing the exposure time, or even underexposing, generates more TPS and less motion blur, but this will eventually cause a level of signal to noise that prevents post-processing and accurate analysis of the data. Reducing the number of projections acquired per tomography while keeping slightly longer exposure times can also increase the TPS that can be collected, but again, can lead to degradation of the data quality (although this may be preferable with the latest iterative reconstruction algorithms, see below). The acceptable limit of quality reduction must be defined on a case by case basis.
Typical acquisition schedules showing the link between the beamline, deformation control, and heating is shown in Figure 4. This structure was used on the TOMCAT and i12-JEEP beamlines to acquire the data presented below.
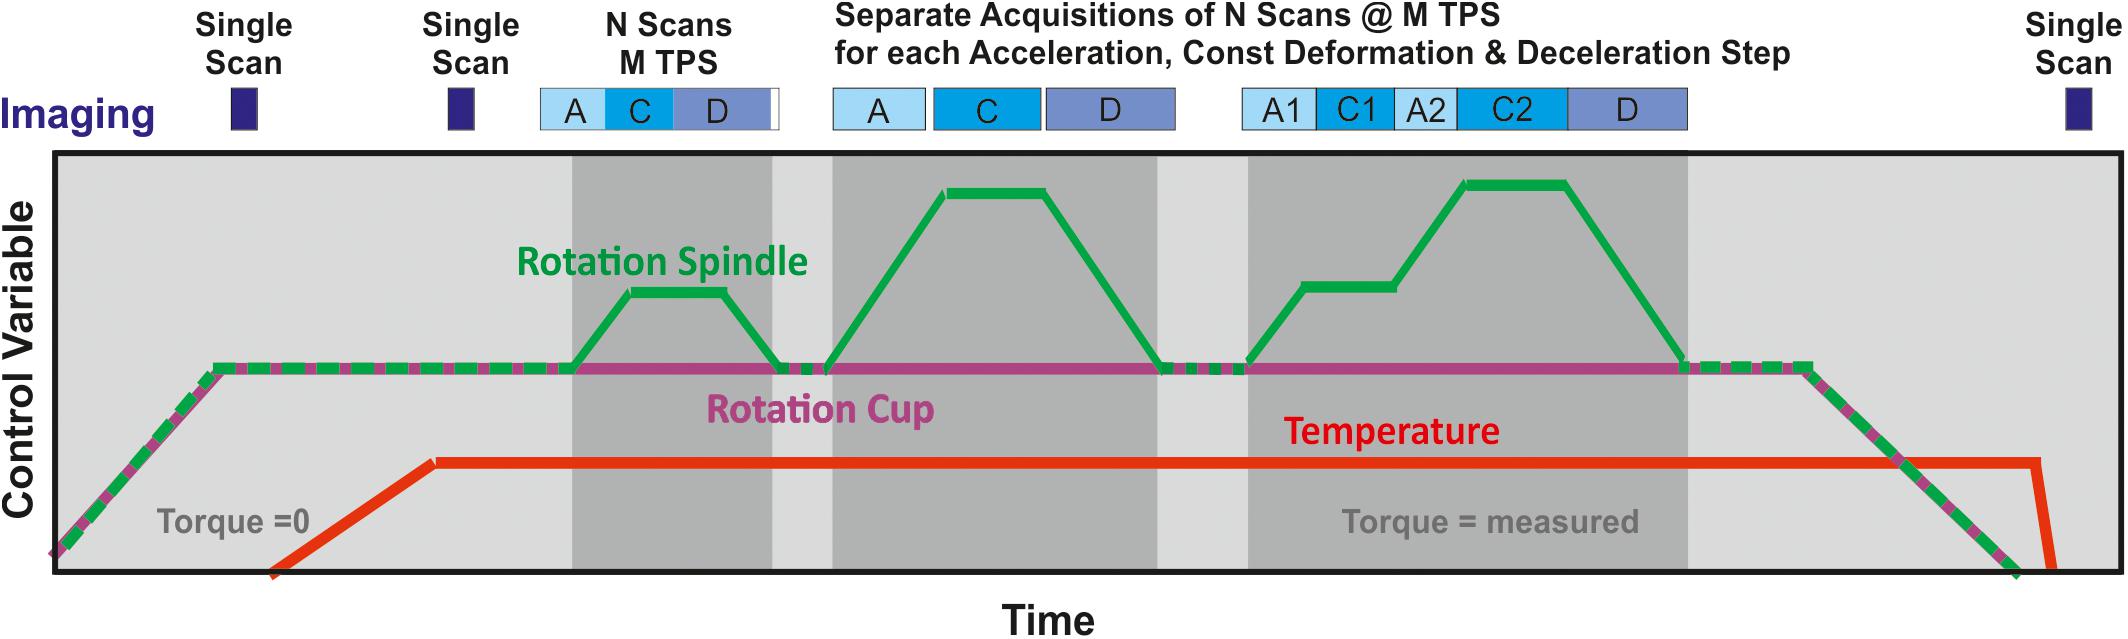
Figure 4. Acquisition schedules typically used with the XRheo, showing how single scans of the sample pre- and post-experiment are collected, and how the timing of the repeated multi-scan acquisitions can fit in a deformation cycle. The full deformation cycle can either be captured as a single scan, or as a series of condition specific data sets for the acceleration (A), constant deformation (C) and deceleration stages (D). The maximum TPS used in an experiment would not usually change, but TAR can be adjusted according to the deformation, as can the total number of tomographies being collected. Some beamlines require time between scans to download the data to network storage. This can be achieved during periods of zero torque (i.e., spindle moving with sample, no deformation) or during extended periods at any of the constant deformation stages. Experiment duration is dependent only on the acquisition capability of the beamline. Heating rates of 20°C/min were used to best control glass behavior (Wadsworth et al., 2019). Cup rotation speed is fixed by image acquisition, and rotation speed of the spindle calculated accordingly with a minimum differential determined by the sensitivity of the rheometer control (0.01 rpm differential at the highest cup rotation speed used in these experiments). The strain rates within the sample are therefore controlled by the spindle rotation speed and the cup and spindle diameters.
We present data collected at TOMCAT for which optimal conditions for high temperature borosilicate melt plus up to 30 vol % rutile crystal cargo were 1s per tomography, collecting 1000 projections per tomography (180° rotation) with an exposure time of 1ms. The data were acquired on the GigaFRoST detector (Mokso et al., 2017), with a 3.7 μm reconstructed voxel (3D equivalent to a pixel) resolution. Up to 150 tomographies were collected in each run. At 1 TPS there was negligible motion blur in the reconstructed data except where coalescence was occurring. Faster rotation is therefore unnecessary for the lower deformation speeds from 0.01 to 1 rotations per minute (rpm) differential speed (equivalent to strain rates of 10–3 to 100 s–1 at the spindle surface, within the range of those reported for natural systems and experimental studies (Mueller et al., 2011; Vona et al., 2011Pistone et al., 2012; Kendrick et al., 2013; Chevrel et al., 2015; Kolzenburg et al., 2016). To avoid unnecessary post-experiment data processing steps the projections were always collected over the 0–180° arc of the rotation; no data were collected from 180 to 360°. The magnitude of the deformation at the lower strain rates will require less frequent, but not slower, image acquisition. The tomography acquisition rate (TAR) for the data presented (0.15 and 0.3 rpm differential speed) was 0.07/s (1 tomography every 7 rotations, every 14 s, ∼4 tomographies per minute). The data were reconstructed using the standard TOMCAT pipeline.
We also present data collected at i12-JEEP, for which optimal conditions for high temperature borosilicate melt plus rutile crystal cargos were 0.25–0.5 s per tomography (depending on rutile content). We collected 720 projections per tomography (180° rotation) with an exposure time of 150–300 μs. The data were acquired using the MIRO 310M camera using module 3 magnification, giving a 7 μm reconstructed voxel resolution to increase maximum FPS. For the low temperature analog materials acquisition times reduced to 0.125 per tomography, giving a maximum of 8 TPS, and 360 projections per tomography. This enabled imaging of the lower viscosity analogs with deformation speeds of up to 10 rpm differential speed. The projections were always collected over the 0–180° arc of the rotation. The scanning was performed at a minimum sample-detector distance to minimize the phase contrast, which tended to make the bubble bearing samples harder to processes. The gap used depended on the experiment and deformation rate. Data were downloaded between each run, and in each run a maximum of between 43 and 75 tomographies could be collected depending on the height of the cropped image. The TAR for the high temperature data presented was 0.07/s (as for TOMCAT) for the same sample deformation conditions. For the low temperature analogs, and faster deformation rates, the maximum TAR was 1/s (1 tomography every 4 rotations, every 1 s). The data were reconstructed using the standard i12 pipeline.
Four-dimensional Observations: Deformation and Strain Localization During Bubbly Magmatic Flow
The focus of this article is technical and methods innovation, and the application of these methods to experiments relevant to volcanological research. Thus, the XRheo system as used here is designed to simulate the conditions of volcanic flow. Detailed analysis of the data and subsequent interpretation will be presented elsewhere. A selection of images and features that show the capability and sensitivity of the method are highlighted in the following sections. Three- and four-dimensional image data are challenging to present on a page; here we show a series of 2D slices through the reconstructed volume along with the relationship of that slice to the data (Figure 5). No difference is seen in the general behavior across the height of the sample, and the spindle tip extends well below the field of view. In subsequent images, all 2D slices are the mid-point slice (relative equivalent to the red slice Figure 5) and all images have been overlain with a 7 × 7 grid to aid description of the feature locations and visualization of the displacements.

Figure 5. Two-dimensional grayscale slices perpendicular to the rotation axis showing the same slices from the 9th and 10th tomographies at different heights within the sample. The upper right schematic shows the location of the slices within the sample volume: light blue = slice 50, dark blue = slice 100, red = slice 150 (mid-point), yellow = slice 200, green = slice 250, as shown in the image border color. #9 and 10 are at the onset of acceleration when spindle speed = 0.02 rpm clockwise. In the image data, the black regions are bubbles (or air outside the cup), the mid gray is the ceramic of the spindle and cup, and the pale gray is the borosilicate melt. A 7 × 7 gray grid has been overlaid on all XY images to assist in identifying the displacements and the features discussed in the text.
All data have been visualized and processed in Avizo© 2019.2 (Thermo Fisher ScientificTM). The data shown have received minimal post processing. The data in Figures 5–7 have been cropped, down sampled (voxel size now 7.4 μm) and filtered using the Anisotropic Diffusion filter (five iterations) with the default settings as defined by the algorithm from the grayscale distribution. The data in Figures 8, 9 have not been processed. These are the raw reconstructed data.
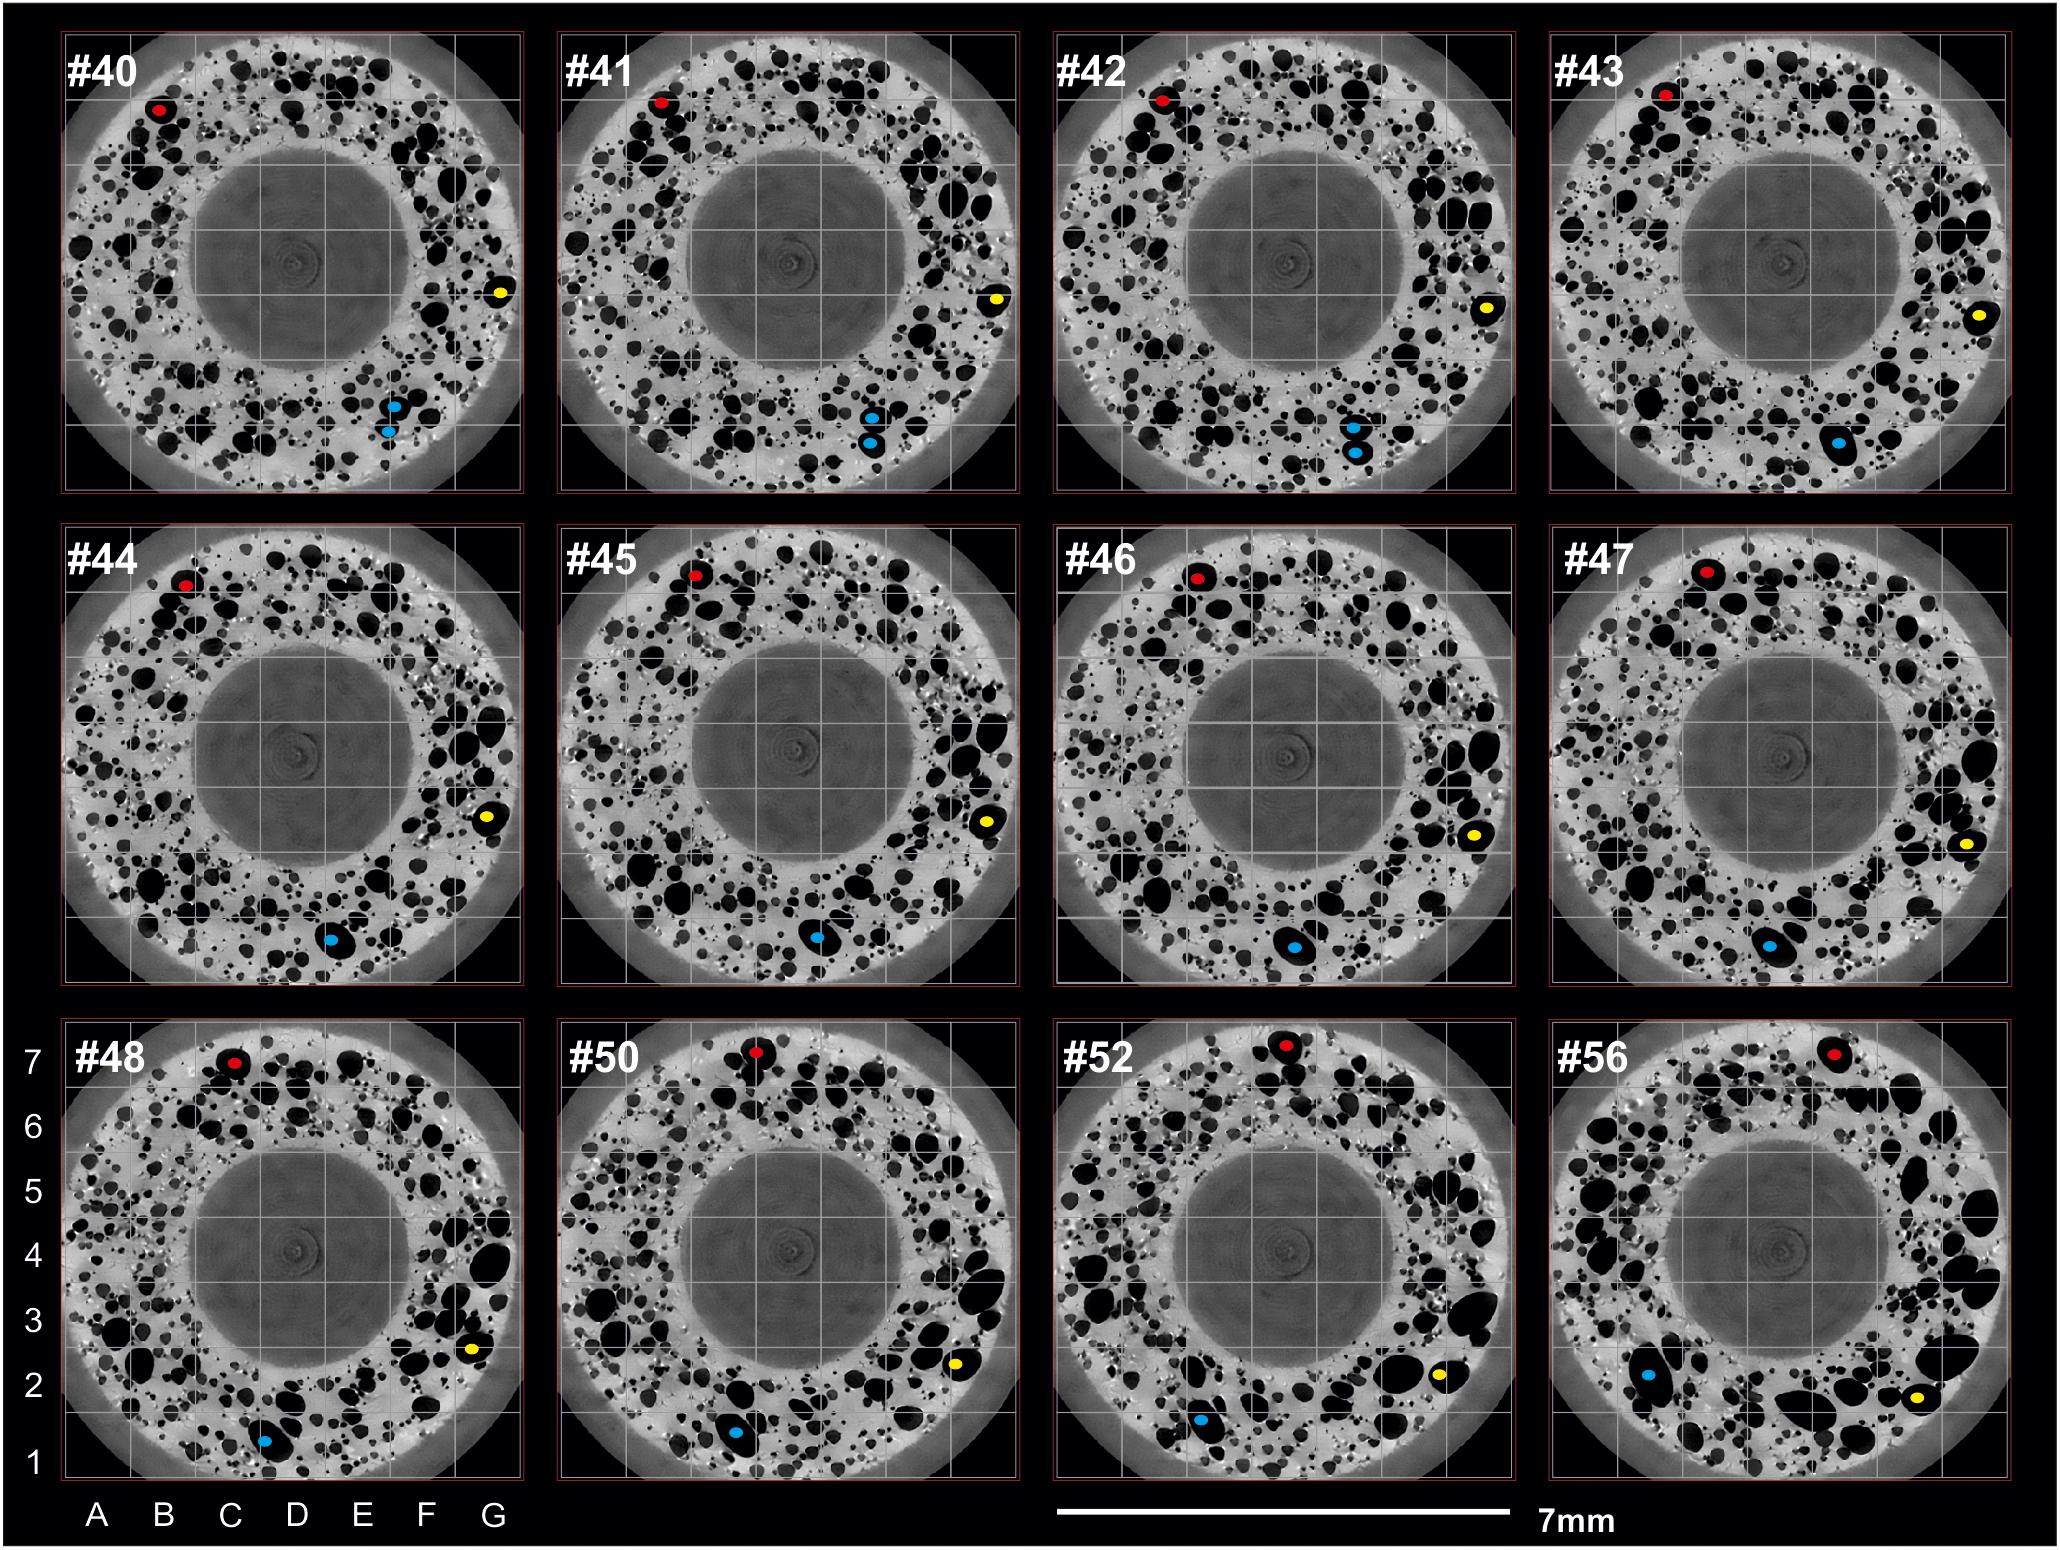
Figure 6. Two-dimensional grayscale slices perpendicular to the rotation axis showing the deformation and coalescence in the mid slice tomographies between #40 and 54 during the acceleration to 0.3 rpm differential rotation. Three bubbles are highlighted (red, yellow, blue) see text for details. Note that bottom row of images shows every other image.
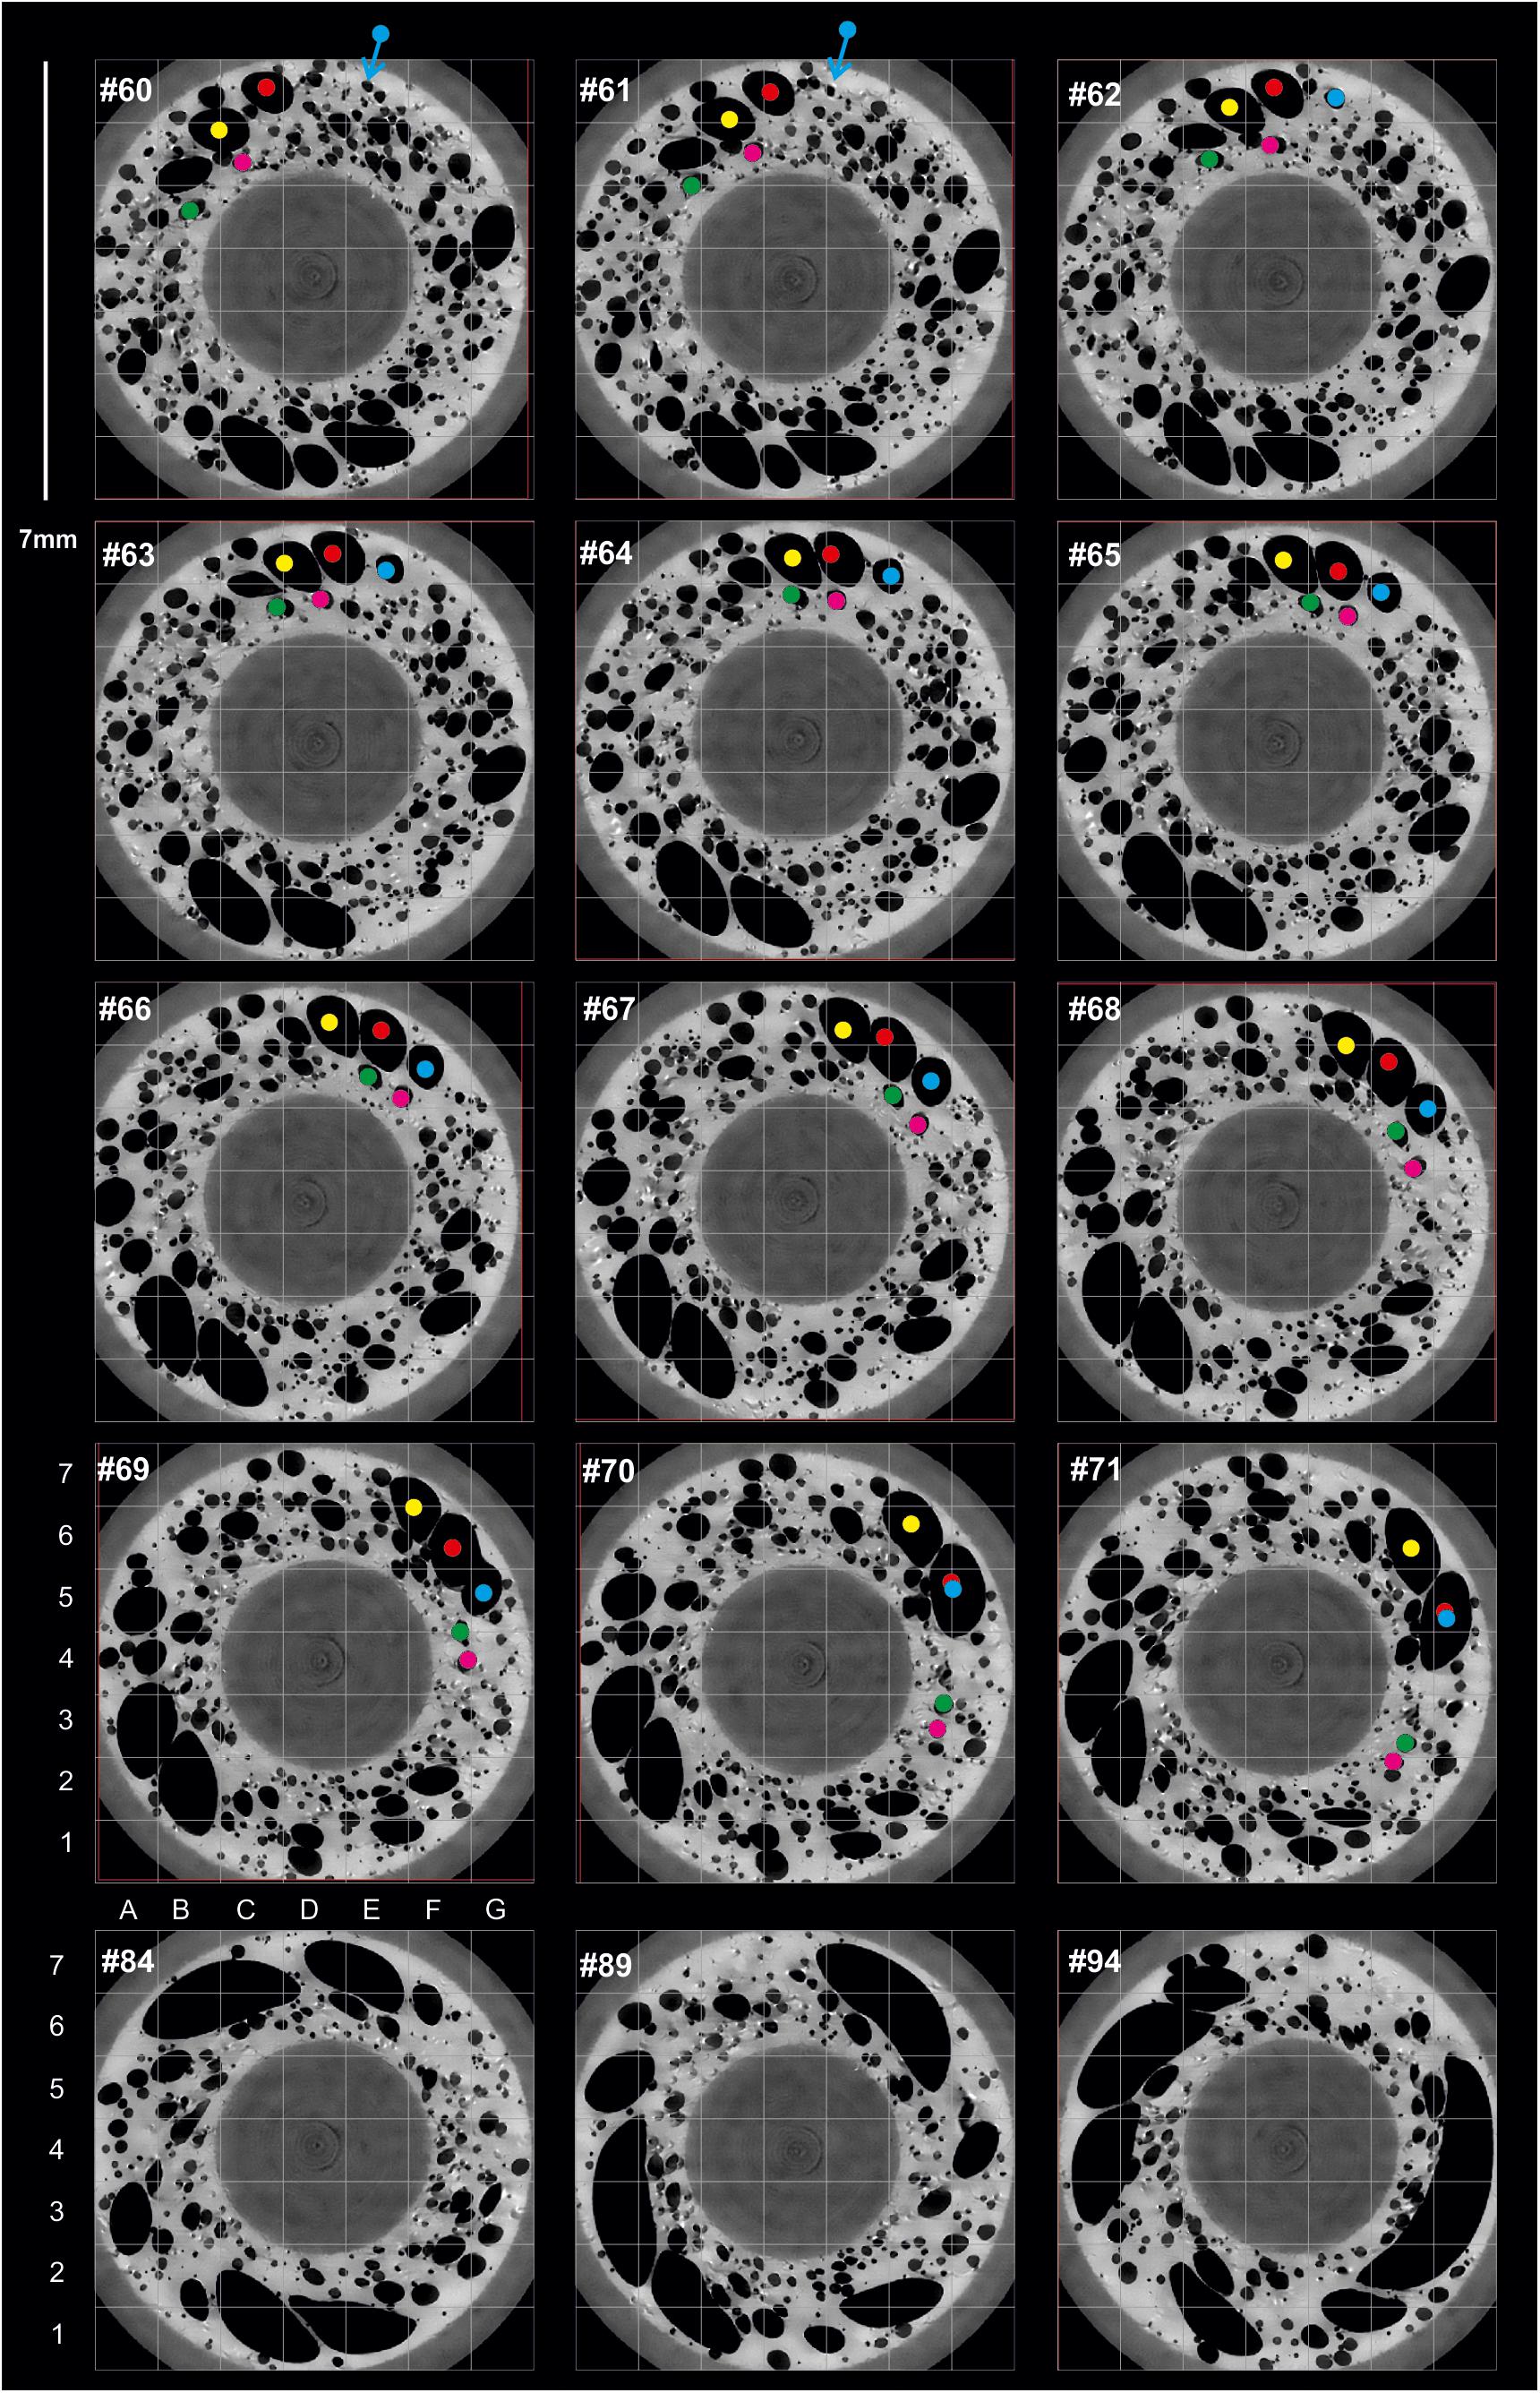
Figure 7. Two-dimensional grayscale slices perpendicular to the rotation axis showing the deformation and coalescence in the mid slice tomographies between #60 and 94 during the end of acceleration and the start of steady state deformation at 0.3 rpm (#80 onward). Five bubbles are highlighted (red, yellow, blue, green, pink) see text for details. Note that the bottom row shows every 5th tomography over the initial part of the constant deformation.
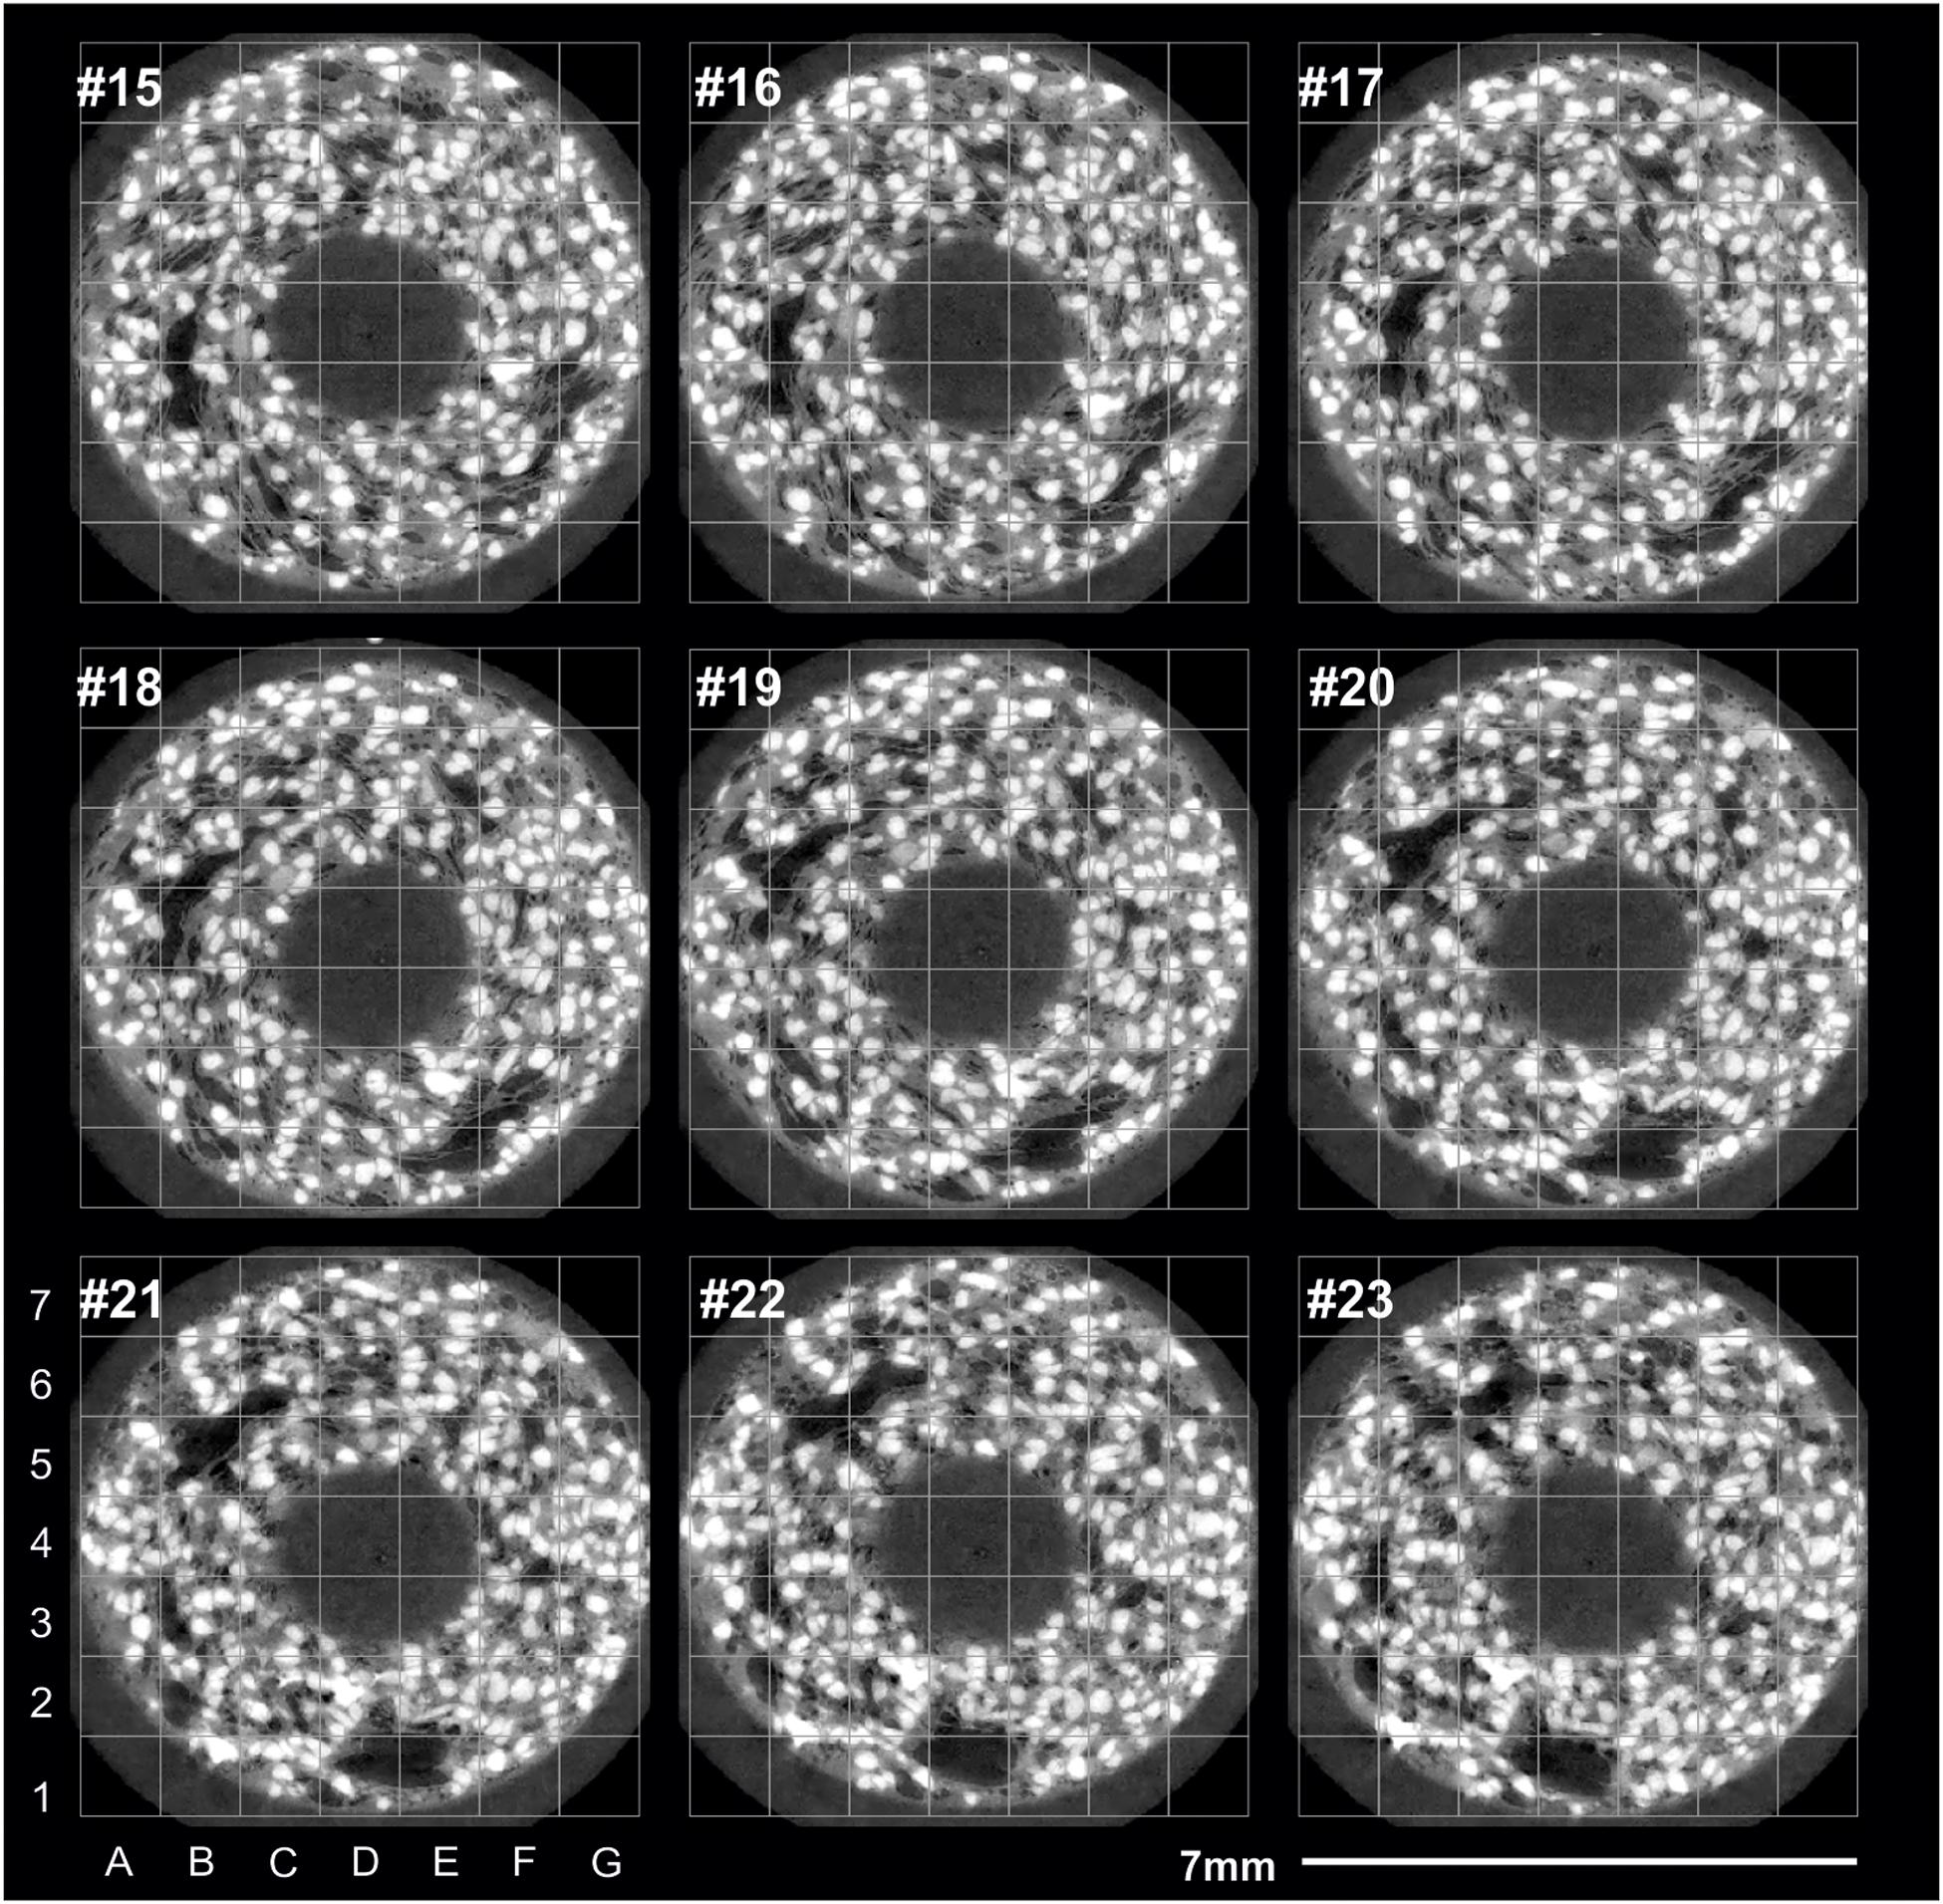
Figure 8. Two-dimensional grayscale slices perpendicular to the rotation axis showing the deformation and coalescence in a selection of slices through a three-phase system. The sample was sintered from the same glass bead pack with 30% rutile crystals. See text for discussion.
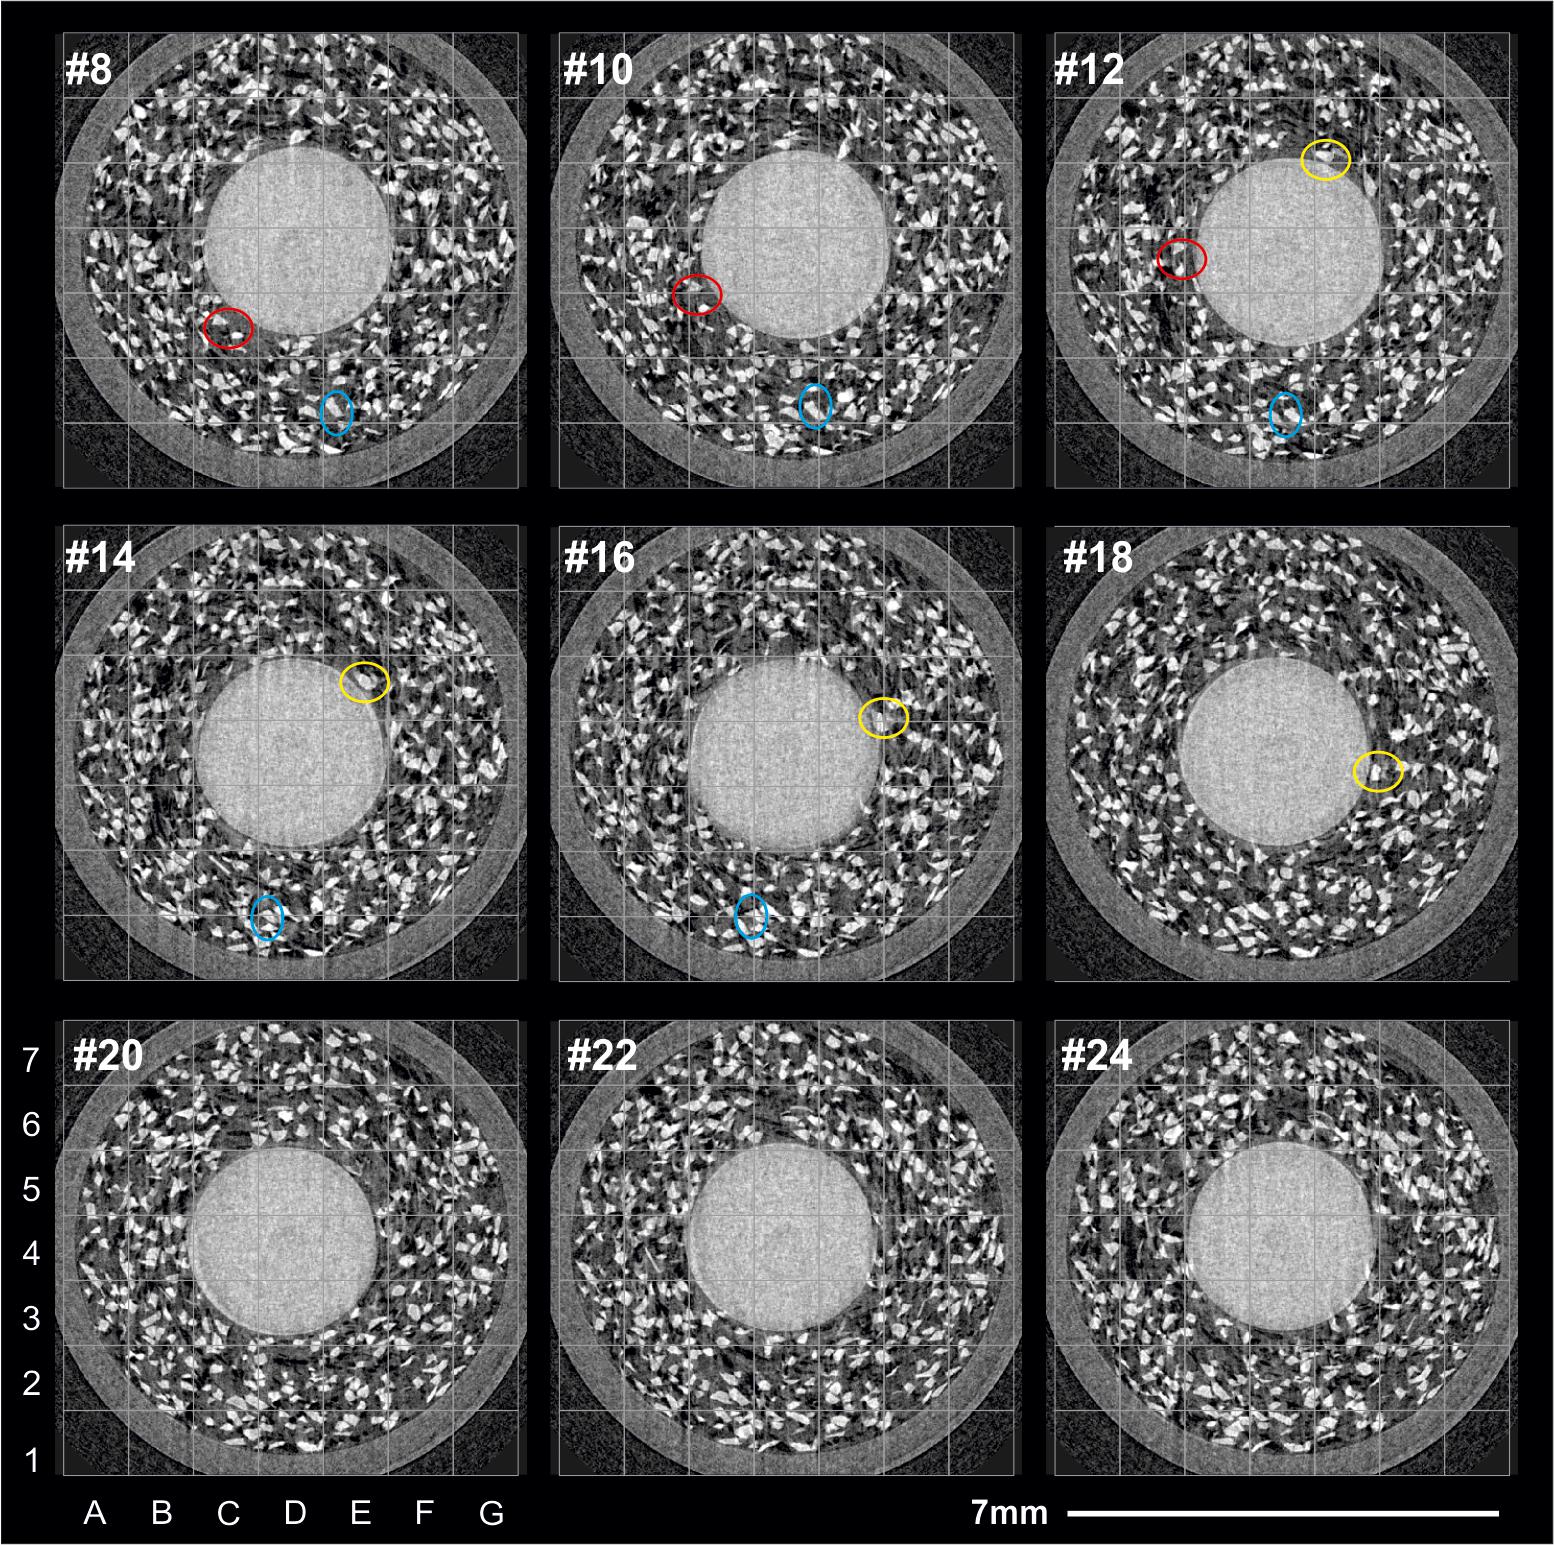
Figure 9. Two-dimensional grayscale slices perpendicular to the rotation axis showing the deformation and coalescence in a selection of slices through a low temperature analog system. N2700000 + 30% by volume olivine crystals. See text for discussion. The red, yellow and blue circles show examples of specific crystals and crystal clusters that can be tracked between frames. Note that rotation of crystals and translation out of the plane of the image makes 2D only tracking challenging.
Bubble-Bearing Magma (High Temperature)
Figure 6 shows the evolution and displacement of the bubbles in the middle slice through time. The images are taken from the acceleration phase of the deformation cycle. Deformation starts in the 5th frame collected (#5) and it reaches 0.3 rpm differential speed at #80. The spindle is moving in a clockwise direction faster than the cup, which is stationary in the image reference frame. Three bubbles have been picked out with colored labels (red, blue, yellow). These highlight different behaviors. The red bubble close to the cup (B6, #40) is displaced along a broadly circular path (C7, #47), but as deformation increases, we start to observe an additional component of outward radial displacement (D7, #54). The blue bubbles (E1, E2, #41) undergo coalescence between #42 and 43, then remain nearly stationary for a few frames while the volume around them responds to the change in local stress following the coalescence. The bubble then starts to move and elongate (#42–48) then expands possibly by vertical translation through the plane of the image or by coalescence with bubbles out of the plane of the image, as the bubbles surrounding the blue bubble are not captured. The yellow bubble is almost stationary until frame #46 but then follows a circular displacement path, the bubbles around it showing coalescence and significantly different displacement rates (not the differences in bubble structure in the region between the red and yellow bubbles (#50–56). Substantial microstructural changes are occurring even at the onset of deformation.
Figure 7 shows the same sample much later in the deformation, during the final part of the acceleration, and the initial stages of the constant rate deformation. The bottom three frames are during the constant deformation stage. Much larger bubbles have formed through coalescence (as seen relative to Figure 6), and coalescence continues through the experiment. The higher deformation rate is reflected in the greater elongation of the bubbles, and we see more evidence for shear localization.
Five bubbles have been identified in #60 and tracked through the time series, although the same behaviors can be seen throughout the volume. The blue bubble increases in area from #60 to 65 by movement through the plane of the image and not by coalescence. The blue and red bubbles coalesce, and in #69 we can see the coalesced bubble undergoing relaxation. A higher TAR would have enabled capture of the coalescence events in more detail. The yellow bubble coalesces with the bubble trailing it (not colored) between frames #65 and 66, but does not coalesce with the red, or red-blue bubble pair despite the film thickness between the yellow-red pair and the red-blue pair being similar and tall three bubbles being close in volume. The green and pink bubbles are at the same radial distance but are traveling at different speeds, although both are traveling faster than the yellow-red-blue bubble train. The green bubble “catches up” to the pink, and then both approach a third bubble of similar size and radial position that is moving at an even slower rate. Throughout the volume we can see short lived apparent slip surfaces developing, and the formation of a “nested annular” structure.
Similar to the yellow-red-blue bubble train, two of the three large bubbles in C1, D1, and E1 at #60 coalesce between #62 and 63, but despite having a very thin film between them, do not coalesce until the sample moves from the accelerating to the constant deformation stage. These bubbles are in much closer contact than the red-blue pair that undergo coalescence (#68–70). Many of the bubbles also show deformation that gives an apparent rotation inward toward the spindle, and in some instances the bubbles develop a concave geometry on the spindle-facing bubble surface.
The 2D time series data displayed in Figures 6, 7 demonstrate how much deformation can occur at even low strain rates and low total strain. No coalescence was observed when the sample was left undeformed over the same timescales. The bubble number and bubble size distribution at the start of the constant deformation (e.g., #84, Figure 7) is significantly different than at the start of the experiment (cf. Figure 6). Images from later during the constant deformation continue to show coalescence and elongation throughout the experiment.
This sample will be used to illustrate the more complex quantitative methods applied to the XRheo data set (see section “Quantifying Displacements and Heterogeneity in Flowing Magma”).
Three-Phase Magma (High Temperature)
An example of the complexity in 3-phase (melt + crystals + bubbles) deformation can be seen in Figure 8. This sample contains a 30 vol % volume crystal load. In this small subset of the acceleration phase, the spindle has accelerated to approximately half the final differential speed of 0.07 rpm. Translation and rotation of crystals is apparent throughout the volume, and the bubbles are both more highly deformed, and undergoing less coalescence than in the crystal-free, bubble-bearing magma (Figures 6, 7). The high density of the rutile grains causes some beam hardening and minor streak artifacts visible in some parts of the data. The formation, deformation, and breaking of chains of crystals can be seen. In the region surrounding B6 and C6, crystals are “rolled” along (migrate with the bubble and show some rotation) one surface of the bubble while the crystals on the opposite surface remain unaffected.
Low Temperature Analog (Room Temperature)
Low temperature analogs are widely used to allow more systematic testing of parameter space, and they often allow more control in the sample preparation or exploration of systems that are unstable in laboratory conditions. The XRheo has been tested with the Canon N2700000 high viscosity standard mineral oil, working at higher deformation rates than used for the magmatic samples above. The data presented in Figure 9 show a short part of a steady state 5 rpm differential speed deformation step within a longer experiment. These data do show a small and variable amount of motion blur, but this does not prevent qualitative and some quantitative analysis. Like in section “Three-Phase Magma (High Temperature)”, this sample has 30 volume % crystals, but the lower viscosity of the sample and the more irregular shapes of the olivine crystals allow observation of crystal rotations. Strain localization is observed but it is generally less focused and less long-lived than seen in the magmatic samples.
Quantifying Displacements and Heterogeneity in Flowing Magma
The spatial heterogeneity within magma and the highly dynamic (e.g., changes in crystal and bubble fraction, melt viscosity) nature of the system during storage, transport, and eruption makes it extremely challenging to understand how the microstructural evolution effects the macroscopic properties. Understanding this control is the objective of many experiments in the volcanic and magmatic studies that work to quantify how features move, how deformation is accommodated, how bubbles and crystals interact, and how textures evolve through time. Ultimately, many of the key magmatic and volcanic processes we wish to understand, such as mobilization, mixing, localization, flow, degassing, fragmentation, welding, and many more, are all controlled by the microstructure (and how it is changing) at the time that the process is operating.
Understanding these processes therefore requires thorough in situ analysis while those processes are operating under realistic conditions. The experiments presented here focus on using the XRheo to understand bubble deformation, flow localization, and bubble interactions during magmatic flow, focusing on the processes of coalescence and degassing. The data show the processes occurring, but if these data are to be used to build models to predict real world behaviors, a quantitative understanding of the microphysics of the evolving magma is needed. Here we use the 4D XRheo XCT data to develop a new implementation of recently developed Digital Volume Correlation (DVC) algorithms that enable the local displacements and strains to be calculated and the causes and consequences of the structural and rheological heterogeneity within samples to be quantified. DVC is an optical flow-based image matching technique that can measure displacement and strain fields between two 3D image datasets and can measure displacements smaller than the voxel size (Bay, 2008; Tozzi et al., 2014; Hild et al., 2016; Sloof et al., 2016; Buljac et al., 2018).
Different DVC Approaches
Here we apply a novel DVC approach to the bubble bearing magma discussed in section “Bubble Bearing Magma (High Temperature)” and shown in Figures 6, 7.
The established “local” subset-based DVC approach divides the reference and the deformed images into smaller volumes that are then individually correlated (Bay et al., 1999; Smith et al., 2002; Madi et al., 2013; Buljac et al., 2018). This method generally yields displacement fields with small random errors (high precision) but high systematic errors (low accuracy) because the sub-volumes are treated independently and there is a loss of displacement continuity at the boundaries. The more recently developed “global” DVC approach assumes that a measured displacement field is continuous, and so yields more accurate and robust results close to the solution, but this approach is more computationally costly. Here we employ a protocol which uses the “local” approach to define an initial displacement field, which is then used as the initialization for the more robust global DVC.
Although the data are collected over the same angular interval, and are therefore pre-registered, the location of the cup and spindle drift slightly within the image volume over the time series. To interpret the displacement field within the melt, this rigid body motion was removed using the Registration algorithm in Avizo©, prior to running a DVC analysis. A single melt volume was then defined and this “sample mask” used to both remove the cup and spindle from the images and generate the 3D meshes that define the individual elements for the DVC.
Quantitative Analysis of Displacements on XRheo 4D Data
The overall workflow is presented in Figure 10. First, the “local” approach was applied to a simple cubic mesh defined within the DVC algorithm in Avizo©. The DVC algorithm them calculates the displacement field, and this is used to initiate the “global” approach across a coarse tetragonal mesh [Global Course (GC) mesh elements 79 voxels] generated from the sample mask (see Figure 10 for detail of the steps undertaken in this method). The displacement field output from that correlation (global course mesh, images 1 and 2 = GC1–2) is then used as the initialization for GC2–3. The output from GC2–3 used as the initialization for GC3–4 and on through the entire time series (Figure 10).
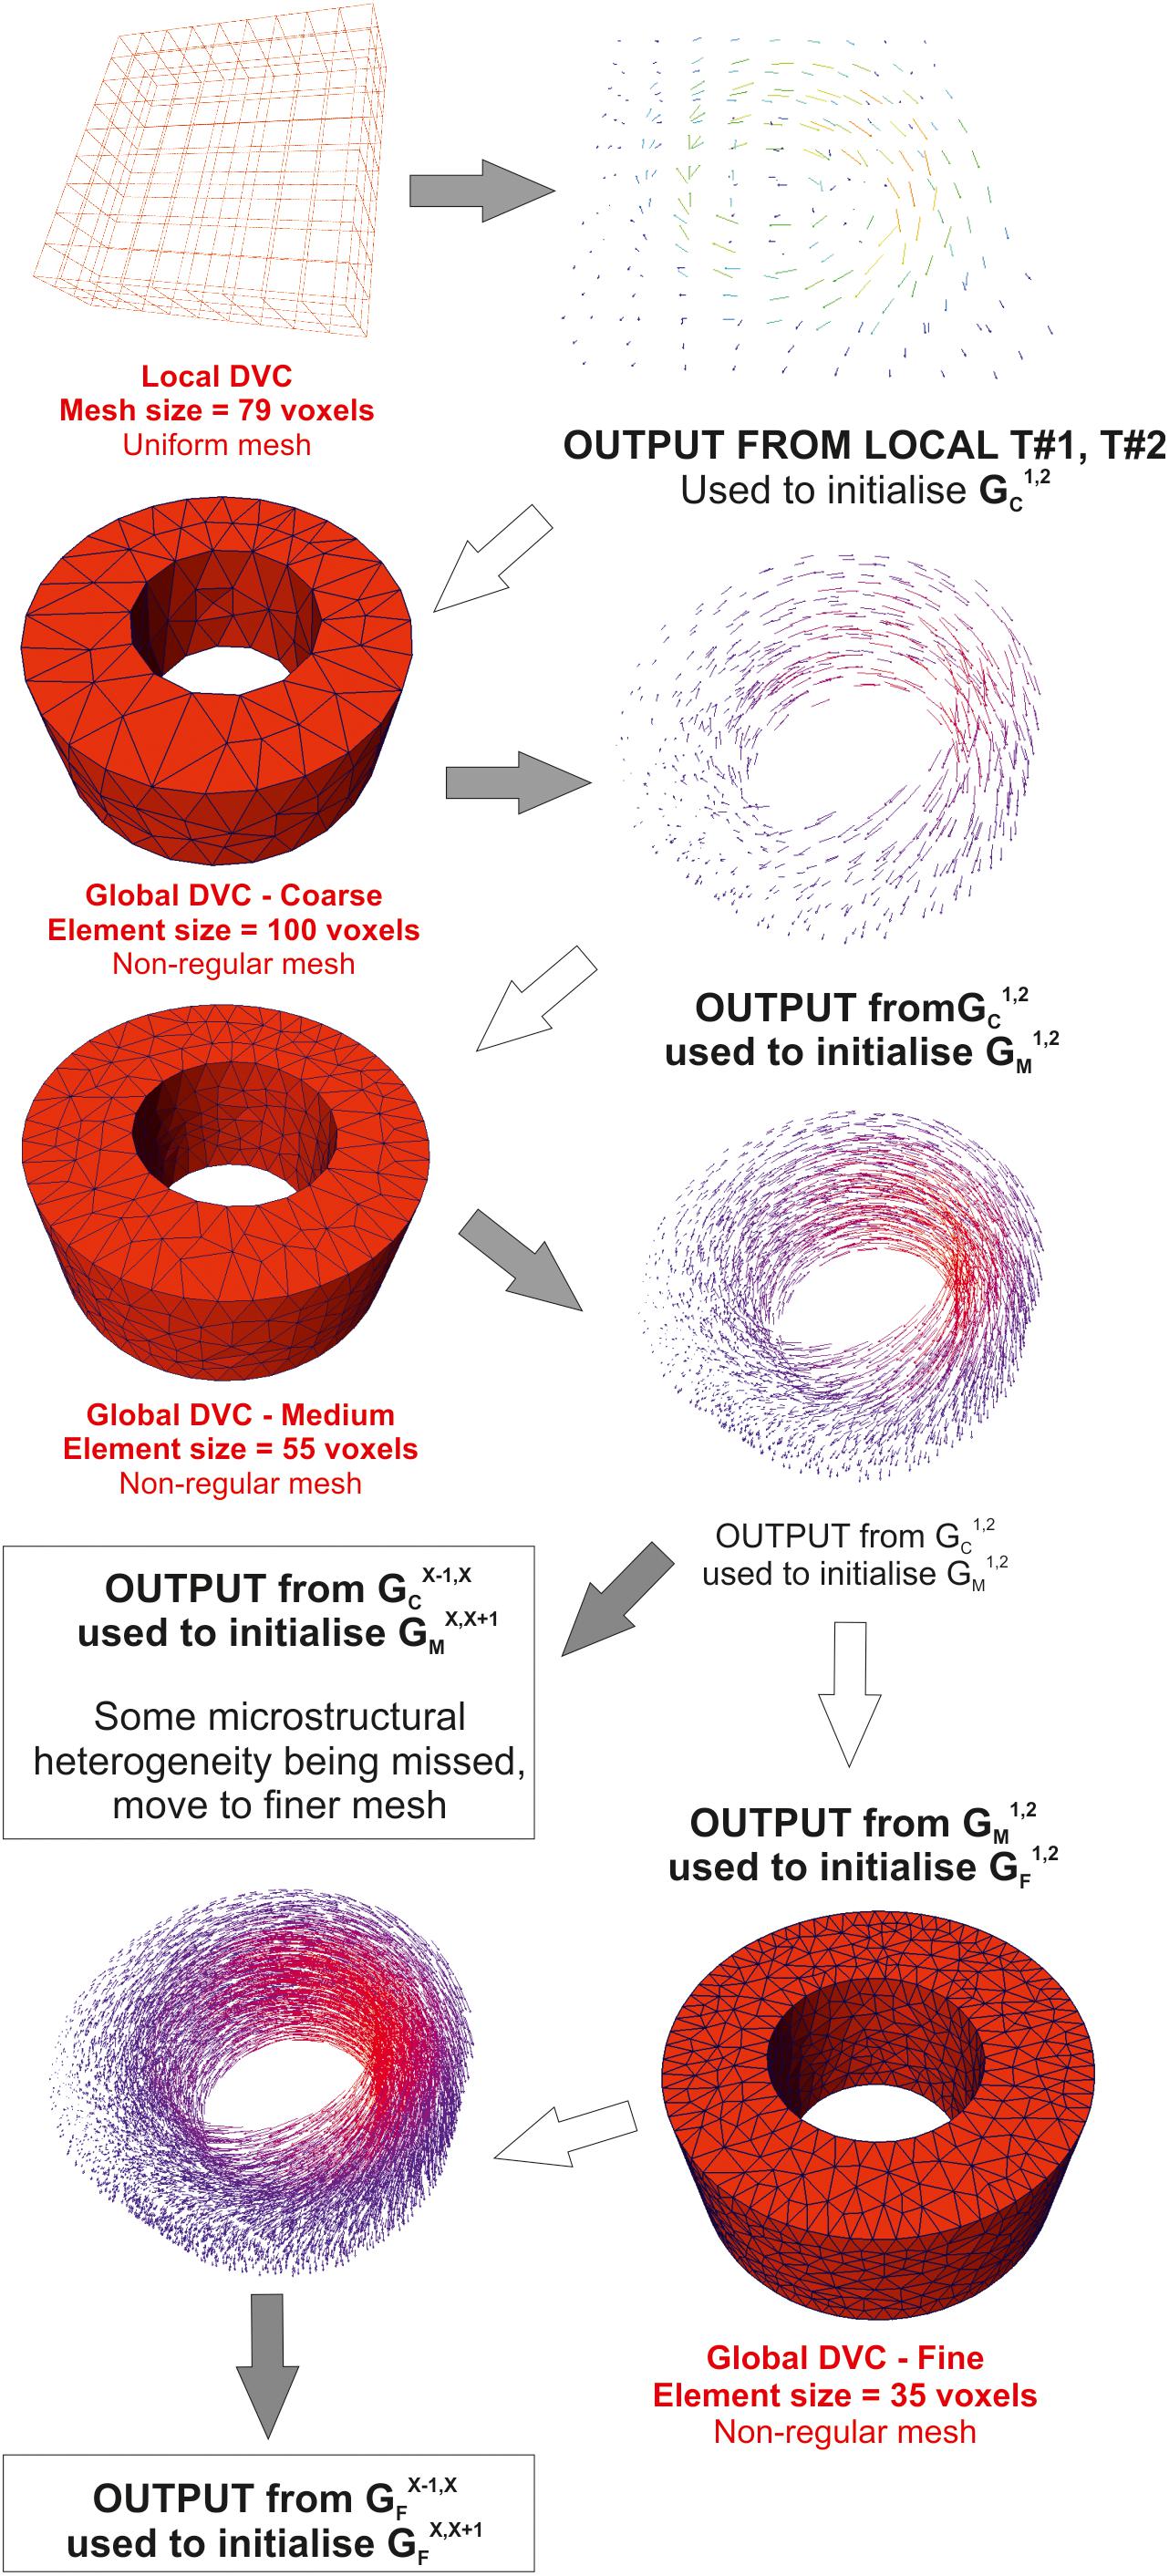
Figure 10. The local-global integrated DVC approach showing how the outputs from one iteration and scale can be used to initiate the calculation at the next spatial or temporal step. G, global; C, coarse; M, medium; F, fine. The size of the regular and irregular meshes should be adjusted to the sample structure and material texture under consideration. The meshes shown were those applied to the experiment discussed in section “Bubble Bearing Magma (High Temperature)” and shown in Figures 6, 7.
The heterogeneity observed by this process suggests that the GC mesh was smoothing some of the smaller scale displacements, and so a second iteration using a finer mesh (GM) with mesh elements of 55 voxels was then completed. Here GC1– 2 was used to initialize GM1– 2, and then GM1– 2 used to initialize GM2– 3 and on through the data (Figure 10). Throughout this process, the GC and GM outputs are broadly similar and show no evidence for divergence. At several time points the GMX-(X + 1) generated from GM(X– 1)– X was compared to that generated from GCX– (X + 1). While there are some small differences, the overall variations in the displacement field are small, confirming the validity of applying the GM (Figure 10). At the end of the processing, the DVC outputs were rendered as a volume color wash over the grayscale volumes. This comparison showed that some small-scale deformations were still not captured. A finer global mesh (GF) iteration with mesh elements of 35 voxels was then completed (up to #69 when the displacements become too large for the finer mesh and the data diverge). Finer meshes were not generated as these would generate a high number of mesh elements without textural information preventing accurate tracking. For each DVC output the displacement fields can be visualized as a 3D color wash volume, or as a vector field (Figures 11, 12) shown here with the vectors color coded by displacement magnitude. Tangential and radial magnitudes can also be extracted.
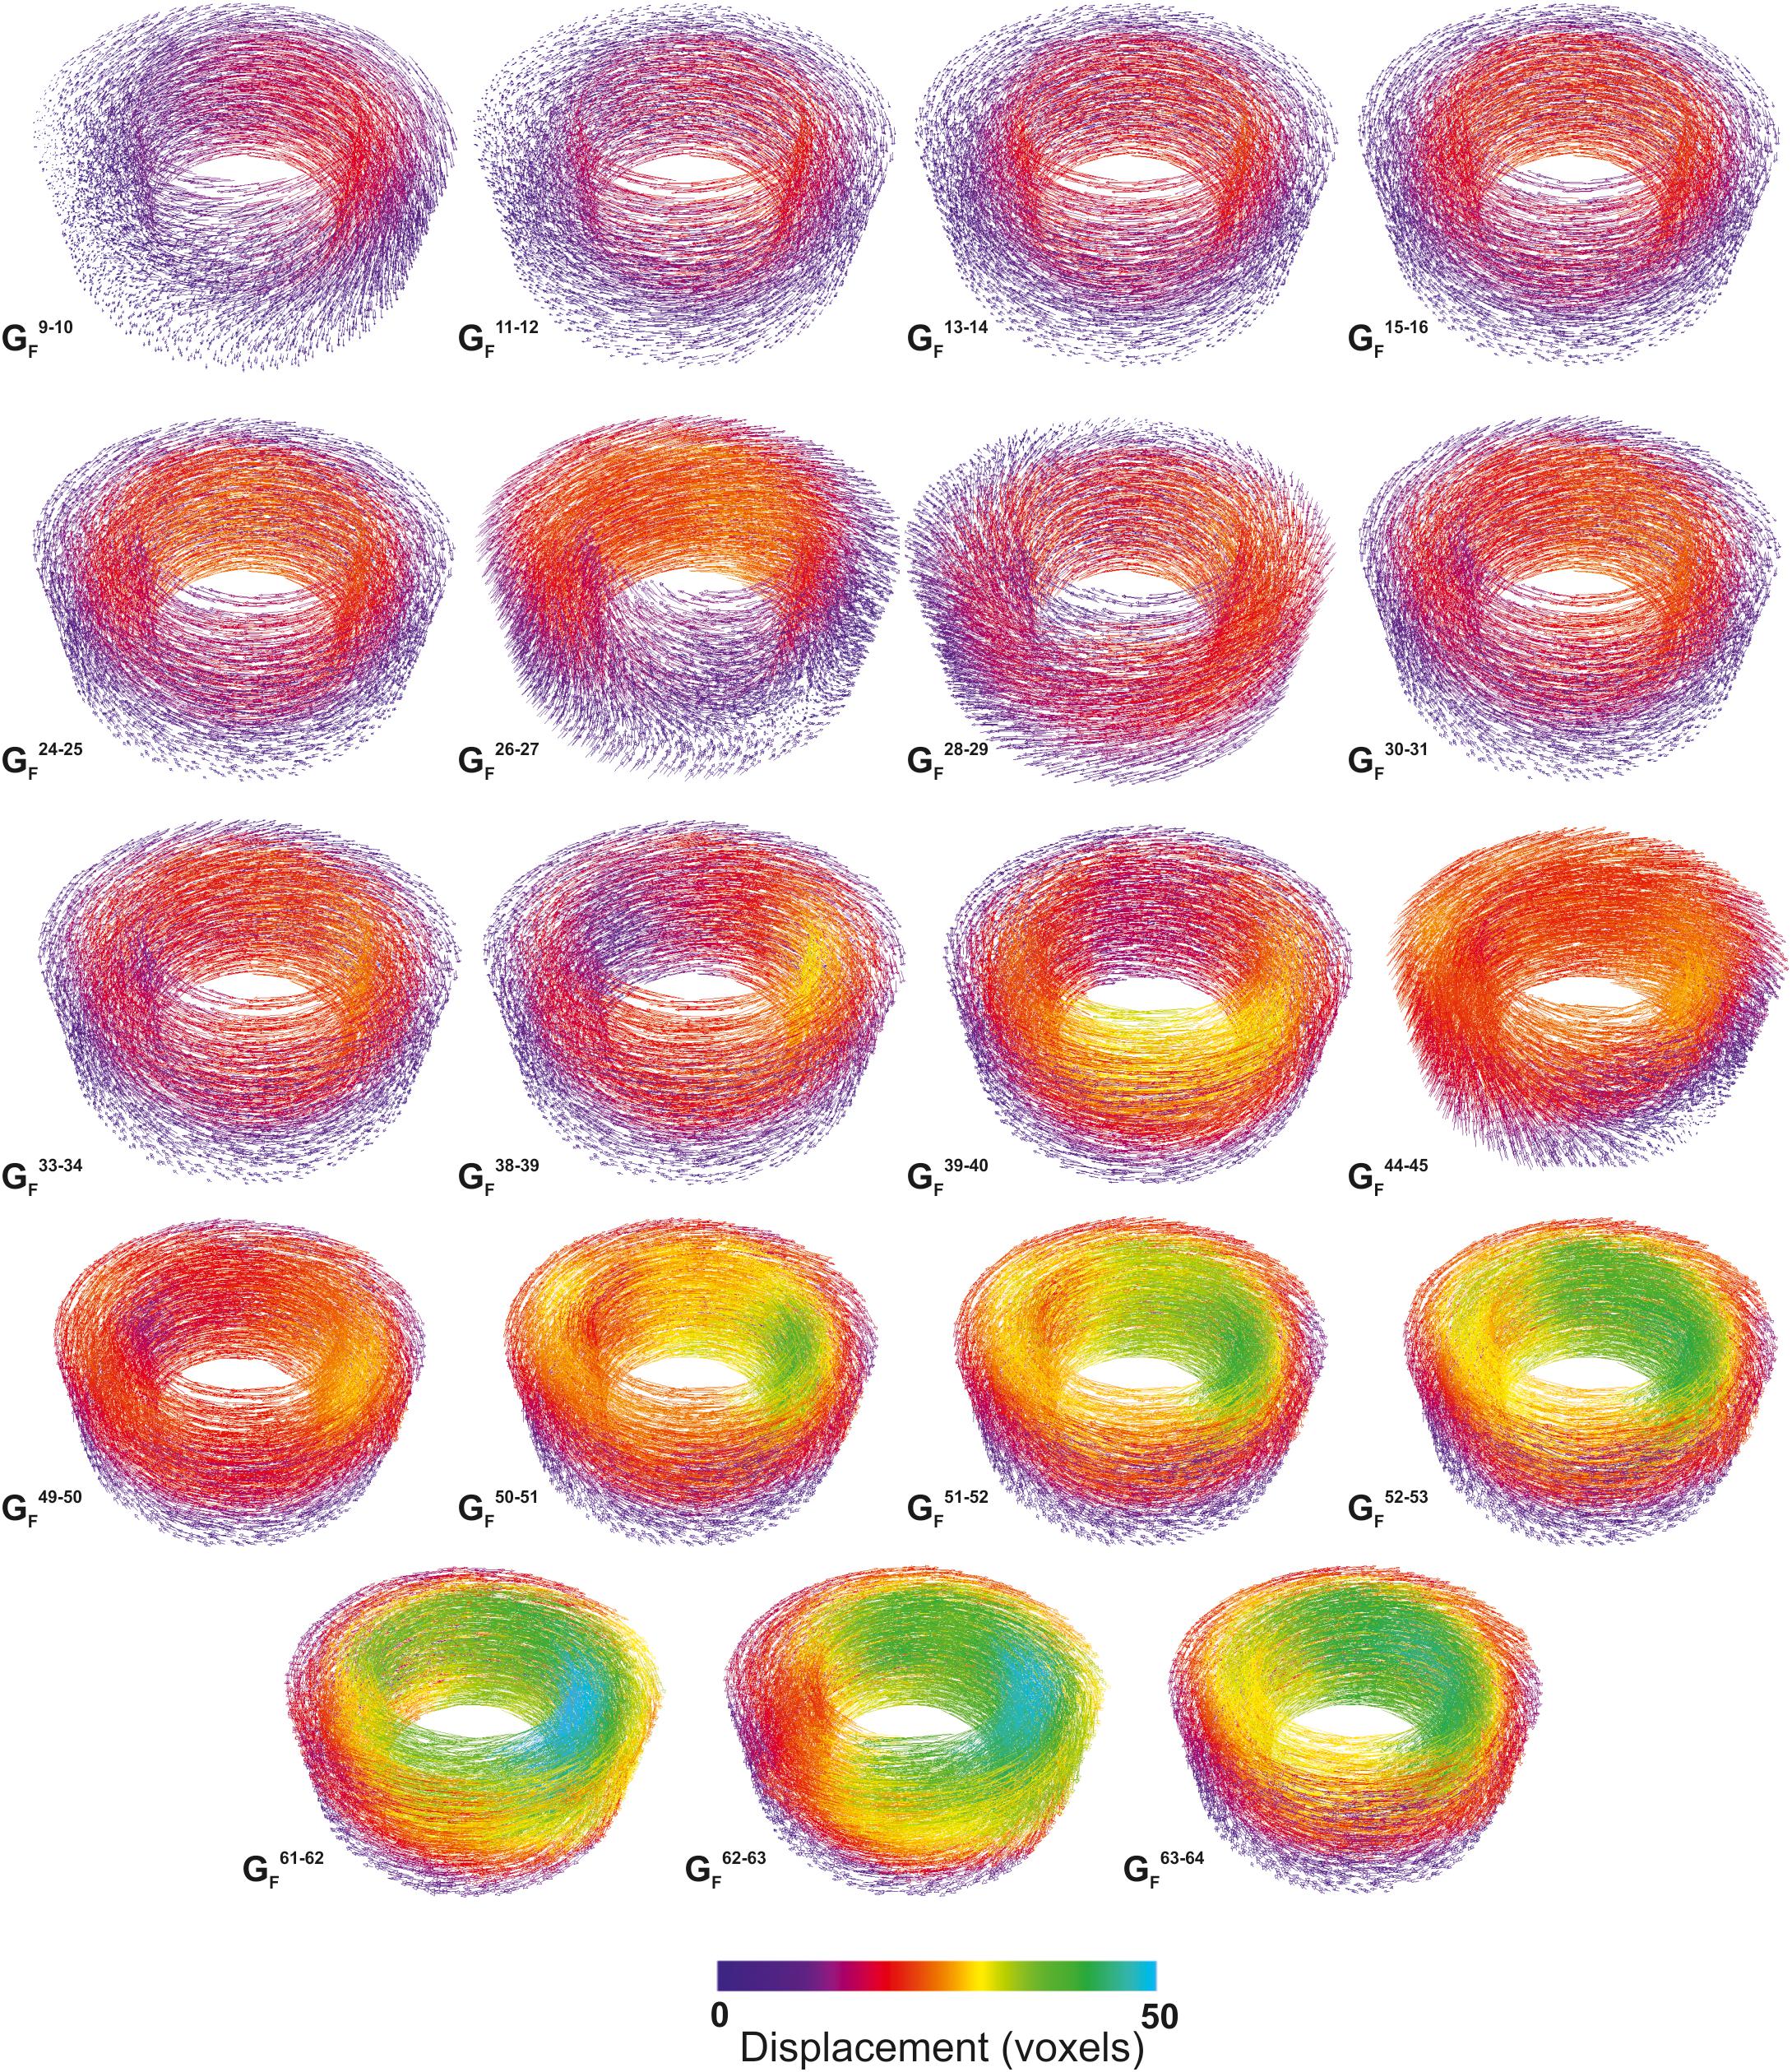
Figure 11. DVC outputs from the start of the acceleration phase. Note the discontinuous time steps shown. Workflow for iterations as shown in Figure 10. The outputs shown were those generated on the experiment discussed in section “Bubble Bearing Magma (High Temperature)” and shown in Figures 6, 7.
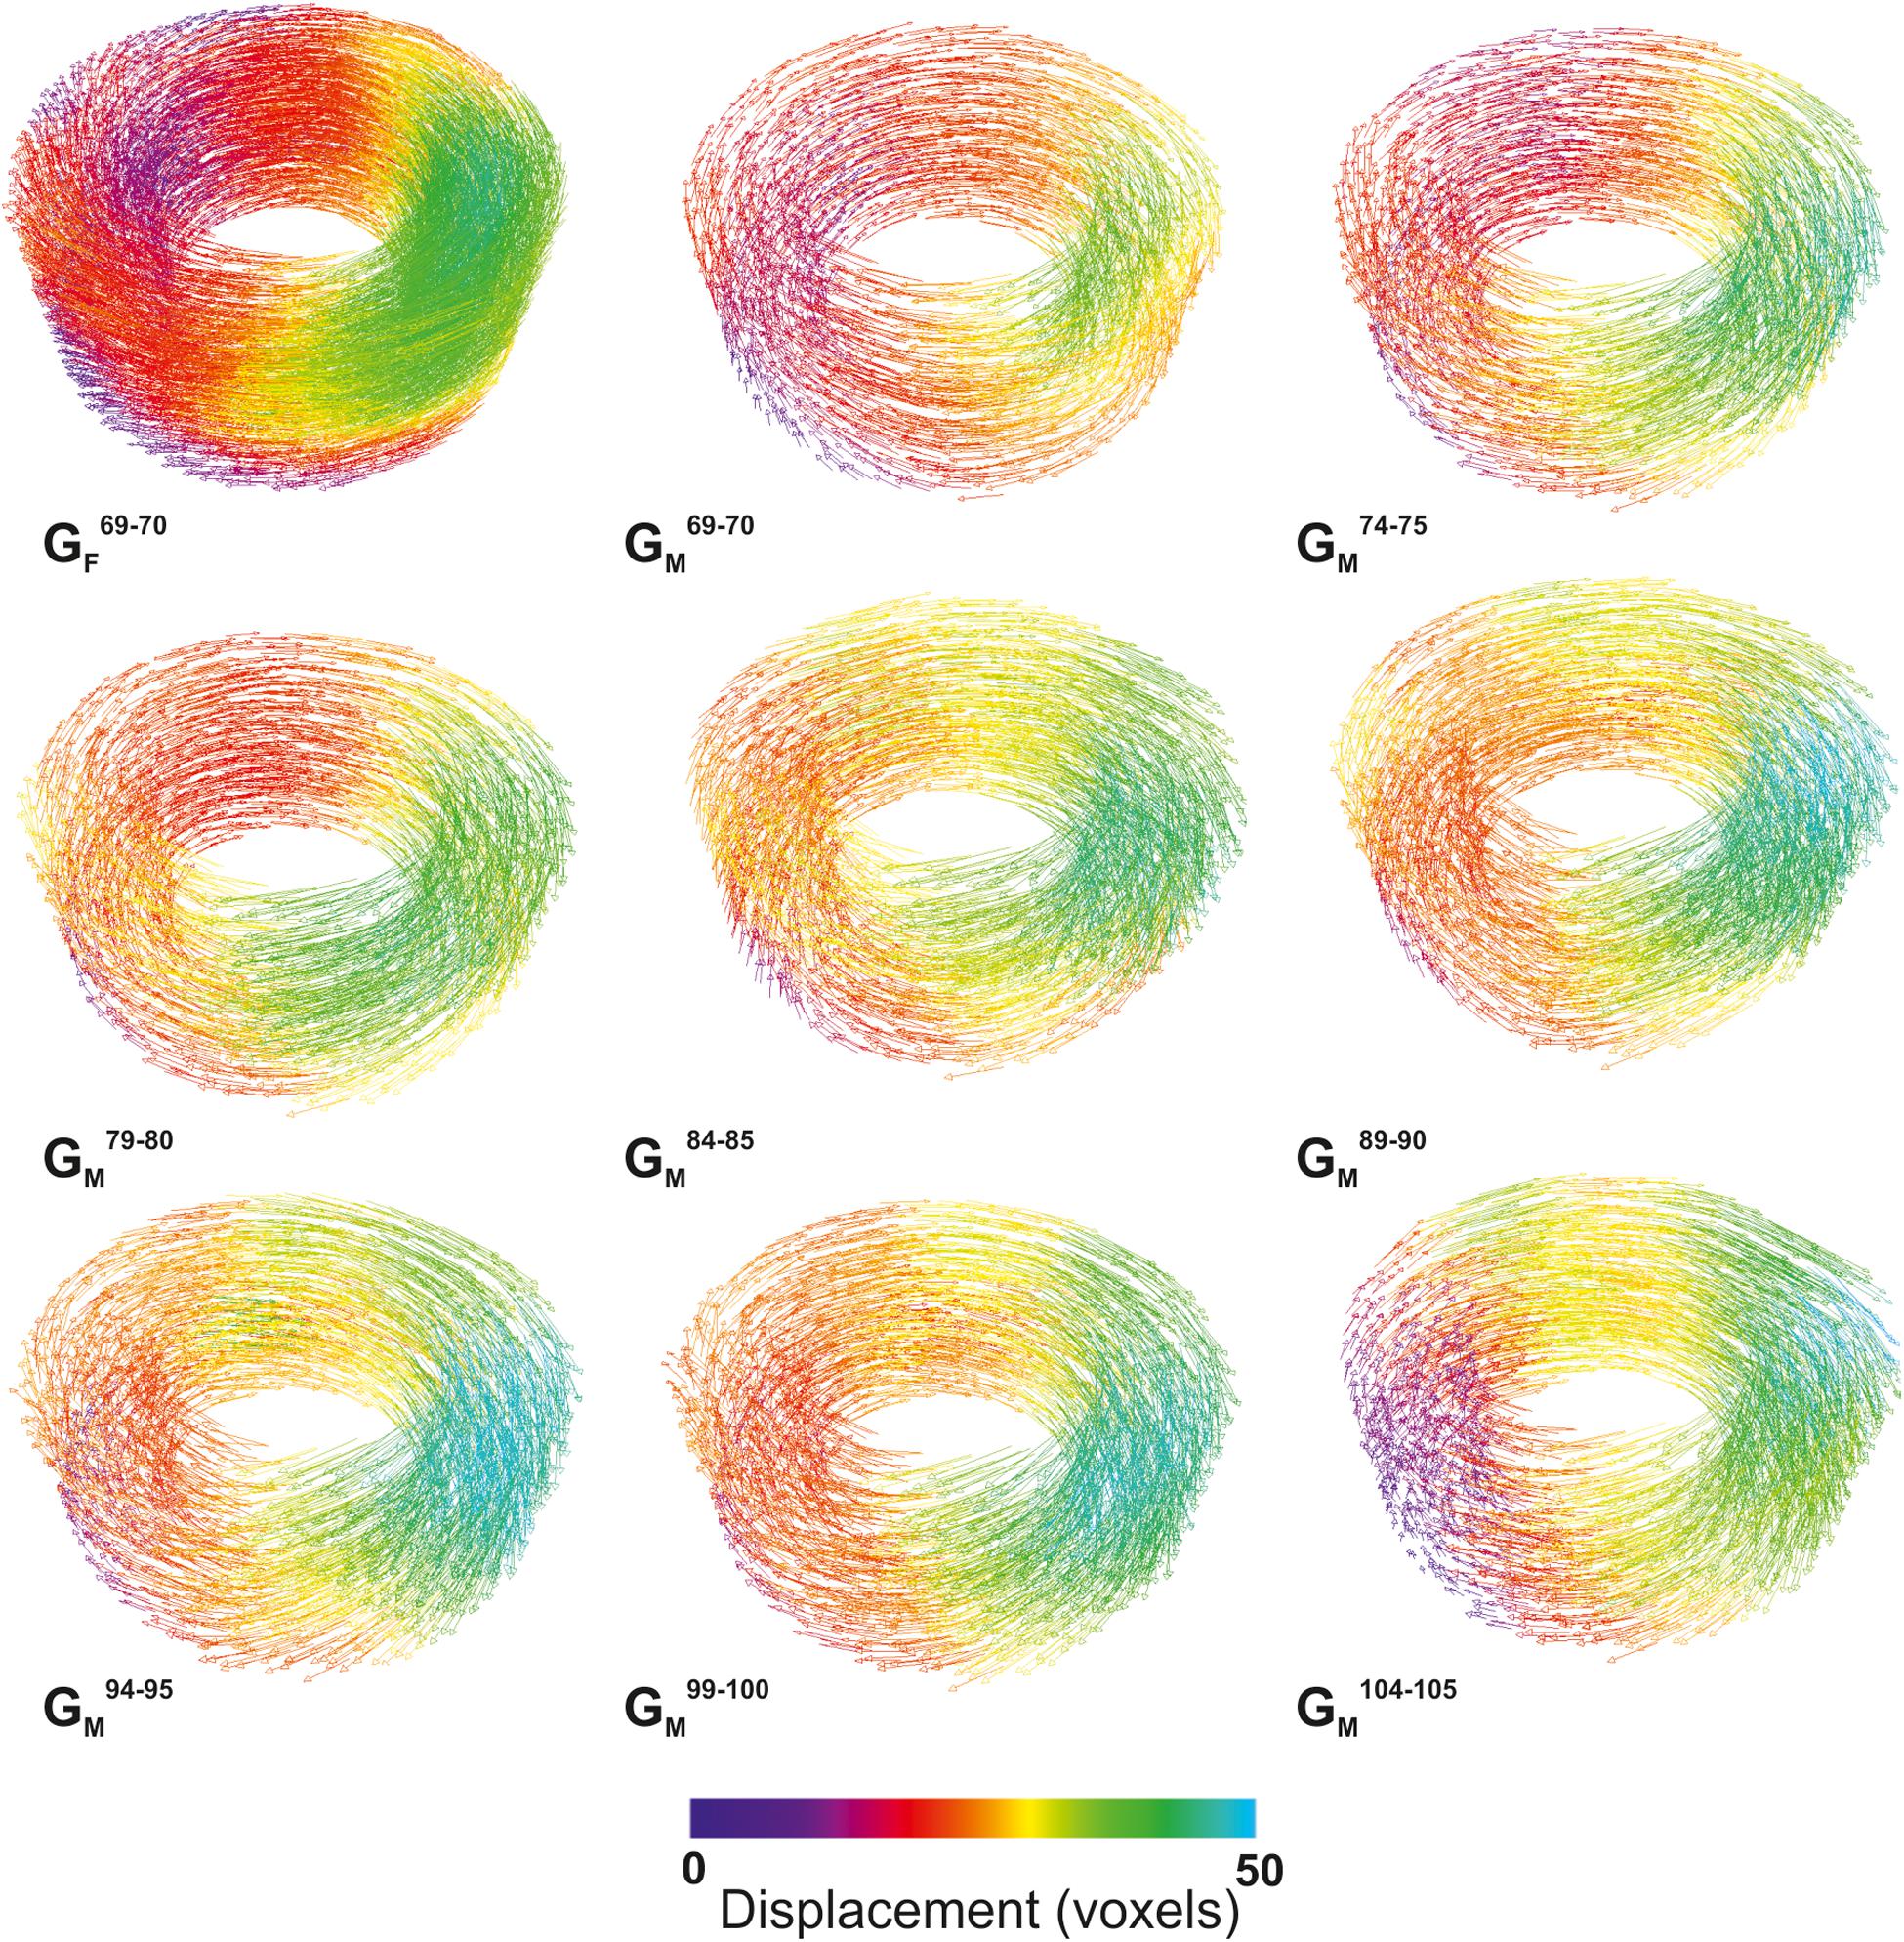
Figure 12. DVC outputs from the end of the acceleration and constant deformation phase. Note the discontinuous time steps shown. The first two frames show the last GF and the equivalent GM. After this the large displacements meant the GF iteration was unnecessary. Workflow for iterations as shown in Figure 10. The outputs shown were those generated on the experiment discussed in section “Bubble Bearing Magma (High Temperature)” and shown in Figures 6, 7.
Observing Heterogeneity in Rheological Test Samples
During the initial acceleration (GF8– 9–GF15– 16, Figure 11) we see a gradual radial propagation of the displacement field. As the deformation continues, we start to see the development of heterogeneity in the displacement field. Initially the heterogeneity is angular, with some sectors showing faster motion than others, but as this develops some vertical variability also appears. At this point in the series (see also Figure 6), coalescence and bubble deformation are limited, but are observed. The sectoral nature of the heterogeneity might suggest that the cause may be a misalignment between the rotation axes of the spindle and the cup. However, if this was the case, we should expect the sector showing the maximal deformation to rotate with the spindle, tracking the narrowest gap distance. This is not observed, and the region showing the greatest displacement shows no systematic larger scale migration. In fact, the high deformation region is generally fixed at one part of the sample volume or fluctuates between 3 o’clock and 12 o’clock regions (as the data are displayed in Figures 11, 12). From GF25– 26 we start to see an increase in the magnitude of the displacement in two regions. From GF38– 39 there is a rapid increase in displacement in one sector of the sample, with a noticeable lack of a radial position dependence on the displacement speed. Once coalescence becomes more common in the volume from about GF45– 46 onward (see also ∼#45 onward, Figure 6), we see another rapid increase in the magnitude of the displacements. There is substantial fluctuation however, especially from GF48– 49 to GF52– 53 and GF60– 61 to GF63– 64 part of the series, where we see a maximum displacement (∼50 voxels) well away from the spindle. This displacement is substantially higher than the velocity of the spindle surface, and corresponds to the major coalescence event shown in #61–64 (Figure 7).
As the 0.3 rpm differential speed is reached at #80 (Figure 7), the system might be expected to equilibrate and the displacements to become more homogenously distributed. However, the ongoing coalescence and the established heterogeneity and focused displacements continue (Figure 12). There is little change immediately after the acceleration ceases (#79–90) despite the ongoing coalescence events and changes in the bubble distribution that can be seen (Figure 7). Also, at this time we start to see larger local decelerations in the region opposite the highest displacements (e.g., #69, 74, 104) suggesting there may be some far field effects becoming visible once the deformation rate is constant. Clearly the data are showing an extremely complex behavior and suggest that any bulk viscosity measurement on this sample may contain contributions that are intrinsically tied to the heterogeneity and localization that is present.
The DVC approach presented here has been successfully applied to all three sample types presented in this study (crystal-bearing, bubble-bearing, and three-phase), and has the potential to be useful for most in situ magmatic analysis, provided that the geometrical changes (bubble deformation) and displacements are not extreme between the frames being correlated. Better understanding of rotational crystal motions is achieved with non-spherical particles. More traditional versions of the DVC method have been used in other geological systems (e.g., McBeck et al., 2018) but the approach taken here could also make the approach invaluable to experimental volcanology as well, where heterogeneity and local environment can be critical controls on behavior.
Broader Challenges and Future Directions
There are always improvements to be made, and in tomographic analysis, better quality data can significantly reduce processing and analysis duration. In these experiments motion blur still exists in some regions of some images, showing that we may need yet faster FPS and similar overall experiment durations (meaning an increase in data volume) if we want to investigate behaviors higher strain rates or lower viscosities.
Faster exposure times result in less motion blur, but will generate projection data with high levels of noise, making data harder to analyses. Advances in iterative reconstruction methods can provide increased data quality from reduced number of projections, and therefore mitigate this challenge. Methods that use “structural prior” to enhance the reconstruction processes can yield data of comparable quality from 10 times fewer projections. These methods take a high spatial-low temporal resolution data set collected prior to the dynamic experiment to provide additional structural information and tune the reconstruction of the under-sampled (low projection numbers) and high noise data from the high TPS part of the experiment (Kazantsev et al., 2014, 2015). Where areas of the image volume remain largely unchanged (e.g., fluid flow in porous media experiments and some crystallization experiments) data from non-changing areas in the high TPS part of the experiment can be used instead of that from a high spatial-low temporal resolution data (Eyndhoven et al., 2015). Where contrasts are high and the features of interest are large relative to the voxel size, this could result in data of sufficient quality for quantitative analysis from as little as 18 projections (Eyndhoven et al., 2015). Applying iterative algorithms can be used to achieve three objectives: (i) increase data quality for a given FPS/projection number acquisition protocol, (ii) enable higher FPS to reduce motion blur and experiments with higher strain rates, or (iii) allow longer duration experiments where there are hardware-based limitations on the total number of projections that can be acquired. These iterative methods are becoming routinely available at high-speed imaging beamlines, but may not improve data quality in all experimental scenarios.
Another way to improve data quality is to increase the signal-to-noise in the projection data, usually by increasing the X-ray flux reaching the detector. Many synchrotron facilities are planning or implementing upgrades to existing infrastructure that will deliver this, with increasing beam brilliance (X-ray flux) key among many of the development plans. More brilliance could be used to increase the TPS rate maintaining current data quality or to obtain better quality data for the same TPS.
The experiments shown here are of shorter duration than some ex situ laboratory rheological tests and shorter than is necessary for rheological analysis during crystallization, so longer experiments may be needed. DVC algorithms and other particle tracking techniques require relatively small displacements between images, so we cannot achieve longer experimental durations by reducing the TAR. More data are required. Even with current data collection protocols, high speed acquisition can generate vast amounts of data (TB/day), especially when the processes under investigation are poorly understood. Experiments need to start collecting images before the start of the processes, and in some cases the occurrence of the processes themselves are hard to identify until after the reconstruction step. This demonstrates the need to reconstruct ever increasing amounts of data before leaving the synchrotron, the need to transfer ever larger data volumes, and the need to develop more automated processing algorithms.
The final challenge to in situ experiments is always in the amount of post processing and data analysis required to interpret the results. The DVC approach applied here removes the need for segmentation or labeling of individual phases, particles, or bubbles, but in most experiments, there will be a need for an additional image processing workflow to extract quantitative information. Rapid advances in automated and machine learning algorithms for application to tomographic image analysis, but these can still be challenging to apply to low contrast geological materials and can be more difficult to implement when changes in sample structure (e.g., clustering of crystals, growth of bubbles) affect local or bulk attenuation. Further work in this area is needed before fully automated image processing workflows can be achieved on most geological materials.
The data presented here showcase the capabilities we currently possess, and shows how real-time in situ tomography can provide useful and extensive information about volcanic and magmatic processes of flow and deformation. The data here are far from optimal by the standards typical for high (spatial) resolution laboratory or synchrotron acquisition but are still more than sufficient to perform complex quantitative analysis of dynamic processes. As multi-scale and correlative imaging techniques (linking to other 2D, 3D, and 4D imaging modalities) become more widely available, the incorporation of data from phase contrast imaging (grain boundaries/crystallization), k-edge imaging (chemical information), simultaneous CT and XRD, and diffraction imaging and diffraction contrast tomography will continue to increase the detailed understanding of microstructural evolution that can be extracted from such in situ studies. This, coupled with the continued widening of laboratory scanner access, a diversification and expansion of the in situ apparatus available within the community, and plans for beams of higher brilliance at several of the European synchrotron facilities in years to come, means the future of in situ magmatic and volcanic flow research looks bright.
Conclusion
The XRheo is one example of the rapid development of new experimental apparatus that has been driven by the expansion of in situ and real-time X-ray computed tomography. When coupled to the Pele furnace, it enables in situ observation of the internal microstructural evolution of samples during rheological experiments. By using the appropriate analog, synthetic, and natural materials as experimental charges and operating under a range of temperature and deformation conditions, it allows us to interrogate the processes occurring in magmas moving in the shallow crust and on the Earth’s surface. Studies assessing the microstructural controls on rheological behaviors and the critical microstructural conditions that enable, accelerate, or arrest flow are now being undertaken. By implementing the latest DVC methods to allow quantitative assessment of displacements and strains and the heterogeneity in the displacement fields, we provide an exemplar workflow for the level of quantification that can now be achieved. These tools provide the ability to significantly improve our understanding of the key processes that control the behavior of natural magmas. Specifically, they permit the quantitative understanding of the microstructural changes in situ while also recording traditional rheological data. This gives us the ability to define, for the first time, how dynamic microstructures (bubble volume and geometry, bubble coalescence or collapse, changes in local crystal content, growth or dissolution of crystals, and the formation and fragmentation of load-bearing crystal networks and other localization features) affect key rheologically controlled processes such as percolation, mobilization, flow, degassing, and fragmentation.
While computed tomography has become an established technique in earth sciences, it is the recent advances at synchrotron beamlines and the environmental cells and apparatus used to perform in situ experiments that now allows the volcanology community to exploit the technique to its maximum potential: tackling some of the greatest challenges in the field and addressing the dynamics of magmatic processes in new ways.
Data Availability Statement
All datasets for this manuscript are not publicly available at this time because they are the subject of other manuscripts in preparation. Once published they will be made available through the NERC National Geoscience Data Centre. Access prior to further publication will be granted where possible, and requests should be directed to KD, a2F0aGVyaW5lLmRvYnNvbkBzdHJhdGguYWMudWs=.
Author Contributions
KD developed the XRheo and the Pele Furnace, managed the beamline experiments, the data acquisition, and analysis, and led the writing of manuscript. All authors (listed alphabetically) contributed to acquiring and processing the data on which this work is based, contributed to the article and approved the submitted version.
Funding
KD acknowledges support from NE/M018687/1 & NE/M018687/2 and ERC 2009 ADV Grant 247076 (EVOKES). DD acknowledges the support of ERC 2009 ADV Grant 247076 (EVOKES) and ERC 2018 ADV Grant 834225 (EAVESDROP) during the conduction of these experiments and the preparation of the manuscript, respectively. RC, JK, YL, JS, and FA were supported by ERC 2012 StG Grant (SLiM) 406388. SK acknowledges the support of H2020 Marie Skłodowska-Curie Fellowship 795044 (DYNAVOLC).
Conflict of Interest
The authors declare that the research was conducted in the absence of any commercial or financial relationships that could be construed as a potential conflict of interest.
Acknowledgments
We acknowledge the Paul Scherrer Institut, Villigen, Switzerland for provision of synchrotron radiation beamtime at the TOMCAT beamline X02DA of the SLS under proposal 20150413, and Diamond Light Source for time on i12-JEEP under proposal EE15898; and thank all the staff at both beamlines who provided additional support to the beamline activity. We are also grateful to Severn Thermal Solution and everyone who advised and helped with the design and construction of the technologies presented in this work.
References
Arzilli, F., La Spina, G., Burton, M. R., Polacci, M., Le Gall, N., Hartley, M. E., et al. (2019). Magma fragmentation in highly explosive basaltic eruptions induced by rapid crystallization. Nat. Geosci. 12, 1023–1028. doi: 10.1038/s41561-019-0468-6
Arzilli, F., Polacci, M., Landi, P., Giordano, D., Baker, D. R., and Mancini, L. (2016). A novel protocol for resolving feldspar crystals in synchrotron X-ray microtomographic images of crystallized natural magmas and synthetic analogs. Am. Mineral. 101, 2301–2311. doi: 10.2138/am-2016-5788
Bai, L., Baker, D. R., and Rivers, M. (2008). Experimental study of bubble growth in Stromboli basalt melts at 1 atm. Earth Planet. Sci. Lett. 267, 533–547. doi: 10.1016/j.epsl.2007.11.063
Baker, D. R., Brun, F., Mancini, L., Fife, J. L., LaRue, A., O’Shaughnessy, C., et al. (2019). The importance of pore throats in controlling the permeability of magmatic foams. Bull. Volcanol. 81:54.
Baker, D. R., Brun, F., O’Shaughnessy, C., Mancini, L., Fife, J. L., and Rivers, M. (2012). A four-dimensional X-ray tomographic microscopy study of bubble growth in basaltic foam. Nat. Commun. 3:1135.
Bay, B. K. (2008). Methods and applications of digital volume correlation. J. Strain Anal. Eng. Design 43, 745–760.
Bay, B. K., Smith, T. S., Fyhrie, D. P., and Saad, M. (1999). Digital volume correlation: three-dimensional strain mapping using X-ray tomography. Exp. Mech. 39, 217–226. doi: 10.1007/bf02323555
Berg, M. T., Bromiley, G. D., Butler, I. B., Frost, M., Bradley, R., Carr, J., et al. (2017). Deformation-aided segregation of Fe-S liquid from olivine under deep Earth conditions: implications for core formation in the early solar system. Phys. Earth Planet. Inter. 263, 38–54. doi: 10.1016/j.pepi.2017.01.004
Buljac, A., Jailin, C., Mendoza, A., Neggers, J., Taillandier-Thomas, T., Bouterf, A., et al. (2018). Digital volume correlation: review of progress and challenges. Exp. Mech. 58, 661–708. doi: 10.1007/s11340-018-0390-7
Campagnola, S., Vona, A., Romano, C., and Giordano, G. (2016). Crystallization kinetics and rheology of leucite-bearing tephriphonolite magmas from the Colli Albani volcano (Italy). Chem. Geol. 424, 12–29. doi: 10.1016/j.chemgeo.2016.01.012
Caricchi, L., Burlini, L., Ulmer, P., Gerya, T., Vassalli, M., and Papale, P. (2007). Non-Newtonian rheology of crystal-bearing magmas and implications for magma ascent dynamics. Earth Planet. Sci. Lett. 264, 402–419. doi: 10.1016/j.epsl.2007.09.032
Chevrel, M. O., Cimarelli, C., deBiasi, L., Hanson, J. B., Lavallée, Y., Arzilli, F., et al. (2015). Viscosity measurements of crystallizing andesite from Tungurahua volcano (Ecuador). Geochem. Geophys. Geosyst. 16, 870–889. doi: 10.1002/2014gc005661
Cimarelli, C., Costa, A., Mueller, S., and Mader, H. M. (2011). Rheology of magmas with bimodal crystal size and shape distributions: insights from analog experiments. Geochem. Geophys. Geosyst. 12:3606.
Colombier, M., Wadsworth, F., Scheu, B., Dobson, K., Caceres, F., Vasseur, J., et al. (2018). “The role of crystals on vesiculation and outgassing during volcanic eruptions: insights from 4D synchrotron experiments,” in Proceesdings of the EGU General Assembly Conference Abstracts, (Vienna: EGU General Assembly), 639.
Di Genova, D., Cimarelli, C., Hess, K.-U., and Dingwell, D. B. (2016). An advanced rotational rheometer system for extremely fluid liquids up to 1273 K and applications to alkali carbonate meltsk. Am. Mineral. 101, 953–959. doi: 10.2138/am-2016-5537ccbyncnd
Dobson, K. J., Coban, S. B., McDonald, S. A., Walsh, J. N., Atwood, R. C., and Withers, P. J. (2016). 4-D imaging of sub-second dynamics in pore-scale processes using real-time synchrotron X-ray tomography. Solid Earth 7:1059. doi: 10.5194/se-7-1059-2016
Drakopoulos, M., Connolley, T., Reinhard, C., Atwood, R., Magdysyuk, O., Vo, N., et al. (2015). I12: the joint engineering, environment and processing (JEEP) beamline at diamond light source. J. Synchrotr. Radiat. 22, 828–838. doi: 10.1107/s1600577515003513
Eyndhoven, G. V., Batenburg, K. J., Kazantsev, D., Nieuwenhove, V. V., Lee, P. D., Dobson, K. J., et al. (2015). An iterative CT reconstruction algorithm for fast fluid flow imaging. IEEE Trans. Image Process. 24, 4446–4458. doi: 10.1109/tip.2015.2466113
Fife, J. L., Rappaz, M., Pistone, M., Celcer, T., Mikuljan, G., and Stampanoni, M. (2012). Development of a laser-based heating system for in situ synchrotron-based X-ray tomographic microscopy. J. Synchrotr. Radiat. 19, 352–358. doi: 10.1107/s0909049512003287
Giordano, D., Polacci, M., Longo, A., Papale, P., Dingwell, D. B., Boschi, E., et al. (2007). Thermo−rheological magma control on the impact of highly fluid lava flows at Mt. Nyiragongo. Geophys. Res. Lett. 34:6301.
Hanna, R. D., and Ketcham, R. A. (2017). X-ray computed tomography of planetary materials: a primer and review of recent studies. Geochemistry 77, 547–572. doi: 10.1016/j.chemer.2017.01.006
Hild, F., Bouterf, A., Chamoin, L., Leclerc, H., Mathieu, F., Neggers, J., et al. (2016). Toward 4D mechanical correlation. Adv. Model. Simul. Eng. Sci. 3:17.
Ishibashi, H., and Sato, H. (2007). Viscosity measurements of subliquidus magmas: Alkali olivine basalt from the Higashi-Matsuura district, Southwest Japan. J. Volcanol. Geother. Res. 160, 223–238. doi: 10.1016/j.jvolgeores.2006.10.001
Kareh, K. M., Lee, P. D., and Gourlay, C. M. (2012). In situ, time-resolved tomography for validating models of deformation in semi-solid alloys. IOP Conf. Ser. Mater. Sci. Eng. 33:012037. doi: 10.1088/1757-899x/33/1/012037
Kazantsev, D., Ourselin, S., Hutton, B. F., Dobson, K. J., Kaestner, A. P., Lionheart, W. R. B., et al. (2014). A novel technique to incorporate structural prior information into multi-modal tomographic reconstruction. Inverse Probl. 30:065004. doi: 10.1088/0266-5611/30/6/065004
Kazantsev, D., Van Eyndhoven, G., Lionheart, W. R. B., Withers, P. J., Dobson, K. J., McDonald, S. A., et al. (2015). Employing temporal self-similarity across the entire time domain in computed tomography reconstruction. Philos. Trans. Ser. A Math. Phys. Eng. Sci. 373:20140389. doi: 10.1098/rsta.2014.0389
Kendrick, J. E., Lavallée, Y., Hess, K. U., Heap, M. J., Gaunt, H. E., Meredith, P. G., et al. (2013). Tracking the permeable porous network during strain-dependent magmatic flow. J. Volcanol. Geother. Res. 260, 117–126. doi: 10.1016/j.jvolgeores.2013.05.012
Kolzenburg, S., Di Genova, D., Giordano, D., Hess, K. U., and Dingwell, D. B. (2018a). The effect of oxygen fugacity on the rheological evolution of crystallizing basaltic melts. Earth Planet. Sci. Lett. 487, 21–32. doi: 10.1016/j.epsl.2018.01.023
Kolzenburg, S., Giodano, D., Hess, K. U., and Dingwell, D. B. (2018b). Shear rate-dependent disequilibrium rheology and dynamics of basalt solidification. Geophys. Res. Lett. 45, 6466–6475. doi: 10.1029/2018gl077799
Kolzenburg, S., Giordano, D., Cimarelli, C., and Dingwell, D. B. (2016). In situ thermal characterization of cooling/crystallizing lavas during rheology measurements and implications for lava flow emplacement. Geochim. Cosmochim. Acta 195, 244–258. doi: 10.1016/j.gca.2016.09.022
Kolzenburg, S., Giordano, D., Di Muro, A., and Dingwell, D. B. (2019). Equilibrium viscosity and disequilibrium rheology of a high magnesium basalt from piton De La Fournaise volcano, La Reunion, Indian Ocean, France. Ann. Geophys. 62:218.
Kouchi, A., Tsuchiyama, A., and Sunagawa, I. (1986). Effect of stirring on crystallization kinetics of basalt: texture and element partitioning. Contribut. Mineral. Petrol. 93, 429–438. doi: 10.1007/bf00371713
Kudrna Prasek, M., Pistone, M., Baker, D. R., Sodini, N., Marinoni, N., Lanzafame, G., et al. (2018). A compact and flexible induction furnace for in situ X-ray microradiograhy and computed microtomography at Elettra: design, characterization and first tests. J. Synchrotr. Radiat. 25, 1172–1181. doi: 10.1107/s1600577518005970
Lamur, A., Lavallée, Y., Iddon, F. E., Hornby, A. J., Kendrick, J. E., von Aulock, F. W., et al. (2018). Disclosing the temperature of columnar jointing in lavas. Nat. Commun. 9:1432.
Lavalleìe, Y., Hess, K.-U., Cordonnier, B., and Bruce Dingwell, D. (2007). Non-Newtonian rheological law for highly crystalline dome lavas. Geology 35, 843–846.
Llewellin, E., Mader, H. M., and Wilson, S. D. R. (2002). The rheology of a bubbly liquid. Proc. R. Soc. A Math. Phys. Eng. Sci. 458, 987–1016.
Mader, H. M., Llewellin, E. W., and Mueller, S. P. (2013). The rheology of two-phase magmas: a review and analysis. J. Volcanol. Geother. Res. 257, 135–158. doi: 10.1016/j.jvolgeores.2013.02.014
Madi, K., Tozzi, G., Zhang, Q. H., Tong, J., Cossey, A., Au, A., et al. (2013). Computation of full-field displacements in a scaffold implant using digital volume correlation and finite element analysis. Med. Eng. Phys. 35, 1298–1312. doi: 10.1016/j.medengphy.2013.02.001
Marone, F., Schlepuetz, C., Marti, S., Fusseis, F., Velásquez-Parra, A., Griffa, M., et al. (2020). Time resolved in-situ X-ray tomographic microscopy unraveling dynamic processes in geologic systems. Front. Earth Sci. 14:346. doi: 10.3389/feart.2019.00346
McBeck, J., Kobchenko, M., Hall, S. A., Tudisco, E., Cordonnier, B., Meakin, P., et al. (2018). Investigating the onset of strain localization within anisotropic shale using digital volume correlation of time-resolved X-ray microtomography images. J. Geophys. Res. Solid Earth 123, 7509–7528. doi: 10.1029/2018jb015676
McBirney, A. R., and Murase, T. (1984). Rheological properties of magmas. Annu. Rev. Earth Planet. Sci. 12, 337–357. doi: 10.1146/annurev.ea.12.050184.002005
Mokso, R., Schleputz, C. M., Theidel, G., Billich, H., Schmid, E., Celcer, T., et al. (2017). GigaFRoST: the gigabit fast readout system for tomography. J. Synchrotr. Radiat. 24, 1250–1259. doi: 10.1107/s1600577517013522
Morrison, A. A., Whittington, A., Smets, B., Kervyn, M., and Sehlke, A. (2020). The rheology of crystallizing basaltic lavas from Nyiragongo and Nyamuragira volcanoes, D.R.C. Volcanica 3, 1–28. doi: 10.30909/vol.03.01.0128
Mueller, S., Llewellin, E. W., and Mader, H. M. (2011). The effect of particle shape on suspension viscosity and implications for magmatic flows. Geophys. Res. Lett. 38:L13316.
Okumura, S., Nakamura, M., Uesugi, K., Nakano, T., and Fujioka, T. (2013). Coupled effect of magma degassing and rtheology on silicic volcanism. Earth Planet. Sci. Lett. 362, 163–170. doi: 10.1016/j.epsl.2012.11.056
Pankhurst, M. J., Vo, N. T., Butcher, A. R., Long, H., Wang, H., Nonni, S., et al. (2018). Quantitative measurement of olivine composition in three dimensions using helical-scan X-ray micro-tomography. Am. Mineral. 103, 1800–1811. doi: 10.2138/am-2018-6419
Philippe, J., Le Godec, Y., Mezouar, M., Berg, M., Bromiley, G., Bergame, F., et al. (2016). Rotating tomography Paris–Edinburgh cell: a novel portable press for micro-tomographic 4-D imaging at extreme pressure/temperature/stress conditions. High Pressure Res. 36, 512–532. doi: 10.1080/08957959.2016.1221951
Picard, D., Arbaret, L., Pichavant, M., Champallier, R., and Launeau, P. (2011). Rheology and microstructure of experimentally deformed plagioclase suspensions. Geology 39, 747–750. doi: 10.1130/g32217.1
Pinkerton, H. (1994). “Rheological and related properties of lavas,” in Etna: Magma and Lava Flow Modeling and Volcanic System Definition Aimed at Hazard Assessment, ed. F. Dobran (Rome: Global Volcanic and Environmental Systems Simulation), 76–89.
Pistone, M., Arzilli, F., Dobson, K. J., Cordonnier, B., Reusser, E., Ulmer, P., et al. (2015). Gas-driven filter pressing in magmas: insights into in-situ melt segregation from crystal mushes. Geology 43, 699–702. doi: 10.1130/g36766.1
Pistone, M., Caricchi, L., Ulmer, P., Burlini, L., Ardia, P., Reusser, E., et al. (2012). Deformation experiments of bubble- and crystal-bearing magmas: Rheological and microstructural analysis. J. Geophys. Res. Solid Earth 117:8986.
Pistone, M., Caricchi, L., Ulmer, P., Reusser, E., and Ardia, P. (2013). Rheology of volatile-bearing crystal mushes: mobilization vs. viscous death. Chem. Geol. 345, 16–39. doi: 10.1016/j.chemgeo.2013.02.007
Pleše, P., Higgins, M. D., Mancini, L., Lanzafame, G., Brun, F., Fife, J. L., et al. (2018). Dynamic observations of vesiculation reveal the role of silicate crystals in bubble nucleation and growth in andesitic magmas. Lithos 296–299, 532–546. doi: 10.1016/j.lithos.2017.11.024
Polacci, M., Arzilli, F., La Spina, G., Le Gall, N., Cai, B., Hartley, M. E., et al. (2018). Crystallisation in basaltic magmas revealed via in situ 4D synchrotron X-ray microtomography. Sci. Rep. 8:8377.
Ryerson, F., Weed, H., and Piwinskii, A. (1988). Rheology of subliquidus magmas: 1. Picritic compositions. J. Geophys. Res. Solid Earth 93, 3421–3436.
Sato, H. (2005). Viscosity measurement of subliquidus magmas:1707 basalt of Fuji volcano. J. Mineral. Petrol. Sci. 100, 133–142. doi: 10.2465/jmps.100.133
Sloof, W. G., Pei, R., McDonald, S. A., Fife, J. L., Shen, L., Boatemaa, L., et al. (2016). Repeated crack healing in MAX-phase ceramics revealed by 4D in situ synchrotron X-ray tomographic microscopy. Sci. Rep. 6:23040.
Smith, T. S., Bay, B. K., and Rashid, M. M. (2002). Digital volume correlation including rotational degrees of freedom during minimization. Exp. Mech. 42, 272–278. doi: 10.1007/bf02410982
Soldati, A., Sehlke, A., Chigna, G., and Whittington, A. (2016). Field and experimental constraints on the rheology of arc basaltic lavas: the January 2014 Eruption of Pacaya (Guatemala). Bull. Volcanol. 78, 1–19.
Spera, F. J., Borgia, A., Strimple, J., and Feigenson, M. (1988). Rheology of melts and magmatic suspensions: 1. Design and calibration of concentric cylinder viscometer with application to rhyolitic magma. J. Geophys. Res. Solid Earth 93, 10273–10294. doi: 10.1029/jb093ib09p10273
Stein, D. J., and Spera, F. J. (1992). Rheology and microstructure of magmatic emulsions: theory and experiments. J. Volcanol. Geother. Res. 49, 157–174. doi: 10.1016/0377-0273(92)90011-2
Tozzi, G., Zhang, Q.-H., and Tong, J. (2014). Microdamage assessment of bone-cement interfaces under monotonic and cyclic compression. J. Biomech. 47, 3466–3474. doi: 10.1016/j.jbiomech.2014.09.012
Tripoli, B., Manga, M., Mayeux, J., and Barnard, H. (2019). The effects of deformation on the early crystallization kinetics of basaltic magmas. Front. Earth Sci. 27:250. doi: 10.3389/feart.2019.00250
Truby, J. M., Mueller, S. P., Llewellin, E. W., and Mader, H. M. (2014). The rheology of three-phase suspensions at low bubble capillary number. Proc. Math. Phys. Eng. Sci. 471:20140557. doi: 10.1098/rspa.2014.0557
Vetere, F., Murri, M., Alvaro, M., Domeneghetti, M. C., Rossi, S., Pisello, A., et al. (2019). Viscosity of pyroxenite melt and its evolution during cooling. J. Geophys. Res. Planets 124, 1451–1469.
Vona, A., and Romano, C. (2013). The effects of undercooling and deformation rates on the crystallization kinetics of Stromboli and Etna basalts. Contribut. Mineral. Petrol. 166, 491–509. doi: 10.1007/s00410-013-0887-0
Vona, A., Romano, C., Dingwell, D. B., and Giordano, D. (2011). The rheology of crystal-bearing basaltic magmas from Stromboli and Etna. Geochim. Cosmochim. Acta 75, 3214–3236. doi: 10.1016/j.gca.2011.03.031
Vona, A., Ryan, A. G., Russell, J. K., and Romano, C. (2016). Models for viscosity and shear localization in bubble-rich magmas. Earth Planet. Sci. Lett. 449, 26–38. doi: 10.1016/j.epsl.2016.05.029
Wadsworth, F. B., Vasseur, J., Llewellin, E. W., Dobson, K. J., Colombier, M., von Aulock, F. W., et al. (2017). Topological inversions in coalescing granular media control fluid-flow regimes. Phys. Rev. E 96:033113.
Wadsworth, F. B., Vasseur, J., Llewellin, E. W., Schauroth, J., Dobson, K. J., Scheu, B., et al. (2016). Sintering of viscous droplets under surface tension. Proc. R. Soc. A Math. Phys. Eng. Sci. 472:20150780. doi: 10.1098/rspa.2015.0780
Wadsworth, F. B., Vasseur, J., Schauroth, J., Llewellin, E. W., Dobson, K. J., Havard, T., et al. (2019). A general model for welding of ash particles in volcanic systems validated using in situ X-ray tomography. Earth Planet. Sci. Lett. 525:115726. doi: 10.1016/j.epsl.2019.115726
Wallace, P. A., Kendrick, J. E., Miwa, T., Ashworth, J. D., Coats, R., Utley, J. E. P., et al. (2019). Petrological architecture of a magmatic shear zone: a multidisciplinary investigation of strain localisation during magma ascent at Unzen Volcano, Japan. J. Petrol. 60, 791–826. doi: 10.1093/petrology/egz016
Keywords: volcanology, rheology, synchrotron, in situ, magma, X-ray tomography
Citation: Dobson KJ, Allabar A, Bretagne E, Coumans J, Cassidy M, Cimarelli C, Coats R, Connolley T, Courtois L, Dingwell DB, Di Genova D, Fernando B, Fife JL, Fyfe F, Gehne S, Jones T, Kendrick JE, Kinvig H, Kolzenburg S, Lavallée Y, Liu E, Llewellin EW, Madden-Nadeau A, Madi K, Marone F, Morgan C, Oppenheimer J, Ploszajski A, Reid G, Schauroth J, Schlepütz CM, Sellick C, Vasseur J, von Aulock FW, Wadsworth FB, Wiesmaier S and Wanelik K (2020) Quantifying Microstructural Evolution in Moving Magma. Front. Earth Sci. 8:287. doi: 10.3389/feart.2020.00287
Received: 06 December 2019; Accepted: 19 June 2020;
Published: 21 September 2020.
Edited by:
Margherita Polacci, University of Manchester, United KingdomReviewed by:
Satoshi Okumura, Tohoku University, JapanGabriele Lanzafame, University of Catania, Italy
Copyright © 2020 Dobson, Allabar, Bretagne, Coumans, Cassidy, Cimarelli, Coats, Connolley, Courtois, Dingwell, Di Genova, Fernando, Fife, Fyfe, Gehne, Jones, Kendrick, Kinvig, Kolzenburg, Lavallée, Liu, Llewellin, Madden-Nadeau, Madi, Marone, Morgan, Oppenheimer, Ploszajski, Reid, Schauroth, Schlepütz, Sellick, Vasseur, von Aulock, Wadsworth, Wiesmaier and Wanelik. This is an open-access article distributed under the terms of the Creative Commons Attribution License (CC BY). The use, distribution or reproduction in other forums is permitted, provided the original author(s) and the copyright owner(s) are credited and that the original publication in this journal is cited, in accordance with accepted academic practice. No use, distribution or reproduction is permitted which does not comply with these terms.
*Correspondence: Katherine J. Dobson, a2F0aGVyaW5lLmRvYnNvbkBzdHJhdGguYWMudWs=