 Tim van Emmerik1*
 Jan Seibert2,3
 Barbara Strobl2
 Simon Etter2
 Tijmen den Oudendammer4Martine Rutten4,5Mohd Shahrizal bin Ab Razak6
 Ilja van Meerveld2
- 1Hydrology and Quantitative Water Management Group, Wageningen University, Wageningen, Netherlands
- 2Department of Geography, University of Zurich, Zurich, Switzerland
- 3Department of Aquatic Sciences and Assessment, Swedish University of Agricultural Sciences, Uppsala, Sweden
- 4Institute of Built Environment, Rotterdam University of Applied Sciences, Rotterdam, Netherlands
- 5Department of Water Management, Delft University of Technology, Delft, Netherlands
- 6Department of Civil Engineering, Faculty of Engineering, Universiti Putra Malaysia, Serdang, Malaysia
Macroplastic pollution (> 0.5 cm) negatively impacts aquatic life and threatens human livelihood on land, in oceans and river systems. Reliable information on the origin, fate and pathways of plastic in river systems is required to optimize prevention, mitigation and reduction strategies. Yet, accurate and long-term data on plastic transport are still lacking. Current macroplastic monitoring strategies involve labor intensive sampling methods, require investment in infrastructure, and are therefore infrequent. Crowd-based observations of riverine macroplastic pollution may potentially provide frequent cost-effective data collection over a large geographical range. We extended the CrowdWater citizen science app for hydrological observations with a module for observations of plastic in rivers. In this paper, we demonstrate the potential of crowd-based observations of floating macroplastic and macroplastic on riverbanks. We analyzed data from two case studies: (1) floating plastic measured in the Klang (Malaysia), and (2) plastic on riverbanks along the Rhine (the Netherlands). Crowd-based observations of floating plastic in the Klang yield similar estimates of plastic transport (2,000–3,000 items h−1), cross-sectional distribution (3–7 percent point difference) and polymer categories (0–6 percent point difference) as reference observations. It also highlighted the high temporal variation in riverine plastic transport. The riverbank observations provided the first data of macroplastic pollution on the most downstream stretch of the Rhine, revealing peaks close to urban areas and an increasing plastic density toward the river mouth. The mean riverbank density estimates are also similar for the crowd-based and reference methods (573–1,033 items km−1). These results highlight the value of including crowd-based riverine macroplastic observations in future monitoring strategies. Crowd-based observations may provide reliable estimations of plastic transport, density, spatiotemporal variation and composition for a larger number of locations than conventional methods.
1. Introduction
Macroplastic (>0.5 cm) pollution in river systems is an emerging environmental risk, as it negatively impacts aquatic ecosystems and human livelihood. Plastics threaten (aquatic) species through entanglement and ingestion. For Swiss and French freshwater systems, ingestion rates up to 12.5% were found for fish and birds (Faure et al., 2015). In urban water systems, blockage of hydraulic infrastructure by macroplastics lead to more severe and faster water level increase compared to organic debris (Honingh et al., 2020). Once in river systems, macroplastics break down into micro- and nanoplastics, and can leak toxin additives (van Emmerik and Schwarz, 2020). Also, river plastic is assumed to be one of the main sources of marine plastic pollution (Schmidt et al., 2017). River plastic data are required to identify sources and (temporary) sinks, estimate plastic mass transport, and investigate the driving mechanisms that determine its spatiotemporal variation. The latter includes both natural (wind, surface runoff, river flow velocity) and anthropogenic driving mechanisms (land-use, waste and water infrastructure). To optimize prevention, mitigation, and reduction strategies, monitoring of river plastic pollution is also crucial. In earlier work, river plastic data were mainly obtained by net sampling from boats or bridges (Moore et al., 2011; Lechner et al., 2014; Sadri and Thompson, 2014; van der Wal et al., 2015). Although such methods may give valuable insights into instantaneous plastic concentrations and polymer type, they are labor intensive and require additional equipment. As a result, seasonal variation and annual mass transport estimates remain uncertain.
A simple and cost-effective river macroplastic monitoring method based on visual observations was introduced by González-Fernández and Hanke (2017). For the “visual counting” method, observations are made from bridges. Observers count all floating plastic items within a section of the river width for a given amount of time. The observed plastic transport is expressed as total plastic items per hour. This method provides order of magnitude information on floating plastic transport. Visual counting can be made by either volunteers or professionals, and do not require any additional equipment or infrastructure. Despite its simplicity, this method allows for (1) quantification of riverine plastic transport, (2) study of seasonal variation, and (3) direct comparison of plastic transport between rivers (van Calcar and van Emmerik, 2019). New technological advances can facilitate the upscaling of data collection across time (long-term time series) and space (more rivers, and more locations along single rivers). For example, Geraeds et al. (2019) and Kataoka and Nihei (2020) demonstrated the potential of using Unmanned Aerial Vehicles (UAVs) and cameras to measure floating plastic and plastic on banks in river systems.
An increased use of crowd-based or citizen science observations provides another way forward in the upscaling of hydrological data collection (Buytaert et al., 2014). Citizen science based data collection can be a cost-effective method, while also raising public awareness on the topic (Rambonnet et al., 2019). Recent examples of crowd-based measurements include characterization of urban rainfall (Vos et al., 2017), monsoon rainfall (Davids et al., 2019), soil-plant-atmosphere interactions (Fischer et al., 2019), and stream level measurements (Lowry et al., 2019; Seibert et al., 2019). For data collection on land-based litter, the Litterati mobile phone app is often used (Litterati, 2019). Litterati collects data on land-based litter items through the submission of geo-tagged pictures by volunteers. The number of citizen science initiatives to collect data on (macro)plastic pollution in marine and riverine environments has been increasing (see e.g., Nelms et al., 2017; Vincent et al., 2017; Barrows et al., 2018; Kiessling et al., 2019).
In this paper, we explore the potential of crowd-based observations of macroplastic pollution in river systems. We used the CrowdWater mobile application for crowd-based observations of macroplastic pollution in river systems. CrowdWater was originally developed to collect hydrological data on stream water level, soil moisture and the state of temporary steams (Seibert et al., 2019). CrowdWater app was extended with a module to facilitate data collection on (1) floating plastic and (2) plastic on riverbanks. In this paper, we present two case studies: a case study on floating plastic in the Klang (Malaysia), and one on riverbank plastic for the Rhine (the Netherlands).
2. Methods
2.1. Crowd-Based Observations Using CrowdWater
The CrowdWater smartphone app was launched in 2017, and initially focused on crowd-based observations of water level, soil moisture and temporary streams (Seibert et al., 2019; SPOTTERON Gmbh, 2019). The CrowdWater app aims to motivate citizen scientists by facilitating rapid measurements all over the world, and includes a (digital) award system (points, badges). The app now also includes a module for riverine plastic observations. With this app, two types of plastic observations can be collected: (1) floating plastic in rivers and (2) plastic on riverbanks. Note that the latter also can be applied to monitor plastic on beaches and lake shores. Observations can be added by creating a new measurement location, or by adding an observation to an existing location. The CrowdWater method focuses on macroplastics (>0.5 cm), as they can be detected relatively easily without requiring additional equipment.
The CrowdWater app is also used for specific research projects, such as the Plastic Spotter (Citizen Science Lab, Leiden University, 2019) project in Leiden, the Netherlands. This project aims to quantify the plastic transport in the urban canal system, and to estimate how much plastic is transported into the North Sea from Leiden every year. Through specific projects like these, additional interaction with volunteers and stakeholders can be facilitated. By May, 2020, over 551 plastic observations were recorded with the app globally.
2.1.1. Floating Plastic
The floating plastic transport measurement protocol is based on the visual counting method of González-Fernández and Hanke (2017) and the adaptation by van Emmerik et al. (2018). The adaptation includes a focus on macroplastic litter (vs. all anthropogenic litter), and expanding to multiple measurement points along the river width (vs. only one location). All plastic items are counted for a specific amount of time, yielding an estimation of the plastic transport in items per hour [items h−1]. Observers determine the observation duration, which is recommended to be between 2 and 30 min. The protocol mainly focuses on the floating fraction of the total plastic transport, but may also include (superficially) submerged plastic items for low turbidity rivers. The minimal size of the items depends on the observation height, and is generally estimated to be around 1 cm for observation heights up to 12 m (e.g., van Emmerik et al., 2019a,c). Observers have to indicate whether they measure plastic transport across the entire width, or a fraction (, , or ) of the river width. Based on the counted items, one of the classes describing the number of items, ranging from no plastic observed to covered entirely (Figure 1) is chosen. There are also some optional additional entries. For example, observers can include an estimate of the flow velocity, indicate the direction of flow, and leave a comment. Screenshot of a typical plastic measurement is presented in Figures S1–S3. In the recently launched Plastic Spotter project (Citizen Science Lab, Leiden University, 2019) it is explicitly encouraged to include an estimation of the flow velocity, by tracking and timing floating items over a certain distance. There is also a preset option to indicate that the water is stagnant (flow velocity approximates 0 m/s). One can also indicate if (some of) the counted plastic has been removed from the system by the observer. Observers can also include an estimate of the composition of the plastic items based on seven polymer-based categories (van Emmerik et al., 2019a). For each category, the fraction in steps of 20% can be indicated (Figure S3). The categories are based on common plastic polymer types that can be identified based on their common use for specific items. CrowdWater uses seven categories: polyethylene terephthalate (PET), polystyrene (PS), expanded polystyrene (EPS), hard polyolefin (POhard), Soft polyolefin (POsoft), Multilayer, and Rest (other or non-identifiable plastics). Note that polyolefins include polyethylene (PE) and polypropylene (PP). An overview of the seven polymer categories, including typical items is shown in Table 1. Note that some simplifications and assumptions are made here. For example, straws fall under the polystyrene (PS) category, although they can also be made from other polymer types. However, this method does provide a reliable first-order estimate without the need for laboratory analyses.
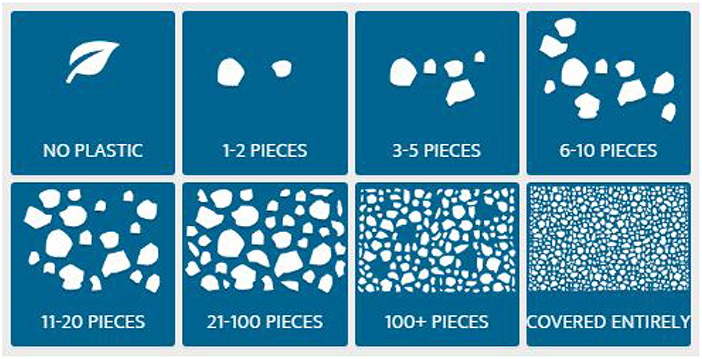
Figure 1. Definition of the plastic counting classes as shown in the CrowdWater app.
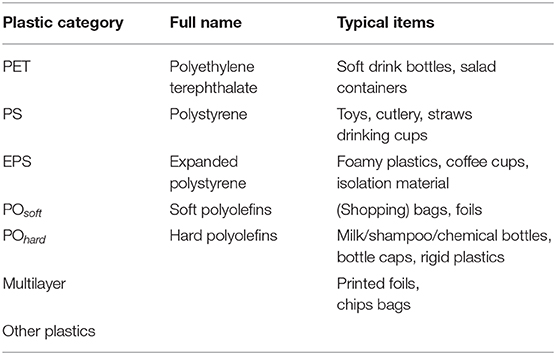
Table 1. Overview of the plastic categories used in the CrowdWater app.
2.1.2. Plastic on Riverbanks
For observations of plastic on riverbanks, beaches and lake shores, a protocol was developed based on the existing OSPAR Beach Litter (OSPAR Commission, 2010), River-OSPAR (Schone Rivieren, 2019) and Plastic Pirates methods (Kiessling et al., 2019). For the CrowdWater method, riverbank plastic is counted for a sampling stretch that 1, 5, or 10 m long. The width extends from the water line to the high-water line or riparian vegetation. In the sampling area, all plastic items are counted from standing height. The same classes (Figure 1) and categories (Table 1) are used for the floating plastic. It is estimated that the minimum item size is around 0.5 cm. The optional entries can be made here as well: leaving a comment, estimating the plastic composition (Table 1), and indicating whether the plastic has been removed or not (Figure S2). The main difference between this protocol compared to existing methods is the simplification, that allows for more rapid assessments. For example, the OSPAR Beach Litter (OSPAR Commission, 2010) and River-OSPAR (Schone Rivieren, 2019) protocols use item category lists with more than 100 item categories. Also, they require a minimum sampling length of 100 m. The Plastic Pirates method (Kiessling et al., 2019) on the other hand is designed for data collection by school children. They use a specific protocol to select the sampling area and use very broad litter categories to identify the sampled items (Paper, cigarette butts, plastic, metal, glass, food leftover, and other).
2.2. Case 1: Floating Plastic Transport in the Klang, Malaysia
2.2.1. Study Area
Floating plastic was measured on the Klang, Malaysia. The Klang is one of Malaysia's main rivers and flow through the city of Kuala Lumpur. The local climate is characterized as a tropical, with the highest monthly rainfall between March and May, and the highest rainfall intensities between October and December (Geraeds et al., 2019). Field observations were made on the Jalan Tengku Kelana bridge in the city of Klang (3°02′42.3"N, 101°26′54.6"E), an urbanized area approximately 18 km upstream of the river mouth (see Figure 2). Measurements were taken every half-hour to hour from 29 April to 4 May, 2019, between 09:00 and 17:00.
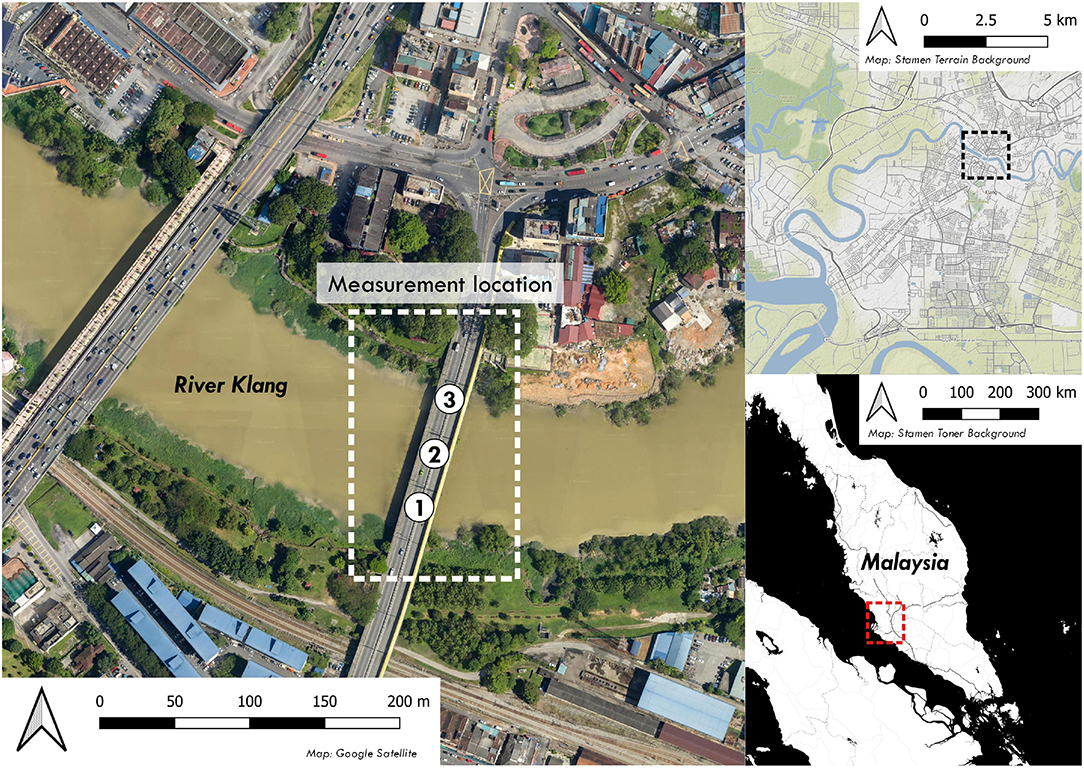
Figure 2. Overview of the study area for Case Study 1: Floating plastic transport in the Klang, Malaysia. The detailed map also shows the three segments that were measured. The two other maps show the location of the measurement location with respect to the lower reach of the Klang, and to the Malaysian peninsula. Base map sources: Stamen (both overview maps), Google (close up map). Retrieved on 28 May, 2020.
2.2.2. Floating Plastic Measurements
All measurements were made by Bachelor of Engineering (B.Eng.) and Master of Science (M.Sc.) students from the Department of Civil Engineering, Universiti Putra Malaysia (Selangor, Malaysia). The students were compensated for their time as part of a research collaboration. The river cross-section was divided into three segments of approximately 35 m. Every half-hour to hour, observations were made for each segment using the CrowdWater method and the standard visual counting method of González-Fernández and Hanke (2017) and adapted by van Emmerik et al. (2018) to include counting of items per plastic composition category. Note that the visual counting method is the same for both methods. The main differences are (1) the collection of data in absolute values (standard method) vs. class-based (CrowdWater), and (2) the 20%-step composition categories (CrowdWater) vs. absolute values for each category (standard method). A dedicated two-person team was assigned for each method, for the total duration of the observation period. The observation duration was 2 min for both methods.
To compare both measurement protocols, three aspects were considered: (1) the magnitude of the floating plastic transport and its variation over time, (2) the distribution across the river width, and (3) the average composition. To compare the magnitude of the floating plastic transport, the crowd-based observations were converted from class to numerical value Pc [items hour−1] using the mean value of the minimum pi,min and the maximum pi,max items per class i (Equation 1). For class 7 (“100+ items”) the upper limited was set at 300 items, as this was around the maximum counted number of items. Class 8 was never observed and not considered further in this study. The number of items was divided by the measurement duration t [min] and multiplied by 60 to obtain an hourly value.
We compared (1) the instantaneous plastic flux in each segment, (2) the daily mean hourly flux in each segment, and (3) the total daily flux. For the latter, the daily mean values for each segment were summed. We calculated the Pearson's correlation between the daily means for each segments separately, and for the summed values. We also calculate the coefficient of variation (ratio of standard deviation over the mean) for the individual segments. For each segment, the mean transport over the measurement period was calculated, and expressed as percentage of the total mean transport over the river width. It was assumed that each segment accounted for one-third of the river width.
Finally, the composition was compared by estimating the mean composition (percentage [%] per category) over the entire observation period. For the crowd-based measurements, the mean composition of the individual measurements was taken. For the reference measurements, the relative share of each category was determined using the total counted number of items per category.
2.3. Case 2: Riverbank Plastic Density Along the Rhine, the Netherlands
2.3.1. Study Area
Riverbank plastic measurements were made along the Rhine, the Netherlands. On 4 September, 2019, 38 assessments were completed between Maassluis (51°54′58.3"N, 4°14′41.9"E, 14 km upstream from the river mouth) and the Maeslantkering (storm surge barrier; 51°57′17.2"N, 4°10′14.1" E, 6 km upstream from the river mouth), on the North side of the Nieuwe Waterweg distributary (see Figure 3). The Rhine is one of Europe's main rivers and flows through densely populated and heavily industrialized areas such as the Ruhr area and the port city of Rotterdam. The measured 8-km stretch is characterized by the two urban areas at the start and beginning, and a rural area in between.
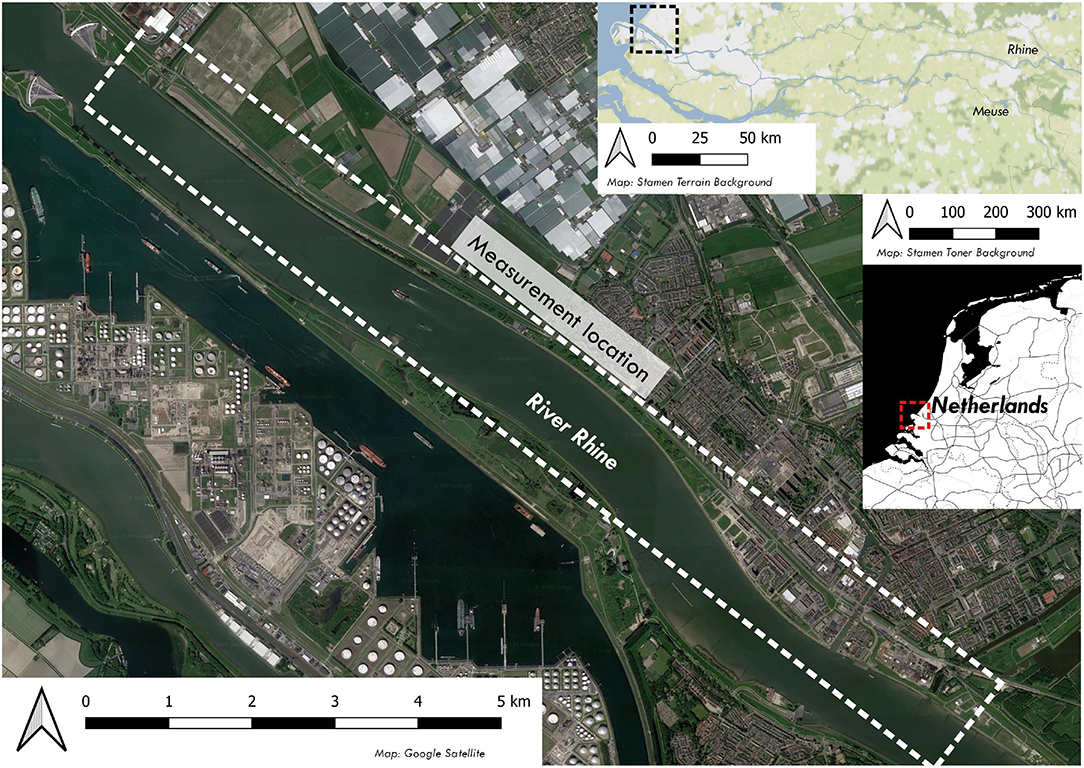
Figure 3. Overview of the study area for Case Study 2: Riverbank plastic density along the Rhine, the Netherlands. The detailed map also shows the total reach that was measured. The two other maps show the location of the measurement location with respect to the Rhine-Meuse delta, and to the Netherlands. Base map sources: Stamen (both overview maps), Google (close up map). Retrieved on 28 May, 2020.
2.3.2. Riverbank Plastic Measurements
The measurements were made by first-year Bachelor of Science (B.Sc.) students from the Water Management program at the Rotterdam University of Applied Sciences (Rotterdam, the Netherlands), as part of an educational assignment. All measurements were made between 11:00 and 15:00 on a single day. The locations were spaced 10 m to 1,800 m apart (average 300 m). Around five assessments for 5 or 10 m-long sampling areas were made by groups of two to five persons. Each location was assessed once.
The measurements were normalized to items per kilometer riverbank dp [items km−1] by dividing the mean value of the minimum and maximum (pi,min, pi,max) of each observed plastic count class i (Figure 1) by the sampling length L [m] (Equation 2).
Additional reference measurements were made at three locations (at 9, 10 and 12 km from the river mouth) using the River-OSPAR protocol (Schone Rivieren, 2019) for riverbank litter monitoring. At the reference locations, a 10-m stretch was sampled from the water line to the vegetation or high-water line. Each visible litter item was collected and categorized using the standardized item list with over 100 items Schone Rivieren (2019). For further analysis only the plastic items were used. We explored whether there is an increasing or decreased trend toward the river mouth by calculating the Spearman correlation between distance to river mouth and riverbank plastic density.
3. Results
3.1. Floating Plastic Transport in the Klang, Malaysia
The floating plastic transport estimates in the Klang are similar in terms of order of magnitude, and temporal and spatial variation. Instantaneous plastic transport values varied between 200 and 10,000 items per hour for both the standard method and the CrowdWater method (Figure 4). Note that the plastic transport was always in downstream direction, despite being in close vicinity to the river mouth.
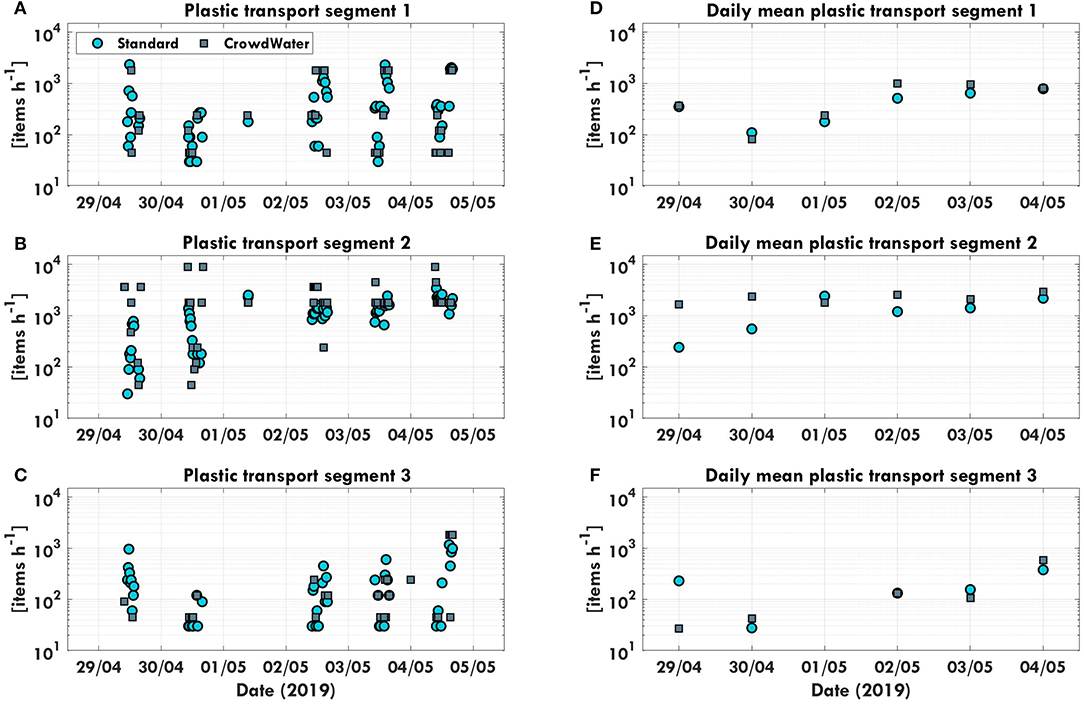
Figure 4. Time series of plastic transport [items h−1] in the Klang measured based on the standard method and with the CrowdWater app. Panels (A–C) present the instantaneous plastic transport in segments 1–3. Panels (D–F) present the daily mean plastic transport in segment 1–3.
The estimates at segment 1 for both methods are well-correlated in terms of the daily standard deviation (Pearson's ρ = 0.92, p = 0.01) and daily mean (Pearson's ρ = 0.88, p = 0.02; Figures 4, 5). The highest transport was recorded for the CrowdWater observations in segment 2 on 30 April, 2019. These peaks were not observed during the standard observations. On 29 and 30 April, 2019, the CrowdWater observations captured the plastic transport peaks that occurred in the morning and afternoon. No standard observations were made at the exact same location and time, and therefore likely missed these peaks. This resulted in higher daily mean plastic transport values for these days (Figures 4, 5). The correlation between the daily mean was therefore lower for segment 2 (Pearson's ρ = 0.21, p = 0.56), although the correlation between the daily standard deviation is higher (Pearson's ρ = 0.70, p = 0.12). For segment 3, the correlation was good for both the daily mean (Pearson's ρ = 0.81, p = 0.10) and daily standard deviation (Pearson's ρ = 0.85, p = 0.07), despite the difference on 29 April (Figures 4, 5). These results are supported by similar values for the coefficient of variation for segment 1 (1.22 vs. 1.22) and 2 (0.80 vs. 0.90), and less for segment 3 (0.60 vs. 2.24).
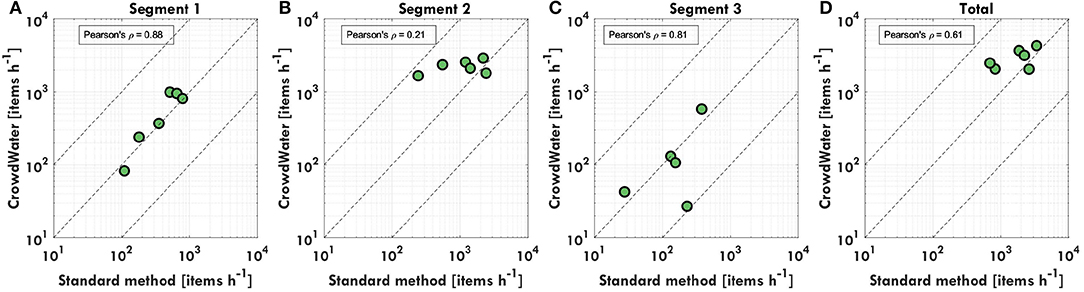
Figure 5. The daily mean transport based on the standard method and CrowdWater, including Spearman correlation coefficient, for (A) segment 1, (B) segment 2, (C) segment 3, and (D) total transport. The dashed lines represent the 1:1 line and the one order of magnitude difference.
For each day during the measurement campaign, the daily mean plastic transport estimates were on the same order of magnitude (Figure 6A). The largest difference between the two methods was observed on 29 and 30 April (240 vs. 1,670 and 550 vs. 2,360 items h−1, respectively). This is mainly due to the high peak values on these days that were missed by the standard observations. The mean hourly plastic transport varied between 2,000 items h−1 (standard method) and 3,000 items h−1 (CrowdWater), which is comparable to the maximum observed plastic transport in the Seine, France and the minimum plastic transport observed in the Saigon, Vietnam (van Calcar and van Emmerik, 2019).
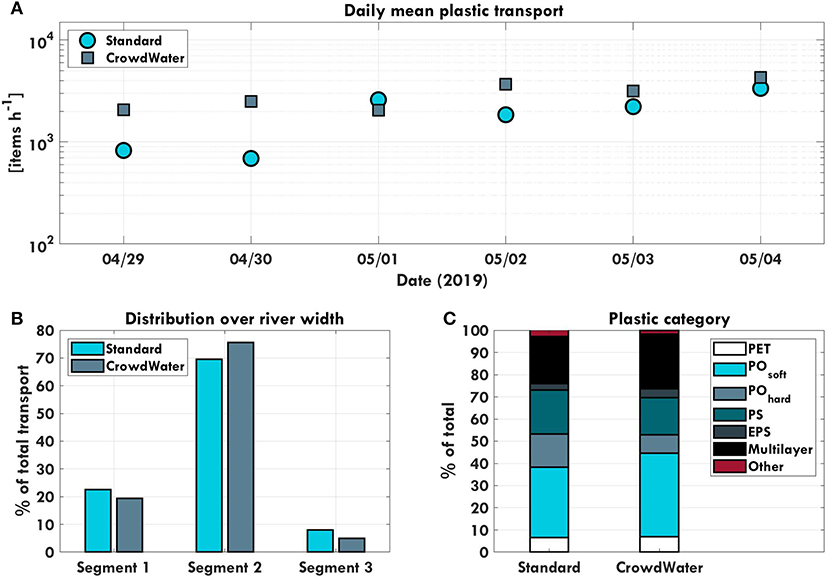
Figure 6. (A) Comparison between the daily mean plastic transport in the Klang between 29 April to 4 May, 2019, (B) The mean cross-sectional distribution of the plastic transport, and (C) the mean composition of the plastic, based on the standard method and the CrowdWater app.
The distribution of plastic transport across the river width was also similar (3–7 percent point difference), with an average of 19 and 23% of total transport in segment 1, 69 and 76% in segment 2, and 5 and 8% in segment 3, for the standard and CrowdWater methods respectively (Figure 6B). At the measurement location, the river is relatively straight and the flow velocity is likely the highest in the middle segment. Since the distribution is mainly driven by the flow velocity field, segment 2 was also expected to carry most of the plastic transport. The difference between segment 1 and 3 is assumed to be caused by the river geometry and the dense vegetation on the riverbank at segment 3.
The most frequent plastic category observed was POsoft (32 and 38%), followed by Multilayer (21 and 25%), PS (20 and 17%), POhard (8 and 15%), PET (both 7%), EPS (3 and 4%) and Other (3 and 2%), for the standard and CrowdWater methods respectively (Figure 6C). Thus, although the CrowdWater app only allows reporting the abundance of each category in multitudes of 20%, the mean composition of all observations was similar to the standard method (0–6 percent point difference).
3.2. Riverbank Plastic Density Along the Rhine, the Netherlands
The average plastic item density on the surveyed riverbanks was 574 items km−1 (σ = 897 items km−1), and ranged between 0 and 4,000 items km−1 (Figures 7, 8). Reference measurements using the River-OSPAR method at different locations in the same area suggest plastic densities between 100 and 1600 items km−1. This corresponds well with the observed plastic densities found using the Crowdwater method. For reference, the Rhine is estimated to transport between 10 and 75 floating macroplastic items per hour at Rotterdam (18 km upstream of Maassluis) in October (Vriend et al., 2020b). The plastic density along the Rhine is comparable to the Elbe (470 items km−1), and larger than the Ems (164 items km−1) and Weser (82 items km−1) (Schöneich-Argent et al., 2020). The data suggest that there is a weak correlation between the distance from the river mouth and the plastic density (Spearman's ρ = 0.26, p = 0.13). Between 9 and 12 km from the river mouth, twelve out of 19 locations had no plastic items on the riverbank. This river stretch is located in a rural area between the urbanized centers of Maassluis and Hook of Holland, which may explain the low plastic densities. However, there was a peak at 9 and 10 km. Around Maassluis, 14 km from the river mouth, there was another peak in plastic density (400–1,600 items km−1). The section from 6 to 9 km from the river mouth has the highest average plastic density (1,000 items km−1), and no locations without visible counted plastic items.
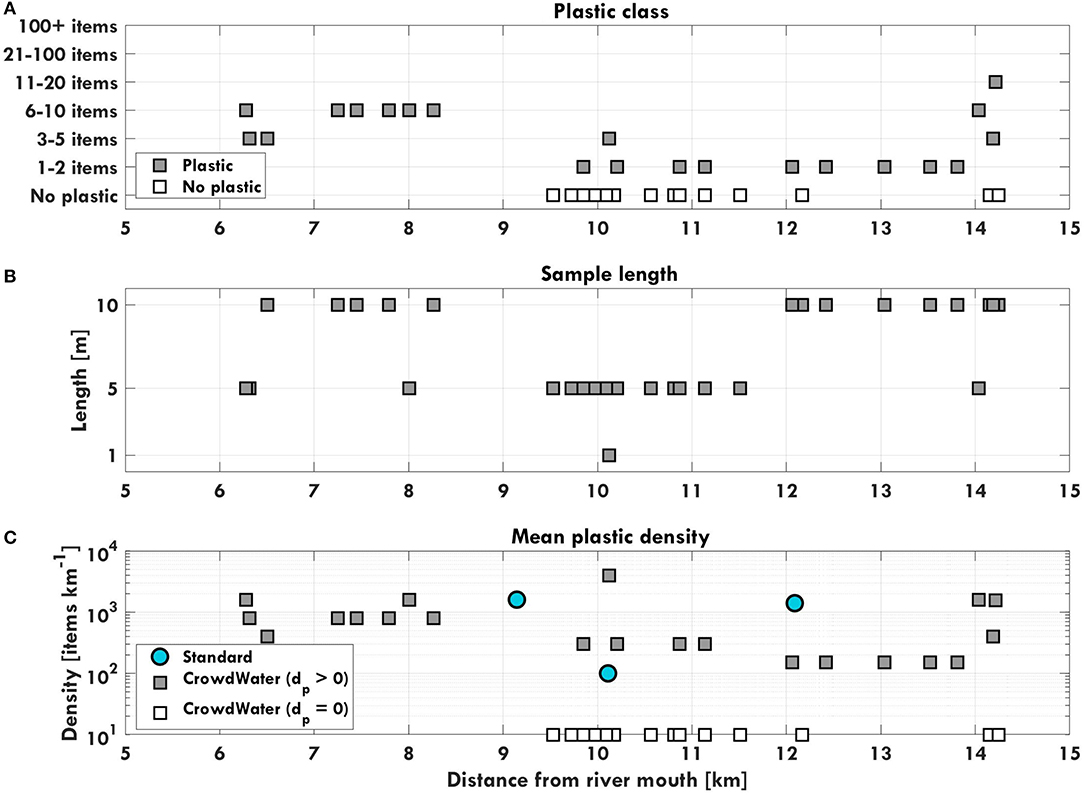
Figure 7. (A) The plastic class, (B) sample length for each measurement, and (C) calculated mean plastic density [item km−1] for the CrowdWater and the reference measurements along the Rhine between Maeslantkering (storm surge barrier) and Maassluis on 4 September, 2019.
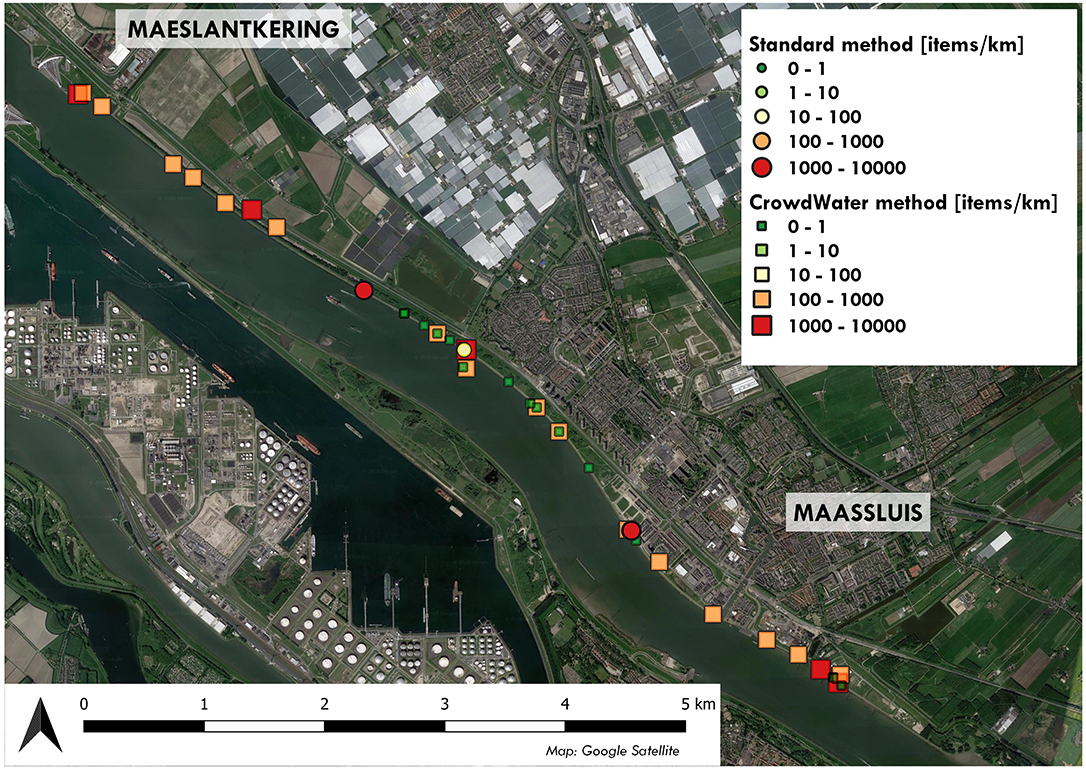
Figure 8. Plastic density determined with the CrowdWater method and the standard method, between the Maeslantkering (storm surge barrier) and Maassluis, measured on 4 September, 2019. Base map source: Google Satellite. Retrieved 26 June, 2020.
4. Discussion
The crowd-based floating plastic observations were similar to the standard method. The estimated order of magnitude, spatial distribution and composition were similar for both methods. The largest discrepancy occurred for the floating plastic transport in the middle segment of the river. Several peaks that were observed with the CrowdWater method, were missed during the lower frequency standard observations. This highlights the added value of rapid (crowd-based) measurements. Plastic transport can respond to changing hydrological conditions or less predictable human factors (van Emmerik and Schwarz, 2020). In some river systems, the majority of plastic transport can occur in a very limited time (Moore et al., 2011; van Emmerik et al., 2019c). Crowd-based observations allow data collection with a higher spatial and temporal frequency than conventional professional observations. Ultimately, this may result in a more accurate characterization of river plastic transport, even if individual measurements are less precise. Characterizing the composition of plastic debris helps to identify sources and estimate the ultimate fate of plastic items, which can be made using CrowdWater observations. The quick CrowdWater method is applicable for larger scale measurements. Within a couple of hours, 38 measurements were done on more than 8 km of riverbank has been sampled in our test study. With the standard River-OSPAR method, only three measurements were done.
However, based on the experiences in the studies at the Klang and Rhine rivers, there are also several aspects could be improved. The classes of the counted plastic items may be changed. Currently, the number of counted items is reported, independent from the sampled width, length or duration. The class boundaries could be combined for some categories for low counts, making the high count class more specific (e.g., “100–300” rather than “100+”). However, this would be disadvantageous for cleaner rivers. Therefore, it may be best to add extra classes for higher counts. For more accurate estimates of floating plastic transport or riverbank plastic density, it may be useful to allow users to also report the exact amount of counted items.
The possibilities for sampling width and length can be expanded. Especially for wider rivers (>100 m), four segments may be too limited for an accurate estimate of floating plastic transport. For example, plastic transport in the Saigon River in Vietnam was estimated based on ten observation points along the width, still covering only 60% of the total width (van Emmerik et al., 2019b). Typical riverbank observations are made on segments up to 100 m (Vriend et al., 2020a). Predefined categories are good for inexperienced users, but also limit the flexibility in making observations. We recommend the option for users to specify the used river width or sampling length. In general, the limited sample length may influence the results. The original River-OSPAR protocol uses 100-m stretches. Sampling such lengths is more time consuming (which may deter some citizen scientists), but increases the overall representativeness of the measurements. Smaller sampling lengths, especially shorter than 10 m, may lead to observer bias when citizen scientists only report observations for hot spots (Vriend et al., 2020a). This is supported by the data, which show a weak correlation between sampling length and mean plastic density (ρ = −0.29, p = 0.08).
To date, most macroplastic studies have focused on large European rivers, or rivers in areas that are predicted to transport large amounts of plastic into the ocean (Blettler et al., 2018; van Emmerik and Schwarz, 2020). Other studies mainly focused on microplastics (Klein et al., 2015; Mani et al., 2015) which requires advanced equipment and sampling protocols. Microplastic data collection is therefore not easy to implement in crowd-based observation strategies. The riverbank macroplastic observations presented in our study are the first of its kind in the most downstream section of the Rhine. Such data are crucial to understand how much plastic is transported from the Rhine into the North Sea. Crowd-based observations also allow for data collection in locations that are remote or not prioritized. With the CrowdWater app, river plastic data are now collected for the first time in rivers such as the Aker (Oslo, Norway), Fyris (Uppsala, Sweden), and the Sihl (Zurich, Switzerland). These locations are not assumed to be typical riverine plastic pollution hot spots (Lebreton and Andrady, 2019). Yet, crowd-based observations reveal that also in these river systems macroplastic are abundant.
Future (long-term) data collection efforts will shed additional light on the value of crowd-sourced macroplastic observations using CrowdWater. Available floating macroplastic data span 1-year periods at most (e.g., van Calcar and van Emmerik, 2019). Riverbank plastics are generally measured only once in total (Rech et al., 2015; Kiessling et al., 2019), or twice per year at most (Schone Rivieren, 2019). CrowdWater facilitates data collection at any time and at any location along a river. Such longer-term data will allow new opportunities for studying sources, sinks and transport mechanisms of riverine plastic pollution.
5. Conclusions
The CrowdWater app allows for crowd-based macroplastic observations everywhere around the world. Users can observe floating plastics in rivers and plastic on riverbanks. Observations include the number of observed plastic items, the composition, and information on e.g., the flow conditions. CrowdWater based estimates of floating plastic transport (2,000–3,000 items h−1), spatiotemporal variation (3-7 percent point difference), and composition (0–6 percent point difference) were similar to those obtained using the standard method. During the 1-week field campaign, several plastic transport peaks were observed with this quick, largely qualitative method, that were missed with the standard method. Riverbank plastic was counted along the Rhine, close to the river mouth. The CrowdWater app facilitated the first macroplastic observations on this stretch, providing insight into the spatial distribution of macroplastics along the downstream section of the Rhine.
With this paper we demonstrate the potential of rapid crowd-based observations to obtain order of magnitude information on riverine macroplastic pollution. Frequent data collection in many locations is crucial to establish a better understanding of the origin, fate and pathways of macroplastic in river systems. Crowd-based estimates of plastic stocks and fluxes may contribute to further optimization of prevention, mitigation and reduction strategies.
Data Availability Statement
All CrowdWater data is openly available from the CrowdWater website www.crowdwater.ch. All data used in this study are provided in the Supplementary Materials.
Author Contributions
TE, JS, BS, SE, and IM: conceptualization. TE: methodology, formal analysis, visualization, and writing—original draft. JS and IM: funding acquisition. TE, TO, and MA: investigation. All authors writing—reviewing and editing.
Funding
The work of JS, BS, SE, and IM was funded by the Swiss National Science Foundation (SNSF), Project 163008.
Conflict of Interest
The authors declare that the research was conducted in the absence of any commercial or financial relationships that could be construed as a potential conflict of interest.
Acknowledgments
We thank the students from Universiti Putra, Malaysia, and Rotterdam University of Applied Sciences, the Netherlands, for the data collection in the Klang and Rhine rivers, respectively. We thank Rainer Holzapfel (CEO - Development Lead) and Philipp Hummer (CEO - Design Lead) from SPOTTERON Gmbh for the implementation of the plastic observation modules in the CrowdWater app. We would like to thank the donors of The Ocean Cleanup who helped fund the fieldwork in Malaysia. We thank Liselotte Rambonnet for the valuable suggestions on an earlier version of the manuscript. Finally, we thank the two reviewers for their comments, which helped improving the manuscript.
Supplementary Material
The Supplementary Material for this article can be found online at: https://www.frontiersin.org/articles/10.3389/feart.2020.00298/full#supplementary-material
References
Barrows, A. P., Christiansen, K. S., Bode, E. T., and Hoellein, T. J. (2018). A watershed-scale, citizen science approach to quantifying microplastic concentration in a mixed land-use river. Water Res. 147, 382–392. doi: 10.1016/j.watres.2018.10.013
Blettler, M. C., Abrial, E., Khan, F. R., Sivri, N., and Espinola, L. A. (2018). Freshwater plastic pollution: recognizing research biases and identifying knowledge gaps. Water Res. 143, 416–424. doi: 10.1016/j.watres.2018.06.015
Buytaert, W., Zulkafli, Z., Grainger, S., Acosta, L., Alemie, T. C., Bastiaensen, J., et al. (2014). Citizen science in hydrology and water resources: opportunities for knowledge generation, ecosystem service management, and sustainable development. Front. Earth Sci. 2:26. doi: 10.3389/feart.2014.00026
Davids, J. C., Devkota, N., Pandey, A., Prajapati, R., Ertis, B. A., Rutten, M. M., et al. (2019). Soda bottle science-citizen science monsoon precipitation monitoring in Nepal. Front. Earth Sci. 7:46. doi: 10.3389/feart.2019.00046
Faure, F., Demars, C., Wieser, O., Kunz, M., and De Alencastro, L. F. (2015). Plastic pollution in Swiss surface waters: nature and concentrations, interaction with pollutants. Environ. Chem. 12, 582–591. doi: 10.1071/EN14218
Fischer, B. M. C., Frentress, J., Manzoni, S., Cousins, S., Hugelius, G., Greger, M., et al. (2019). Mojito, anyone? an exploration of low-tech plant water extraction methods for isotopic analysis using locally-sourced materials. Front. Earth Sci. 7:150. doi: 10.3389/feart.2019.00150
Geraeds, M., van Emmerik, T., de Vries, R., and bin Ab Razak, M. S. (2019). Riverine plastic litter monitoring using unmanned aerial vehicles (UAVs). Remote Sens. 11:2045. doi: 10.3390/rs11172045
González-Fernández, D., and Hanke, G. (2017). Toward a harmonized approach for monitoring of riverine floating macro litter inputs to the marine environment. Front. Mar. Sci. 4:86. doi: 10.3389/fmars.2017.00086
Honingh, D., van Emmerik, T., Uijttewaal, W., Kardhana, H., Hoes, O., and van de Giesen, N. (2020). Urban river water level increase through plastic waste accumulation at a rack structure. Front. Earth Sci. 8:28. doi: 10.3389/feart.2020.00028
Kataoka, T., and Nihei, Y. (2020). Quantification of floating riverine macro-debris transport using an image processing approach. Sci. Rep. 10, 1–11. doi: 10.1038/s41598-020-59201-1
Kiessling, T., Knickmeier, K., Kruse, K., Brennecke, D., Nauendorf, A., and Thiel, M. (2019). Plastic pirates sample litter at rivers in Germany–Riverside litter and litter sources estimated by schoolchildren. Environ. Pollut. 245, 545–557. doi: 10.1016/j.envpol.2018.11.025
Klein, S., Worch, E., and Knepper, T. P. (2015). Occurrence and spatial distribution of microplastics in river shore sediments of the rhine-main area in Germany. Environ. Sci. Technol. 49, 6070–6076. doi: 10.1021/acs.est.5b00492
Lebreton, L., and Andrady, A. (2019). Future scenarios of global plastic waste generation and disposal. Palgrave Commun. 5:6. doi: 10.1057/s41599-018-0212-7
Lechner, A., Keckeis, H., Lumesberger-Loisl, F., Zens, B., Krusch, R., Tritthart, M., et al. (2014). The danube so colourful: a potpourri of plastic litter outnumbers fish larvae in Europe's second largest river. Environ. Pollut. 188, 177–181. doi: 10.1016/j.envpol.2014.02.006
Lowry, C. S., Fienen, M. N., Hall, D. M., and Stepenuck, K. F. (2019). Growing pains of crowdsourced stream stage monitoring using mobile phones: the development of CrowdHydrology. Front. Earth Sci. 7:128. doi: 10.3389/feart.2019.00128
Mani, T., Hauk, A., Walter, U., and Burkhardt-Holm, P. (2015). Microplastics profile along the rhine river. Sci. Rep. 5, 1–7. doi: 10.1038/srep17988
Moore, C. J., Lattin, G., and Zellers, A. (2011). Quantity and type of plastic debris flowing from two urban rivers to coastal waters and beaches of Southern California. Revista de Gestão Costeira Integrada-Journal of Integrated Coastal Zone Management 11, 65–73. doi: 10.5894/rgci194
Nelms, S., Coombes, C., Foster, L., Galloway, T., Godley, B., Lindeque, P., et al. (2017). Marine anthropogenic litter on British beaches: a 10-year nationwide assessment using citizen science data. Sci. Tot. Environ. 579, 1399–1409. doi: 10.1016/j.scitotenv.2016.11.137
OSPAR Commission (2010). Guideline for Monitoring Marine Litter on the Beaches in the OSPAR Maritime Area. London: OSPAR Commission.
Rambonnet, L., Vink, S. C., Land-Zandstra, A. M., and Bosker, T. (2019). Making citizen science count: best practices and challenges of citizen science projects on plastics in aquatic environments. Mar. Pollut. Bull. 145, 271–277. doi: 10.1016/j.marpolbul.2019.05.056
Rech, S., Macaya-Caquilpán, V., Pantoja, J. F., Rivadeneira, M. M., Campodónico, C. K., and Thiel, M. (2015). Sampling of riverine litter with citizen scientists-findings and recommendations. Environ. Monit. Assess. 187:335. doi: 10.1007/s10661-015-4473-y
Sadri, S. S., and Thompson, R. C. (2014). On the quantity and composition of floating plastic debris entering and leaving the Tamar Estuary, Southwest England. Mar. Pollut. Bull. 81, 55–60. doi: 10.1016/j.marpolbul.2014.02.020
Schmidt, C., Krauth, T., and Wagner, S. (2017). Export of plastic debris by rivers into the sea. Environ. Sci. Technol. 51, 12246–12253. doi: 10.1021/acs.est.7b02368
Schöneich-Argent, R. I., Dau, K., and Freund, H. (2020). Wasting the North Sea?–A field-based assessment of anthropogenic macrolitter loads and emission rates of three german tributaries. Environ. Pollut. 263:114367. doi: 10.1016/j.envpol.2020.114367
Seibert, J., Strobl, B., Etter, S., Hummer, P., and van Meerveld, H. (2019). Virtual staff gauges for crowd-based stream level observations. Front. Earth Sci. 7:70. doi: 10.3389/feart.2019.00070
van Calcar, C., and van Emmerik, T. (2019). Abundance of plastic debris across European and Asian rivers. Environ. Res. Lett. 14:124051. doi: 10.1088/1748-9326/ab5468
van der Wal, M., van der Meulen, M., Tweehuijsen, G., Peterlin, M., Palatinus, A., Kovac, M., et al. (2015). SFRA0025: Identification and Assessment of Riverine Input of (Marine) Litter: Final Report for the European Commission DG Environment Under Framework. Contract No ENV.D.2/FRA/2012/0025.
van Emmerik, T., Kieu-Le, T.-C., Loozen, M., van Oeveren, K., Strady, E., Bui, X.-T., et al. (2018). A methodology to characterize riverine macroplastic emission into the ocean. Front. Mar. Sci. 5:372. doi: 10.3389/fmars.2018.00372
van Emmerik, T., Loozen, M., Van Oeveren, K., Buschman, F., and Prinsen, G. (2019a). Riverine plastic emission from Jakarta into the ocean. Environ. Res. Lett. 14:084033. doi: 10.1088/1748-9326/ab30e8
van Emmerik, T., and Schwarz, A. (2020). Plastic debris in rivers. WIREs Water e1398:7. doi: 10.1002/wat2.1398
van Emmerik, T., Strady, E., Kieu-Le, T.-C., Nguyen, L., and Gratiot, N. (2019b). Seasonality of riverine macroplastic transport. Sci. Rep. 9, 1–9. doi: 10.1038/s41598-019-50096-1
van Emmerik, T., Tramoy, R., van Calcar, C., Alligant, S., Treilles, R., Tassin, B., et al. (2019c). Seine plastic debris transport tenfolded during increased river discharge. Front. Mar. Sci. 6:642. doi: 10.3389/fmars.2019.00642
Vincent, A., Drag, N., Lyandres, O., Neville, S., and Hoellein, T. (2017). Citizen science datasets reveal drivers of spatial and temporal variation for anthropogenic litter on Great Lakes beaches. Sci. Tot. Environ. 577, 105–112. doi: 10.1016/j.scitotenv.2016.10.113
Vos, L. D., Leijnse, H., Overeem, A., and Uijlenhoet, R. (2017). The potential of urban rainfall monitoring with crowdsourced automatic weather stations in Amsterdam. Hydrol. Earth Syst. Sci. 21, 765–777. doi: 10.5194/hess-21-765-2017
Vriend, P., Roebroek, C. T. J., and van Emmerik, T. (2020a) Same but different: a framework to design compare riverbank plastic monitoring strategies. EarthArXiv [Preprint]. doi: 10.31223/osf.io/jp6a2
Keywords: citizen science, hydrology, plastic, marine litter, riverbank plastic, floating debris, Rhine, Klang
Citation: van Emmerik T, Seibert J, Strobl B, Etter S, den Oudendammer T, Rutten M, bin Ab Razak MS and van Meerveld I (2020) Crowd-Based Observations of Riverine Macroplastic Pollution. Front. Earth Sci. 8:298. doi: 10.3389/feart.2020.00298
Received: 12 February 2020; Accepted: 26 June 2020;
Published: 12 August 2020.
Edited by:
Wouter Buytaert, Imperial College London, United KingdomReviewed by:
Md Nazmul Azim Beg, Tulane University, United StatesAhmed Kenawy, Mansoura University, Egypt
Copyright © 2020 van Emmerik, Seibert, Strobl, Etter, den Oudendammer, Rutten, bin Ab Razak and van Meerveld. This is an open-access article distributed under the terms of the Creative Commons Attribution License (CC BY). The use, distribution or reproduction in other forums is permitted, provided the original author(s) and the copyright owner(s) are credited and that the original publication in this journal is cited, in accordance with accepted academic practice. No use, distribution or reproduction is permitted which does not comply with these terms.
*Correspondence: Tim van Emmerik, dGltLnZhbmVtbWVyaWtAd3VyLm5s