 Louise Petersson1*
 Marie-Claire ten Veldhuis1
 Govert Verhoeven2
 Zoran Kapelan1
 Innocent Maholi3
 Hessel C. Winsemius1,2
- 1Department of Water Management, Delft University of Technology, Delft, Netherlands
- 2Inland Water Systems Unit, Deltares Research Institute, Delft, Netherlands
- 3Humanitarian OpenStreetMap Team, Dar es Salaam, Tanzania
In this paper we demonstrate a framework for urban flood modeling with community mapped data, particularly suited for flood risk management in data-scarce environments. The framework comprises three principal stages: data acquisition with survey design and quality assurance, model development and model implementation for flood prediction. We demonstrate that data acquisition based on community mapping can be affordable, comprehensible, quality assured and open source, making it applicable in resource-strained contexts. The framework was demonstrated and validated on a case study in Dar es Salaam, Tanzania. The results obtained show that the community mapped data supports flood modeling on a level of detail that is currently inaccessible in many data-scarce environments. The results obtained also show that the community mapping approach is appropriate for datasets that do not require extensive training, such as flood extent surveys where it is possible to cross-validate the quality of reports given a suitable number and density of data points. More technically advanced features such as dimensions of urban drainage system elements still require trained mappers to create data of sufficient quality. This type of mapping can, however, now be performed in new contexts thanks to the development of smartphones. Future research is suggested to explore how community mapping can become an institutionalized practice to fill in important gaps in data-scarce environments.
Introduction
The global trend of expanding settlements in flood prone areas exposes an increasing share of the world’s population to floods (United Nations, 2018; Winsemius et al., 2018). Many regions are, however, still lacking the data needed for flood disaster preparedness, response, and governance (Paul et al., 2018). This paper aims to investigate to what extent data collected through community mapping contributes to improved assessments of urban flood risks in resource-strained environments, by filling essential data gaps on drainage networks and urban topography using a community mapping approach.
The conventional approach to urban flood modeling strongly relies on availability of detailed geometric data on drainage elements, such as pipe diameters, manhole connections, channel cross-sections and weir levels (Butler et al., 2018) and terrain data (Schumann and Bates, 2018; Winsemius et al., 2019). State-of-the-art urban flood models combine detailed geometric data on sewer pipes and drainage channels with digital terrain data to model flood events, combining both overland flow and channel flow through channels and pipes (Bach et al., 2014). These models simulate the impact of storm events in urban environments, which allow for flood risk assessments at a high level of detail. The density and complexity of urban drainage networks makes urban flood modeling a highly data-intensive endeavor.
In resource-strained environments, where detailed drainage data tend not to be readily available, data acquisition is a critical challenge that inhibits the development of detailed flood risk assessments (Deletic et al., 2012). Furthermore, validation data to evaluate the performance of flood models is often missing. Previous research suggests that citizen observations offers an alternative data source in data-scarce environments to estimate water levels for model calibration (Etter et al., 2019; Strobl et al., 2019). Hence, we propose a framework for acquisition of drainage data and water levels required for flood model development and validation through community mapping. The approach proposed here is based on proactive engagement of the local community that is trained to collect high quantities of flood-related data which allows for extensive flood model development and validation in an affordable way.
The framework has been applied, validated, and demonstrated on a case study in Dar es Salaam, Tanzania. Our hypothesis is that community mapped drainage data can improve urban flood model performance and hence allow for detailed flood risk assessments in contexts where drainage data is normally not available. Specifically, we stipulate that the simulated flood depth in a model that couples community mapped drainage data with digital terrain data (coupled 1D–2D model) corresponds better with citizen’s reports on flood depth for a certain storm event, than the simulated flood depth in a model built with terrain data only without community mapped drainage data (2D model). The hypothesis was tested by developing a hydrodynamic model including detailed schematization of a community mapped drainage network and comparing the simulated flood depth with citizen’s reports on flood depth for models run with and without the community mapped drainage network.
If the hypothesis is confirmed, the proposed framework opens the way for implementation of citizen observations to support flood modeling on neighborhood scale, a level of detail that has not been possible previously in many regions due to lack of data on drainage system characteristics. Furthermore, it will show that community mapping can be beneficial to fill data gaps for flood resilience in these contexts. The usefulness of a model built this way was demonstrated by using the model to investigate the impact of drains blocked by solid waste on flooding.
The remainder of the paper is organized as follows. We first identify the need for our method and gaps in research in a literature review. Then, we present our methodology, including the components of the framework, presentation of the case study, data acquisition, model development and model implementation. Subsequently, we present the results of data quality analysis, model development and the model implementation. We finally discuss limitations of our proposed method, relating to technical and sustainability issues.
Background
Community mapping is the action of producing a map of a certain location together with or by the residents, often featuring local knowledge and resources (Parker, 2006). It can be considered as a form of Volunteered Geographic Information (VGI) which arose in the early 2000’s through platforms such as OpenStreetMap (OSM),1 an online world map which can be edited by anyone (Goodchild, 2007; Zook et al., 2010; Ramm et al., 2011). The internet has allowed for open source platforms where geographical information can be produced and stored, which has remarkably lowered the costs to collect the data needed to build urban resilience. This has accommodated the rise of community mapping projects to collect geographical data for pre-disaster, in-disaster, and post-disaster management (Paul et al., 2018).
The earliest examples of large-scale, digital VGI projects, dating around 2010, made use of stand-alone GPS devices and home computers (Zook et al., 2010; Soden and Palen, 2014). Only ten years later, smartphones are now equipped with sensors like GPS receivers, making them suitable for scientific data collection (Haklay, 2013). VGI combined with smartphones has put mapping, a task that for centuries has been reserved for official agencies, in the hands of anyone who wants to contribute to online maps (Flanagin and Metzger, 2008). Davids et al. (2018) suggest that smartphone-based data collection activities should be a part of science and engineering curricula, aiming for standardized data collection methods and open access.
Research shows that the incentive to participate in VGI projects depends on the volunteers’ knowledge and interest in the topic being mapped and their available time and resources (Brady et al., 1995; Coleman et al., 2009). A literature review on motivation to participate in VGI projects is presented by Fritz et al. (2017). VGI is produced by heterogeneous contributors with different levels of detail and precision, which introduces errors and variable quality of VGI data sets (Senaratne et al., 2017). Goodchild and Li (2012) note that VGI data quality can be assured through cross-validation, where the contribution of an individual must be controlled by at least one other user before submission. Quality assurance can also be obtained through “gatekeepers,” individuals promoted with special privileges to edit content based on their previous contributions, or data mining such as outlier detection and cluster analysis (Flanagin and Metzger, 2008; Senaratne et al., 2017).
Many researchers have analyzed the quality of OSM data by comparing it with spatial data from national mapping agencies (Girres and Touya, 2010; Haklay, 2010; Neis et al., 2011; Antoniou and Skopeliti, 2015). Very few studies on OSM data quality have been conducted in Africa. One of few examples is Iliffe (2017) that analyzed the OSM road data in Tandale ward in Dar es Salaam, Tanzania, in terms of positional accuracy and completeness. The results obtained showed that all roads in the OSM dataset lied within a 10 m buffer of the road data provided by the Dar es Salaam City Council (DCC). Furthermore, the OSM data held a much more extensive road network than the DCC dataset. Iliffe (2017) notes that this results from the fact that the official map held by the ward officer was outdated and did not contain all roads present in Tandale ward.
The data abundant World Wide Web seems to add different assets in different contexts, depending on the available geographic information in these contexts. The added value of VGI in planned, mapped, and industrially advanced areas lies in endemic knowledge about the physical environment, and current information about local conditions (Buytaert et al., 2014). But in contexts where authoritative data sets are incomplete or absent, VGI has the potential to, additionally, fill data gaps needed for governance. This makes Iliffe (2017) draw the conclusion that a different framework must be applied for community mapping in industrially developing countries, which emphasizes the elements of open source data and comprehensible data collection methods.
Iliffe developed his framework by studying Ramani Tandale, a community mapping project carried out in 2011 in Tandale ward in Dar es Salaam. The project started with a community forum that identified what the community thought should be put on the map; roads, pharmacies, schools, drainage, and features relating to water access, sanitation, and flood impact. The mapping was carried out during 4 weeks in August 2011, resulting in a detailed map of Tandale that later assisted local authorities during a cholera outbreak (Iliffe, 2017). The positive outcome of Ramani Tandale made the World Bank in Tanzania upscale the project and put all flood prone wards in Dar es Salaam on the map through the large-scale community mapping project Ramani Huria. The flood model developed in this paper utilizes drainage data that was recorded by Ramani Huria (see section “Case Study”).
To the best of the authors’ knowledge, a flood model built with community mapped drainage data has not been developed and examined previously, and previous research has mainly focused on the quality and accuracy of VGI in data abundant contexts. The increasing flood risks caused by expanding settlements in flood prone areas call for flood disaster preparedness and response, but the necessary data to build flood resilience is missing in many resource-strained environments (Paul et al., 2018). Now that data for flood resilience has been collected with a community mapping approach by Ramani Huria, it is of interest to investigate if this data can improve flood models on a neighborhood scale. It is also of interest to examine if models built with community mapped drainage data can be used to understand the causes of flooding.
Methodology
The methodology of this study consists of a framework for flood modeling with community mapped data (section “Framework”) that is applied on a case study, the Ramani Huria community mapping project in Dar es Salaam. The case study is presented in section “Case Study” and the framework analysis, following the three principal stages of the framework, is presented in section “Data Acquisition–Model Implementation.”
Framework
The proposed framework shown in Figure 1 combines the learnings from the principles of community mapping proposed by Iliffe (2017) for data acquisition with the conventional approach to urban flood modeling that relies on the availability of detailed geometric drainage data (Butler et al., 2018).
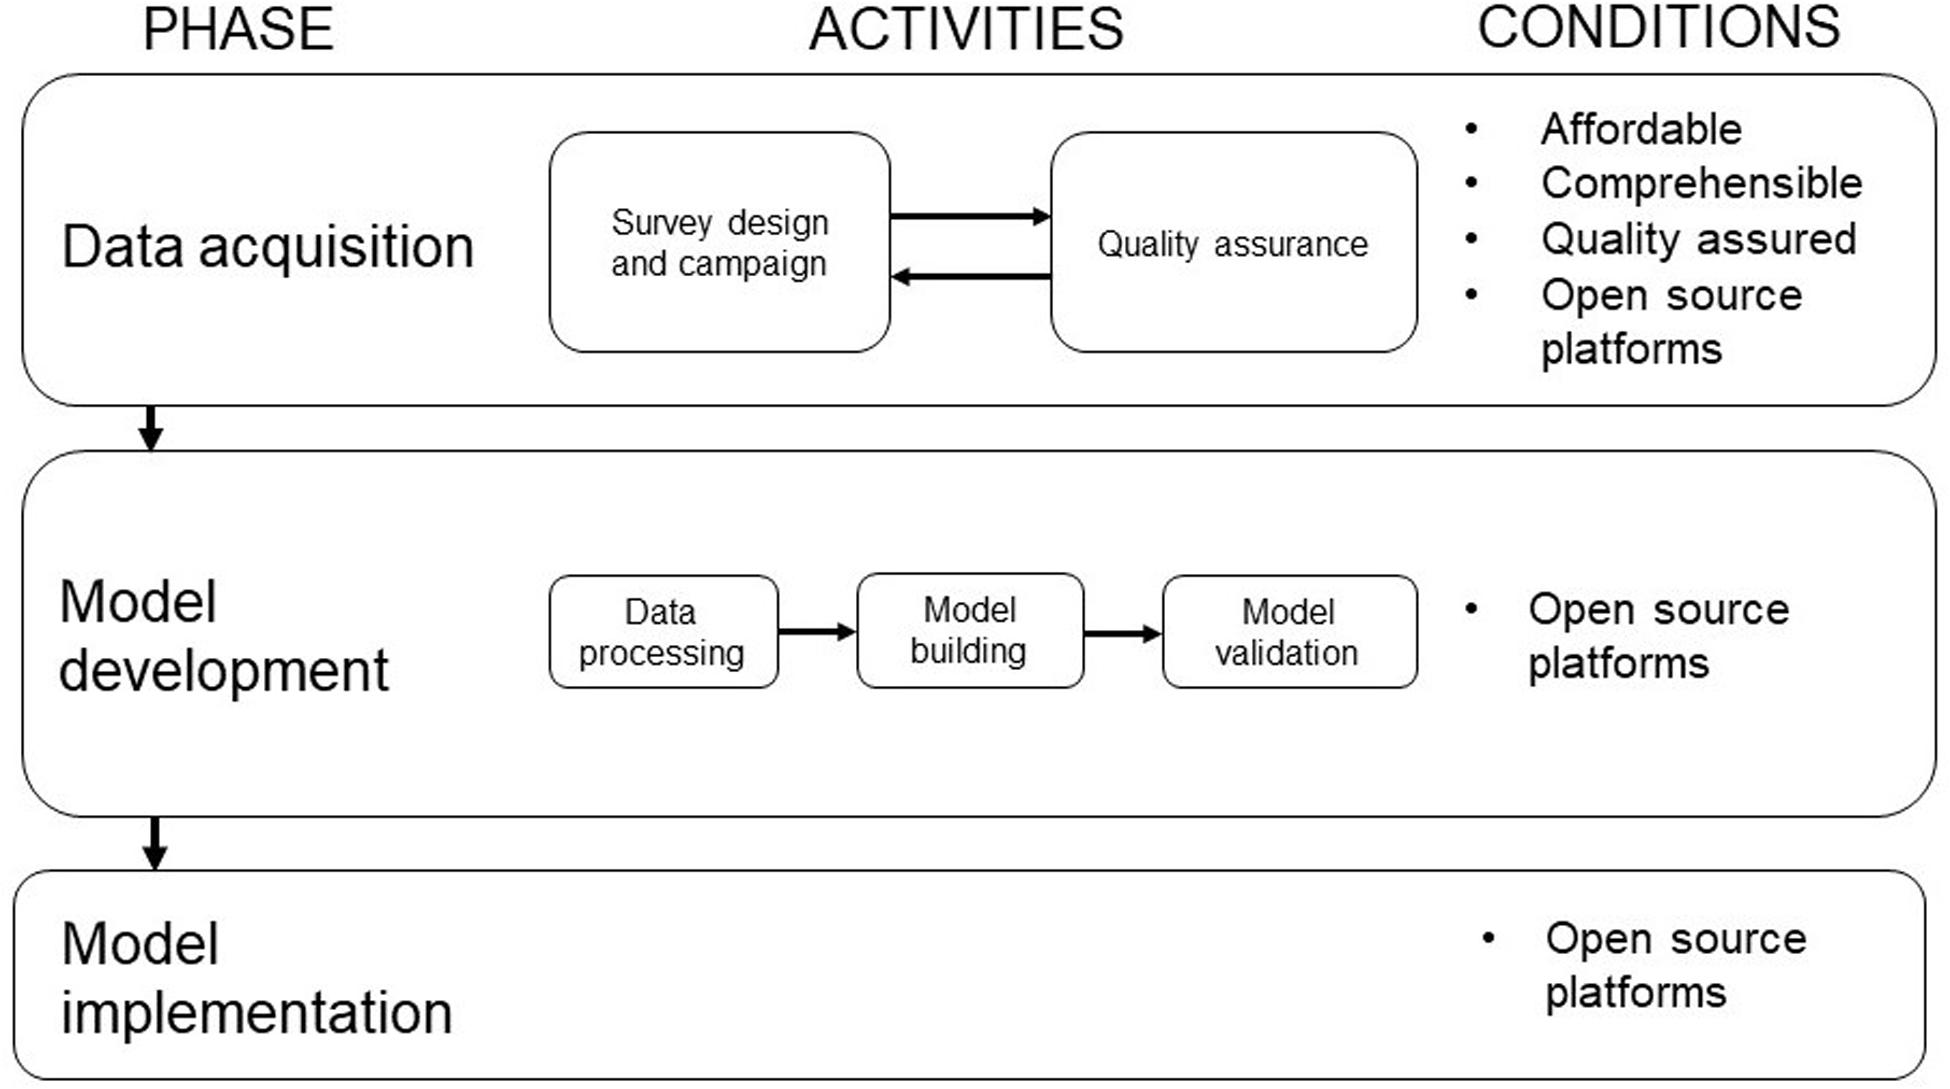
Figure 1. A framework for flood modeling with community mapped data.
Flood model development with community mapped data follows a similar approach compared to traditional model building, i.e., (1) data acquisition, followed by (2) model development and validation, and ending with (3) model implementation. However, the manner through which data is acquired is different from a data abundant context. The framework relies on four conditions. Firstly, the data survey should be affordable in the mapping context, using simple and easily accessible local devices and tools for the ones collecting the data. The benefits of VGI and ICT could be utilized by engaging volunteers and students equipped with smartphones and free smartphone applications. Secondly, the campaign should be comprehensible for the mapping community but at the same time allow for accurate records to be obtained with relatively little training. Features must be clearly defined and not accidentally overseen. Thirdly, the survey must be quality assured for completeness of attributes and topological connectivity. Finally, datasets must be made available freely and openly so that other surveyors or users can benefit from the data (Iliffe, 2017).
In the data acquisition phase, a comprehensible survey is designed to prepare detailed collection of data required to develop a model. This data may include data on drainage elements, their geographical attributes, as well as system states that may cause flooding such as maintenance states and clogging (ten Veldhuis et al., 2011). After the mapping campaign, a quality assurance protocol is applied to ensure that the collected data is of sufficient quality. If errors are encountered, the data must be recorded again or the survey design may be modified, forming an iterative relationship with the previous step of the process. The quality assurance is followed by the model development phase during which the acquired data is used to build and calibrate a flood model using suitable hydrodynamic modeling software. The final phase involves model implementation to e.g., investigate the causes of flooding, use for operational applications, develop early warning systems, or support long-term decision making and risk assessments.
Case Study
The data applied in this study is collected by Ramani Huria (“Open Map” in Swahili), a community mapping project initiated by the World Bank in 2017. It aims to collect the data needed to understand flood risk and build flood resilience in Dar es Salaam using a community mapping approach. Humanitarian OpenStreetmap Team (HOT), a non-governmental organization founded in the aftermath of the Haiti earthquake in 2010 (Bilham, 2010; Soden and Palen, 2014) is contracted to organize and supervise the mapping. The largest river flowing through Dar es Salaam is the Msimbazi river, of which both the Msimbazi as well as smaller tributaries and streams are known to cause flash floods. The rapid population growth rate leaves the city highly unplanned and the city center is characterized by a remarkably high building density on lands susceptible to flood risks, mainly in the Msimbazi river basin (UN-HABITAT, 2010).
Ramani Huria upscaled earlier mapping initiatives carried out at smaller and less detailed scale to cover 44 wards in Dar es Salaam between 2017 and 2019. Ramani Huria’s approach is to train university students and community members to create maps using open source applications. The training has mainly been conducted in the Ramani Huria “summer schools,” where university students in urban planning and geomatics participate in a 2-month internship that is part of their program curriculum. The students are divided into specialized teams, focusing on drainage mapping, data processing in GIS, digitizing aerial imagery and community outreach and are awarded with small stipends to cover travel costs, internet bundles and lunches. Collected data sets include, but are not limited to, buildings, roads, sanitary facilities, waste disposals, urban drainage, and soil types. A strong focus has been on accurately mapping small scale drainage channels with locally available tools and open source applications, making this a suitable community mapping project for testing the hypothesis that community mapped drainage data can improve the performance of flood models.
To this end, we focus on a subset of drainage data from Ramani Huria, collected for five sub-wards of Kijitonyama ward in Dar es Salaam, covering approximately 2.3 km2 (see Figure 2). The drainage data is freely available.2 Being located on a hill upstream of main water courses, Kijitonyama is mainly exposed to pluvial flooding. This type of flooding is caused by rainfall that exceeds the conveyance capacity of the drainage system and is therefore independent of overflowing water bodies (Butler et al., 2018), which is desirable to isolate the added value of Ramani Huria’s highly localized drainage data on flood predictions. The majority of the drainage network in Kijitonyama consists of open drains that are connected through short culverts.
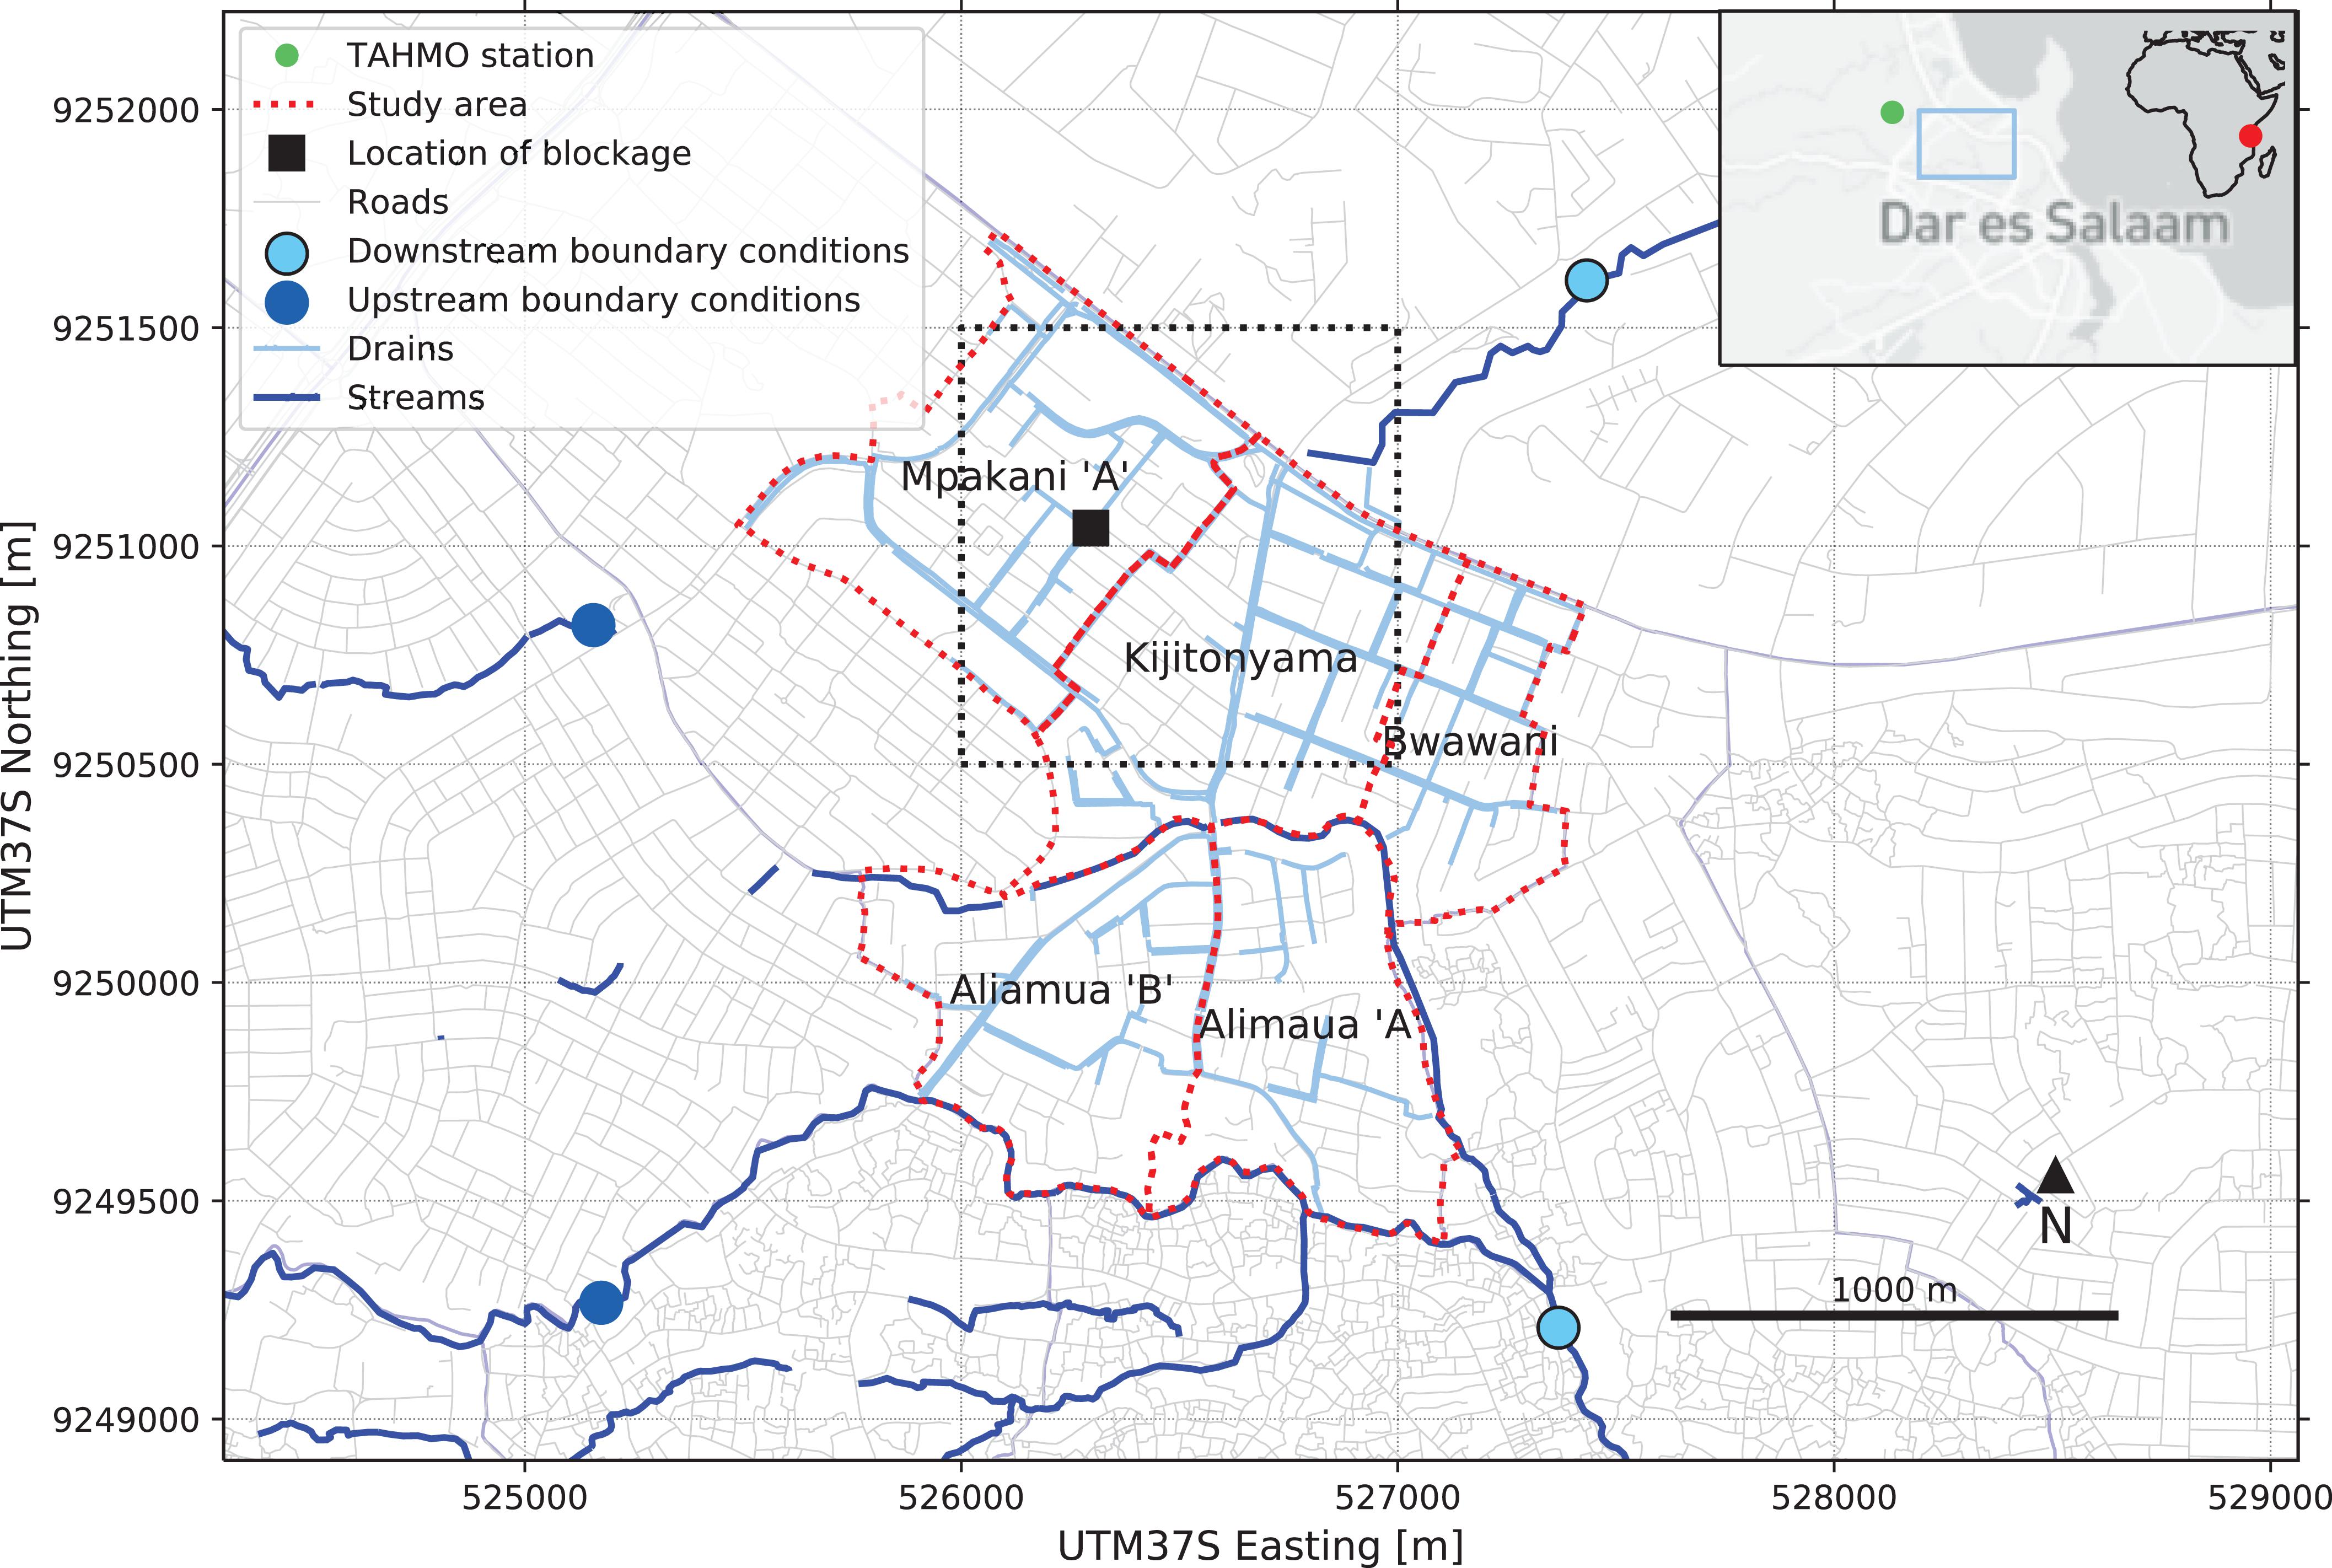
Figure 2. Study area.
Data Acquisition
The acquisition of drainage data for developing the flood model followed three stages: survey design, mapping campaign and quality assurance. These stages are further explained below. Subsequently, the acquisition of validation data and solid waste blockages for the model implementation are outlined.
Survey Design for Drainage Data
The drainage data acquisition process started with the design of a survey to collect drainage data using a community mapping approach. This involved identifying which data to be collected, how this should be done, but also identifying the affordable tools and open source platforms that could be used in the process.
A summary of schematization data collected, i.e., drainage elements and attributes identified and collected during the mapping process, is provided in Table 1. Defining the possible conditional attributes in the survey required several iterations in the field to find the predominant set of possible drainage elements and their characteristics, including dimensions. The drainage elements are divided into four classes: culverts, ditches, drains and decommissioned drains, which in turn can be open or closed and have different cross sections. Decommissioned drains are poorly maintained, e.g., full of vegetation, building materials or other blockages and have no attributes recorded. Elevation of the segments was measured to calculate the vertical position of bed levels in relation to a digital terrain model, as altitude cannot be recorded by smartphones with sufficient accuracy.
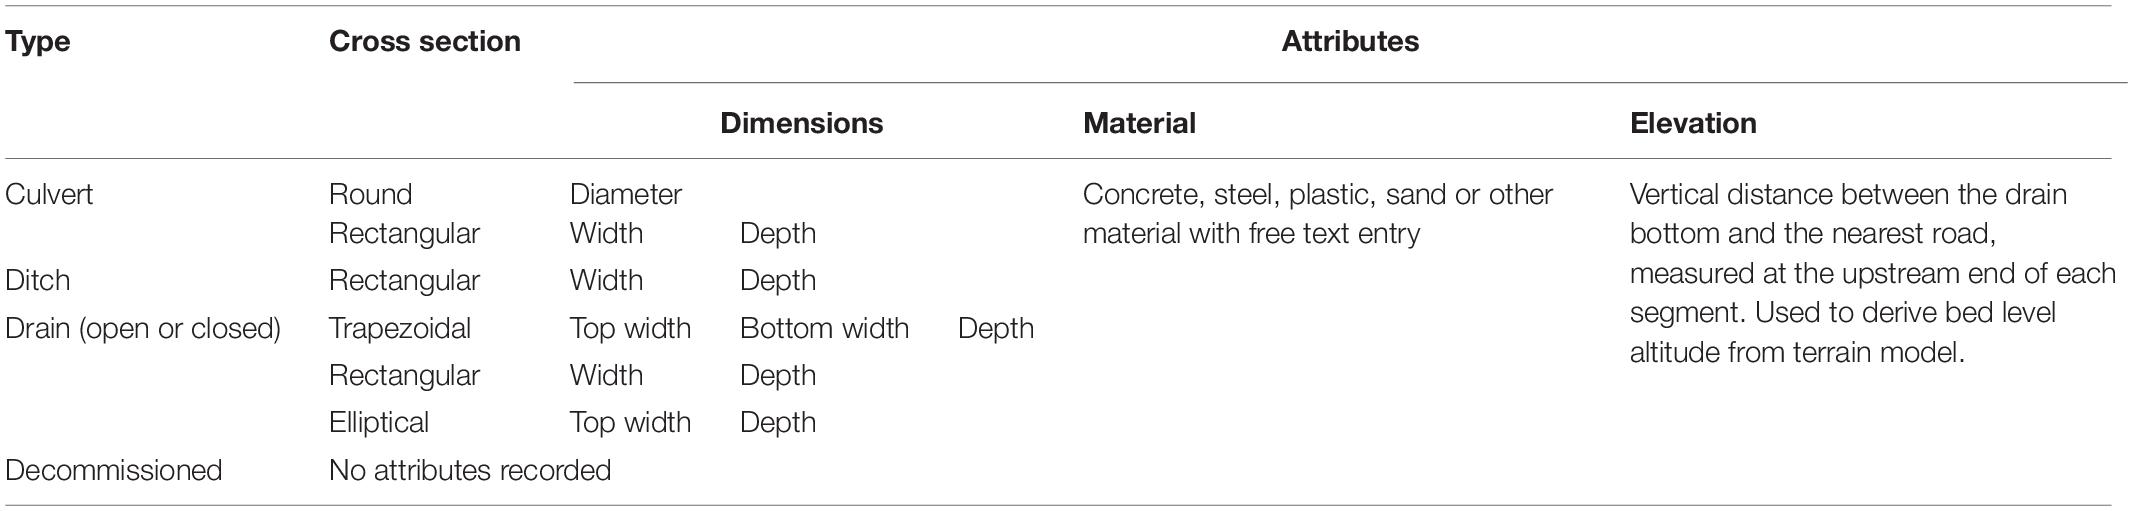
Table 1. Collected drainage data.
The Open Data Kit Collect Android application (ODK) was used for data collection, a free survey application for smartphones that can add geopoints and geotraces to each data entry, making it suitable for the record of drainage segments. OpenStreetMap was used as a platform to store data, making it openly and freely available.
Mapping Campaign for Drainage Data
To make the mapping comprehensive and complete, a special drainage data collection team was formed by students that was instructed how to measure the different attributes and in what order to observe the drainage channel so that no drains would be overseen. The overall survey was designed in a way that enabled individual surveys, when combined, to lead to a topologically correct and connected drainage dataset and a complete set of attributes by following a well-defined conditional data model, shared for upscaling elsewhere online.3
The team started by identifying the most downstream point of an area, where the drainage system reached a water body, recorded that geopoint and labeled it as outflow in the ODK application. If the most downstream segment stopped without reaching a water body, it was labeled as end. Then, the team mapped the drainage system starting from the most downstream point and walked upstream. The “geotrace” function of ODK makes it possible to track the reach of a drainage segment by walking along the drain while recording the walked path by using the GPS sensor in the smartphone. This method is well suited for open channel networks, which was observed to be the dominant drain type in Dar es Salaam. Any diverging drains were then mapped consecutively, and the most upstream points of the drainage network were labeled as begin. Using labeling of geopoints this way made it possible during quality assurance to distinguish if a drain flows into a next drain or whether a connection is truly missing, which is not an exception in Dar es Salaam. As local devices, cross sections of drainage segments were measured with locally made measuring sticks and tape rulers and the dimension values and material attributes were recorded in the ODK. The mapping process is illustrated in Figure 3.
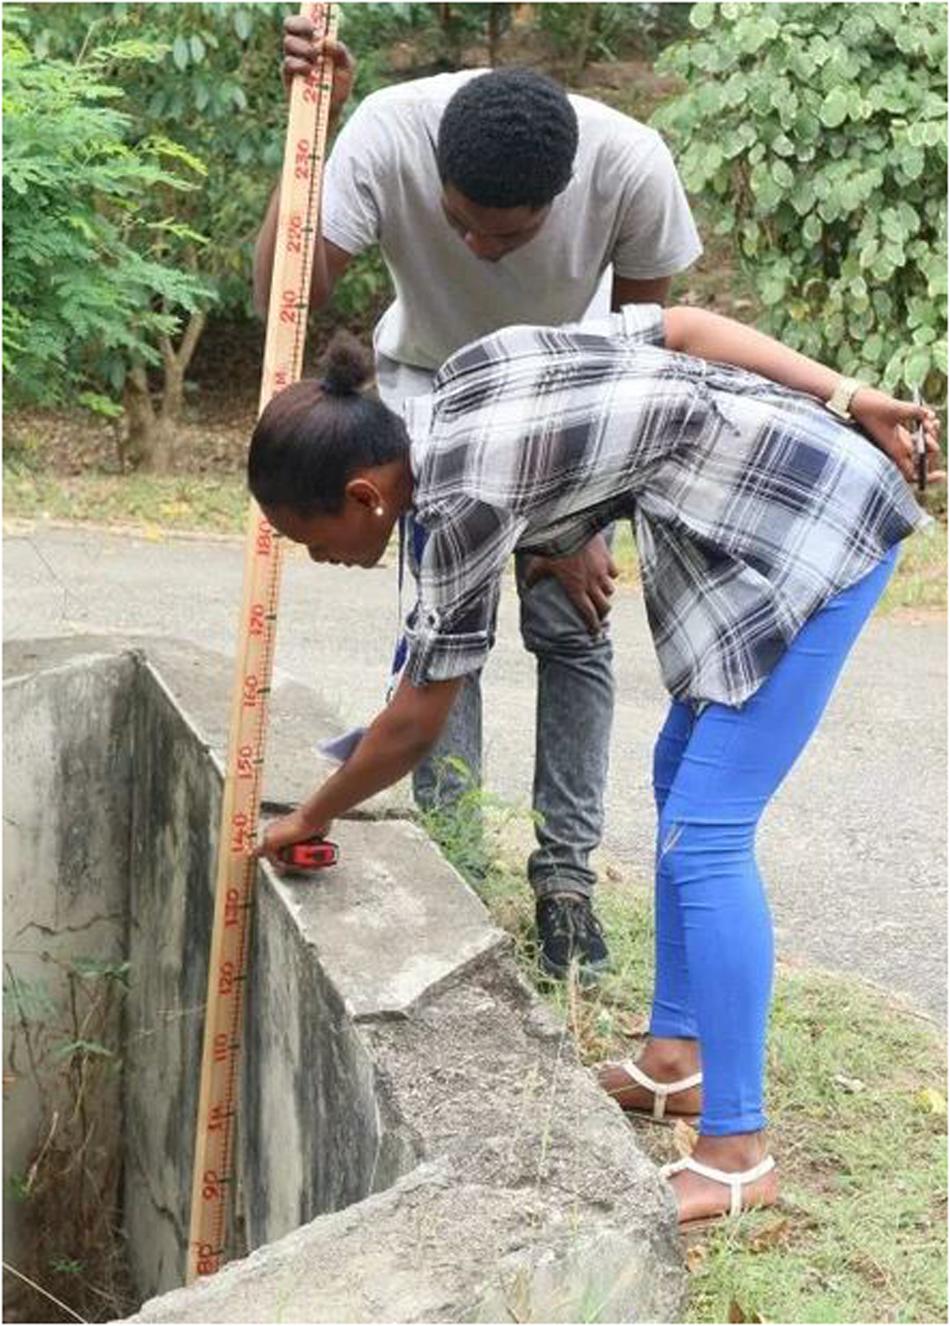
Figure 3. Ramani Huria drainage mappers, recording drainage features with a wooden ruler and smartphone. Written informed consent was obtained from the participants for the publication of any potentially identifiable images or data included in this article. Photo Chris Morgan/World Bank.
Data Quality Assurance of Drainage Data
The next step was to undertake data cleaning and quality assurance of the collected drainage data. Within Ramani Huria, a team of data cleaners was appointed to quality check the results before uploading the data to OSM. This involved aligning inaccurate geotraces with drainage segments seen on satellite and drone imagery in GIS, checking the completeness and validity of the attributes and checking the topology and connectivity of the network. Automated quality checks were used for both attributes and topology. Codes for quality assurance are openly shared.4 If errors or missing elements were encountered, the mapping team was instructed to record these again in the field. The data cleaning was taking place typically at the end of each field campaign day.
Remaining quality issues were identified by the authors during the model development phase, despite the data cleaning efforts of Ramani Huria. Positional errors were found through visual inspection, and when building the flood model, as positional errors caused a disconnected network in the model and hence introduced simulation errors. Data set completeness was studied with filters in the attribute tables in QGIS. The result of this analysis is presented in section “Drainage Data Quality and Completeness” and proposed solutions to overcome these remaining quality issues are addressed in the discussion section.
Validation Data Collection
The data acquisition further included collection of flood depth validation data, to be compared with simulated flood depth from the flood model. Community observations of flood depth in the study area were recorded in a “flood extent survey” by members of the drainage mapping team a few hours after a heavy rainfall event. Rainfall data from this rain event was used in the model simulation, and the maximum simulated flood depth was compared with community observations, see section “Model Implementation.” The respondents were asked to provide information about the depth of water on the street outside of their house the same morning and referred this information relative to a person’s height. Water depths were recorded as geopoints in ODK and lumped into 3 classes, as summarized in Table 2.
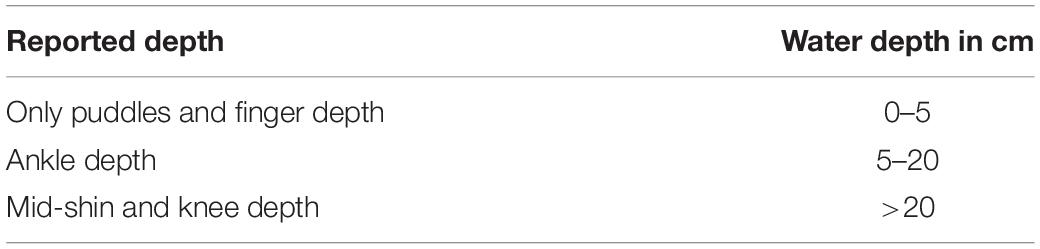
Table 2. Water depth classes used in the model validation.
It was considered to be most valid to categorize the responses into a few, wide validation classes because of the likely uncertainty of the community-based flood depth estimates. Previous research has demonstrated the value of using discrete water level classes in community observations rather than continuous scales in e.g., centimeters (Seibert et al., 2019). It should be noted that the thresholds of the flood depth classes are based on assumptions, and no research to date has investigated appropriate numeric ranges of this reference system. Nevertheless, the classes give an indication of the flood depth at each observation point. In total, 44 observations were collected this way and used for validation of the models used in the model implementation phase, see section “Model Development.”
Community Survey of Blockages in Urban Drains
When performing the flood extent survey described above, the mappers were also asked to record blocked drainage segments by recording a geopoint in ODK at the location of each blockage they found along their way. Apart from the position data, the blockage records included extent (50, 75 or 100% blocked) and type of blockage (e.g., solid waste, vegetation, building materials). This information was used to identify an appropriate location to investigate the impact of blocked drainage on urban flooding in the model implementation phase, see section “Model Implementation.”
Model Development
This stage of the framework developed the flood model using the SOBEK5 modeling suite, version 2.16. SOBEK is a modeling suite designed for modeling and analysis of water flows and processes in a wide range of water systems. It computes discharge, velocity, and water level in each computational node for each time step by solving the Saint-Venant equations, stating the conservation of mass and momentum in space and time.
SOBEK allows for 1D–2D modeling, in which a 1D and 2D flood model are coupled to exchange their computed water flows (Butler et al., 2018). A 1D model simulates the storage and conveyance through water networks like channels and drainage systems by introducing the parameters of the network in the model, whereas the 2D model only simulates runoff flows according to overland flow paths generated by topography from a 2D Digital Terrain Model (DTM). A combined 1D–2D model is an effective approach to capture both processes of drainage flow and surface runoff, as the interaction between these processes is simulated (Bach et al., 2014).
Rainfall data for the flood model was measured by Trans African Hydrometeorological Observatory6 (TAHMO) with 5 minutes temporal resolution at the Ardhi University weather station located about 2 km from the case study ward (see Figure 2). The simulation was run with a storm event that occurred in the early morning of 3 March 2019. This event was selected as it was preceded by five dry weeks, which was concluded by studying TAHMO rainfall time series. The dry spell indicated that the drainage system was dry without standing water levels at the beginning of the storm event, which was confirmed during fieldwork around 12 h before the event. The rainfall started at 00:10 in the morning, had two peaks at 01:00 and 06:00 and ended around 09:00. The peak intensity was 114 mm/h and the total rainfall amounted to 150 mm for the whole event, which was expected to cause pluvial flooding in Kijitonyama ward.
First, a 2D model was developed of Kijitonyama ward based on an existing 5 × 5 m2 DTM that is freely available.7 The Manning friction coefficient of the DTM was set to 0.2 s/m1/3 and was assumed to be uniform for all grid cells, in the absence of differentiated land use data that could inform spatially distributed surface roughness values. This value was selected as it represents built-up land, which was assessed to be the most common land use type in the study area (Chow et al., 1988). Ozdemir et al. (2013) shows that 2D roughness values in urban flood modeling generally have limited effect on maximum water levels and depths but tend to have larger influence on flow velocities, which was not simulated in this study. Hence, it is expected that the assumption did not decrease validity of the simulated water depths, see results in section “Model Results Without and With Community Mapped Data.”
Infiltration was assumed to be negligible as the rainfall intensity was much higher than expected infiltration rates in urban environments (Butler et al., 2018). Relevant inflow and outflow conditions at the boundaries of the ward were included in the model as boundary conditions, i.e., inflowing river discharges upstream and representative water levels of downstream outflow locations. The discharge was measured by TAHMO at 5 min resolution at the southern upstream boundary condition in Figure 2, a flow station at the Ubungo bridge located approximately 1 km upstream of the boundary of the study area. The discharge at the northern upstream boundary condition was estimated by the authors around noon 2 March 2019, before the modeled event using a float and stopwatch and multiplying the surface water velocity with the estimated cross section area of the water course (Davids et al., 2018). The estimated discharge was assigned as the initial value of the flow at the northern upstream boundary condition, and then the discharge data from the Ubungo flow station was re-scaled to this initial value. The gap between the northern water course and the drainage system in Figure 2 appears as the natural stream flows into a part of the drainage system that is outside of the model domain.
A second model was created by extending the 2D overland flow model to a coupled 1D–2D model by incorporating the Ramani Huria drainage network data. As 2D boundary conditions, the same setup was used as for the first model, and for the 1D model the simulation was started without any initial water level in the drainage segments, as had been observed during fieldwork. The 1D model roughness coefficients were assigned from literature based on the drainage segment materials recorded by Ramani Huria (see Table 3). The sensitivity of the model to 1D roughness values was investigated by first running a simulation where all drains were assumed to be of “normal concrete” as shown in Table 3, and subsequently assigning 1D roughness values to the segments according to their reported material (results not shown). The maximum water depth for the two schematizations was studied in 44 observation points inserted at the same coordinates as the geopoints that were recorded in the flood extent survey, which revealed that the maximum water depth difference was less than 0.5 cm in all observation points when implementing distributed 1D roughness values. This aligns with the findings of Ozdemir et al. (2013) that surface roughness mainly influences water velocities and not water depths.
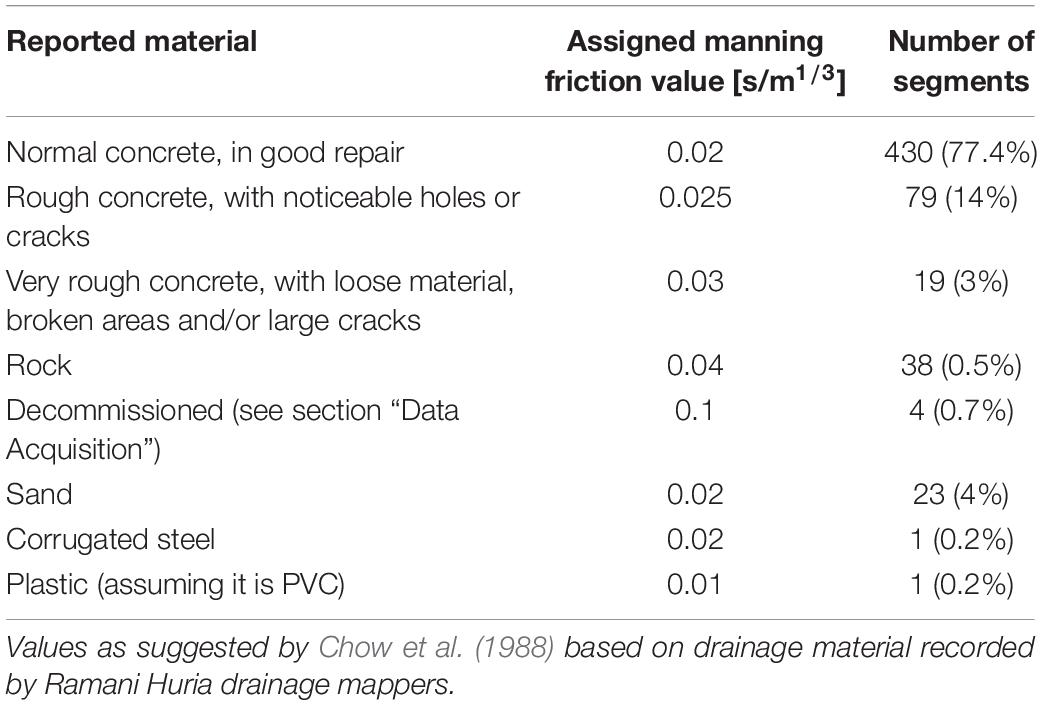
Table 3. Assigned manning roughness coefficients to drainage segments in the 1D–2D model.
Drainage bed levels were derived from the DTM by subtracting the vertical distance between the bottom of the drain segment and the nearest road (elevation, see Table 1). The simulation was run with the same storm event, 2D roughness and infiltration capacity as the 2D model, making the community mapped drainage data the only difference between the two schematizations. Hence, differences in modeled output between the 2D and coupled 1D–2D model could be fully attributed to the additional drainage data, that was included in the form of one-dimensional drainage channels added to the 2D-model, see results section “Model Results Without and With Community Mapped Data.”
Model performance of the schematizations was validated by inserting 44 observation points in the model at the same coordinates as the geopoints that were recorded in the flood extent survey. Then, the maximum computed water level in each observation point was exported from SOBEK and compared against the community mapped flood observations collected by the drainage mappers a few hours after the storm event. In this way, it was observed if the maximum simulated water depths of the storm event fell below, within or above the reported flood depth classes at 44 locations, see results in section “Model Results Without and With Community Mapped Data.”
Model Implementation
After validation, the coupled 1D–2D model was further applied to investigate the impact of solid waste accumulations in the drainage system, to exemplify how the model can be used to simulate network configuration changes and maintenance-states. This was simulated by removing an open drain segment from the 1D model schematization, see location in Figure 2. This simulated a similar effect as a fully blocked drain segment, as the whole cross section and conveyance capacity disappears if a drain is fully blocked. The interruption of the drainage channel will result in rising water levels upstream of the blockage and will eventually cause the water to overflow the drainage channel onto the street, where it will generate additional street flooding. From there, the water will flow further downstream based on the 2D topography and possibly flow back into the open drainage network further downstream. A drain location was selected in the Mpakani “A” sub-ward, as this location was reported to be sensitive to blockage during the solid waste blockage survey. Besides, this drain showed considerable drainage flow based on the 1D–2D simulation results, and results from the flood extent survey showed flooding upstream of this drain. Therefore, it was of interest to analyze the potential blocking effect of this drain. The model results were compared to the 1D–2D model without blockage to investigate how the water levels in the drainage system and the flood extent near the reported solid waste blockage were affected.
Results
In this section we first analyze the data quality and completeness of the community mapped drainage data (section “Drainage Data Quality and Completeness”). Then, we compare the results of the flood model without any drainage considered (i.e., 2D-model) against the model with local drainage data obtained via community mapping (i.e., 1D–2D model, section “Model Results Without and With Community Mapped Data”). This is done by validating both models against the surveyed flood levels. Finally, we describe the results of a model run with assumed drain blocked by solid waste (section “Impact of Solid Waste Blockage in Drain Channel”).
Drainage Data Quality and Completeness
Analysis of the accuracy of the relevant drainage data was performed by the authors, in addition to the quality assurance performed by Ramani Huria’s data cleaners. Positional errors (see Table 4) were found through visual inspection, and when building the flood model in SOBEK. These errors caused a disconnected network in the model and hence introduced simulation errors. The positional accuracy of the drainage data was assessed to be high, as only 12 out of 532 segments (i.e., 2.25%) had positional errors. The actions performed to correct positional errors in the 1D model are shown in Table 4.
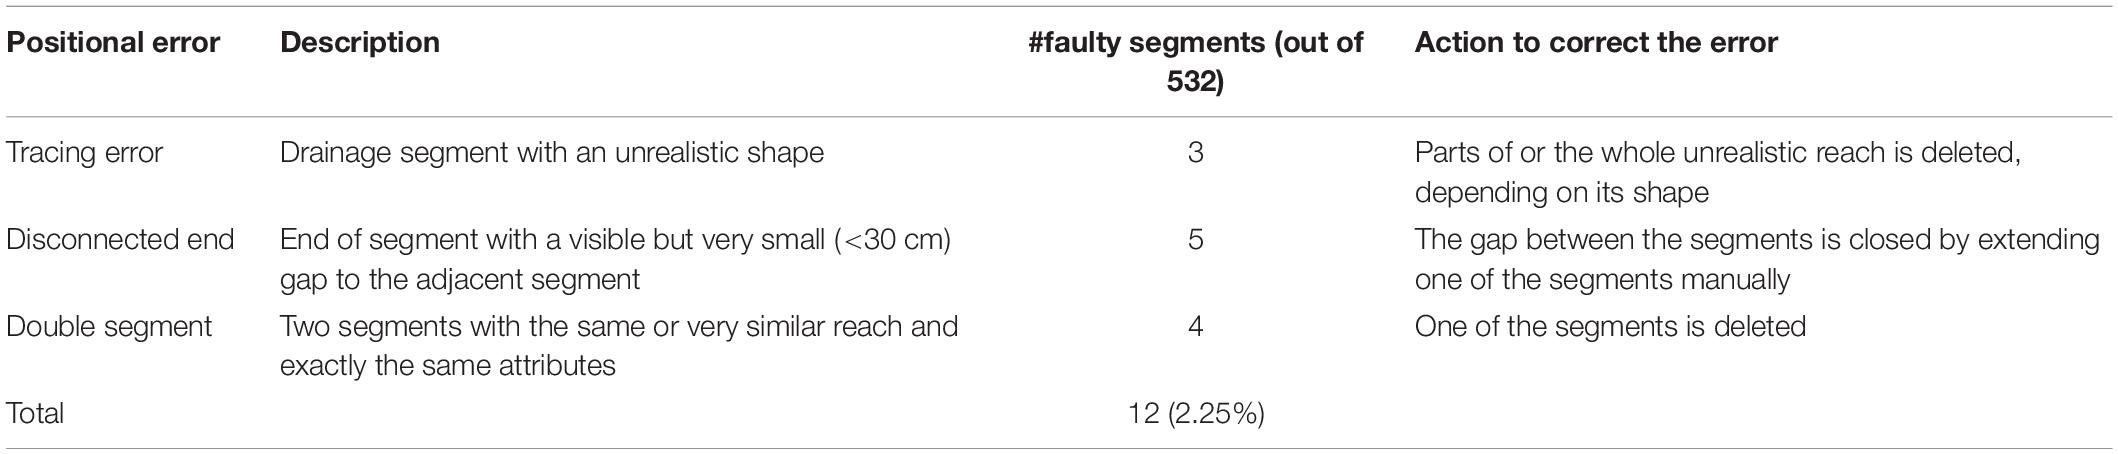
Table 4. Analysis of positional errors.
The connectivity of the network was analyzed in SOBEK, which revealed that 36 out of 532 segments, i.e., 6.8%, were disconnected from adjacent drainage segments. Upon further inspection in QGIS, it was found that this problem was caused by so-called “T-junctions.” A T-junction occurs when a side-branch connects to a main branch, while the main branch is recorded as a continuous geotrace. A connection from the side-branch to the main branch is not recognized automatically and the side-branch remains unconnected in the modeling software. This problem was solved manually by splitting the segments at T-junctions in QGIS. When all T-junctions were connected, the number of segments in the study area increased from 532 to 560 segments.
Data set completeness was studied with filters in the attribute table in QGIS, in addition to the automated completeness checks performed by Ramani Huria (see Table 5). There are 14 decommissioned drains in the study area, which have no dimensions recorded. Fieldwork showed that these drainage segments were ditches with considerable conveyance capacity that could not be neglected in the 1D schematization. Hence, the dimensions of these segments were measured in an extra mapping survey in the field. Apart from the decommissioned drains, only one segment in the study area was missing one feature, which likely was accidentally deleted in Ramani Huria’s data cleaning process. The decommissioned drains and most of the ditches were missing material data, constituting 5.3% of the total data set. The decommissioned drains were assigned a high roughness coefficient because of their vegetation observed during fieldwork. Three of the 17 ditches were reported as sand by Ramani Huria, and hence it was assumed that the remaining 14 ditches were also made of sand.
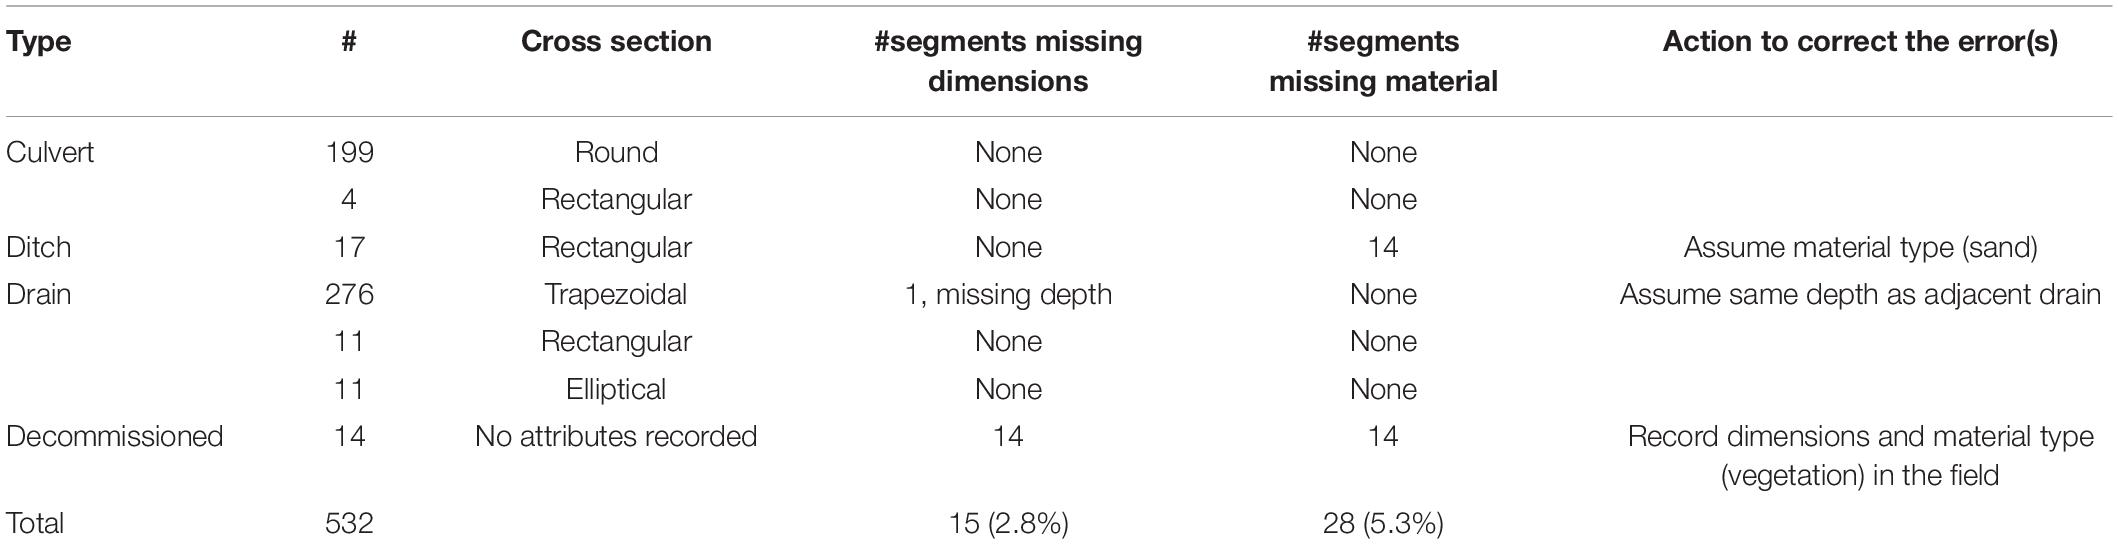
Table 5. Analysis of attribute completeness.
When inspecting side views of the drainage segments in SOBEK, it was noted that the bed levels in the network were irregular with elevation gaps between each segment. The upstream and downstream bed level of a segment is calculated by subtracting the measured vertical distance between the bottom and the nearest road from the DTM level. The drainage mappers measure this distance at the upstream end after they have recorded a geotrace, and the vertical distance is assumed to be constant along the whole segment. Given that bed level gaps were present at almost every connection in the dataset, this assumption introduces a systematic error in the bed level data. This was corrected by interpolating between upstream bed levels of neighboring drain segments, ensuring smooth bed level connections, representative of the real situation observed in the field.
Summarizing, the positional accuracy and completeness of the drainage data is very much in line with datasets collected with professional surveys. The sole exception is the altitude of drains, which are so far monitored with simple wooden poles, relative to the nearest road. These would benefit observations with precise absolute positioning referenced to a local geoid datum.
Model Results Without and With Community Mapped Drainage Data
The two models were created following the procedure described in section “Model Development.” Both models simulated the same storm event for which flood depth data were collected in a flood extent survey, as described in section “Data Acquisition.”
Figure 4 shows maximum water levels computed for the 2D scenario (upper left), at observation points covered by the flood extent survey, expressed in the same referencing system as used in the survey. Water levels are between 0 and 10 cm in most observation points (finger-ankle deep), up to a maximum of 30 cm (mid-shin deep). When the 1D drainage is introduced (upper right), computed maximum water levels decrease for most locations, from a few centimeters up to 23 cm decrease (not shown but investigated in the model results), especially in Mpakani “A” and Kijitonyama.
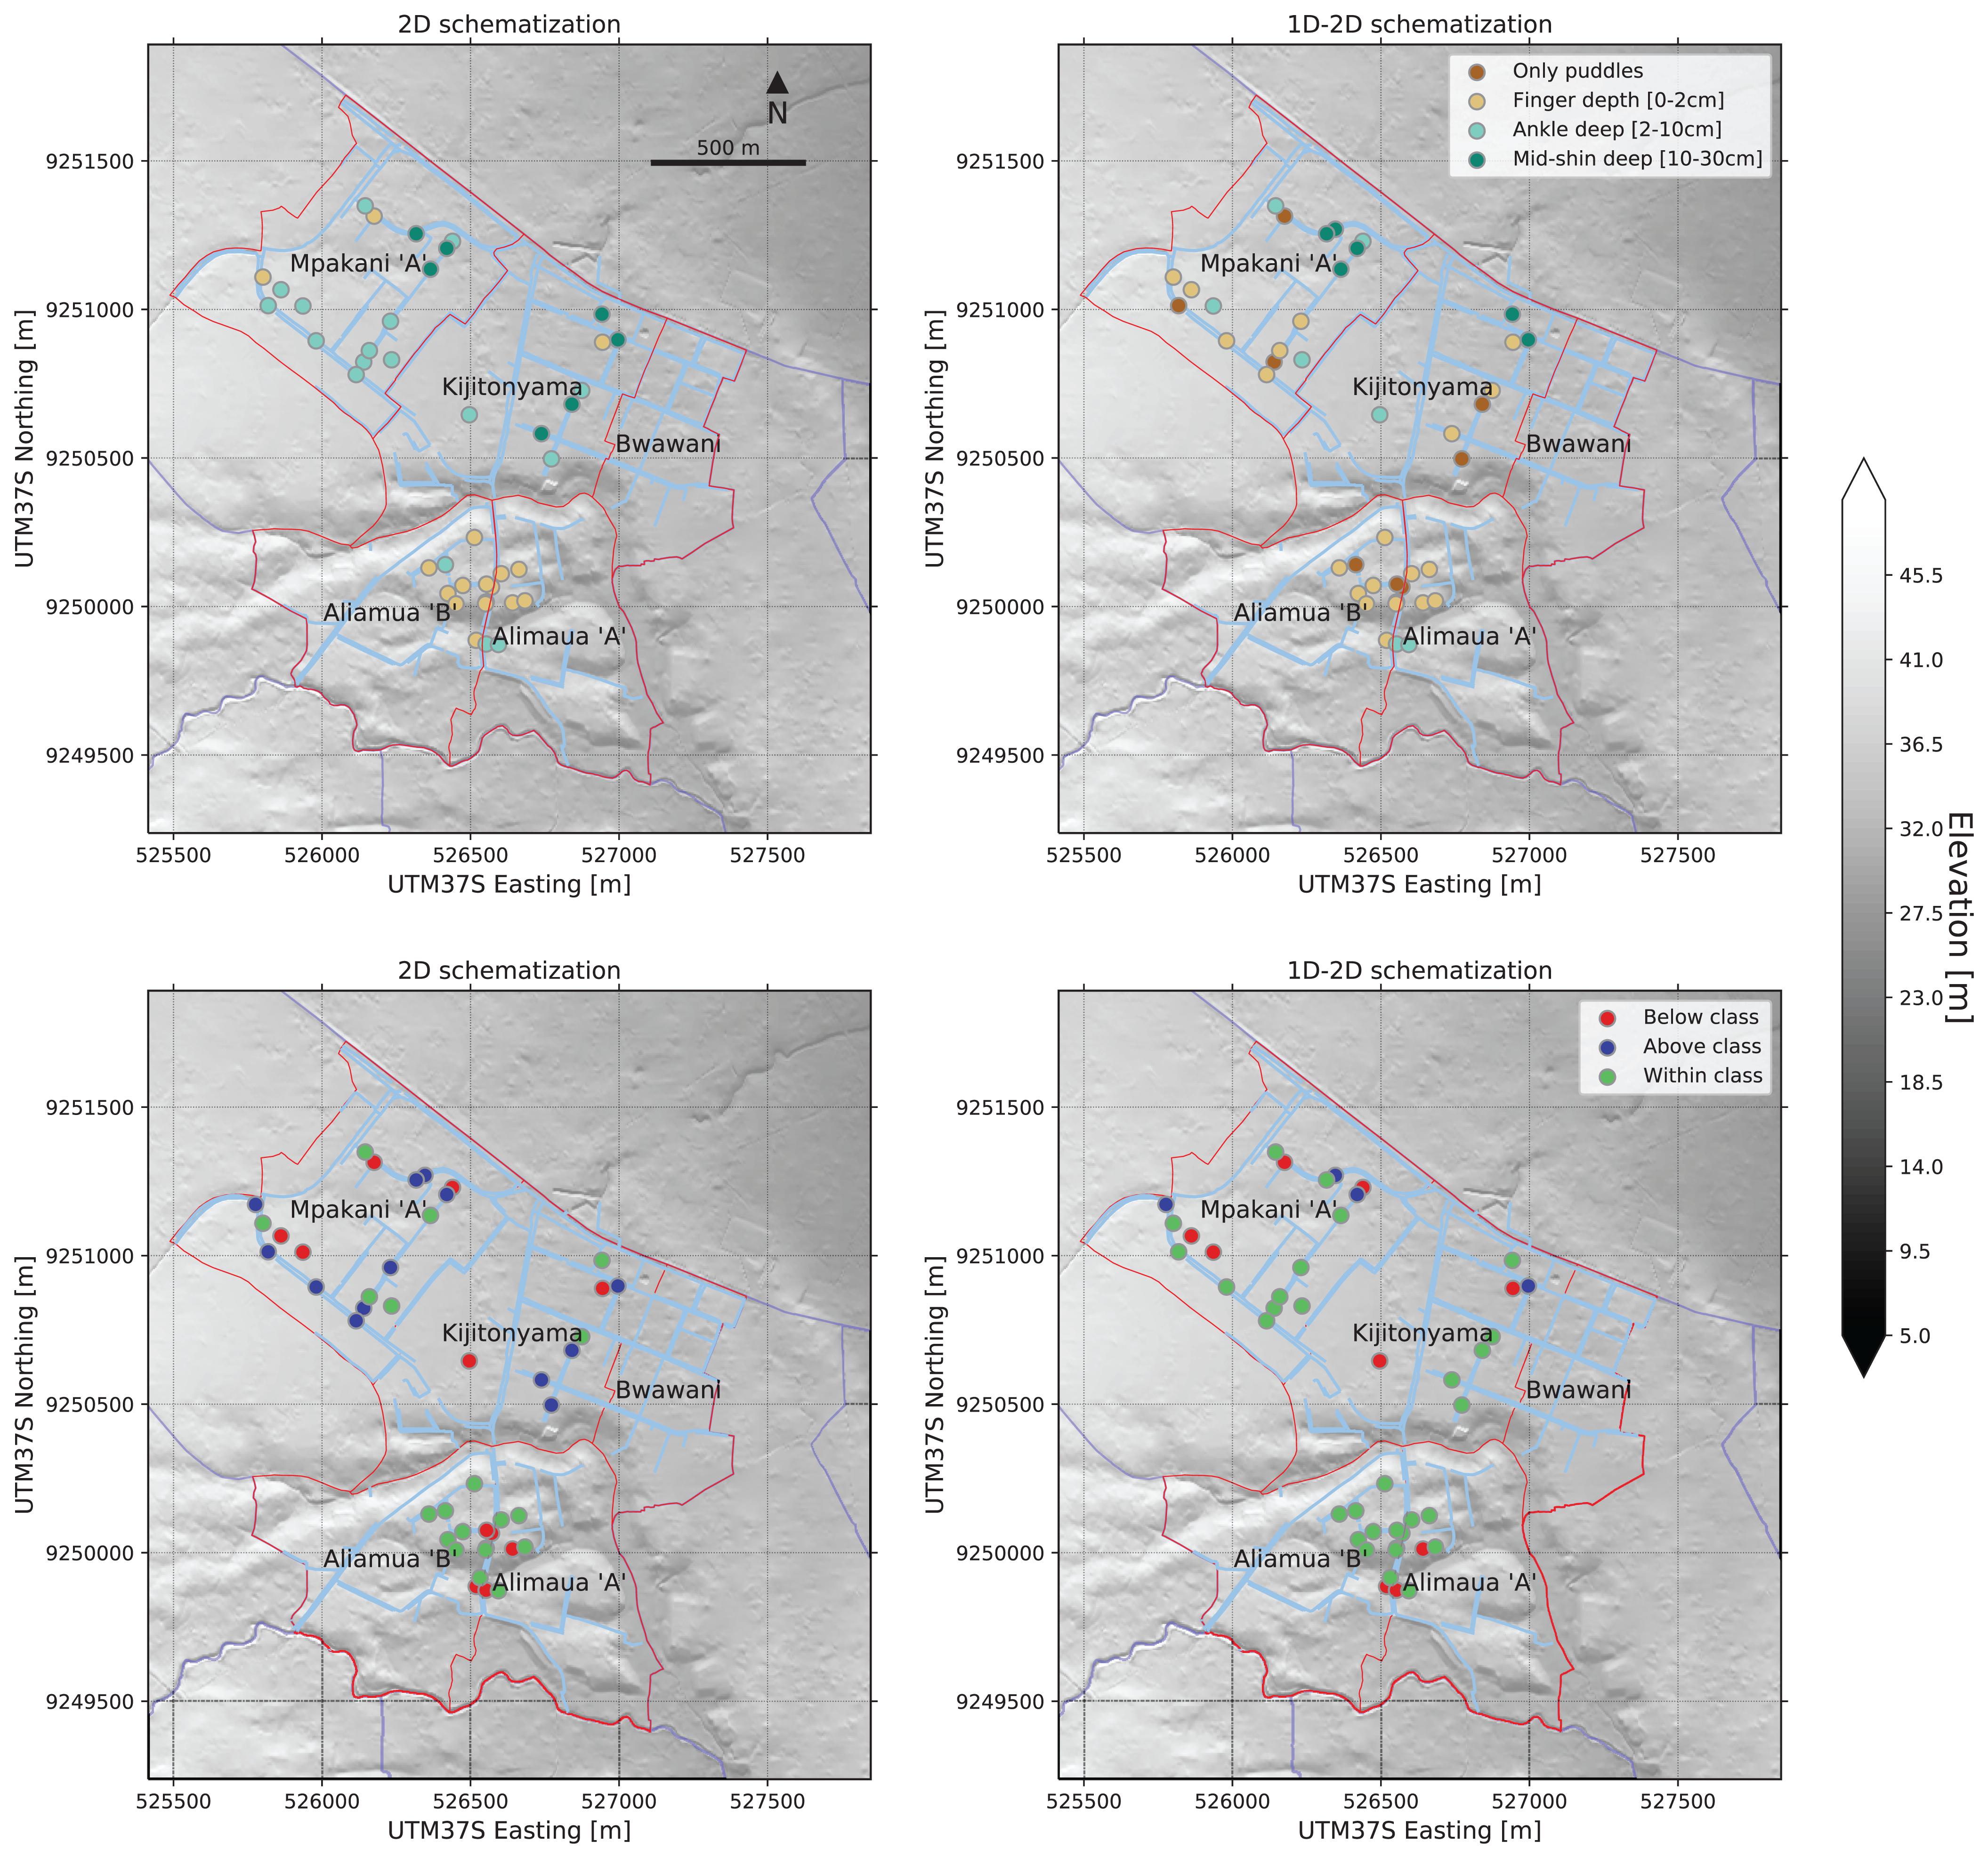
Figure 4. Model results without (left) and with (right) community mapped data.
The comparison of maximum computed water levels against flood classes reported in the flood extent survey shows that for the 2D schematization model, simulated water depths fall below reported class at 12 locations, within correct reported class at 19 locations, and above reported class at 13 locations (Figure 4, lower left). When introducing the 1D drainage network, i.e., using the 1D–2D model, simulated water depths fall in the correct reported class for 30 out of a total of 44 locations (lower right). Simulated water depths for the 1D–2D model are below reported class at 10 locations and above reported class at 4 locations (Figure 4 and Table 6). This is a considerable improvement.
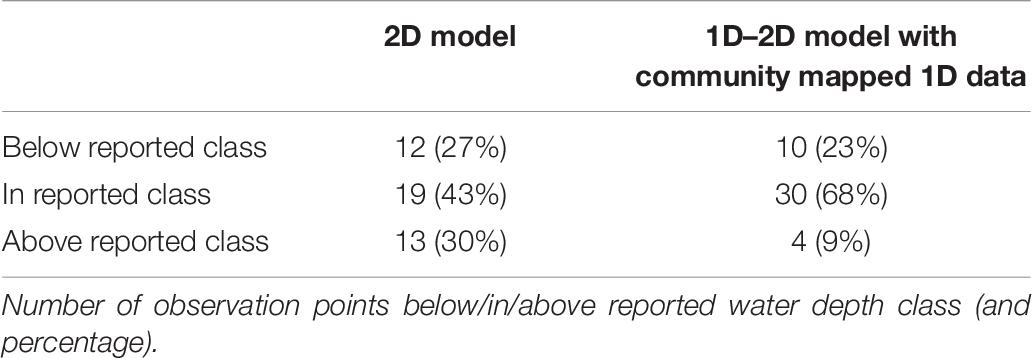
Table 6. Summary of model development results.
Differences in computed water levels are most apparent in Mpakani “A” and Kijitonyama, where the 2D-model tends to overestimate water levels corresponding to ankle and mid-shin deep flooding classes, where only puddles and finger-deep flooding was reported in the survey. These smaller water depths are better captured by the 1D–2D model (compare Figure 4, lower left and right figures). In Kijitonyama, water flows naturally toward a depression at the north boundary of the ward. However, since terrain gradients are very small, overland flows remain low and relatively high water depths are computed by the 2D model (see Figure 4, upper left). Introduction of the drainage channels in the 1D–2D model substantially improves performance in this ward. In Mpakani “A,” a natural streambed cuts through the northern part of the area, collecting a lot of flood water in both the 2D and 1D–2D models. In the southern part, away from the streambed, drainage channels convey the flow toward adjacent surface waters, as is correctly represented in the 1D–2D model.
Furthermore, in Alimaua, a central drainage channel collects most of the flood water and along this channel minor flooding is reported. This is generally well captured by both models, as the channel follows a natural depression that is represented in the 2D model. The 1D–2D model more correctly represents the dimensions of the channel, which resolves underestimated water levels at a couple of locations in the 2D model in Alimaua (see Figure 4, lower left and right).
These results demonstrate that using the 1D network, at this scale, is essential for accurate simulation of flood hazard. More importantly, the results obtained clearly show that the community flood survey is highly valuable when validating model results.
Impact of Solid Waste Blockage in Drain Channel
The simulation with the blocked drain segment due to solid waste accumulation clearly shows a different behavior of water levels in the drainage channel. Figure 5 shows the resulting differences in maximum flow and maximum water depth between the simulation with and without the blocked drain. As can be expected, when the flow through the drain is blocked, this is leading to a backwater effect in the drainage channel upstream of the blockage, which can be seen clearly on the right-hand side of Figure 5. This is further visualized in Figure 6 with a side view, comparing the maximum water levels of the two simulations in the drain upstream of the blocked drain. Due to the blockage, the drainage water overflows the drain segment, causing additional flooding on the streets. Figure 7 shows this additional flood extent caused by the blocked drain. The flood extent in this map is only shown where the flood depth is larger than 4 cm.
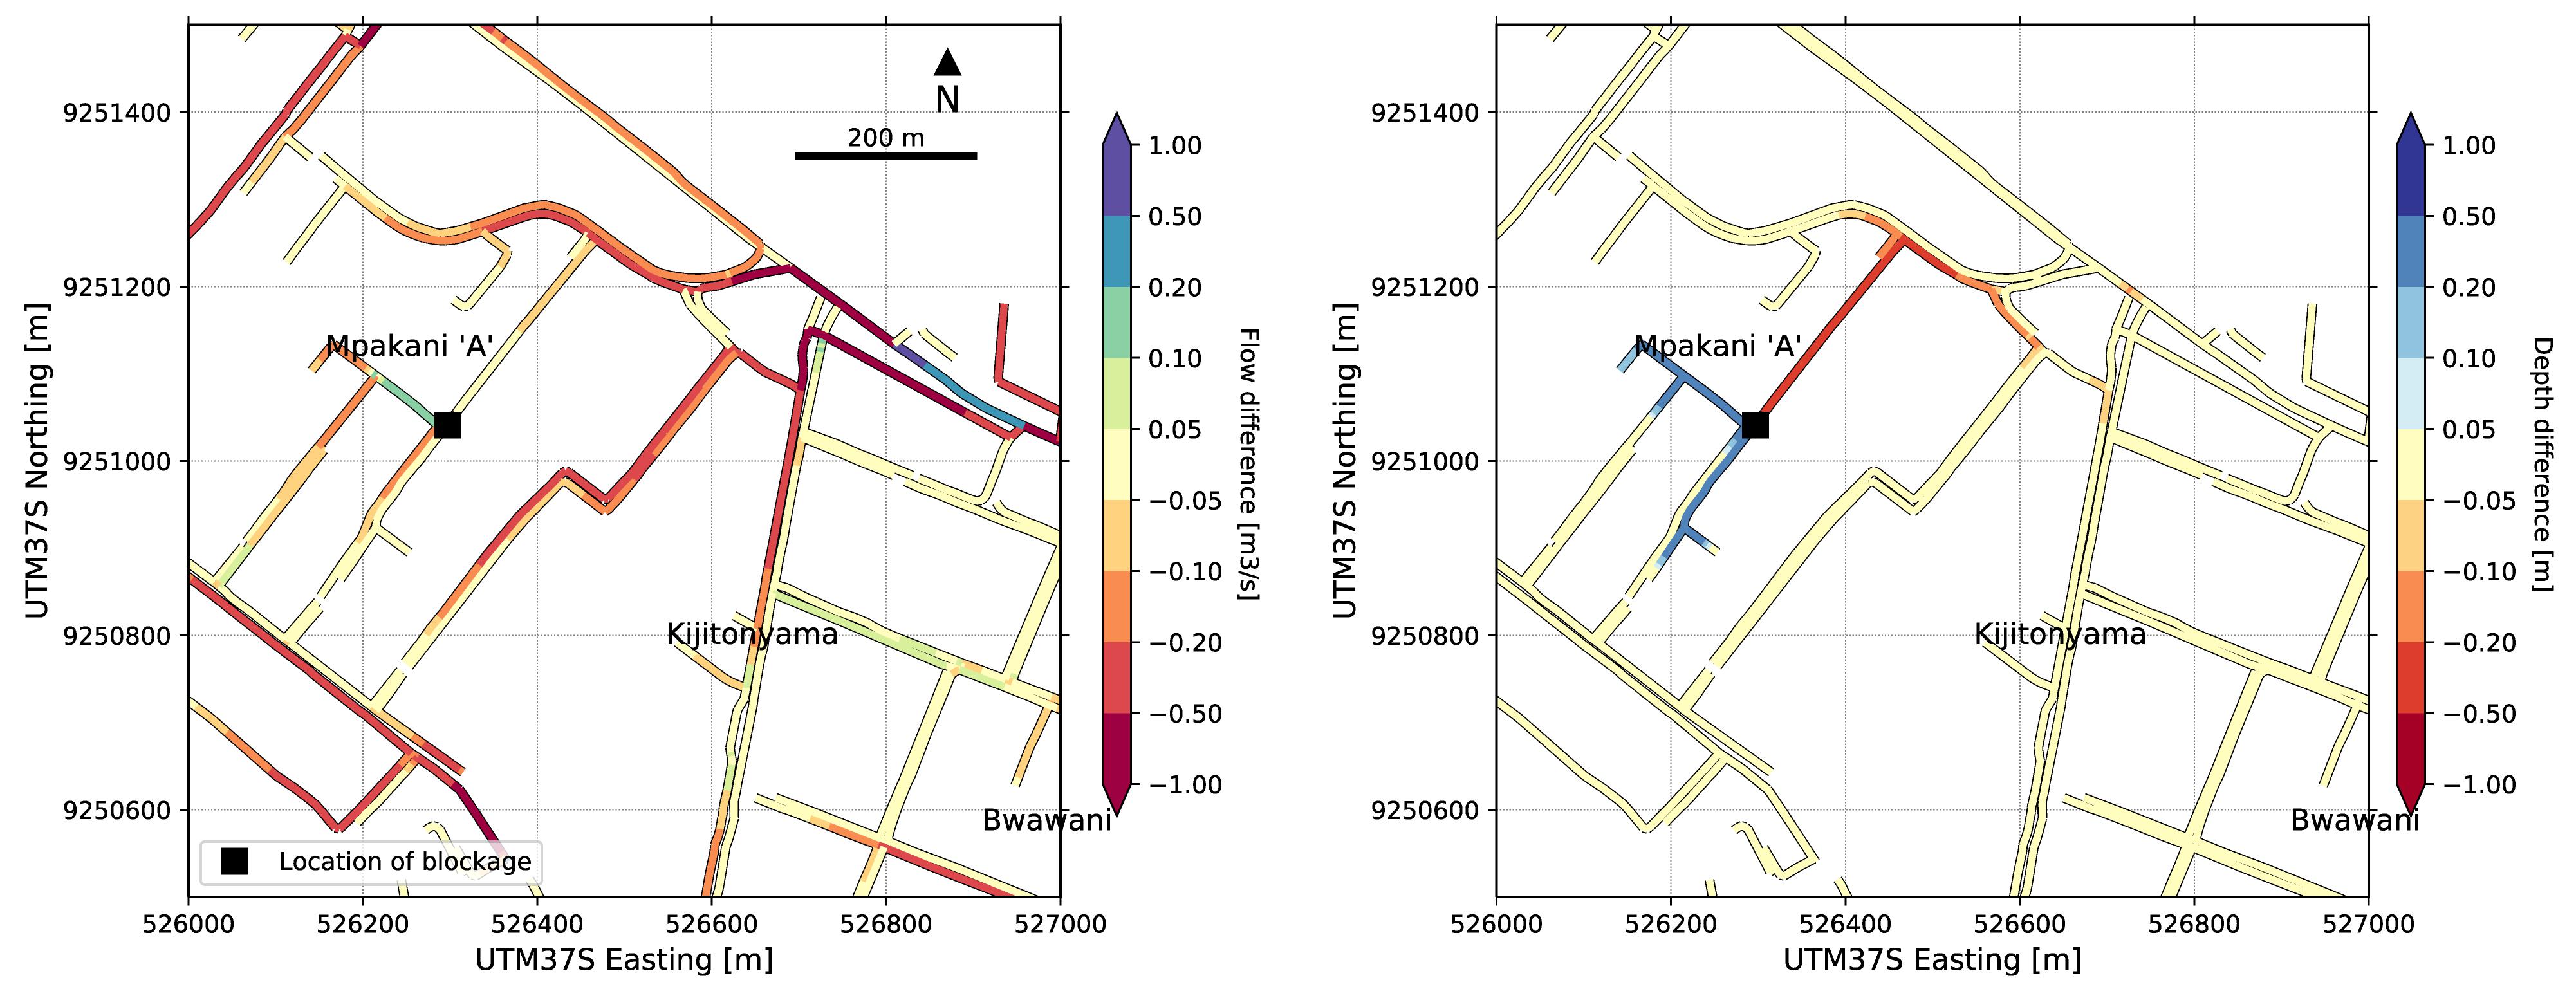
Figure 5. Flow difference and depth difference in drainage channels when blocking a drainage segment.
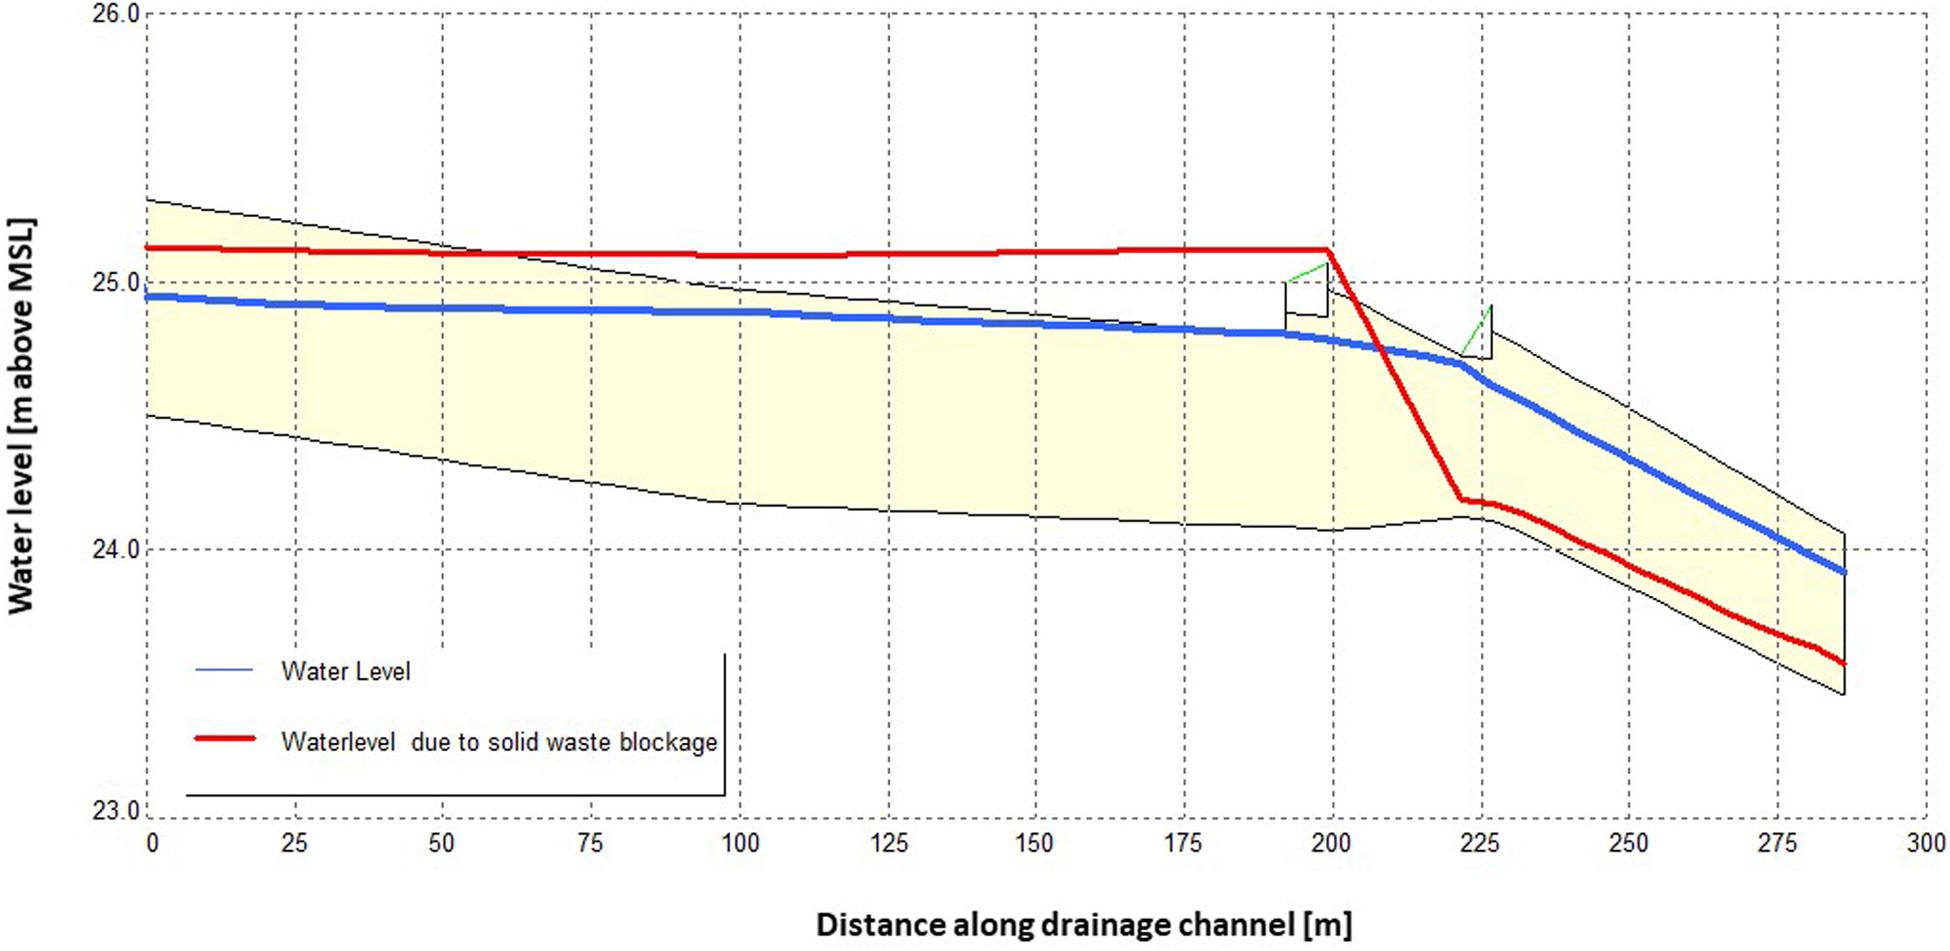
Figure 6. Side view in SOBEK of drainage segment blocked by solid waste (blockage at 225 m). The y-axis shows elevation above DTM datum, and the x-axis shows horizontal distance from the start of the selected side view.
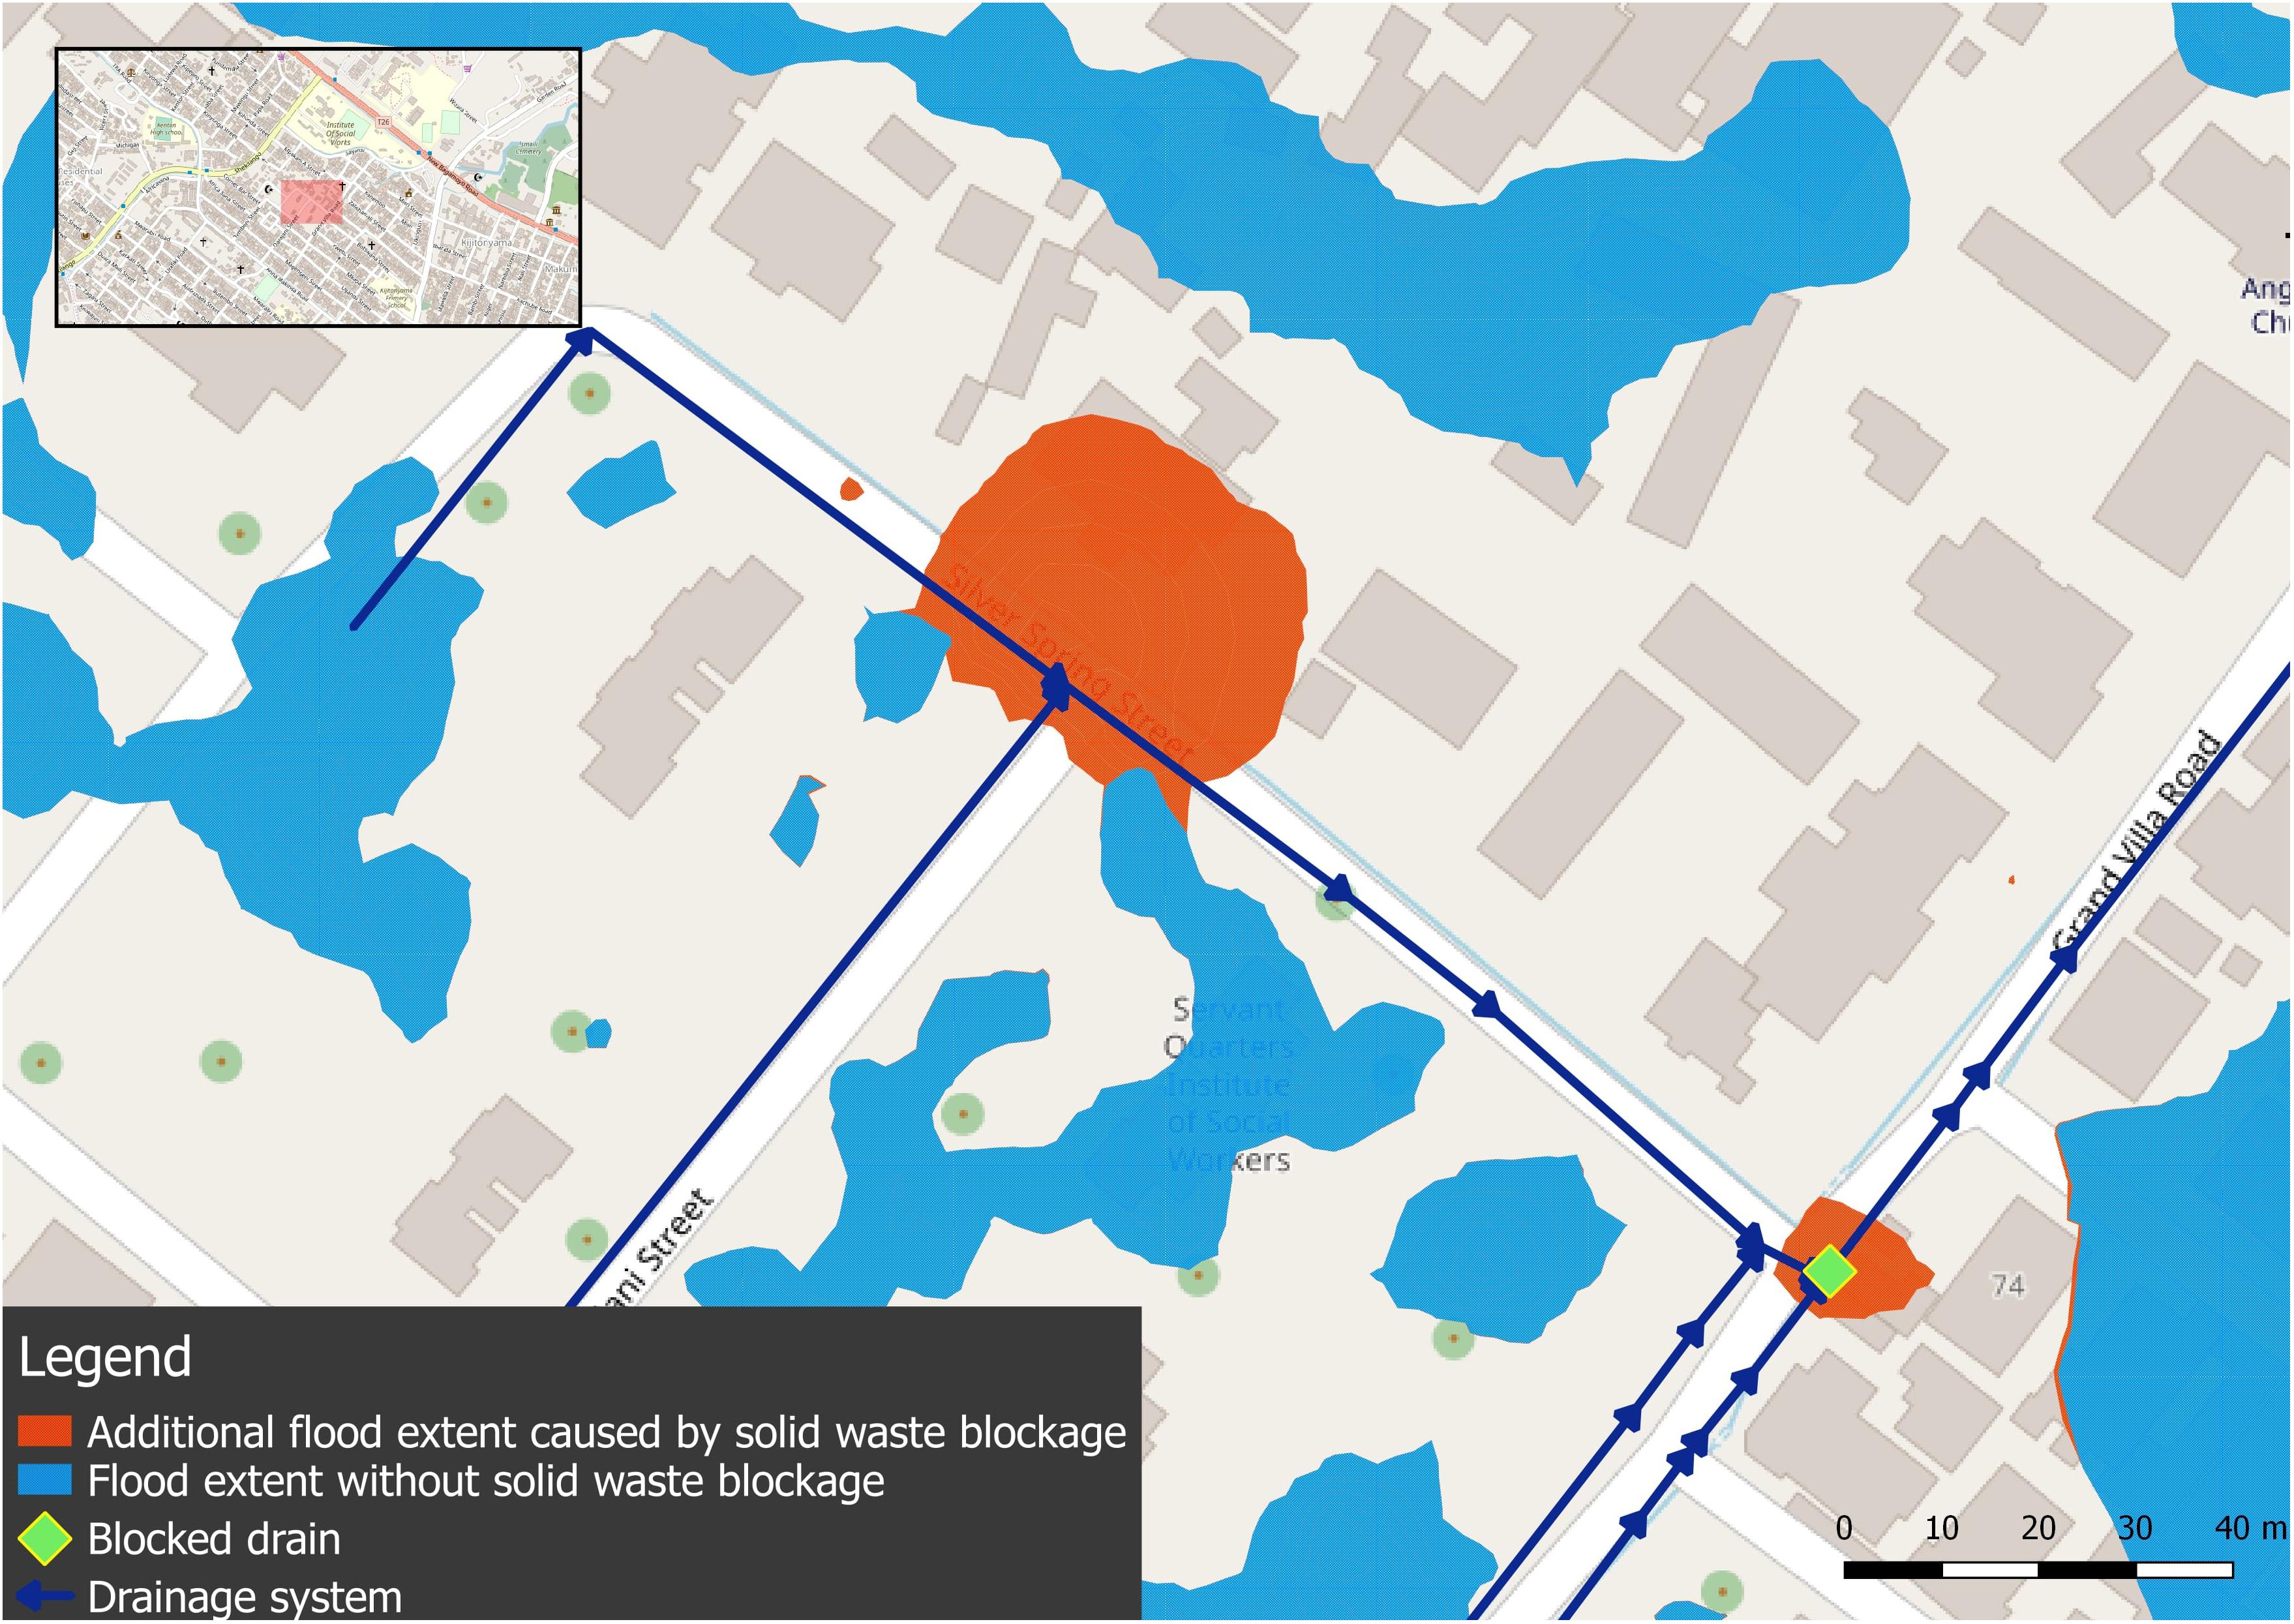
Figure 7. Additional surface flooding caused by blocked drainage channel.
These results demonstrate that drain blockages can be effectively simulated in the 1D–2D model. They also illustrate that differences introduced by the blockage are relatively small for this blockage scenario, which is explained by the looped nature of the drainage network. As Figure 2 shows, the main drains in the northern half of the drainage network connect outflow points to rivers and streams both on the northern as well as on the southern ends of the network. This implies that when a drain is blocked, especially in the center of the network, flows can be diverted through other parts of the network, making the system less sensitive to local drain blockage. This type of insight can only be obtained because of detailed information on the 1D drainage network obtained by the community mapping.
Discussion
This paper has proposed and applied a framework for flood modeling with community mapped data. A flood model has been developed and validated utilizing community mapped data as 1D schematization and validation.
The dataset of community mapped drainage achieved a high degree of completeness, with only 2.8 and 5.3% of all segments missing dimensions or information about the material, respectively. Positional errors, amounting to 2.25% of all drainage segments, were easily corrected in the model by connecting loose ends to the nearest node or deleting faulty segments. Connectivity errors amounted to 6.8% of relevant locations and were corrected manually. These errors occurred mainly when side-drains were connecting to a main drain and could be easily avoided in the future by introducing a step in the mapping procedure where ongoing main drains are split into suitable separate segments, to ensure full connectivity to the side branches when implementing the data in a modeling software.
The results of the model development show that community mapped data can indeed improve pluvial flood predictions at neighborhood scale. Using community mapped drainage data to build a detailed schematization of the 1D drainage network increases the model prediction accuracy, from 43 to 68%, measured as percentage of simulated flood depth points that match the reported validation class. Highest benefits are obtained in areas where conveyance capacity and direction of the drainage networks differ substantially from the natural flow paths created by elevation differences of the natural terrain. This applies in particular in areas with small natural terrain gradients, where 1D channel networks induce faster and more concentrated drainage flows, and in areas where street pattern layout differs substantially from natural terrain gradients, as with the rectangular street lay-out in some of the sub-wards in the study area.
Furthermore, the community mapped drainage data makes the model much more versatile in its possible applications. This is because of the 1D schematization which enables simulations where network configuration changes or channel capacities are impacted by maintenance-state. An example of such a model application has been presented here, investigating the impact of solid waste blockages on network flow and flooding. These results demonstrate that community mapping has moved from a disaster response practice (Zook et al., 2010) to serve as reliable and affordable way to support proactivity and planning in data-scarce environments.
The developed model is subject to uncertainties associated with the positional accuracy of the drainage segments, as it has been recorded with GPS units (smartphones) with an accuracy of around 5 meters. These errors have, however, been accounted for to some extent in Ramani Huria’s data cleaning process where the drainage geotraces were compared with aerial imagery. The highest uncertainties in the community mapped drainage dataset were found for drain level measurements. Bed levels of drains were measured using simple wooden poles, and altitude was estimated relative to the nearest road. This introduced substantial uncertainties in the data. Bed and bank level measurements of drains would benefit from observations with precise (absolute) positioning referenced to a local geoid datum. There is a need to continue investigating low-cost alternatives that allow for accurate elevation measurements. The advent of new low-cost chipsets for multi-frequency Global Navigation Satellite System’s positioning, and the first endeavors of smartphone producers to embed these in smartphone models, may also address this soon. These chipsets are currently under investigation for use in community mapping contexts (van Dongen, 2019).
Validation data, obtained in a flood extent survey involving 44 community member’s reporting on flood depths a few hours after the simulated rainfall event, proved to be valuable to validate flood modeling results. Earlier studies have shown that community observations provide a valuable source of information for flood risk analysis (Paul et al., 2018; Etter et al., 2019; Strobl et al., 2019). Even if the amount of data collected through flood surveys is small and the uncertainty of the flood depth classes cannot be quantified, the data still provides an effective form of validation. The reporting classes used give an indication of the flood depth at each observation point in the absence of any other validation data set for the study area. Reporting flood depth in terms of flood depth categories associated with a “person’s height reference system,” i.e., referring to the estimated flood depth as e.g., ankle deep or knee deep, provided a workable trade-off between reliability in terms of what citizen observations can distinguish and accuracy needed for model validation. Further investigation to optimize the selected thresholds for validation classes is recommended, to identify how accurately observations according to this reference system can represent reality. If implemented systematically, community-based flood extent surveys can allow for model validation at low costs and build trust in the model predictions. As more web- and mobile-based flood reporting systems are being developed, community-based flood observations will become more and more easy to implement (Seibert et al., 2019).
The case study shows a discrepancy between our hypothesized framework and Ramani Huria. Our proposed framework relies on the principles of community mapping in industrially developing countries found in literature (Iliffe, 2017). These principles assume that the mapping process is firmly anchored with the leaders and residents of a certain location, and that the same people are participating in all parts of the mapping process (Parker, 2006). However, Ramani Huria has trained teams since 2017 to conduct specialized types of mapping independent of where the mappers live. The results of the mapping campaign are not shared with the same people that initiated it, as the mapping is carried out over a long period of time, during which the politically elected ward- and subward officers often have been replaced. This indicates that there are challenges with keeping large-scale mapping projects anchored in the community that is being mapped. However, the authors do not see a contradiction between the proposed framework and the utilization of trained mapping teams.
Literature suggests that the authority of community mapped data springs from the fact that it is collected by the community for the community (Flanagin and Metzger, 2008; Iliffe, 2017), which makes it important to start and end the mapping process with community forums. All data sets identified by the community do not, however, need to be collected by the community itself. The case study shows that the data acquisition of community mapping projects differs depending on the characteristics of the data set that is being mapped. Data sets that are relatively easy to collect and require a high number of records to ensure data quality, like flood extent surveys, can be collected by community members, whereas more technically advanced features like drainage dimensions should be mapped by trained teams. It should be noted, however, that trained mappers increase the costs of the mapping process. Still, they are using inexpensive tools that are far less costly than traditional data acquisition technologies.
The urban landscape is changing rapidly across the world, which implies that urban spatial data needs to be updated with high frequency. VGI and community mapping could serve as an affordable way to overcome this, but an incentive must be developed to keep open source spatial data sets up to date. This requires, on the one hand, clear end users, who see value in updated, open source data and simulation models derived from this data. On the other hand, it requires an entity such as a company who has a proposition to fulfill that service. As shown, there is a voluntary component in community mapping projects to successfully support flood modeling, as it allows for collection of validation data sets that require a high number and density of data points to be reliable. However, it is shown that volunteers alone do not guarantee the required data quality of technical features like drainage segments. Instead, the main added value of VGI to urban flood risk management in data-scarce environments is the open source tools that are now available to collect technical features with high accuracy in an affordable, comprehensible, and quality-assured way.
Conclusion
This paper presented a new framework for developing flood models by using community mapped data. The framework was demonstrated and validated on a case study of the Ramani Huria community mapping project in Dar es Salaam.
The results obtained show that:
1. The proposed framework for flood modeling with community mapped data allows for comprehensive modeling in a data-scare context. The framework comprised three principal phases; data acquisition, model development and model implementation, where the data acquisition should be affordable, comprehensible, quality assured and open source to be applicable in resource-strained environments. This framework is generic and flexible in nature, as it allows for different types of community mapped data to be collected and applied. Consequently, it is suggested for future research to apply this framework to other case studies to investigate its validity and robustness.
2. Community mapped data can improve flood modeling on a level of detail that is currently inaccessible in many data-scarce environments. The outputs of the developed model correspond better with validation data when introducing drainage data from a community mapping project as 1D schematization, compared to a scenario run with only terrain data. Moreover, using community mapped data results in a more versatile model being developed.
3. Highest benefits of community-mapped data of the 1D-network are obtained in areas where conveyance capacity and direction of the drainage networks differ substantially from the natural flow paths created by elevation differences of the natural terrain. This applies in particular in areas with small natural terrain gradients, where 1D channel networks induce faster and more concentrated drainage flows and storage, and in areas where street pattern lay-out differs substantially from natural terrain gradients, as with the rectangular street lay-out in some of the sub-wards in the study area. Additionally, 1D-network data is essential in areas where blockage of drainage channels is an issue and need investigation for flood risk management.
4. The community mapping approach is especially appropriate for datasets that do not require extensive training, such as flood extent surveys where it is possible to cross-validate the quality of reports given the high number and density of data points. More technically advanced features, such as collecting dimensions of urban drainage systems (e.g., bed levels), require trained mappers to create data of sufficient quality. Our analysis shows that it is possible to achieve this quality through smartphones with accurate GPS receivers, open source servers, training of students and clever survey designs. These components form a promising framework for reliable flood modeling with community mapped data.
Future research is suggested to explore how community mapping can become an institutionalized practice to fill gaps in data-scarce environments by addressing incentives for participation and sustainability to keep community mapped data up to date. Furthermore, the authors invite a discussion on liability issues of open source data sets, which is expected to arise when open data is increasingly applied in governance.
Data Availability Statement
The datasets generated for this study are available on request to the corresponding author.
Author Contributions
LP and IM conducted the literature review for the framework development. HW established the survey design for the drainage data collection. IM supervised the drainage data collection. LP conducted the additional field data collection and performed the drainage data quality analysis. LP and GV performed the model development and validation. LP, HW, and M-CV conducted and reported the data and results analysis. All authors were involved in the writing and editing of this manuscript.
Funding
LP was financially supported by Lamminga Fund to perform field work for this research. The Ramani Huria community mapping project is funded by Department for International Development, United Kingdom.
Conflict of Interest
The authors declare that the research was conducted in the absence of any commercial or financial relationships that could be construed as a potential conflict of interest.
Acknowledgments
The authors would like to thank the staff and students at Humanitarian OpenStreetMap Team Tanzania for their kind support to this research.
Footnotes
- ^ www.openstreetmap.org
- ^ https://geonode.resilienceacademy.ac.tz/layers/geonode_data:geonode:dar_es_salaam_drain_segments, accessed May 14, 2020.
- ^ https://wiki.openstreetmap.org/wiki/Dar_es_Salaam/Ramani_Huria#Drainage, accessed 23 January 2020.
- ^ https://github.com/openearth/hydro-osm
- ^ https://www.deltares.nl/en/software/sobek/
- ^ https://tahmo.org/
- ^ https://geonode.resilienceacademy.ac.tz/layers/geonode:cowi_dar_/metadata_detail
References
Antoniou, V., and Skopeliti, A. (2015). Measures and indicators of VGI quality: an overview. ISPRS Ann. Photogr. Remote Sens. Spatial Inform. Sci. 2, 345–351. doi: 10.5194/isprsannals-II-3-W5-345-2015
Bach, P. M., Rauch, W., Mikkelsen, P. S., McCarthy, D. T., and Deletic, A. (2014). A critical review of integrated urban water modelling - Urban drainage and beyond. Environ. Model. Softw. 54, 88–107. doi: 10.1016/j.envsoft.2013.12.018
Brady, H. E., Verba, S., and Schlozman, K. L. (1995). Beyond SES: a resource model of political participation. Am. Political Sci. Rev. 89, 271–294. doi: 10.2307/2082425
Butler, D., Digman, C. J., Makropoulos, C., and Davies, J. W. (2018). Urban Drainage. Boca Raton, FL: CRC Press.
Buytaert, W., Zulkafli, Z., Grainger, S., Acosta, L., Alemie, T. C., Bastiaensen, J., et al. (2014). Citizen science in hydrology and water resources: opportunities for knowledge generation, ecosystem service management, and sustainable development. Front. Earth Sci. 2:26. doi: 10.3389/feart.2014.00026
Chow, V. T., Maidment, D. R., and Mays, L. W. (1988). Applied Hydrology. New York, NY: Mc Graw-Hill, Inc.
Coleman, D., Georgiadou, Y., and Labonte, J. (2009). Volunteered geographic information: the nature and motivation of producers. Int. J. Spatial Data Infrastr. Res. 4, 332–358.
Davids, J. C., Rutten, M. M., Pandey, A., Devkota, N., Oyen, W. D., Prajapati, R., et al. (2018). Citizen science flow - an assessment of citizen science streamflow measurement methods. Hydrol. Earth Syst. Sci. Discuss. 23, 1045–1065. doi: 10.5194/hess-23-1045-2019
Deletic, A., Dotto, C. B., McCarthy, D. T., Kleidorfer, M., Freni, G., Mannina, G., et al. (2012). Assessing uncertainties in urban drainage models. Phys. Chem. Earth Parts ABC 42, 3–10. doi: 10.1016/j.pce.2011.04.007
Etter, S., Strobl, B., Seibert, J., and Meerveld, I. V. (2019). Value of crowd-based water level class observations for hydrological model calibration. Water Resour. Res. 56:e2019WR026108.
Flanagin, A. J., and Metzger, M. J. (2008). The credibility of volunteered geographic information. GeoJournal 72, 137–148. doi: 10.1007/s10708-008-9188-y
Fritz, S., See, L., and Brovelli, M. (2017). “Motivating and sustaining participation in VGI,” in Mapping and the Citizen Sensor, eds G. Foody, L. See, S. Fritz, P. Mooney, A.-M. Olteanu-Raimond, C. C. Fonte, et al. (London: Ubiquity press), 93–117. doi: 10.5334/bbf.e
Girres, J.-F., and Touya, G. (2010). Quality assessment of the french openstreetmap dataset. Trans. GIS 14, 435–459. doi: 10.1111/j.1467-9671.2010.01203.x
Goodchild, M. F. (2007). Citizens as sensors: the world of volunteered geography. GeoJournal 69, 211–221. doi: 10.1007/s10708-007-9111-y
Goodchild, M. F., and Li, L. (2012). Assuring the quality of volunteered geographic information. Spatial Stat. 1, 110–120. doi: 10.1016/J.SPASTA.2012
Haklay, M. (2010). How good is volunteered geographical information? A Comparative study of OpenStreetMap and ordnance survey datasets. Environ. Plan. B Plann. Design 37, 682–703. doi: 10.1068/b35097
Haklay, M. (2013). “Citizen science and volunteered geographic information: overview and typology of participation,” in Crowdsourcing Geographic Knowledge, eds D. Z. Sui, S. Elwood, and M. F. Goodchild (Dordrecht: Springer Netherlands), 105–122. doi: 10.1007/978-94-007-4587-2_7
Iliffe, M. P. (2017). The Praxis of Community Mapping in Developing Countries. Doctoral dissertation, University of Nottingham, Nottingham.
Neis, P., Zielstra, D., and Zipf, A. (2011). The street network evolution of crowdsourced maps: OpenStreetMap in Germany 2007–2011. Future Internet 4, 1–21. doi: 10.3390/fi4010001
Ozdemir, H., Sampson, C. C., Almeida, G. A., and Bates, P. D. (2013). Evaluating scale and roughness effects in urban flood modelling using terrestrial LIDAR data. Hydrol. Earth Syst. Sci. 17, 4015–4030. doi: 10.5194/hess-17-4015-2013
Parker, B. (2006). Constructing community through maps? Power and praxis in community mapping. Prof. Geogr. 58, 470–484. doi: 10.1111/j.1467-9272.2006.00583.x
Paul, J. D., Buytaert, W., Allen, S., Ballesteros-Cánovas, J. A., Bhusal, J., Cieslik, K., et al. (2018). Citizen science for hydrological risk reduction and resilience building. Wiley Interdiscip. Rev. Water 5:e1262. doi: 10.1002/wat2.1262
Ramm, F., Topf, J., and Chilton, S. (2011). OpenStreetMap - Using and Enhancing the Free Map of the World. Cambridge: UIT Cambridge Ltd.
Schumann, G. J.-P., and Bates, P. D. (2018). The need for a high-accuracy. open-access global DEM. Front. Earth Sci. 6:225. doi: 10.3389/feart.2018.00225
Seibert, J., Strobl, B., Etter, S., Hummer, P., and Meerveld, H. J. (2019). Virtual staff gauges for crowd-based stream level observations. Front. Earth Sci. 7:70. doi: 10.3389/feart.2019.00070
Senaratne, H., Mobasheri, A., Ali, A. L., Capineri, C., and Haklay, M. (2017). A review of volunteered geographic information quality assessment methods. Int. J./ Geogr. Inform. Sci. 31, 139–167. doi: 10.1080/13658816.2016.1189556
Soden, R., and Palen, L. (2014). “From crowdsourced mapping to community mapping: the postearthquake work of openstreetmap Haiti. COOP 2014 -,” in Proceedings of the 11th International Conference on the Design of Cooperative Systems, Nice: Springer International Publishing, 311–326. doi: 10.1007/978-3-319-06498-7_19
Strobl, B., Etter, S., Meerveld, I. V., and Seibert, J. (2019). Accuracy of crowdsourced streamflow and stream level class estimates. Hydrol. Sci. J. 65, 823–841. doi: 10.1080/02626667.2019.1578966
ten Veldhuis, M.-C., Clemens, F. H., and Gelder, P. H. (2011). quantitative fault tree analysis for urban water infrastructure flooding. Struct. Infrastruct. Eng. 7, 809–821. doi: 10.1080/15732470902985876
UN-HABITAT (2010). Informal Settlements and Finance In Dar es Salaam, Tanzania. Nairobi: UN-HABITAT.
United Nations (2018). World Urbanization Prospect: The 2018 Revision - Key Facts. New York, NY: United Nations.
van Dongen, K. (2019). Community Mapped Elevation Through a Low-cost, Dual-Frequency GNSS Receiver: A Performance Study in Delft (the Netherlands) and Dar es Salaam (Tanzania). Master Thesis, Delft University of Technology, Delft.
Winsemius, H. C., Jongman, B., Veldkamp, T. I., Hallegatte, S., Bangalore, M., and Ward, P. J. (2018). Disaster risk, climate change, and poverty: assessing the global exposure of poor people to floods and droughts. Environ. Dev. Econ. 2, 1–21. doi: 10.1017/S1355770X17000444
Winsemius, H. C., Ward, P. J., Gayton, I., Veldhuis, M.-C. T., Meijer, D. H., and Iliffe, M. (2019). Commentary: the need for a high-accuracy, open-access global DEM. Front. Earth Sci. 7:33. doi: 10.3389/feart.2019.00033
Keywords: community mapping, volunteered geographic information, flood resilience, citizen observations, urban flood risk, drain blockage, asset management
Citation: Petersson L, ten Veldhuis M-C, Verhoeven G, Kapelan Z, Maholi I and Winsemius HC (2020) Community Mapping Supports Comprehensive Urban Flood Modeling for Flood Risk Management in a Data-Scarce Environment. Front. Earth Sci. 8:304. doi: 10.3389/feart.2020.00304
Received: 06 March 2020; Accepted: 29 June 2020;
Published: 21 July 2020.
Edited by:
Jingming Hou, Xi’an University of Technology, ChinaReviewed by:
Guy Jean-Pierre Schumann, University of Bristol, United KingdomTim van Emmerik, Wageningen University and Research, Netherlands
Copyright © 2020 Petersson, ten Veldhuis, Verhoeven, Kapelan, Maholi and Winsemius. This is an open-access article distributed under the terms of the Creative Commons Attribution License (CC BY). The use, distribution or reproduction in other forums is permitted, provided the original author(s) and the copyright owner(s) are credited and that the original publication in this journal is cited, in accordance with accepted academic practice. No use, distribution or reproduction is permitted which does not comply with these terms.
*Correspondence: Louise Petersson, bG91aXNlLnBldGVyc3NvbjkwQGdtYWlsLmNvbQ==