 Xinxin Bi
 Guanghua Chen4*
- 1Key Laboratory of Meteorological Disaster Ministry of Education, Nanjing University of Information Science and Technology, Nanjing, China
- 2Joint International Research Laboratory of Climate and Environmental Change, Nanjing University of Information Science and Technology, Nanjing, China
- 3Collaborative Innovation Center on Forecast and Evaluation of Meteorological Disasters, Nanjing University of Information Science and Technology, Nanjing, China
- 4Center for Monsoon System Research, Institute of Atmospheric Physics, Chinese Academy of Sciences, Beijing, China
- 5University of Chinese Academy of Sciences, Beijing, China
This study investigates the potential impacts of multi-timescale atmospheric modes on tropical cyclone (TC) abrupt track turnings over the western North Pacific during the period of 2000–2019. The composite large-scale environmental flow patterns of the sudden right-turning (SRT) and left-turning (SLT) TCs show that the SRT process is generally accompanied by the continuous deepening westerly trough, the weakening and eastward retreat of subtropical high favoring the strengthening of the asymmetric southwesterly around TC center, while the SLT cases are mainly steered by the stronger easterlies to the north which are attributed to the increased pressure meridional gradient. Furthermore, the TCs with sudden track changes are divided into 5 categories according to the quantitative contribution of wave modes. The composite analyses indicate that: (1) The synoptic-scale wave poses influence on most of the SRT cases through a southeast-northwest-oriented wave train to the northeast of the TC, inducing the prominent southerly flows in the vicinity of TC center. (2) The intra-seasonal oscillation (ISO) pattern for the SRT cases is characterized by a southeast-northwest-oriented circulation dipole, and the TCs embedded between the two dipole components are impacted by the strengthened southwesterly anomalies. In contrast, the SLT events are located in the northwest of a zonally-elongated cyclonic ISO circulation, which enhances the northeasterly flows for the sharply left turning. (3) The SRT cases dominated by the basic background flow are situated in the western flank of a broad anticyclonic circulation and subject to the northward steering flow anomalies, while for the SLT cases, the left track turning is mainly induced by the uniform easterly trade winds at the lower latitudes.
Introduction
The accuracy of track forecast for tropical cyclone (TC) over the western North Pacific (WNP) has been significantly improved in recent years, especially since 2010. However, due to the complexity of influence mechanisms, as well as the existing fluctuation at lead time of 72 h and beyond, there is still great difficulty in operational prediction, ensemble forecast, and numerical simulation for TCs with abrupt track changes (Rappaport et al., 2009; Magnusson et al., 2019).
Previous studies have shown that the unusual TC tracks over the tropical WNP can be frequently observed. TC track characteristics are partly dependent on different large-scale systems, such as the subtropical high (SH), the monsoon trough and the nearby TC. The anomalous easterly winds on the south of the strong SH are conducive to a westward TC track, while the anomalous westerly winds may be favorable for a recurving track when the monsoon trough is anomalously strong and the SH is anomalously weak (Carr and Elsberry, 1995; Harr and Elsberry, 1995; Hsu et al., 2008). Moreover, Lander (1996) detected that TCs tend to move northwestward when the axis of the monsoon trough is oriented along the climatological NW–SE direction. Otherwise, TCs prefer to move northward within the roughly reversely-oriented (SW–NE) monsoon trough. TC sudden track changes are also related to the adjustment of large-scale circulation, such as the advance and retreat of the SH and mid-latitude westerly trough. Wu et al. (2009) defined a parameter of adjoint-derived sensitivity steering vector and pointed out that typhoon Shanshan (2006) recurved abruptly under the influence of the steering flow of the mid-latitude westerly trough. In addition, the Rossby wave energy dispersion of a TC would generate an anticyclone to its southeast side. Luo et al. (2011) indicated that the combined effect of the anticyclone and the SH will make TC track deflect northward. In terms of binary interaction, Wu et al. (2003) revealed the unusual southward movement of tropical storm Bopha (2000) and its interaction with the nearby super typhoon Saomai (2000).
Tropical cyclone motion over the WNP is mainly steered by the large-scale environment flows, which is controlled by various time-scale atmospheric variabilities, such as the Madden-Julian oscillation (MJO), the quasi-biweekly oscillation (QBW), and synoptic-scale disturbance. Each of these modes can make individual contribution to sudden TC track change. For instance, Typhoon Morakot (2009) experienced the merging process first with a quasi-biweekly scale vortex, following with a cyclonic gyre on the MJO time scale, and the coalescence enhanced synoptic-scale southwesterly winds leading to the recurving track (Liang et al., 2011; Wu et al., 2011). Lau and Lau (1990) and Chang et al. (1996) stated that the northwestward-propagating 3–8-day disturbances were displaced toward the South China Sea, accompanied concurrently by the clustered straight-moving TCs. Besides, by choosing two different reference regions, one located between Taiwan and Japan, and the other near the South China Sea, Ko and Hsu (2006, 2009) identified the sub-monthly (7–30 day) and intra-seasonal oscillation (ISO; 30–80 day) wave patterns, respectively, and found that most of the recurving TCs over the WNP were embedded in either the cyclonic circulation of a sub-monthly northwestward-propagating wave mode or the westerly phase of the ISO.
In addition, Harr and Elsberry (1991) mentioned that the TC track were likely controlled by the intra-seasonal variations of the monsoon circulation (e.g., monsoon gyre, MG) over the WNP. For the TCs occurring in the eastern semicircle of MG, Carr and Elsberry (1995), and Liang and Wu (2015) examined the role of the binary interaction between TCs and MG in the sudden poleward TC track change, based on a non-divergent barotropic model and a full-physics Weather Research and Forecasting model, respectively. The former declared that the sudden track changes are related to a beta-induced dispersion of the MG and the latter indicated TC track types are dependent on the translation speed of a TC relative to the MG center. On the basis of the numerical simulation of Super Typhoon Megi (2010) and the vorticity budget analysis, Bi et al. (2015) found that a low-frequency MG with a time scale of 10–60-day can interact with Megi by changing the maximum vorticity tendency and ultimately cause its sudden northward turning. The maximum vorticity tendency direction changes are consistent with the sudden changes of TC track, which can be mainly due to the horizonal advection term.
As discussed above, most of previous studies focused on the individual case or model simulation to investigate the influence of different time-scale wave modes on TC movement. However, less attention is placed on the statistical characteristics and joint wave influence of unusual TC tracks. Camargo et al. (2007a, b) found a good correspondence between TC tracks and the large-scale circulation patterns by the clustering analysis. Specifically, the steering winds at 500 hPa have a more meridional component in the recurving track cluster but a more zonal component in the straight track cluster. Meanwhile, two types of recurving tracks appeared preferentially when the MJO was active over the WNP region. In addition, based on the cases with sudden track changes from 2000 to 2010 over the WNP, Wu et al. (2013) documented that the abrupt northward-turning and westward-turning tracks are associated with synoptic-scale disturbance (including TC circulation) and low-frequency waves with periods greater than 10 days, respectively. Furthermore, Liu et al. (2018) investigated the impact of low-frequency steering flows on the straight northward-moving typhoons over WNP, and found that the northward motions are mainly affected by the three types of intra-seasonal (10–60-day) background flow: MG pattern, wave train pattern and mid-latitude trough pattern. The limited statistical studies indicated that the characteristics of abrupt TC track changes over the WNP may be associated with different time-scale wave modes and the related large-scale circulations. So far, the quantitative evaluation for the relative contribution of multiple time-scale wave modes to TC track sudden changes is still lacking. Furthermore, it is also intriguing to explore the distinct circulation patterns associated with the dominant wave mode and the corresponding background circulation during TC track sudden changes, based on the classification of extended samples.
Therefore, the objective of this study is to further investigate the influence of multiple time-scale wave modes on TCs with sudden track change over the WNP. We intend to illustrate the specific characteristics of the surrounding steering flow affecting the particular group of TC abrupt turning. The data and methods used are described in section “Data and methodology.” Section “Case classification and statistical characteristics” presents the identification and classification of sudden change of TC tracks and the definition of “the dominant wave” affecting the sudden change of TC tracks, along with the statistics of different TC track categories. In section “Composite analysis of the Influence of environmental flows,” we examine the impacts of the composite multiple time-scale flows and the relative contributions of different dominant wave patterns. Finally, section “Summary” gives the summary.
Data and Methodology
In this study, TC data is derived from the best-track datasets of the Regional Specialized Meteorological Center (RSMC) Tokyo-Typhoon Center, which contains the information of TC position and intensity over the WNP at 6-h intervals. The large-scale environmental fields with a 1° × 1° resolution at every 6 h are obtained from the National Centers for Environmental Prediction (NCEP) Final (FNL) Operational Global Analysis data. Moreover, the daily National Oceanic and Atmospheric Administration (NOAA) Interpolated Outgoing Longwave Radiation (OLR) data on a 2.5° × 2.5° global grid is used as a proxy of the tropical convection associated with TC movement. The period of interest in this study is May–November from 2000 to 2019.
As mentioned in the introduction, a certain fraction of TC movements over the WNP is associated with multi-timescale waves, ranging from synoptic-scale disturbances (3–10 day) to ISOs (10–90 day). In this study, the meteorological fields are decomposed into the synoptic (10-day high-pass filter), sub-monthly (10–30-day bandpass filter), MJO-scale (30–90-day bandpass filter), and mean background components (90-day low-pass filter) using the Lanczos filtering (Duchon, 1979). Besides, because the TC-related cyclonic circulations may contaminate the synoptic-scale or low-frequency wave patterns, a TC-removal algorithm proposed by Kurihara et al. (1993, 1995) is implemented to subtract TC-related component from the total fields before the Lanczos filtering. The TC-removal procedure proposed by Kurihara et al. (1993, 1995) is adopted, in which the asymmetric filter radius related to tangential disturbed winds and the reposition of the filtered storm center are the two key factors in the removal of the vortex circulation. This approach has also proved valid to remove the main TC vortex and retain the realistic background wave modes in many previous studies (Wu et al., 2002; Hsu et al., 2008; Ko and Hsu, 2009).
TC motion is mainly steered by the large-scale environmental flows in the vicinity of TC center. Gray (1989) documented that the deep-layer averaged winds within a smaller radius was a good indicator for the movement of TC. However, TC intensity generally determines the vertical penetration depth of a TC and thus the steering layers would vary in different cases. The Cooperative Institute for Meteorological Satellite Studies (CIMSS) relied on the minimum central pressure to ascertain the intensity-dependent steering layers (Table 1). According to this standard, Shi et al. (2014) identified the steering layer mean wind within the 4-degree radius from the TC center as the steering flow of Typhoon Megi (2010). This study also adopted this method.

Table 1. TC central pressures and its corresponding steering layers.
Environmental steering winds are calculated as follows:
Where N represents the number of the steering layers for each TC case, r, and theta mean TC radius and azimuthal angle, respectively. The weight (wn) for each pressure (pn) level is given in Table 2:
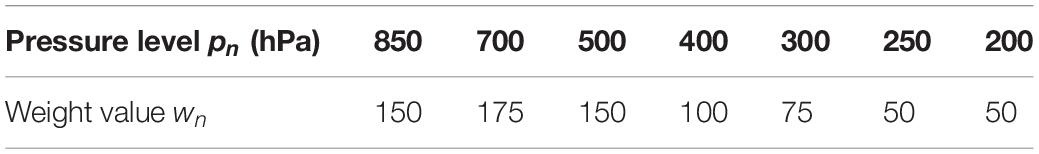
Table 2. The weight for each pressure level.
After the TC-removal and filtering processes, to quantitatively assess the relative contribution of the different timescale wave modes to TC abrupt track turning, a metric called along-track component (AT) was quantified as the normalized projection of steering flow associated with the different waves into the TC movement vector (Wu et al., 2003), which is defined as follows:
where d represents one given wave mode, is the steering vector associated with each wave mode, is the best-track movement vector. The value of AT(d) becomes large if the given steering flow is strong and aligned with the best-track vector. The AT values associated with the different waves are averaged from 12 h before to 12 h after the turning time in such a way that the steering flow changes in both along-track and cross-track direction can be captured well. The detailed AT values for the cases with sudden right-turning tracks (SRT) and sudden left-turning tracks (SLT) are displayed in Tables 3, 4, respectively. The dominant wave mode affecting the sudden turning of each TC can be identified by seeking maximum AT among the given wave modes.
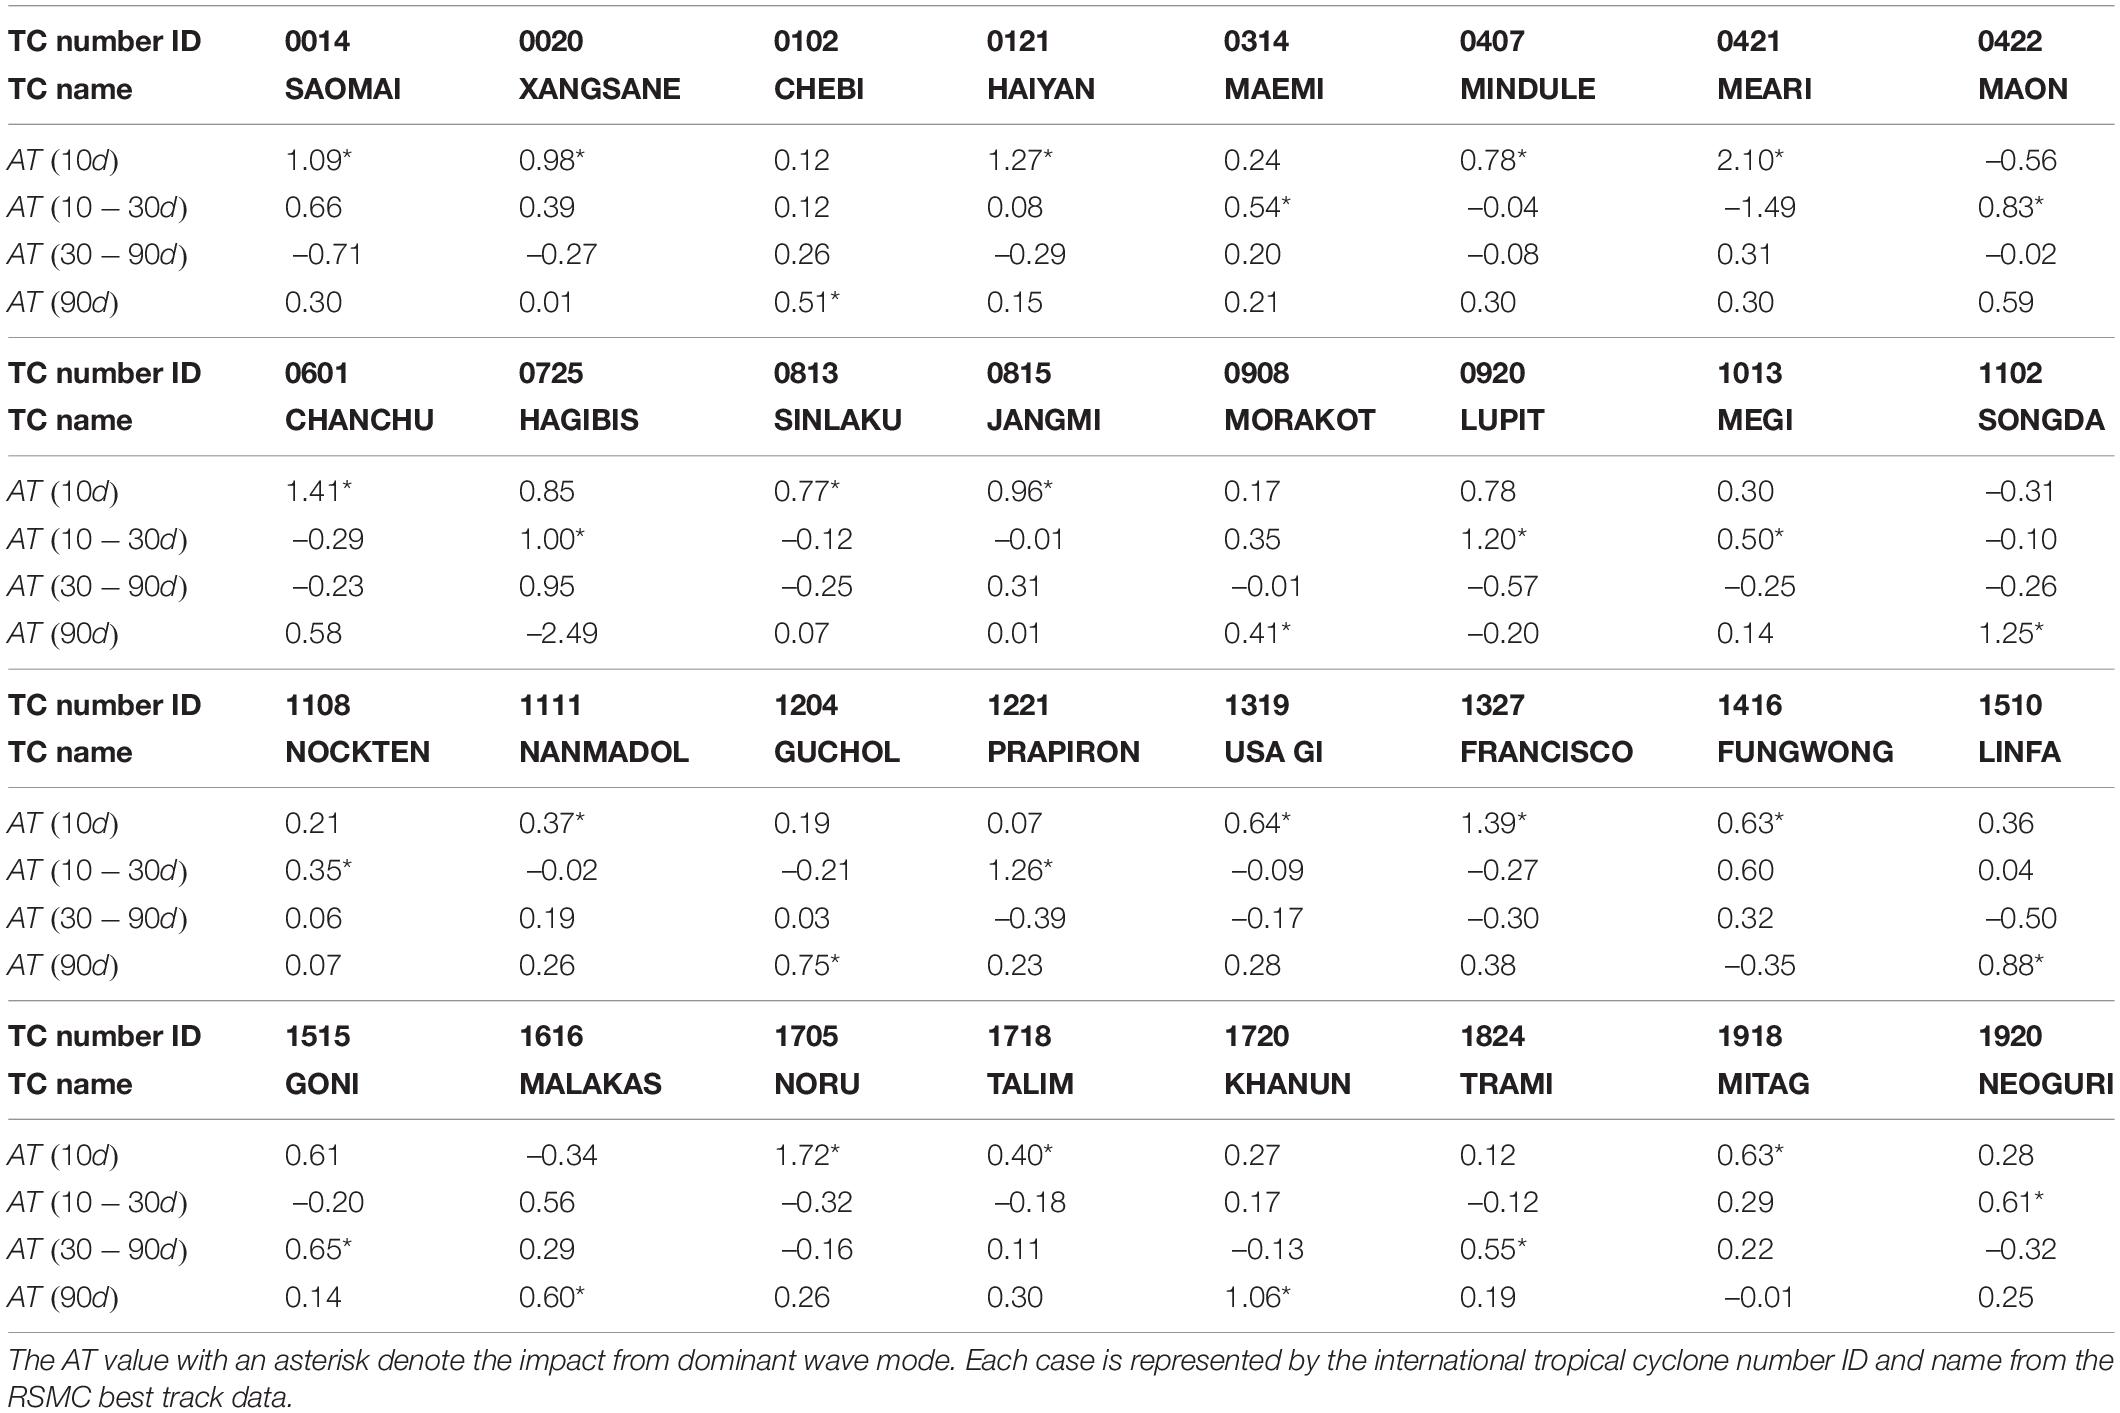
Table 3. The mean AT value for the SRT cases associated with each wave mode averaging within the sudden track period.
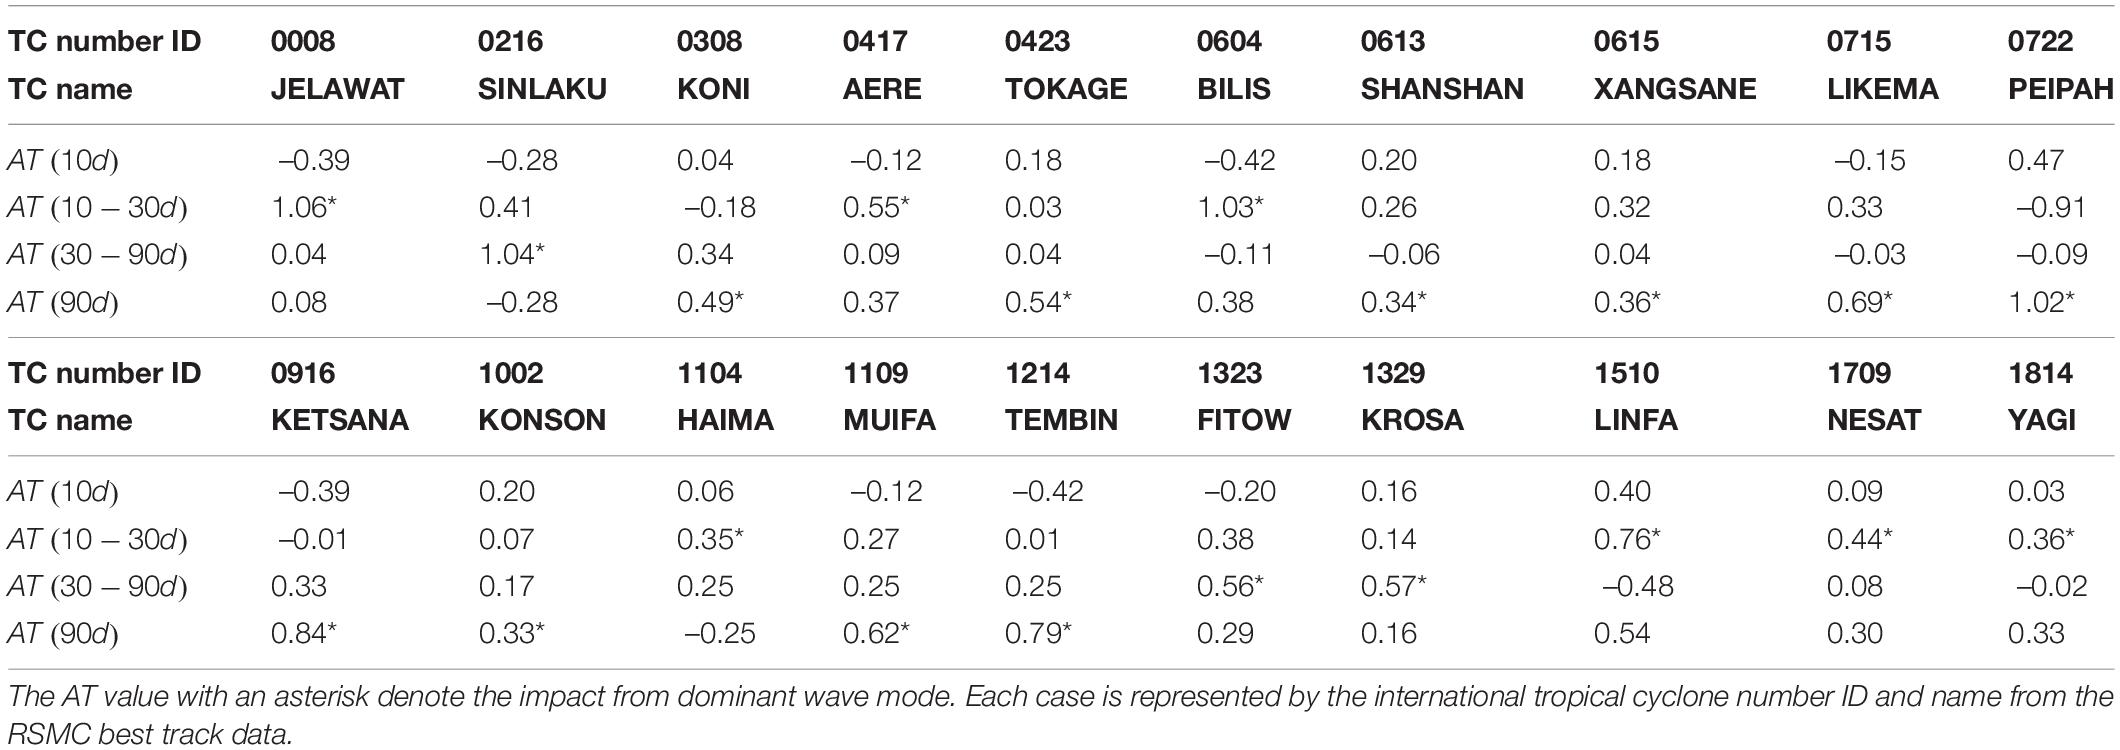
Table 4. The mean AT value for the SLT cases associated with each wave mode averaging within the sudden track period.
The statistical significance test for the composite analysis is conducted following a Monte Carlo test (Camargo et al., 2007a). The Monte Carlo test uses data resampling with replacement to estimate the properties of statistics. It is particularly effective in dealing with small sample sizes.
Case Classification and Statistical Characteristics
Chan et al. (1980) proposed a criterion to identify the abrupt right-turning and left-turning TC tracks in the West Indies. In their study, the left-turning (right-turning) tracks are identified once the change in TC movement direction exceeds 20° clockwise (anti-clockwise) within 12 h. Based on the standard derivation of direction changes for all TCs in the WNP basin during 1970–2010, Wu et al. (2013) identified the SRT and SLT cases as those with the direction change greater than 40° (37°) within 12 (6) h in a clockwise way and larger than 25° (25°) within 12 (6) h in a counter-clockwise way, respectively.
Following the definition of Wu et al. (2013), the SLT, and SRT cases during 2000–2019 are identified in this study. Meanwhile, the selected TCs are required to reach the tropical storm intensity or higher and have no looping track. A total of 52 TCs experiencing sudden track change are selected, including 32 SRT and 20 SLT cases (Figure 1), accounting for about 10.5% of the total TCs during the 20-year period over the WNP. Figure 1 shows that a large majority of SRT TCs occur to the east of 120°E. In contrast, the two key basins for the SLT track are located to the south and north of 20°N, respectively. As shown in Figure 1B, of interest is that the SLT cases to the south (north) of 20°N are basically dominated by mean background wave mode (ISO including the 10–30-day and 30–90-day wave modes). Considering the similar wave patterns, the 10–30-day, and 30–90-day wave modes are combined into an ISO. It is also noted that the synoptic-scale fluctuation has no dominant role in the SLT cases (Figure 2A). Therefore, we will focus on five main categories in the following analysis depending on the track type and the quantitative contribution of dominant fluctuation: the SRT cases dominated by the synoptic-scale wave, the ISO wave and the background flow, and the SLT cases dominated by the ISO wave and the background flow, which are referred to as R10, R1090, R90, L1090, and L90, respectively.
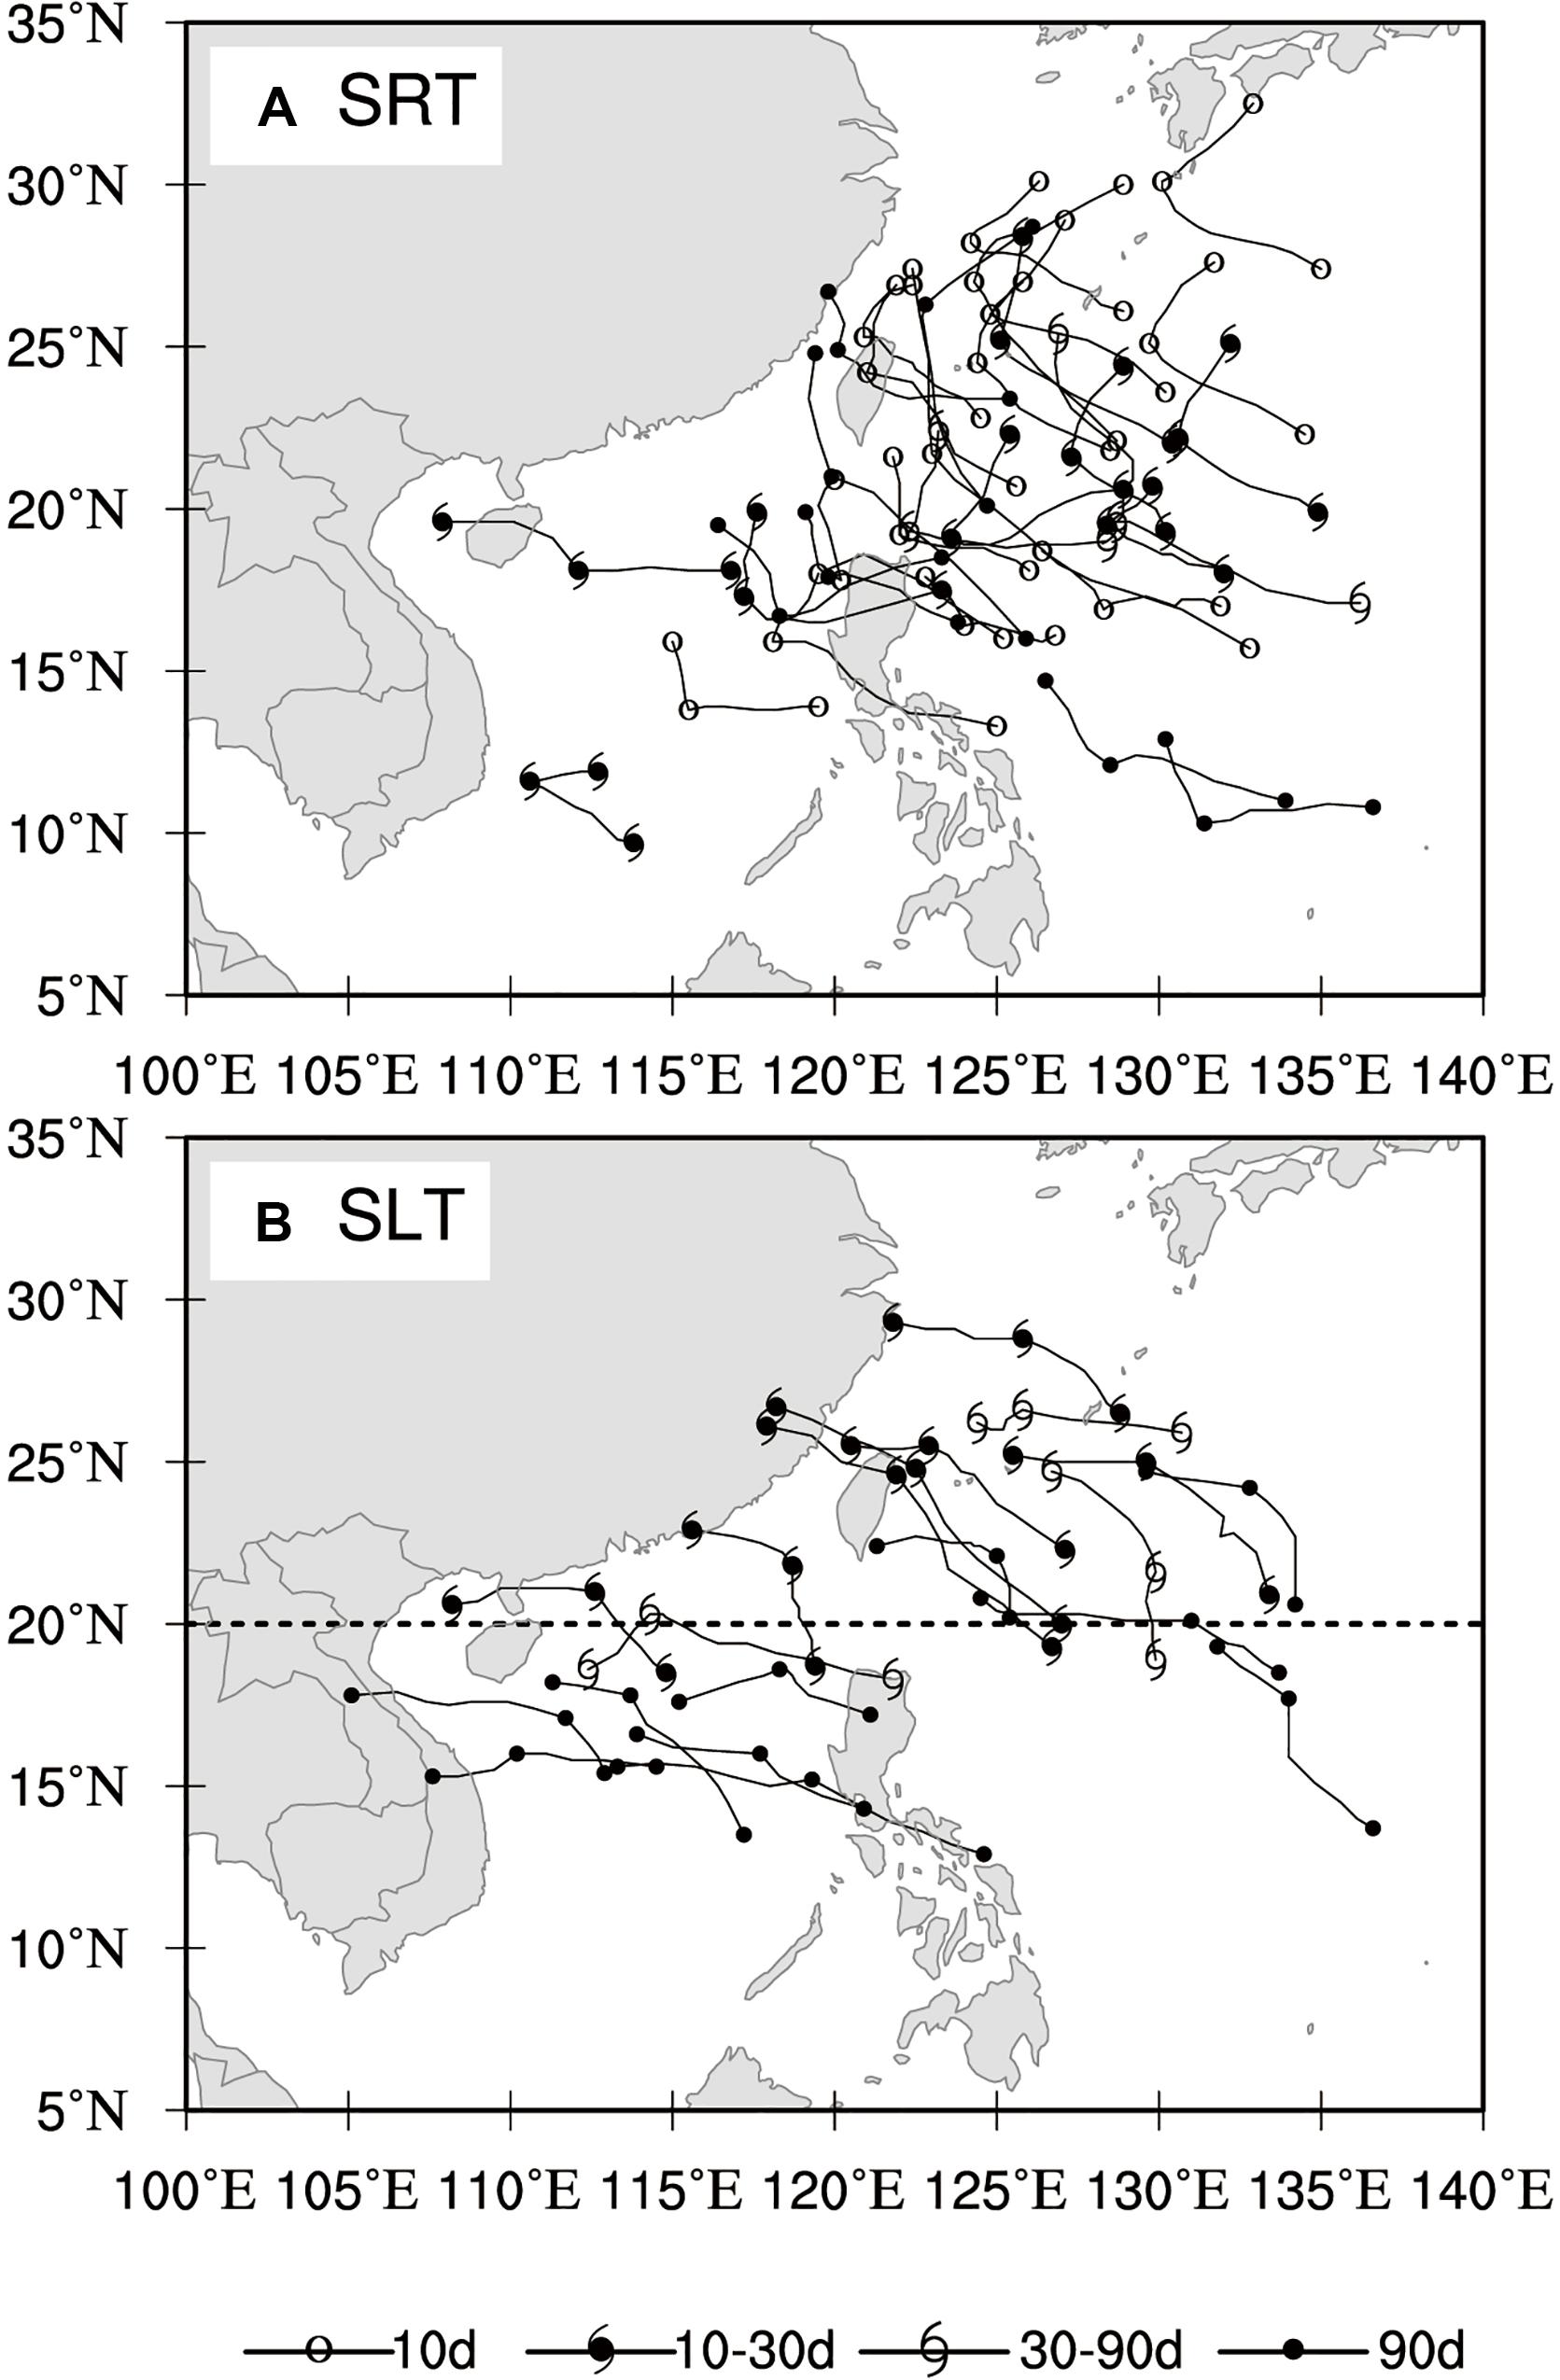
Figure 1. The track segments of (A) SRT and (B) SLT cases around the turning time during the period of 2000–2019. Here each track segment is connected by three points which representing the TC positions before/at/after turning time, respectively. The dominant waves related to each sudden turning process are shown with the different symbols.
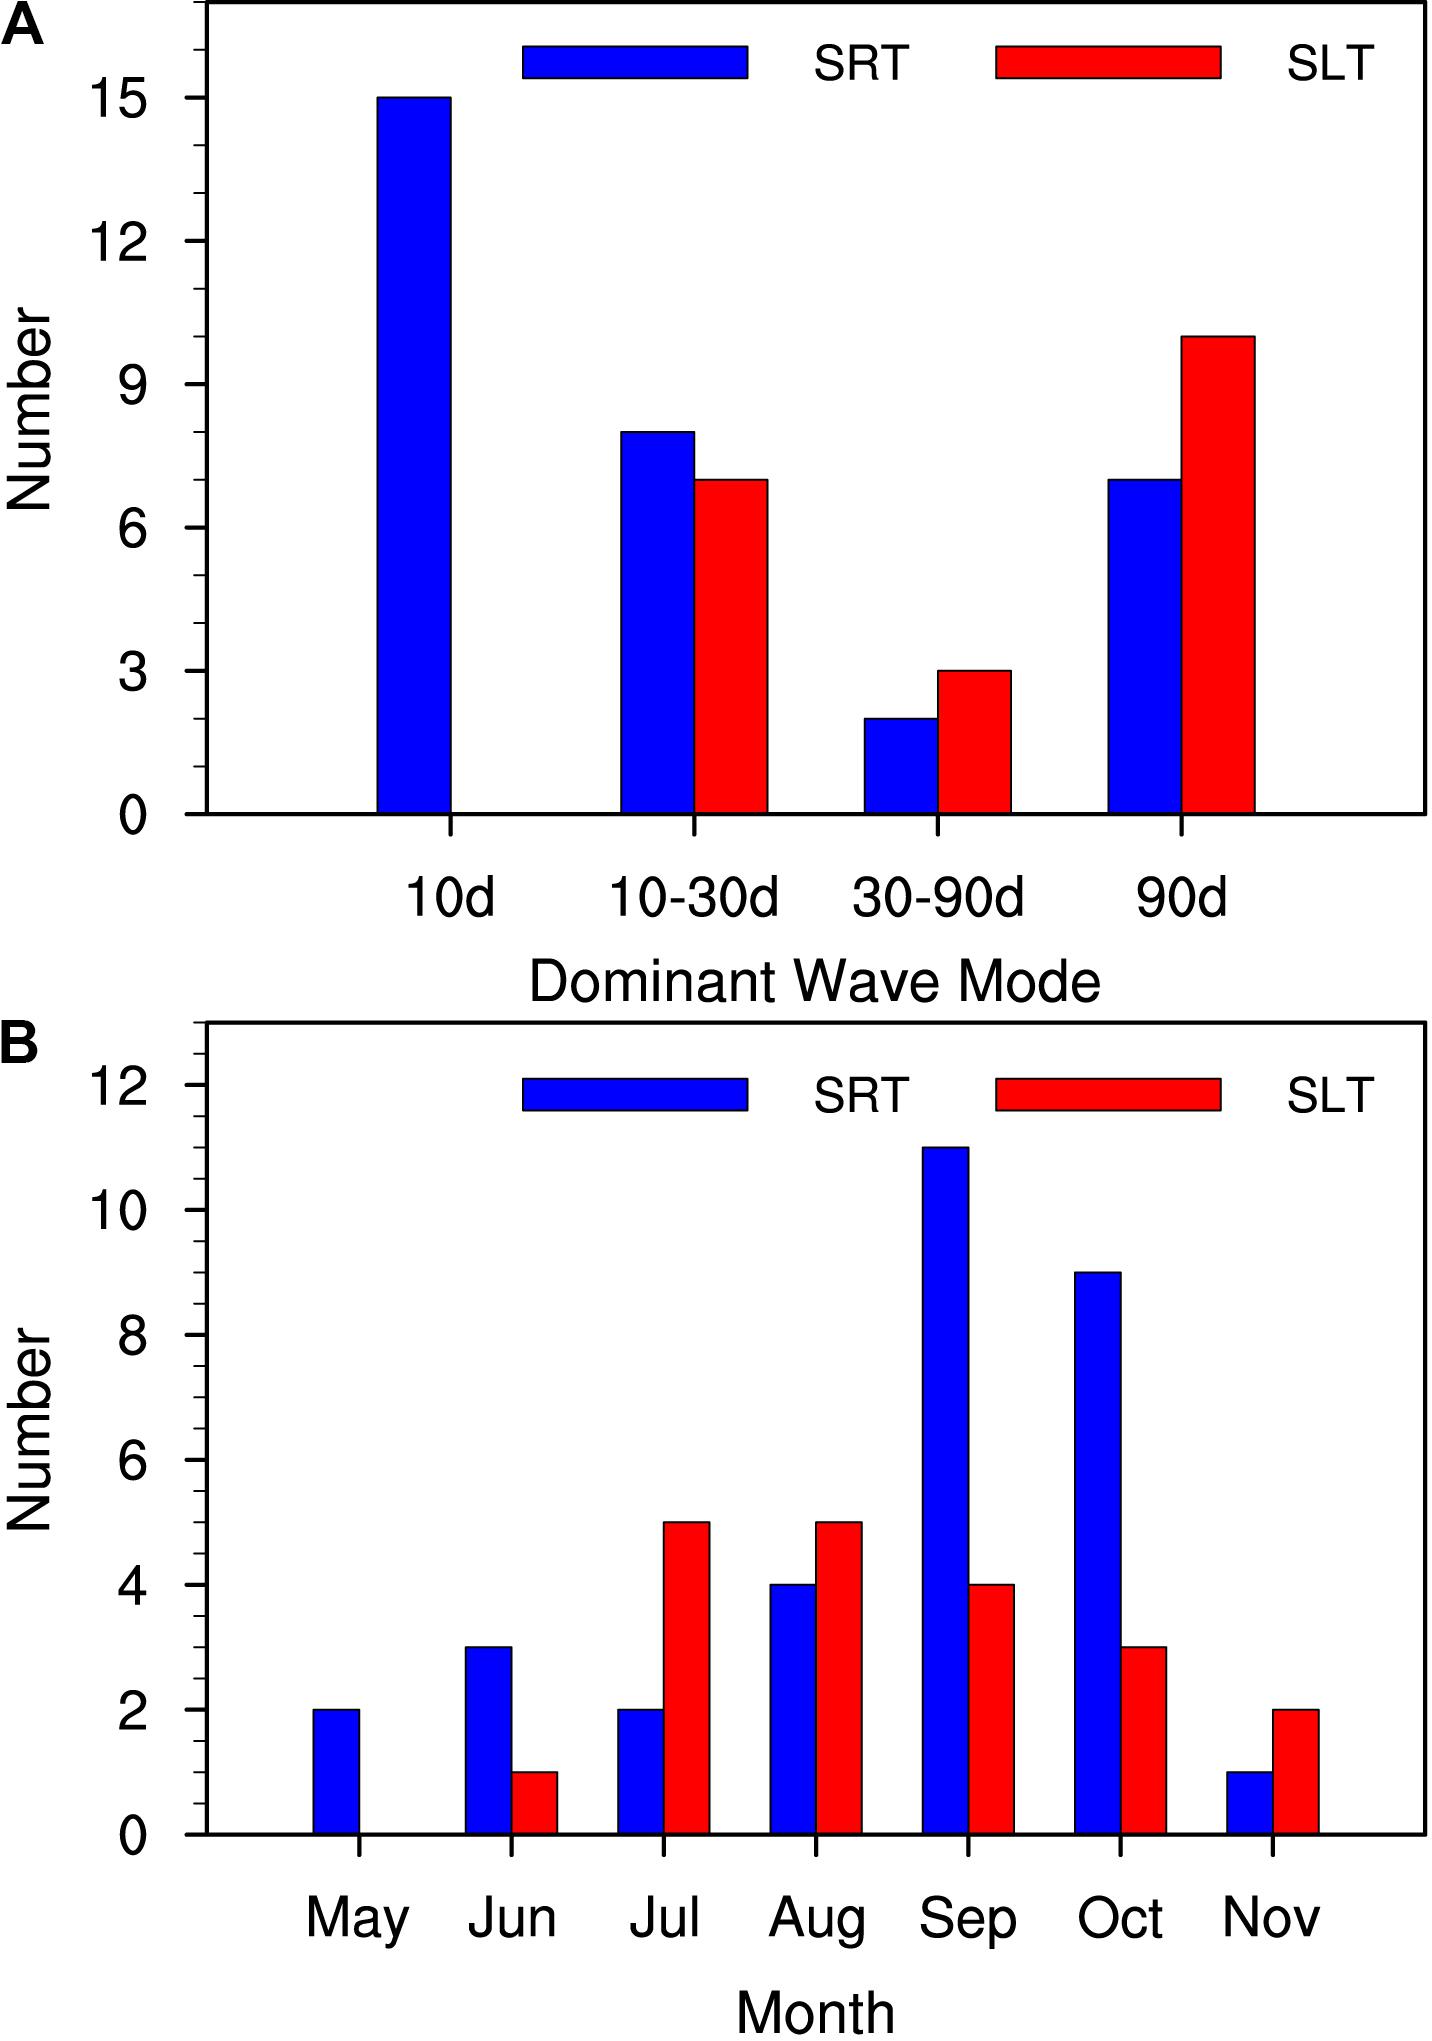
Figure 2. The number of the SRT and SLT cases dominated by the different wave modes (A) and the monthly distribution (B). Blue and red bars represent the numbers of SRT and SLT, respectively.
Figure 2A displays the number of the SRT and SLT cases related to the different dominant wave modes. It is clear that the number of R10 type is largest among the SRT cases, consistent with the findings of Wu et al. (2013). The number of the L90 cases is almost equal to that of L1090 cases associated with the ISOs. In terms of monthly distribution (Figure 2B), the cases with sudden track change associated with the active multi-timescale wave are frequently observed in July-October (Ko and Hsu, 2006, 2009; Chen et al., 2009), with around 75% SRT cases occurring from August to October. The frequency of the SRT cases peaks in September and October but drops in other months. In contrast, the SLT cases have a relatively even distribution from July to October, similar to the results of Gong et al. (2018).
Figure 3 exhibits the distribution of mean latitude and longitude of TC abrupt turning points in the different categories. The mean locations in the three SRT categories have no distinct difference, with an average latitude (longitude) of about 20°N (122°E). Besides, half of the R10 (R1090) cases occur between 17°N (18°N), and 25° N (22°N) where tropical waves are active and vital for TC unusual motion (Figure 3A). Figure 3B shows that most of the TC sudden turning positions in the R10/R90 category are concentrated within a narrowest longitudinal band between 120°E and 125°E. It is also clear in Figure 3B that 75% R90 TCs are distributed to the east of 120°E where the climatological mean flow could exert a more significant influence. In contrast, the mean latitudes are obviously distinct between the two SLT categories and proved to be significant at 95% confidence level by a t-test. Consistent with the dash line shown in Figure 1B, the TCs in L1090 occur in higher latitude (>20°N) than the L90 cases.
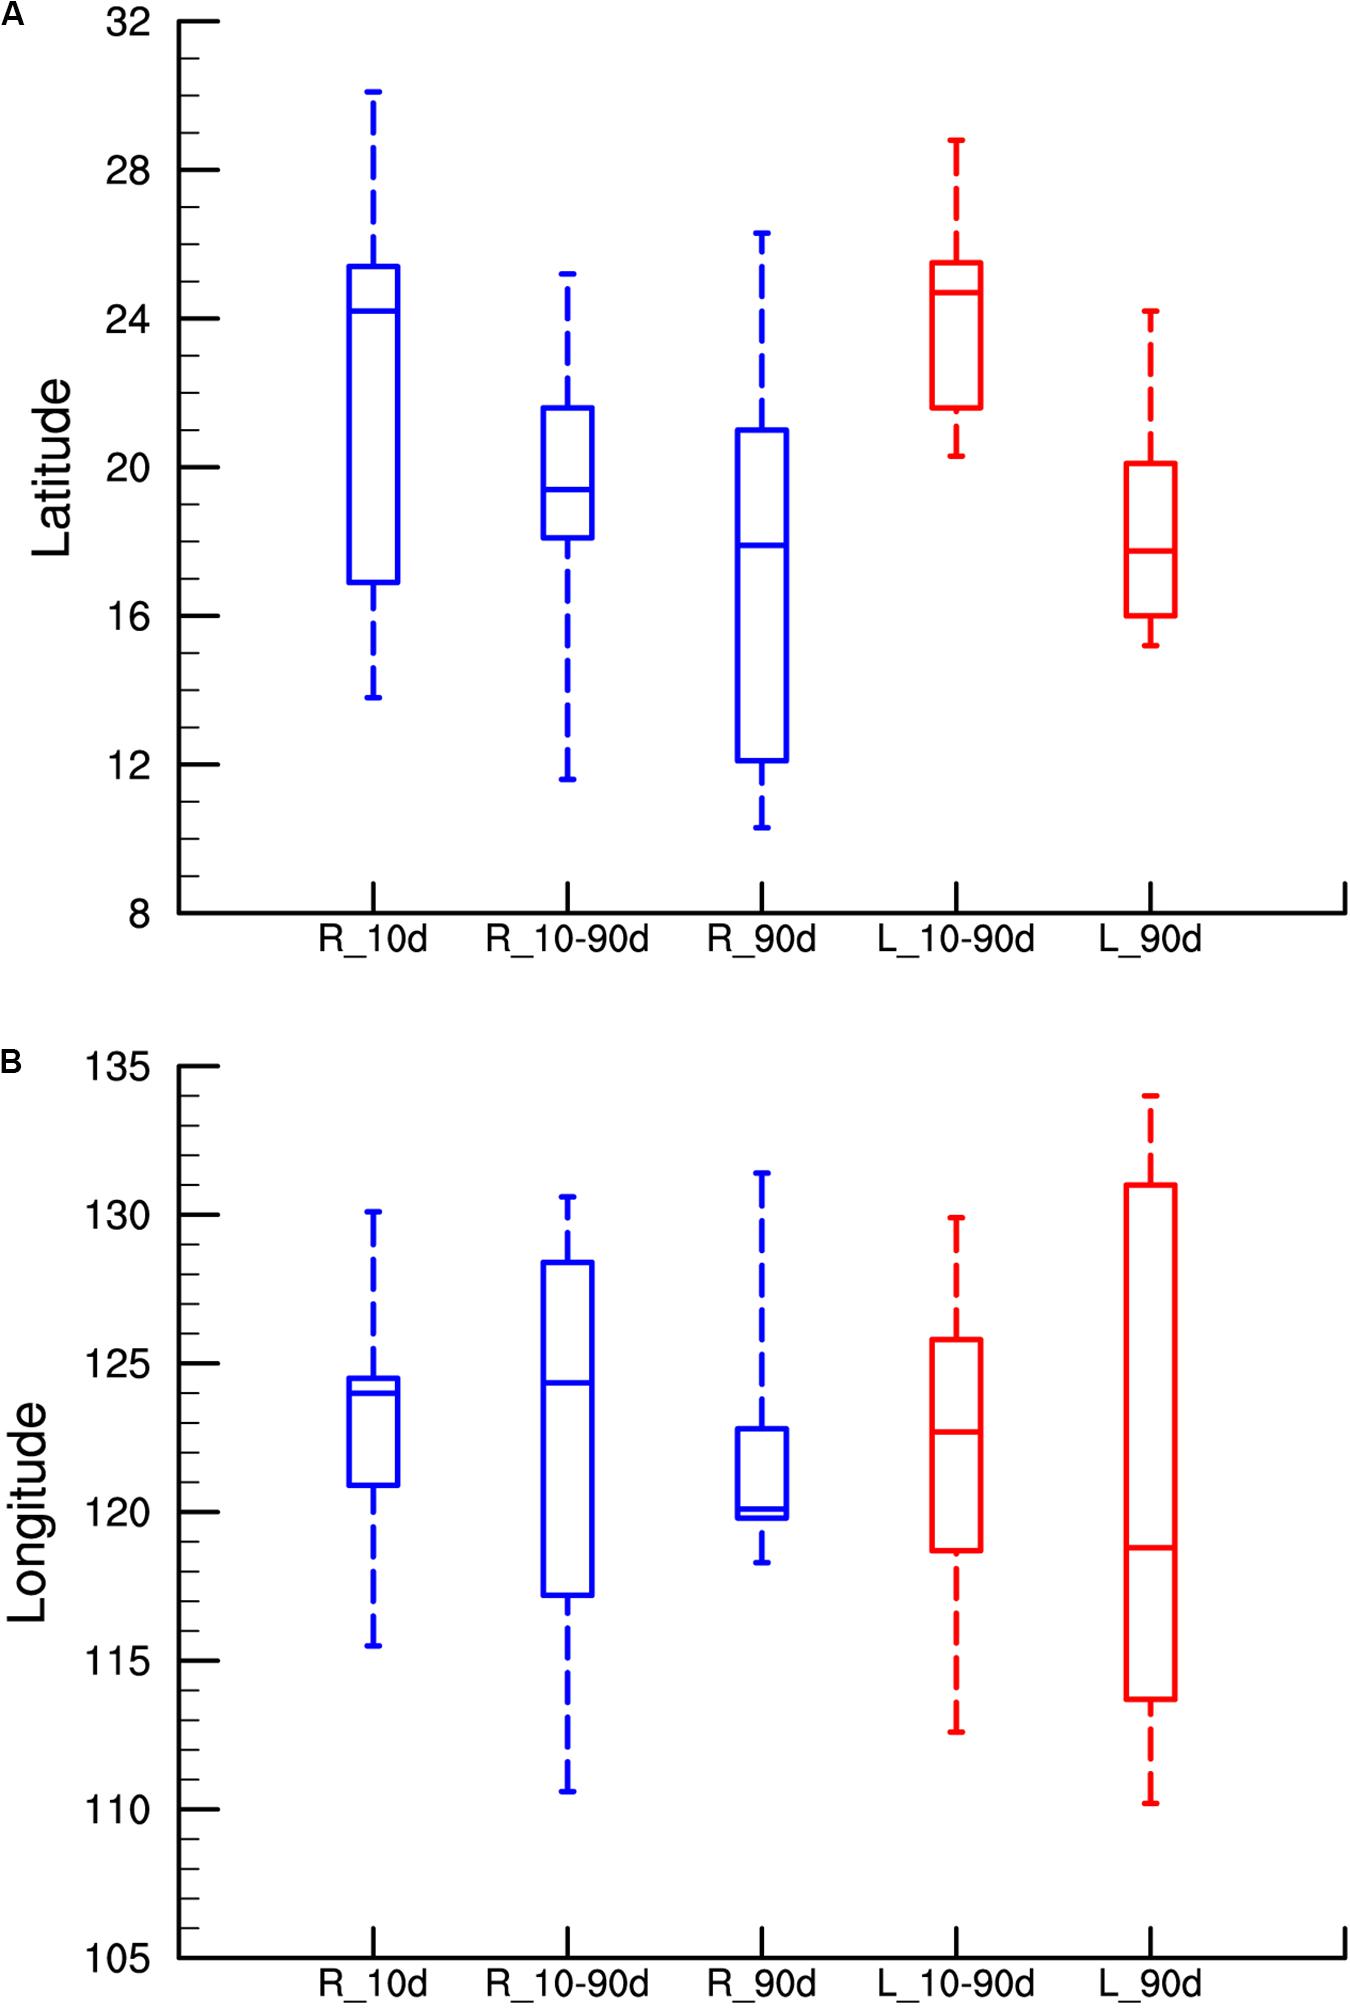
Figure 3. Box-and-whisker plots of the mean (A) latitude and (B) longitude of the five-category sudden TC cases. The vertical bar displays the interquartile range of 25–75% of the all cases. The middle horizontal line denotes the mean.
Composite Analysis of the Influence of Environmental Flows
Composite Steering-Flow Patterns for the SRT and SLT TCs
It is widely known that the large-scale environmental flows in the vicinity of TC center can considerably impact on TC movement. First of all, the composite analysis is performed to obtain the detailed structural and temporal evolution of the large-scale circulation associated with the SRT and SLT cases.
Figure 4 shows the composite unfiltered wind and geopotential height for the SRT cases at three different levels for three days centered on the turning time. On one day before the SRT occurrence, TC generally maintains a westward or northwestward track, which is steered by the southeasterly flows primarily induced by a wider range of anti-cyclonic circulation to the north or northeast over the entire troposphere (Figures 4A,D,G). At the time of SRT, the northern westerly trough at the mid-upper troposphere commences to deepen, and the anticyclonic high to the south is separated into two parts (Figures 4B,E). As a result, the enhancement of trough and the eastward withdrawing of SH jointly lead to a strengthened northward steering flow. In addition, the low-level cyclonic circulation around TC becomes more asymmetric arising from the stronger southwesterly jet on the southeast side of the TC and also contributes to the sharply northward deflection (Figure 4H), which may be related to the southwesterly monsoon surge as previous studies (Guard, 1983; Carr and Elsberry, 1995). In the subsequent day, the upper-level westerly trough continues to deepen as the TC moves to the northwestern flank of the SH, evidently affected by the southwesterly steering flow in the middle and upper troposphere (Figures 4C,F). Meanwhile, the asymmetry related to the lower-level southwesterly flows around TC center keeps sustained to facilitate the northeastward track (Figure 4I).
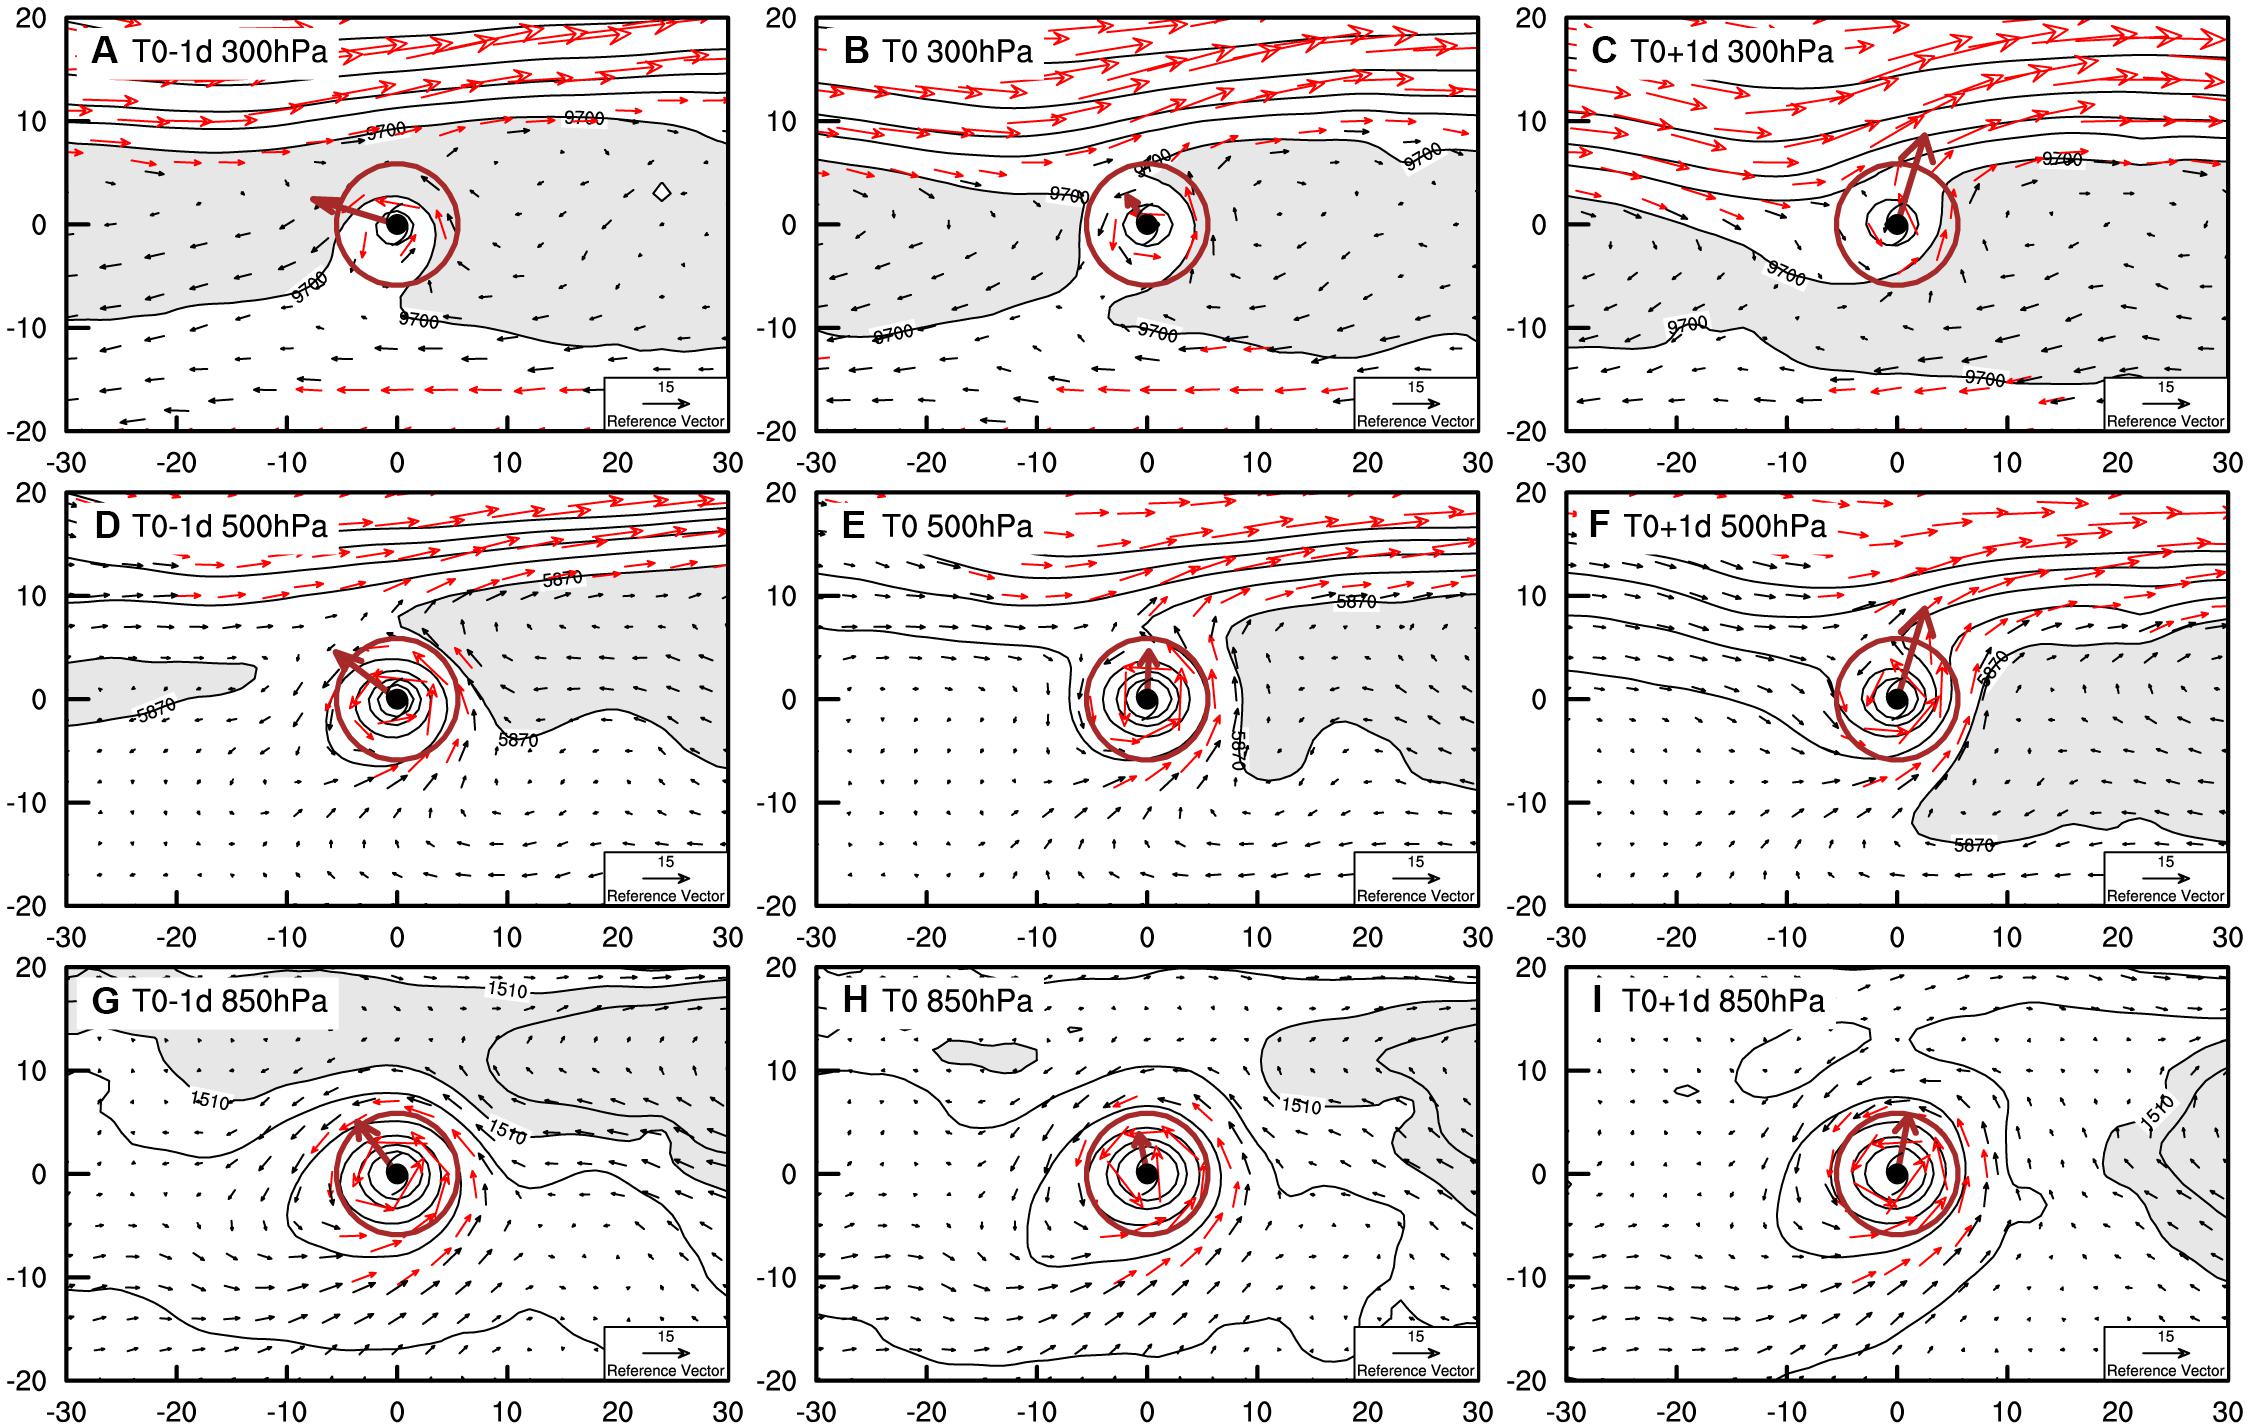
Figure 4. Composite unfiltered winds (vectors, m s–1) and geopotential height (contour, gpm) for the SRT cases (left) 1 day before, (middle) at and (right) 1 day after the turning time. Pressure levels are (A–C) 300 hPa; (D–F) 500 hPa; and (G–I) 850 hPa, respectively. The areas larger than 9700, 5870, and 1510 gpm at respective level are shaded. Red vectors represent wind speeds larger than 8 m s–1. The coordinates are the latitudes and longitudes centered on TC center. The brown vector means the composite steering flow averaged in the brown circle.
The above composite environmental patterns reveal that the SRT process is usually accompanied by the deepened upper-tropospheric westerly trough and the eastward-retreating SH in the middle-upper troposphere, along with the strengthened lower-level asymmetric southwesterlies in the vicinity of TC center, consistent with the observation for individual TCs (Carr and Elsberry, 1995; Wu et al., 2009).
In contrast, the SLT tracks experience abrupt directional change from the northwestward to the westward first. Figure 5 exhibits the composite environmental fields for the SLT cases. Compared with the SRT process, the deepened westerly trough at the upper troposphere is absent, and thus the zonally elongated anticyclone to the northwest of TC maintains the strength with more asymmetric northeasterly around TC center, favorable for the TC left deflection (Figures 5A–C). At the lower-to-mid troposphere, the strong anticyclonic circulation associated with the SH is persistent to the northeast of TC. Moreover, the eastward extension of the lower-level monsoon trough can enhance the pressure meridional gradient to the north of TC, leading to the strengthening of the easterly flows. Overall, in contrast the counterparts in the SRT cases, the asymmetric southwesterly flows around TC center are significantly weakened while the westward components of the steering flows are increased. As a result, this upper-to-lower tropospheric configuration is more conducive to the TC sudden left turning.
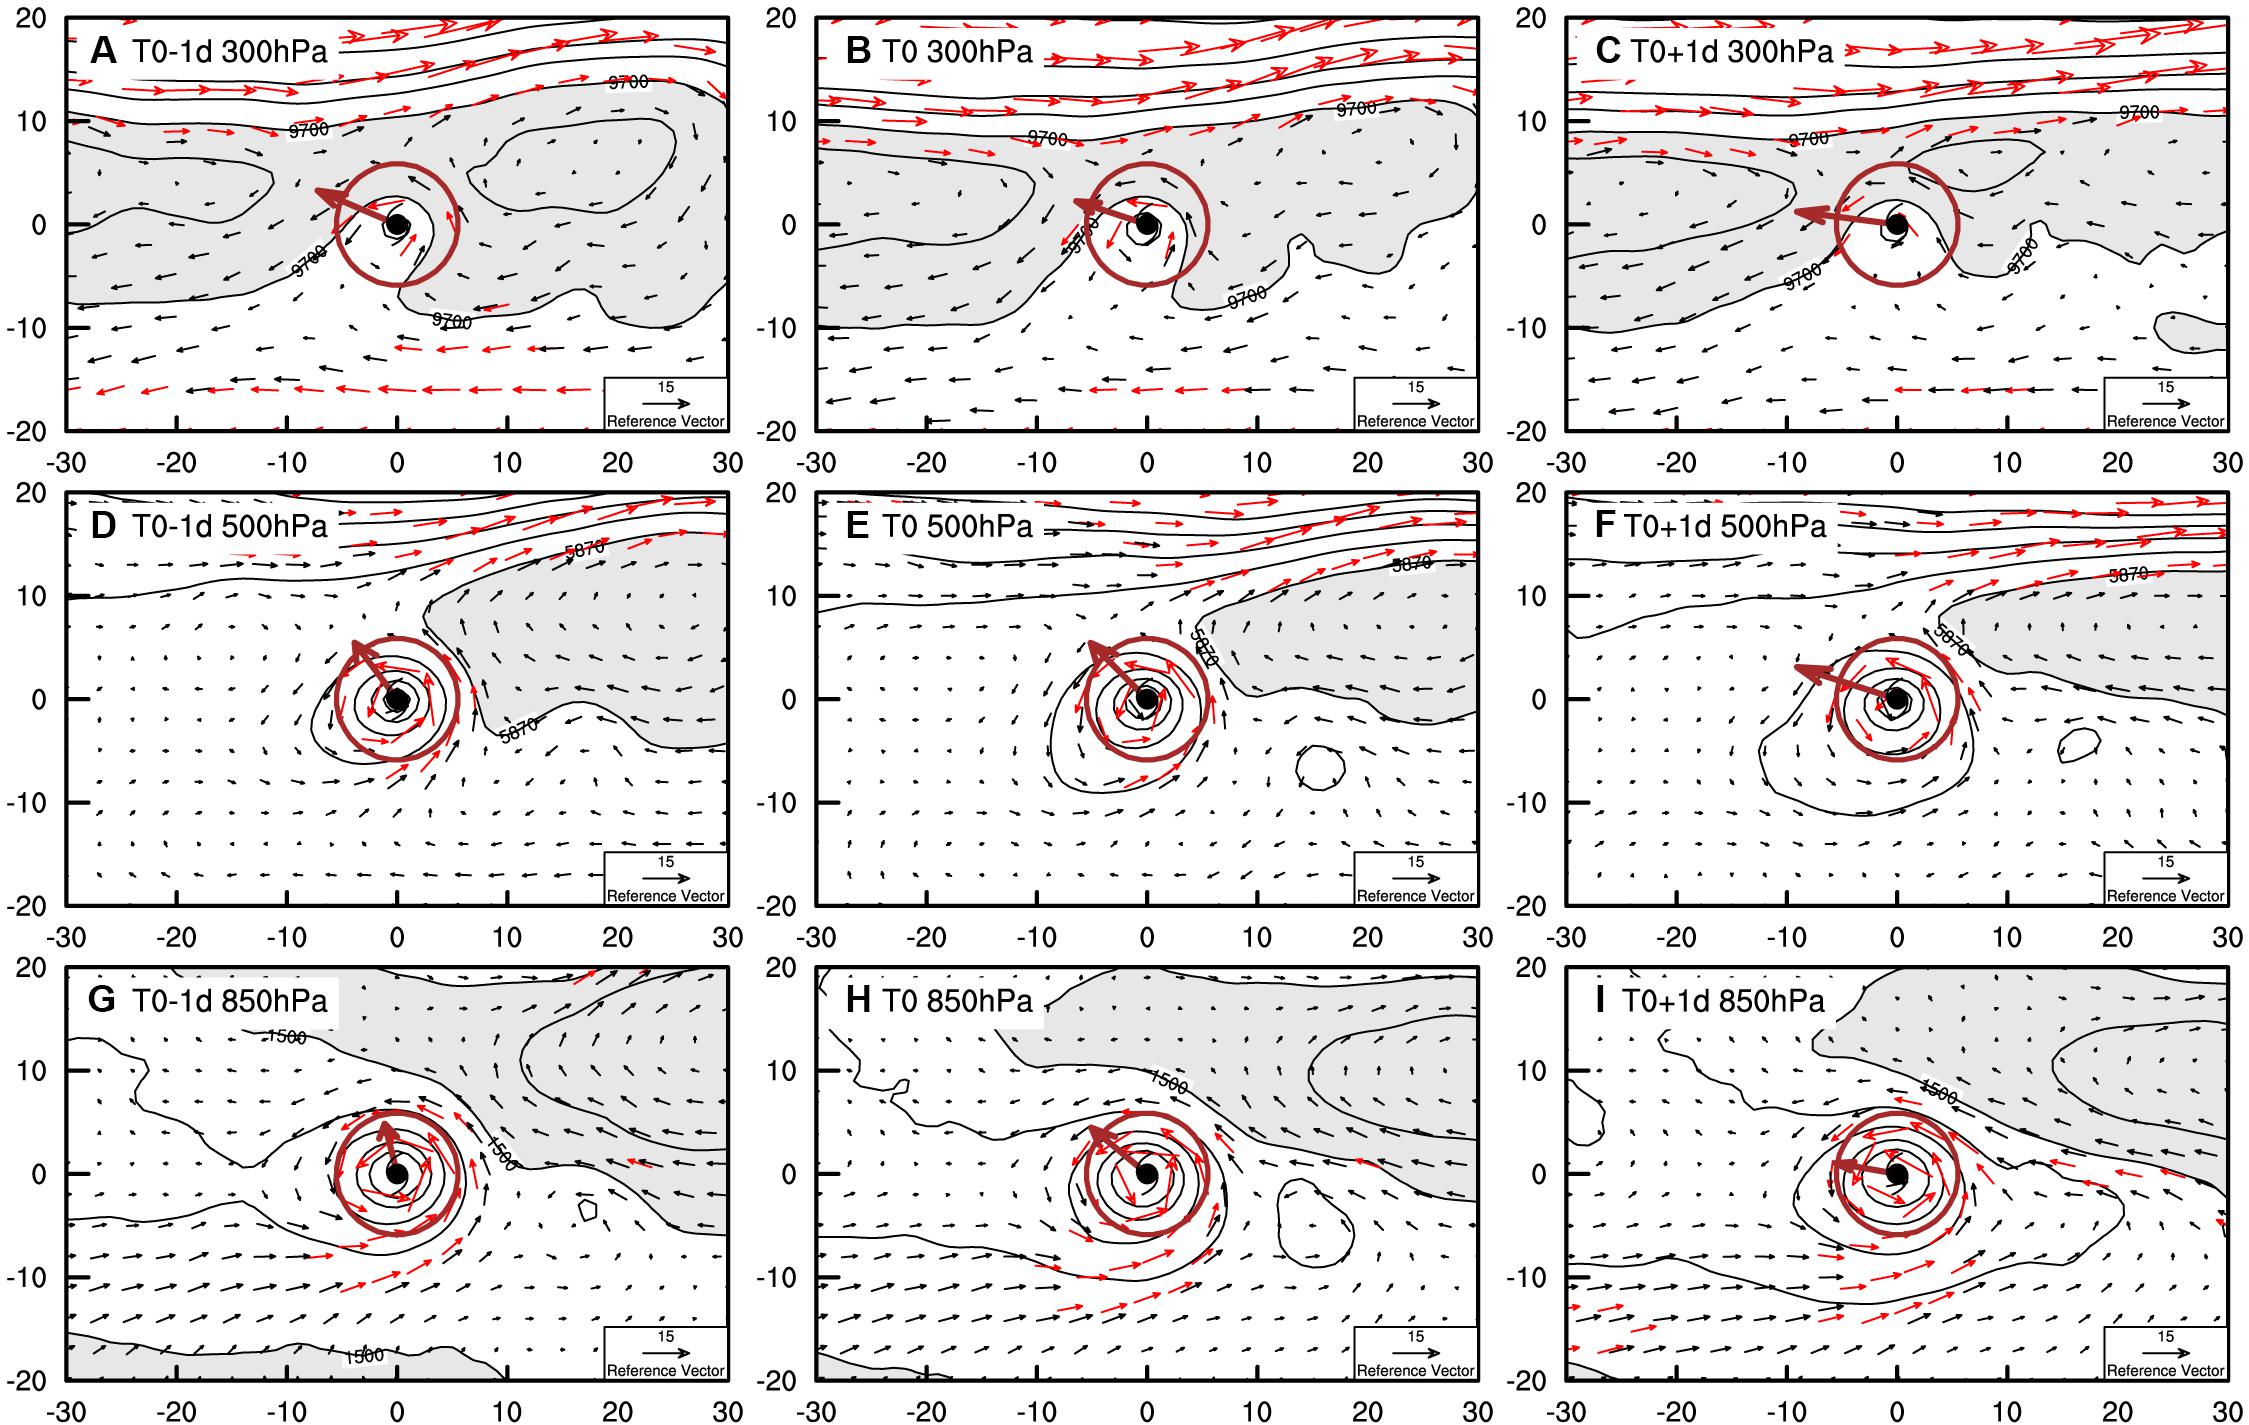
Figure 5. Composite unfiltered winds (vectors, m s–1) and geopotential height (contour, gpm) for the SLT cases (left) 1 day before, (middle) at and (right) 1 day after the turning time. Pressure levels are (A–C) 300 hPa; (D–F) 500 hPa; and (G–I) 850 hPa, respectively. The areas larger than 9700, 5870, and 1510 gpm at respective level are shaded. Red vectors represent wind speeds larger than 8 m s–1. The coordinates are the latitudes and longitudes centered on TC center. The brown vector means the composite steering flow averaged in the brown circle.
It is obvious that TCs with abrupt track changes are usually surrounded and steered by specific environmental field with deep circulation structure. As indicated by Elsberry (2004) and Luo et al. (2011), each of the surrounding environmental factors varies in time and the complex atmospheric variability impacts TC movement in a non-linear manner. Therefore, the next section will continue to explore the dynamic process of TC sudden track change from the viewpoint of multiple timescale flows.
Roles of the Different Dominant Wave Modes
As described in section “Case classification and statistical characteristics,” the sudden TC track turnings in the WNP can be grouped into the five dominant wave categories. The composite analysis is performed to explain the individual roles of the five major waves. To conduct the Monte Carlo test, the additional 59 TC cases with straight track were selected as the normal samples to check the statistical significance of circulation pattern in the SRT and SLT samples (Figure 6). Referring to the definition in previous studies (Chan et al., 1980; Miller et al., 1988; Chen et al., 2009), the straight TC cases are identified as those in which the TC movement direction varies less than 10° within any 24 h and the general direction of movement need to head between the southwest and northwest throughout the lifespan of the TC.
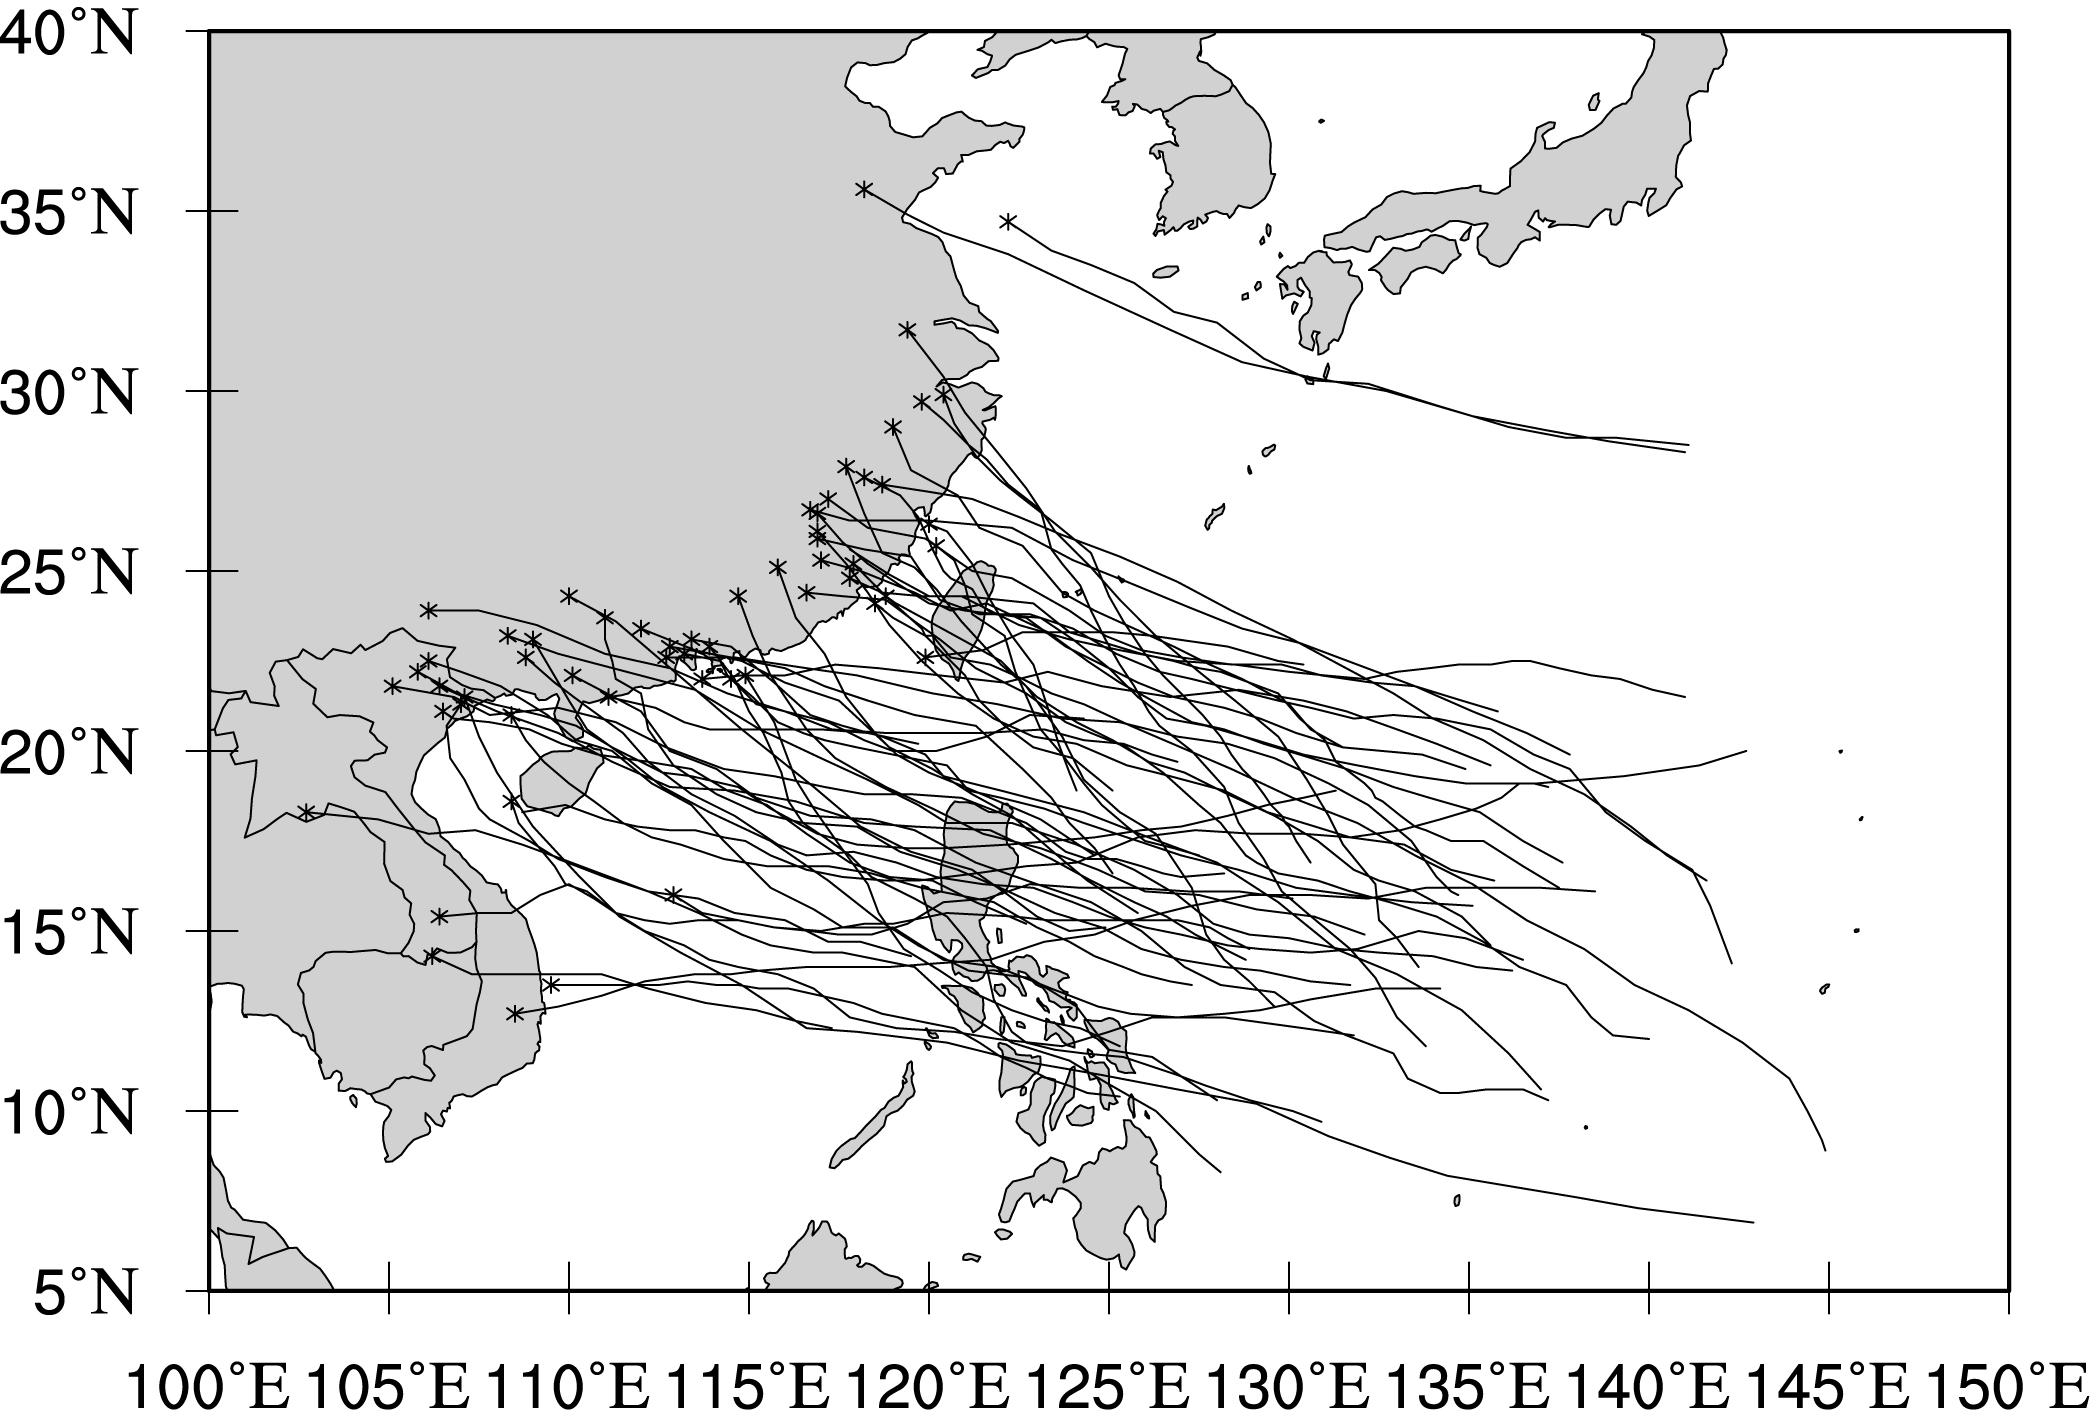
Figure 6. The best tracks of the straight track cases of 2000–2019.
The statistical results in Figure 2A indicates that the synoptic wave mode with the removal of TC-related circulation can be responsible for almost half of the SRT cases. Figure 7A gives the composite 10-day-highpass filtered wind and OLR for the R10 cases. It is evident that the filtered deep-layer averaged wind field exhibits a northwest-southwest-oriented wave train to the northeast of the TC center (depicted by the red line in Figure 7A). The TC is sandwiched by the anticyclonic circulation in the wave train and the cyclonic circulation to the southwest. As a result, the vigorous southerly flows pass across the TC center, responsible for the sudden northward turning in the R10 cases. Meanwhile, the negative OLR anomaly is southwest-northeast-oriented, basically aligned with the SRT direction.
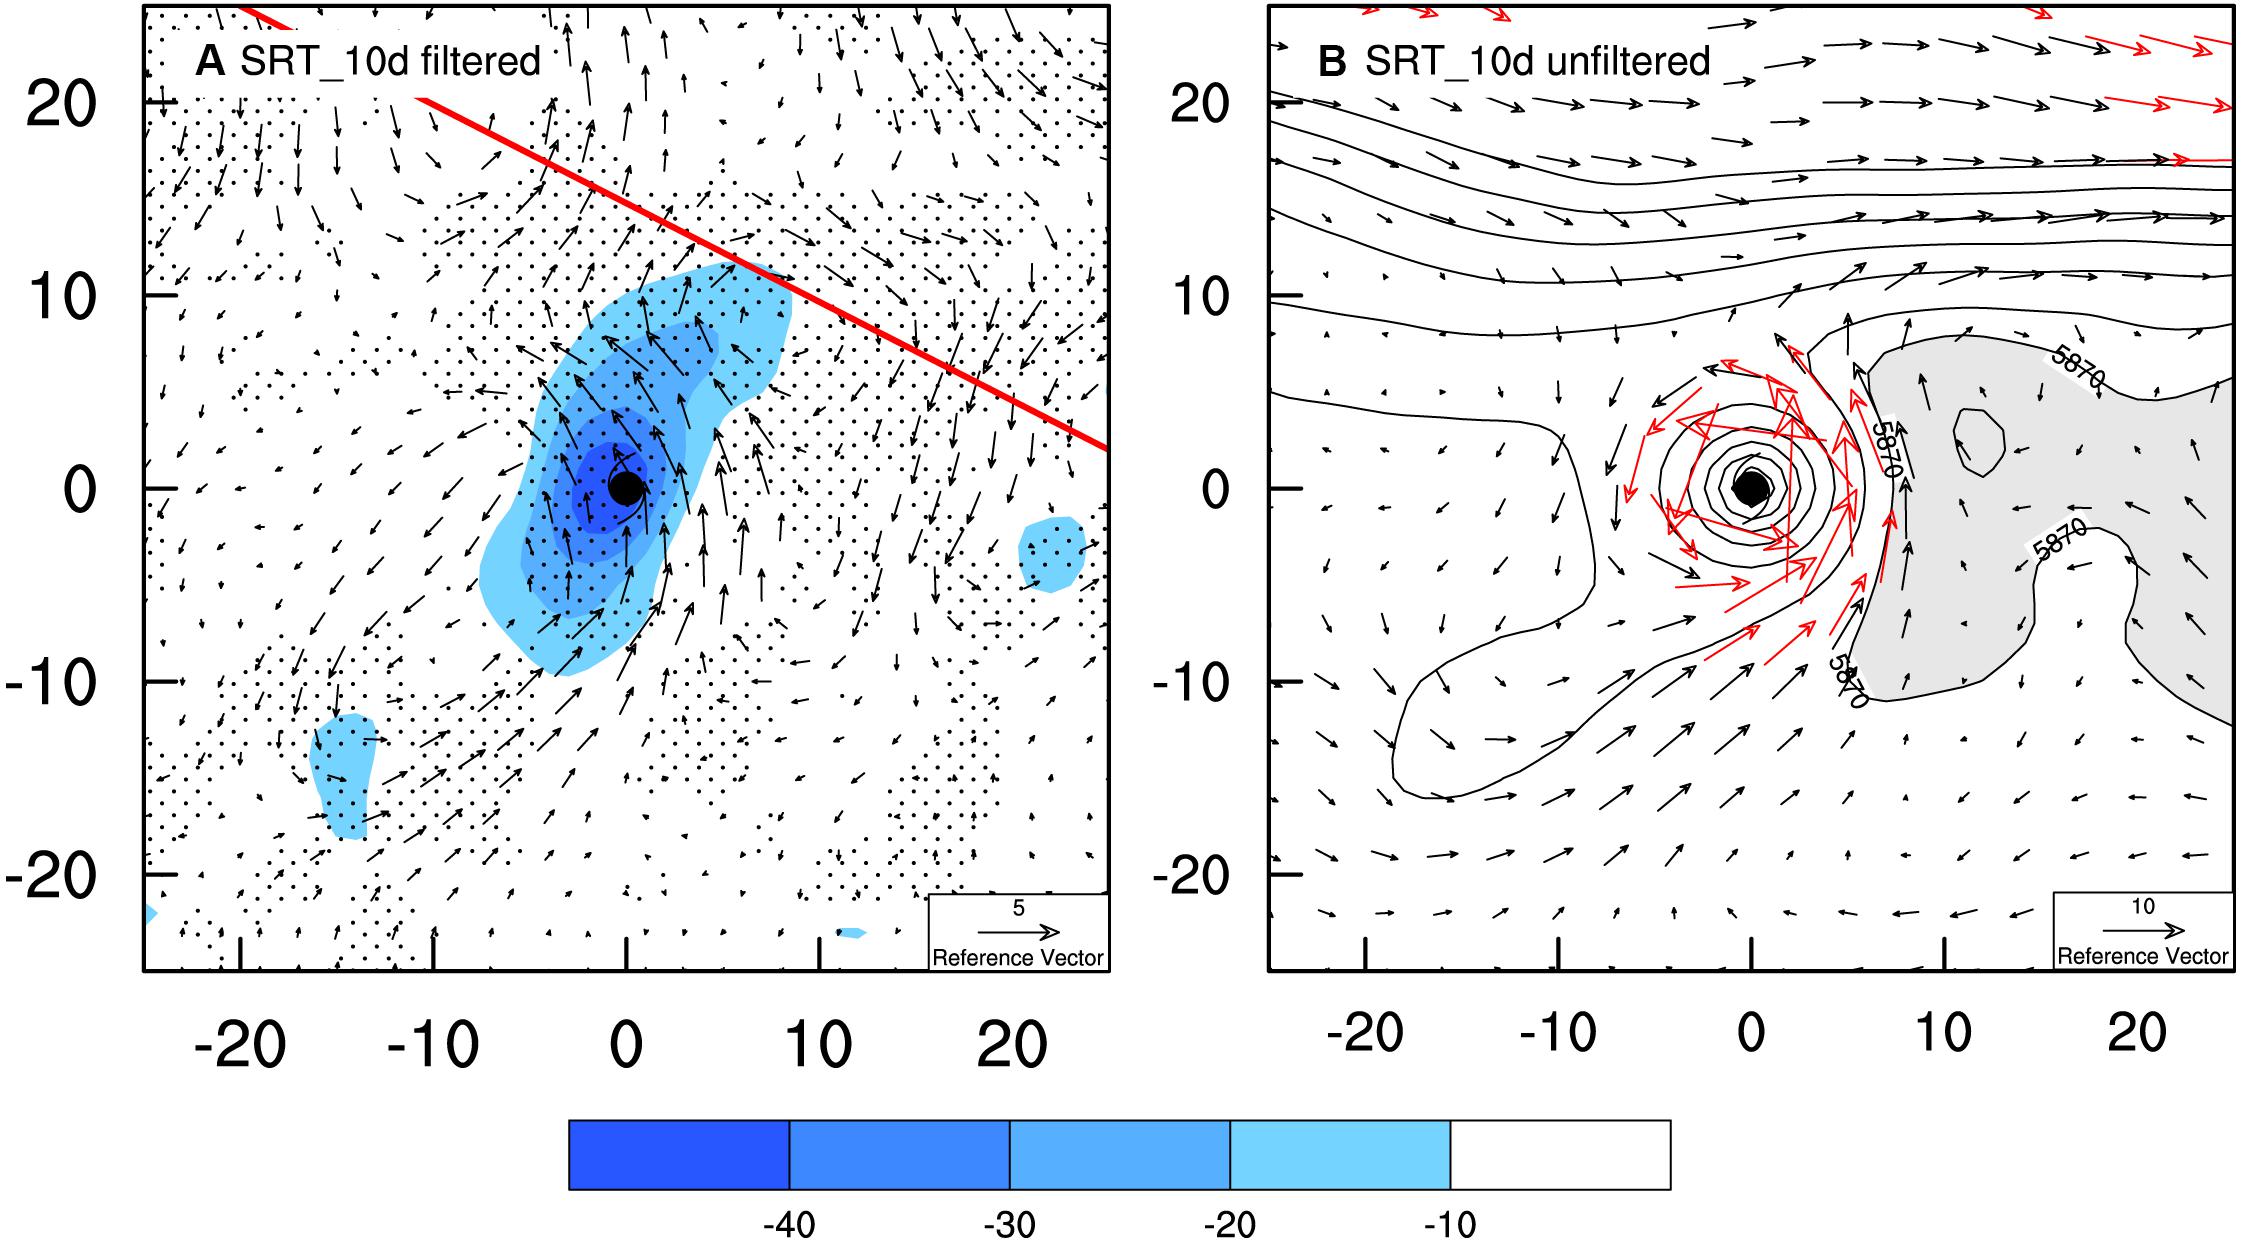
Figure 7. (A) The composite filtered deep-layer averaged winds (vector, m s–1) with the dotted area exceeding 95% significance, overlaid by the corresponding OLR field (shaded, W m–2) and (B) Unfiltered 700-hPa winds (vector, m s–1), and 500-hPa geopotential height (contour, gpm) for the R10 cases at the turning time. Red line denotes the orientation of synoptic-scale wave train. Red vectors in (B) represent wind speeds larger than 8 m s–1 and areas more than 5870 (gpm) in (B) are shaded. The coordinates are the latitudes and longitudes based on TC center.
Similar synoptic wave train feature is also found by the idealized simulation in Luo et al. (2011), who demonstrated the influence from the Rossby energy dispersion at a synoptic scale. Their results documented that, for a TC located at the southern flank of SH, the anticyclonic anomaly formed by the Rossby energy dispersion may connect with the SH system and thus increase the meridional extent of SH allowing for a poleward TC track deflection. Verified by the unfiltered large-scale environmental field in the R10 category as displayed in Figure 7B, the west Pacific SH presents an abnormal north-south extension to the east of TC circulation, producing the asymmetric southerly steering flows at 700 hPa.
In addition, previous studies also pointed out that a considerable fraction of TC movement changes can be attributed to monsoon activity and lower-frequency oscillations (Carr and Elsberry, 1995; Liang et al., 2011; Bi et al., 2015; Liang and Wu, 2015; Ge et al., 2018; Liu et al., 2019). Therefore, it is necessary to investigate the differences in ISO mode patterns affecting the SRT and SLT cases, respectively. In the R1090 category, the ISO circulation around the TC is characterized by the alternating northwest-southeast-oriented cyclonic and anticyclonic vortices (Figure 8A). The composite TC center is sandwiched by the ISO cyclonic circulation to the northwest and the ISO anticyclonic circulation to the southeast, where the strong southwesterly flows favor the TC right turning track. Corresponding to the robust southwesterly flows, the active ISO convective anomaly represented by OLR is oriented southwest-northeastward, matching the direction of TC track change. Moreover, the unfiltered circulation field shows that the SH is located on the southeastern side of the TC, and the relevant anticyclonic circulation have a considerable poleward component (Figure 8C). At the same time, the TC is embedded in a well-developed cyclonic circulation related to the deep-layer trough with the strong asymmetric southwesterlies. Such a typical circulation pattern is analogous to the MG type as described in Liang and Wu (2015) and Ge et al. (2018). As a smaller TC approaches gradually a huge MG, the energy dispersion is strengthened, and an anticyclonic anomaly is established in the southeast side of the TC. As a result, the southwesterly steering flows associated with the MG make the TC suddenly turn right.
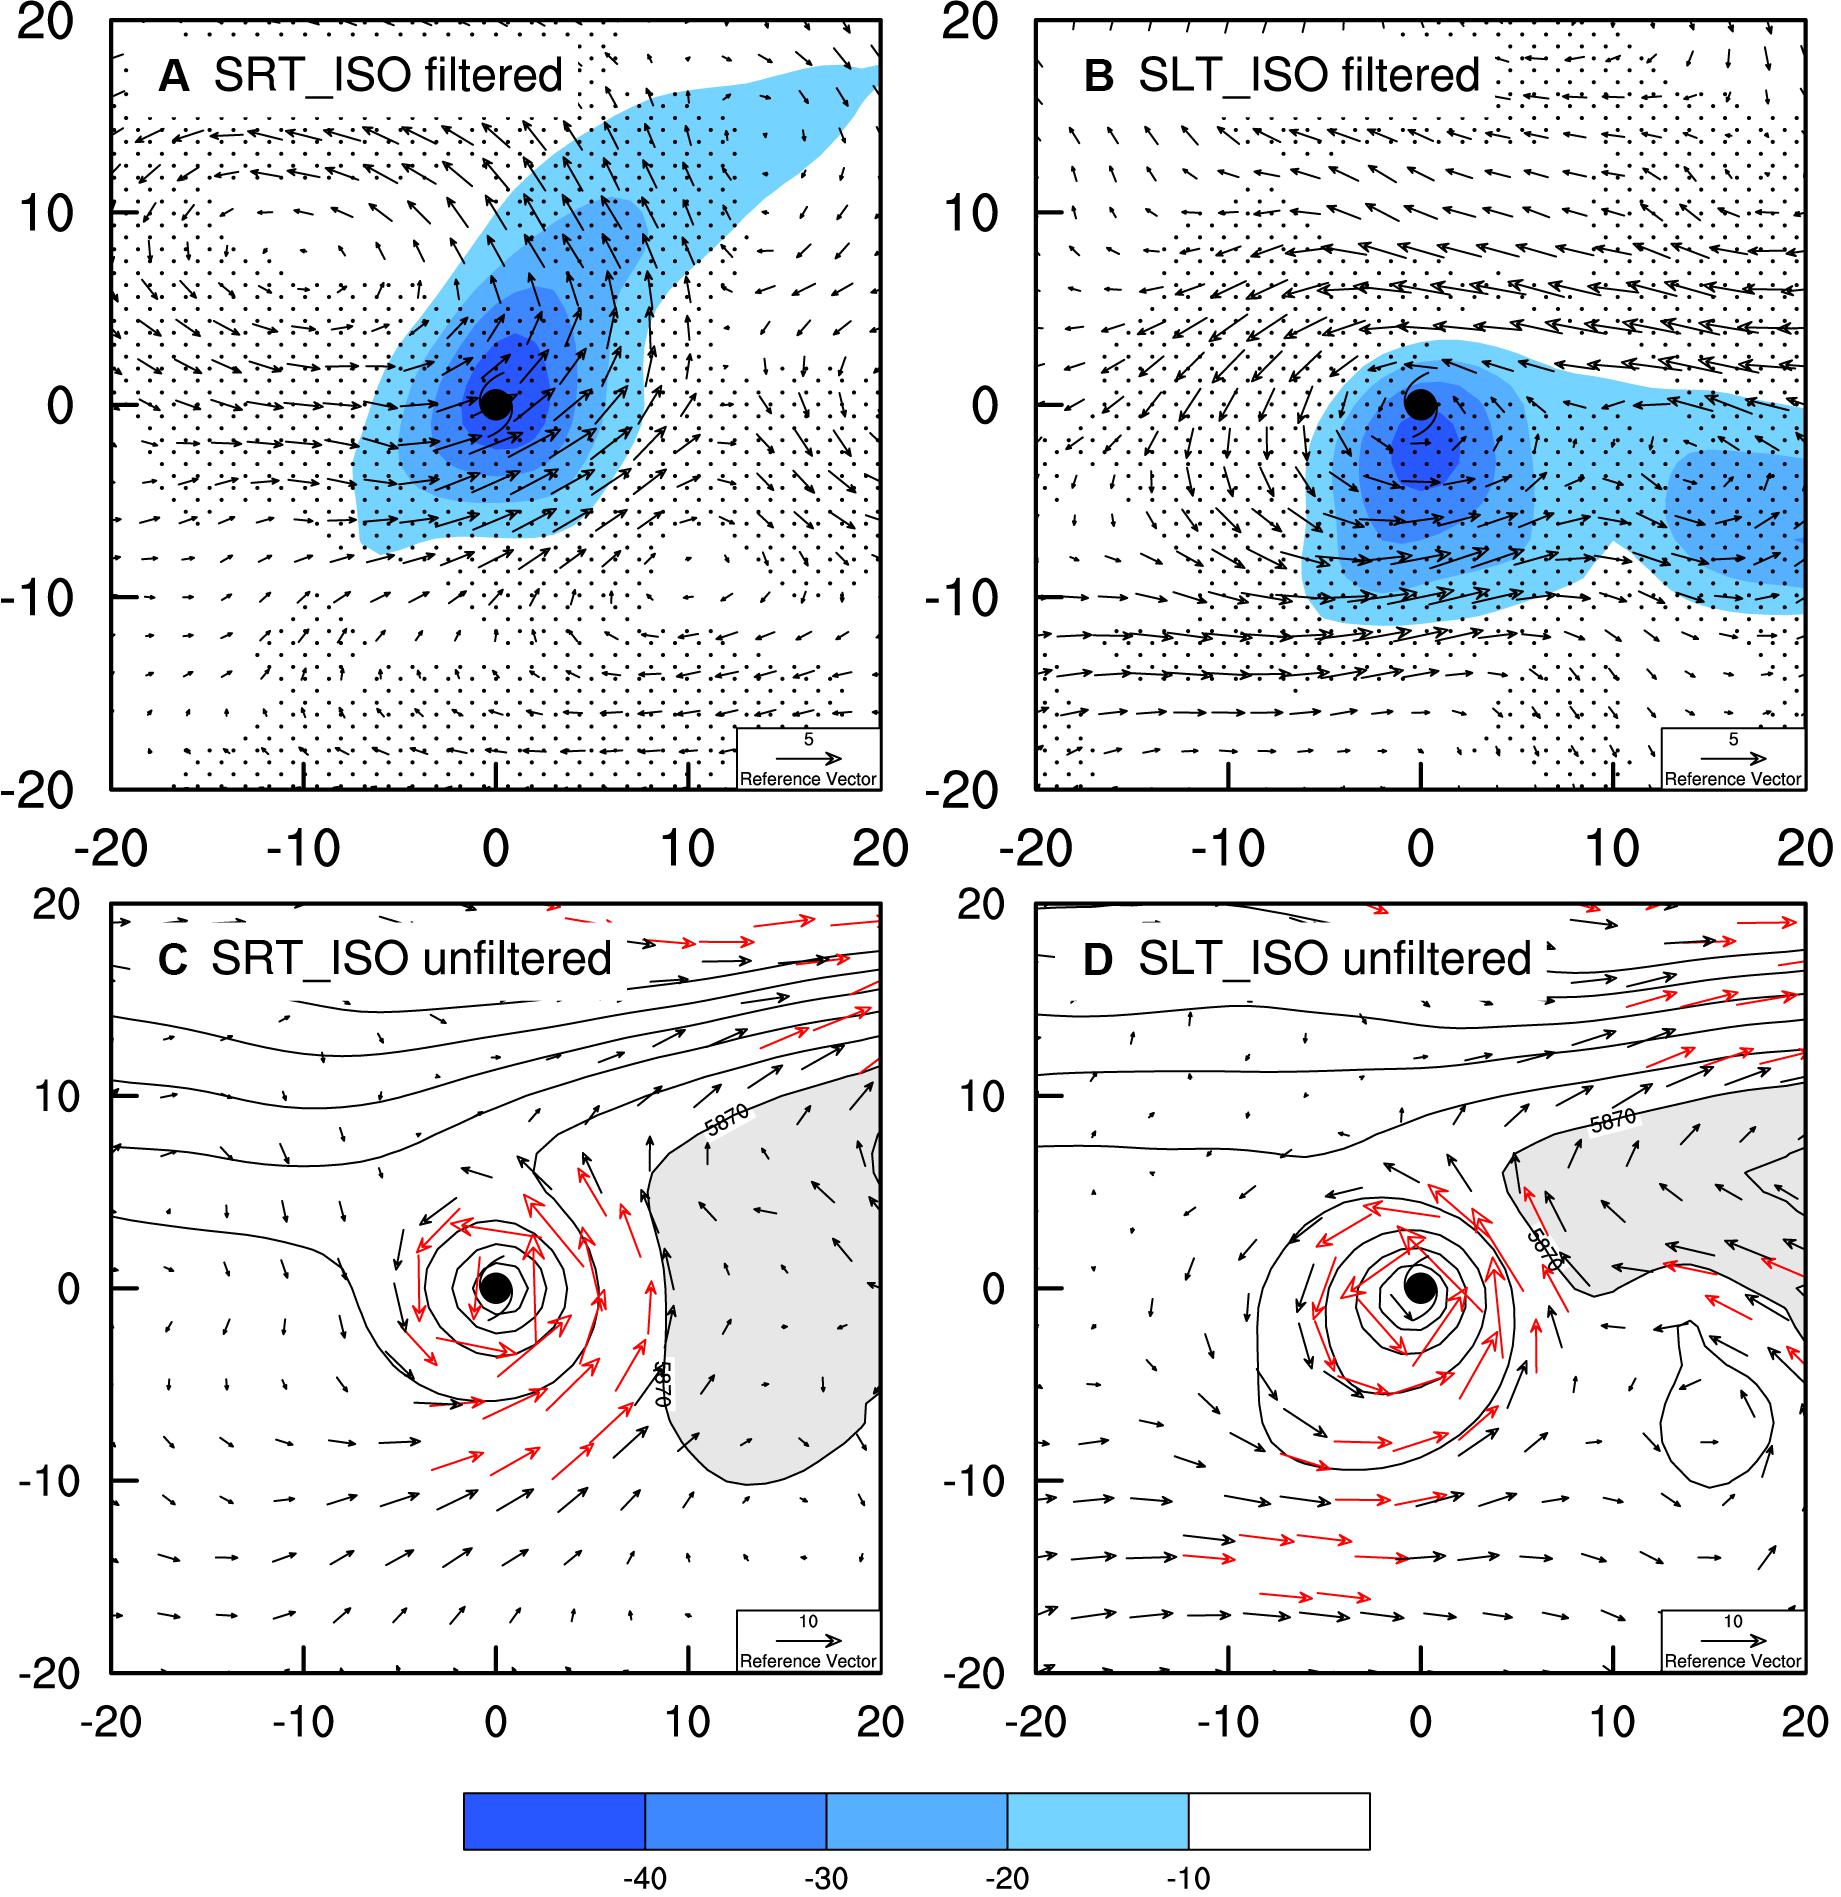
Figure 8. (A,B) The composite filtered deep-layer averaged winds (vector, m s–1) with the dotted area exceeding 95% significance, overlaid by the corresponding OLR field (shaded, W m–2) and (C,D) unfiltered 700-hPa winds (vector, m s–1), and 500-hPa geopotential height (contour, gpm) for the R1090 and L1090 cases at the turning time respectively. Red vectors in (C) and (D) represent wind speeds larger than 8 m s–1 and areas more than 5870 (gpm) in (C) and (D) are shaded. The coordinates are the latitudes and longitudes based on TC center.
Composite analysis for the ISO wave mode affecting the SLT cases is also conducted. It is clear that the TC center is situated in the northwest of ISO-related cyclonic circulation that is zonally elongated, where the northeasterly flows are predominant (Figure 8B). The unfiltered fields in the SLT cases are distinct from those in the SRT (c.f., Figures 8C,D). To the east of TC, the SH takes on a more zonal pattern in the SLT cases compared with that in the SRT cases. The southwesterly flows are weakened while the easterly flows to the north of TC center become enhanced, in good agreement with the track left turning.
To sum up, a southeast-northwest-oriented circulation dipole characterizes the ISO pattern for R1090 cases. The TC located between the two dipole components encounters the uniform southwesterly anomalies, which are more likely to turn TC track right. In contrast, the SLT events in the L1090 category tend to occur on the northwest flank of a zonally-elongated ISO cyclonic circulation. During the period of track change, the different orientations of R1090 and L1090 TCs relative to the ISO circulation are in good agreement with the statistics of TC turning latitude shown in Figure 3A, in which about 75% SRT (SLT) cases dominated by ISO wave mode turn abruptly to the south (north) of 21°N. In addition, the southeast-northwest-oriented circulation dipole for R1090 cases is similar with the northwestward-propagating bi-weekly oscillation (BWO) and the large zonally-elongated ISO cyclone for L1090 shows one more eastward-propagating MJO-scale pattern, as mentioned in the previous research (Gao and Li, 2011; Liang et al., 2011; Wu et al., 2011). It reveals that a TC experiencing more influence from the BWO (MJO) wave mode lead to a northward (westward) deflection.
The statistics also showed that about 33% of sudden track events over the WNP can be affected by the background flows with the timescale more than 90 days (Figure 2A). Therefore, the background patterns responsible for the R90 and L90 cases are further explored, respectively. Figure 9 performs a composite analysis for the cases with abrupt track changes dominated by the background field. The TCs in the R90 group tend to be situated in the region where the southwesterly flows in the western flank of the large-scale anticyclonic circulation are confluent with the westerly flows to the north. As a result, the SRT tracks are more likely to occur due to the vigorous southwesterly steering flows (Figure 9A). Moreover, the unfiltered environmental field illustrates that TC is anchored to the northwest of a large anticyclone, and the lower-level flows are enhanced between them, leading to the TC subsequent northeastward movement (Figure 9C). As found in Liu et al. (2018), the seasonal mean steering flows associated with the northward-moving tracks are primarily dependent on the location and intensity of the SH. The strengthened northerly steering flows east of 120°E and weakened easterly steering flows due to the eastward retreat SH favor more frequent northward tracks, similar to the atmospheric background pattern at the turning time as shown in Figures 9A,C.
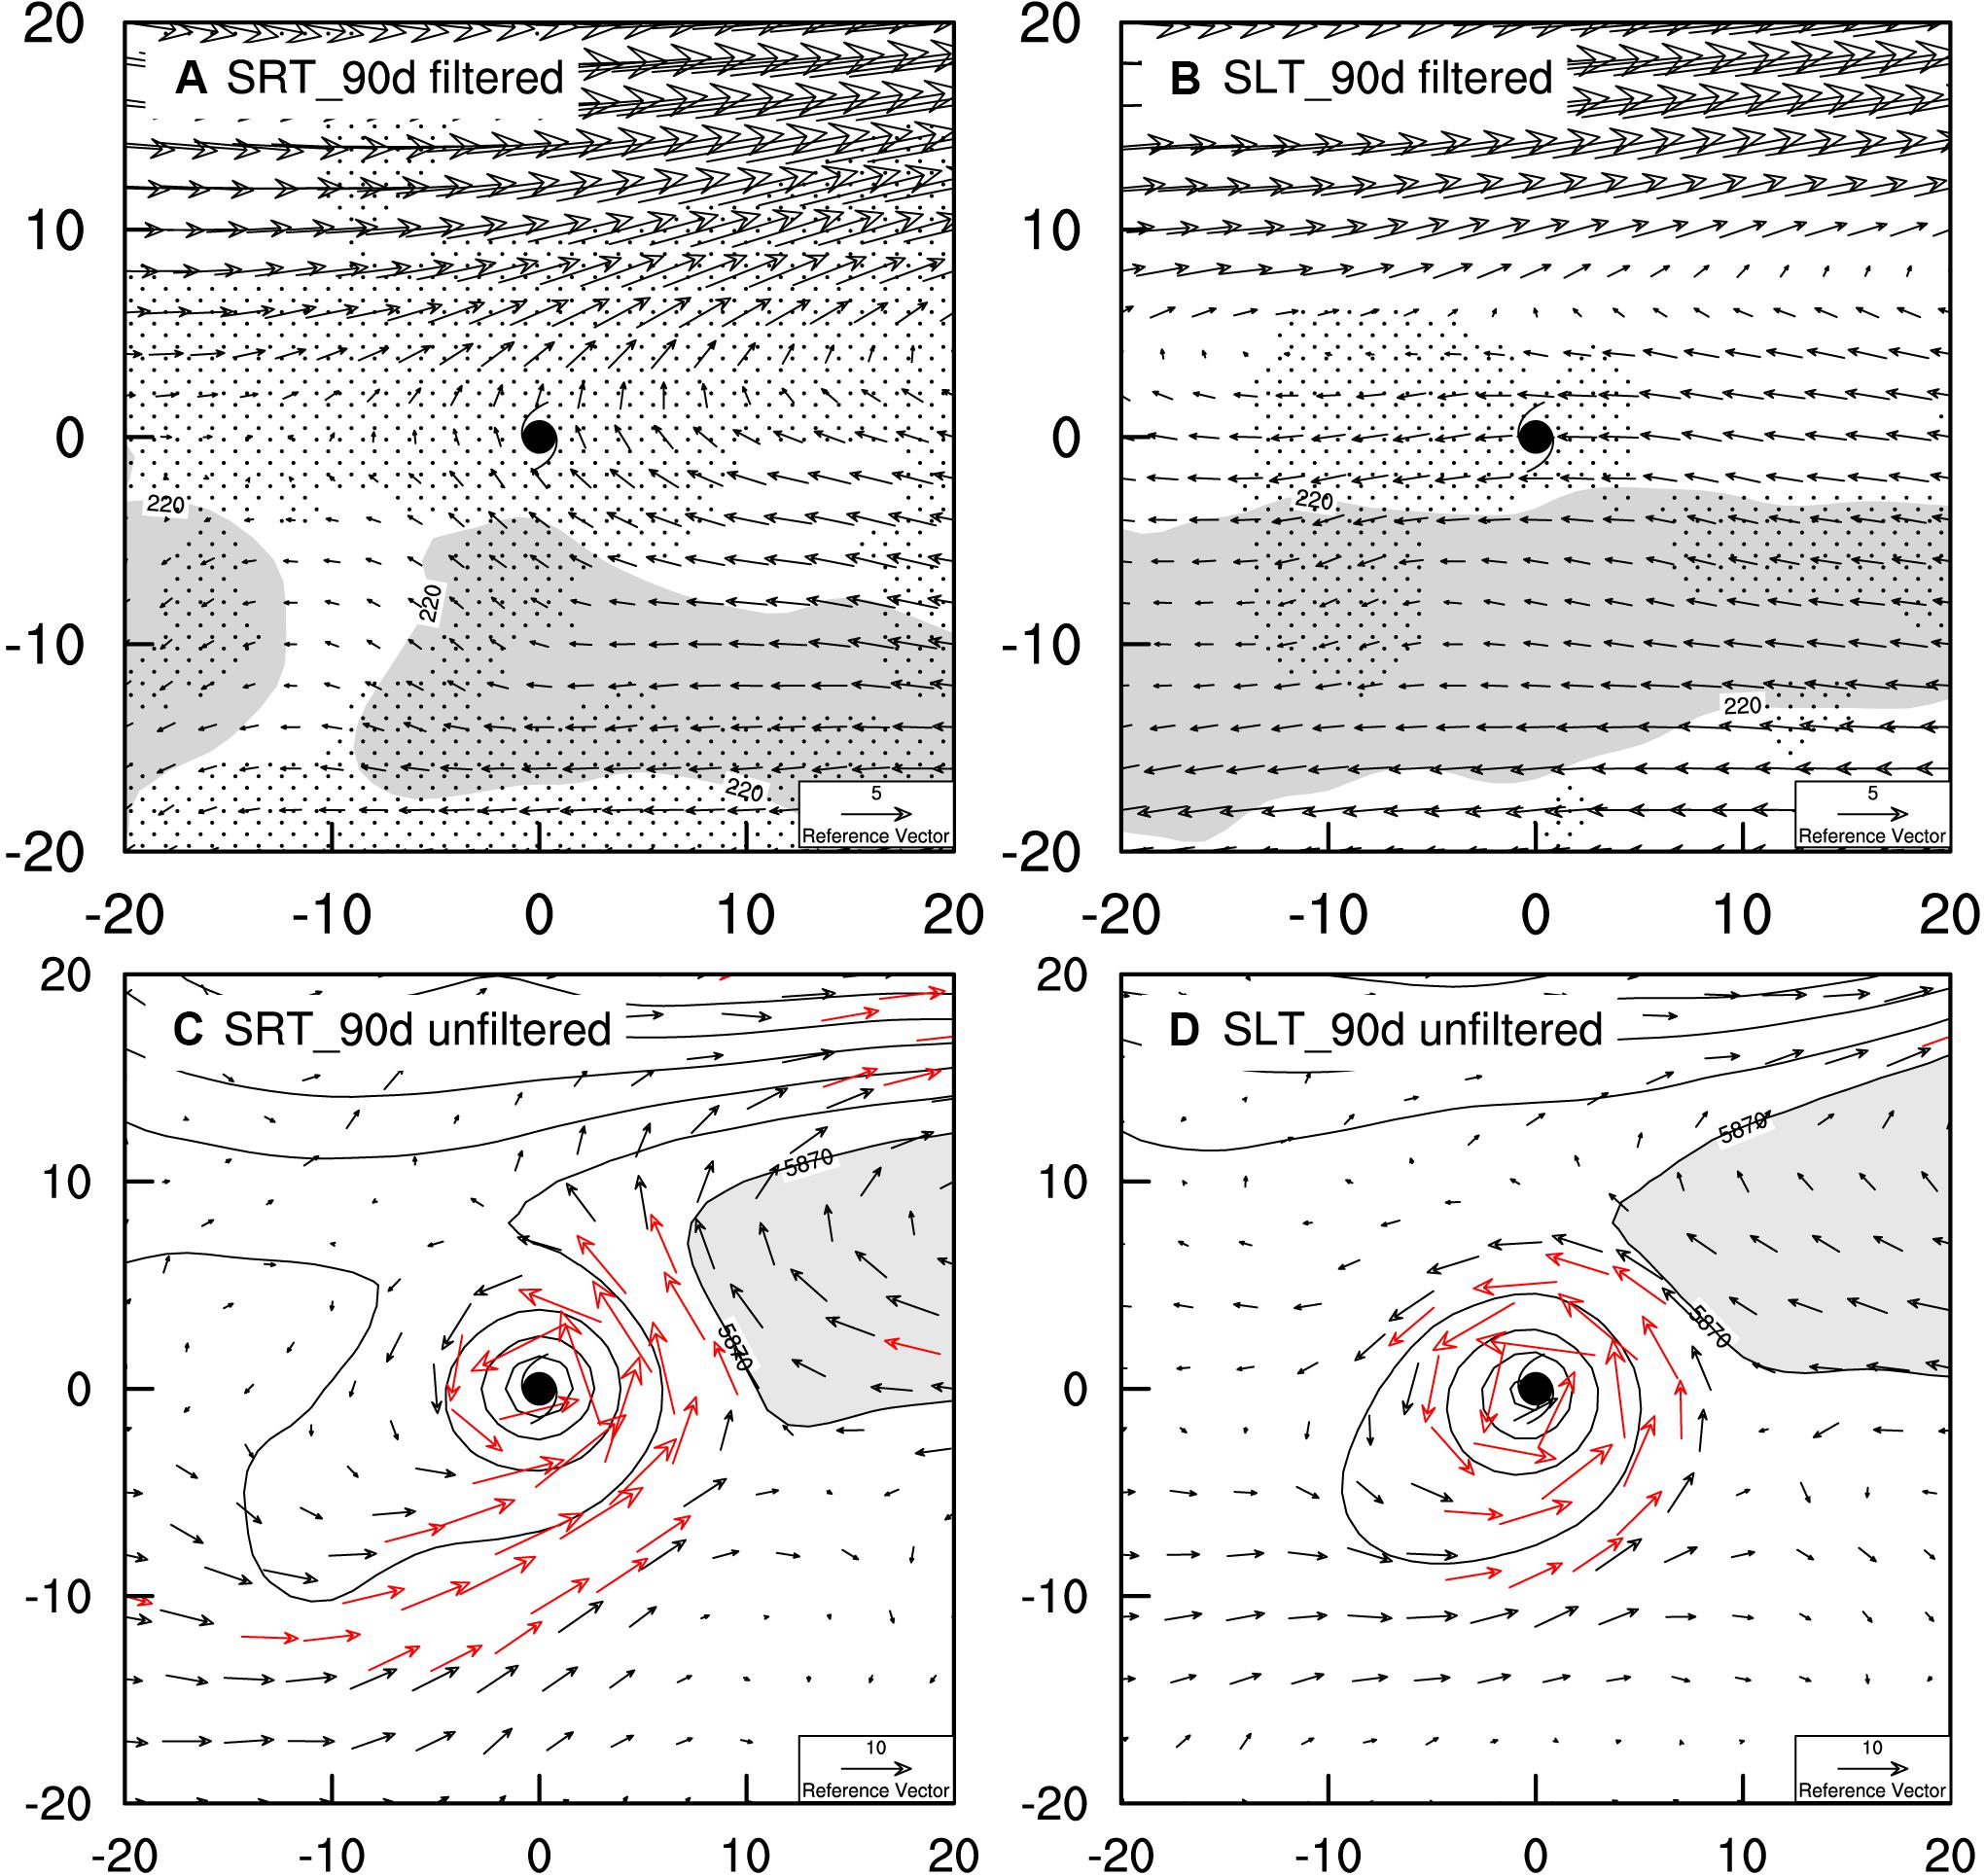
Figure 9. (A,B) The composite filtered deep-layer averaged winds (vector, m s–1) with the dotted area exceeding 95% significance, overlaid by the corresponding OLR field (shaded, W m–2) and (C,D) unfiltered 700-hPa winds (vector, m s–1), and 500-hPa geopotential height (contour, gpm) for the R90 and L90 cases at the turning time respectively. The gray areas in (A) and (B) indicate the corresponding filtered OLR less than 220 W m–2. Red vectors in (C) and (D) represent wind speeds larger than 8 m s–1 and areas more than 5870 (gpm) in (C) and (D) are shaded. The coordinates are the latitudes and longitudes based on TC center.
However, in the L90 cases, TC is mainly guided by the statistically significant easterly flows from the bottom of a zonally elongated anticyclonic circulation to the north (Figure 9B). Besides, the unfiltered atmospheric pattern features a zonal extension of the SH to the north of TC and hence the northerly winds on the north side of TC are enhanced, contributing to the SLT tracks (Figure 9D). It is noted that the TCs in L90 group generally occur to the south of 20°N (Figures 1B, 3A). Therefore, the mean background flow in this circumstance dominates the TC track anti-clockwise deflection mainly by the uniform trade easterlies at the lower latitudes and a stable westward extended anti-cyclonic circulation on the northern side of the TC.
Summary
In this study, the statistics of the TCs with sudden track changes during the period of May to November in 2000–2019 over the WNP are investigated. On the basis of the different sudden track types and dominant wave modes, five main categories are classified including three types of SRT cases dominated by the synoptic-scale, ISO, and background wave modes and two kinds of SLT cases dominated by the ISO and background wave modes. Composite analysis was performed to explore the influences of multi-timescale waves on the TC sudden track changes.
The comparison of the composite unfiltered fields of the SRT and SLT track types indicates that the SRT track is generally accompanied by the continuous deepening of the mid-to-upper tropospheric trough, the weakening and eastward retreat of the SH, which results in the strengthening of the asymmetric southwesterly jet around TC center and thus promotes the SRT track. In contrast, the SLT cases have the stronger easterly steering flows to the north of TC center, which is due to the increased meridional pressure gradient between the monsoon trough and the SH.
The composite analysis of filtered and unfiltered environmental fields for the five TC categories is carried out to investigate the individual roles of five types of waves during the abrupt TC track changes. For the R10 cases, the composite field features a synoptic-scale northwest-southeast-oriented wave train to the northeast of the TC, inducing the significant southerly flows in the vicinity of TC center accounting for the TC sudden northward turning. The orientation of active convection is basically aligned with the movement of the TC and the direction of the steering flow.
In terms of the ISO wave mode, it is found that the large-scale ISO wave mode takes quite different effects on the SRT and SLT cases. For the SRT cases, there exists a southeast-northwest-oriented circulation dipole at the turning period, the TC of R1090 group located between the two dipole components is steered by the uniform southwesterly anomalies, which may be related to the enhanced energy dispersion in the southeastern side. In contrast, the SLT events in the L1090 group are more likely to occur on the northwest flank of a zonally-elongated ISO cyclonic circulation and be steered by the strengthen northeasterly flows.
Finally, for the R90 cases dominated by the basic background flows, the TCs are situated on the western flank of the broad anticyclonic flows related to the eastward retreat of the SH and have the tendency to turn northward. For the L90 cases, the TCs are located to the south of the zonally-extended SH and the uniformly trade easterly steering flows exist around the TC center. Besides, the L90 TCs tend to occur at the lower latitude than the L1090 cases.
In conclusion, no matter what sudden track changing type, there are multiple timescale wave modes pose the influences on TC motion over the WNP. By the identification of dominant wave mode during the TC sudden turning process, the linkage between the historical TC sudden tracks and the distinct time-scale tropical wave modes become more direct and clearer. However, the results in this study root from the observational statistical analysis and need be confirmed by the diagnosis analysis and the sensitivity experiments in the numerical model.
It is indispensable to provide an insightful explanation for the sudden track changes affected by different dominant wave modes occurring in different region of WNP. There are a number of previous studies focusing on the interaction between TC motion and baroclinic environment, in which TC movement is explained by PV tendency (Wu and Wang, 2000; Chan et al., 2002; Sun et al., 2015; Wu and Chen, 2016). The PV tendency diagnoses generally emphasize the contribution of the horizonal advection and diabatic heating. Hence, further diagnosis analysis and model stimulation need to be applied to find out the baroclinic interaction associated with TC unusual motion and different wave modes, especially for the SLT cases, which are rare and less concerned in previous studies.
Data Availability Statement
Publicly available datasets were analyzed in this study. This data can be found here: https://psl.noaa.gov/data/gridded/data.olrcdr.interp.html, https://rda.ucar.edu/datasets/ds083.2/#!access, and http://www.jma.go.jp/jma/jma-eng/jma-center/rsmc-hp-pub-eg/besttrack.html.
Author Contributions
XB, GC, and WZ contributed to conception and design of the study. XB, DS, and KW organized the database and performed the relevant analysis. XB wrote the first draft of the manuscript. All authors contributed to manuscript revision, read, and approved the submitted version.
Funding
This work was jointly supported by the National Natural Science Foundation of China (Grants 41775063 and 41975071).
Conflict of Interest
The authors declare that the research was conducted in the absence of any commercial or financial relationships that could be construed as a potential conflict of interest.
References
Bi, M., Li, T., Peng, M., and Shen, X. (2015). Interactions between typhoon Megi (2010) and a low-frequency monsoon gyre∗. J. Atmos. Sci. 72, 2682–2702. doi: 10.1175/jas-d-14-0269.1
Camargo, S. J., Robertson, A. W., Gaffney, S. J., Smyth, P., and Ghil, M. (2007a). Cluster analysis of typhoon tracks. Part I: general Properties. J. Clim. 20, 3654–3676. doi: 10.1175/jcli4203.1
Camargo, S. J., Robertson, A. W., Gaffney, S. J., Smyth, P., and Ghil, M. (2007b). Cluster analysis of typhoon tracks. Part II: large-scale circulation and ENSO. J. Clim. 20, 3654–3676.
Sun, Y., Zhong, Z., Yi, L., Li, T., Chen, M., Wan, H., et al. (2015). Dependence of the relationship between the tropical cyclone track and western Pacific subtropical high intensity on initial storm size: a numerical investigation. J. Geophys. Res. Atmos. 120, 11,451–11,411. doi: 10.1002/2015jd023716
Carr, L. E., and Elsberry, R. L. (1995). Monsoonal interactions leading to sudden tropical cyclone track changes. Mon. Wea. Rev. 123, 265–289. doi: 10.1175/1520-04931995123<0265:miltst<2.0.co;2
Chan, J. C., Gray, W. M., and Kidder, S. Q. (1980). Forecasting tropical cyclone turning motion from surrounding wind and temperature fields. Mon. Wea. Rev. 108, 778–792. doi: 10.1175/1520-0493(1980)108<0778:ftctmf>2.0.co;2
Chan, J. C., Ko, F. M., and Lei, Y. M. (2002). Relationship between potential vorticity tendency and tropical cyclone motion. J. Atmos. Sci. 59, 1317–1336. doi: 10.1175/1520-0469(2002)059<1317:rbpvta>2.0.co;2
Chang, C. P., Chen, J. M., Harr, P. A., and Carr, L. E. (1996). Northwestward-propagating wave patterns over the tropical western north Pacific during summer. Mon. Wea. Rev. 124, 2245–2266. doi: 10.1175/1520-0493(1996)124<2245:npwpot>2.0.co;2
Chen, T. C., Wang, S. Y., Yen, M. C., and Clark, A. J. (2009). Impact of the intraseasonal variability of the western north pacific large-scale circulation on tropical cyclone tracks. Wea. Forec. 24, 646–666. doi: 10.1175/2008waf2222186.1
Duchon, C. E. (1979). Lanczos filtering in one and two dimensions. J. Appl. Meteorol. 18, 1016–1022. doi: 10.1175/1520-0450(1979)018<1016:lfioat>2.0.co;2
Elsberry, R. L. (2004). “Monsoon-related tropical cyclones in EAST ASIA,” in East Asian Monsoon, ed. C. P. Chang (Singapor: World Scientific Publishing), 463–498. doi: 10.1142/9789812701411_0013
Gao, J., and Li, T. (2011). Factors controlling multiple tropical cyclone events in the western north pacific. Mon. Wea. Rev. 139, 885–894. doi: 10.1175/2010mwr3340.1
Ge, X., Yan, Z., Peng, M., Bi, M., and Li, T. (2018). Sensitivity of tropical cyclone track to the vertical structure of a nearby monsoon gyre. J. Atmos. Sci. 75, 2017–2028. doi: 10.1175/jas-d-17-0201.1
Gong, Y., Li, Y., and Zhang, D. L. (2018). A statistical study of unusual tracks of tropical cyclones near Taiwan Island. J. Appl. Meteorol. Climatol. 57, 193–206. doi: 10.1175/jamc-d-17-0080.1
Gray, W. (1989). Summary of ONR Sponsored Tropical Cyclone Motion Research and Future Plans, Appendix D of Tech. Report No. NPS 63-89-002. Vol. 93943. Montery:. Naval Postgraduate School, 68–79.
Guard, C. (1983). “Monsoonal influences on unusual development and movement of tropical cyclones,” in Proceeding. Tropical Cyclone Conference, (Baguio: Republic of the Philippines, Environmental Group Pacific Command), 157–180.
Harr, P. A., and Elsberry, R. L. (1991). Tropical cyclone track characteristics as a function of large-scale circulation anomalies. Mon. Wea. Rev. 119, 1448–1468. doi: 10.1175/1520-0493(1991)119<1448:tctcaa>2.0.co;2
Harr, P. A., and Elsberry, R. L. (1995). Large-scale circulation variability over the tropical western North Pacific. Part II: persistence and transition characteristics. Mon. Wea. Rev. 123, 1247–1268. doi: 10.1175/1520-04931995123<1247:lscvot<2.0.co;2
Hsu, H.-H., Hung, C.-H., Lo, A.-K., Wu, C.-C., and Hung, C.-W. (2008). Influence of tropical cyclones on the estimation of climate variability in the tropical western North Pacific. J. Clim. 21, 2960–2975. doi: 10.1175/2007jcli1847.1
Ko, K.-C., and Hsu, H.-H. (2006). Sub-monthly circulation features associated with tropical cyclone tracks over the East Asian monsoon area during July-August season. J. Meteorol. Soc. Jpn. Ser. II 84, 871–889. doi: 10.2151/jmsj.84.871
Ko, K.-C., and Hsu, H.-H. (2009). ISO modulation on the submonthly wave pattern and recurving tropical cyclones in the tropical western North Pacific. J. Clim. 22, 582–599. doi: 10.1175/2008jcli2282.1
Kurihara, Y., Bender, M. A., and Ross, R. J. (1993). An initialization scheme of hurricane models by vortex specification. Mon. Wea. Rev. 121, 2030–2045. doi: 10.1175/1520-0493(1993)121<2030:aisohm>2.0.co;2
Kurihara, Y., Bender, M. A., Tuleya, R. E., and Ross, R. J. (1995). Improvements in the GFDL hurricane prediction system. Mon. Wea. Rev. 123, 2791–2801. doi: 10.1175/1520-0493(1995)123<2791:iitghp>2.0.co;2
Lander, M. A. (1996). Specific tropical cyclone track types and unusual tropical cyclone motions associated with a reverse-oriented monsoon trough in the western North Pacific. Wea. Forec. 11, 170–186. doi: 10.1175/1520-0434(1996)011<0170:stctta>2.0.co;2
Lau, K.-H., and Lau, N.-C. (1990). Observed structure and propagation characteristics of tropical summertime synoptic scale disturbances. Mon. Wea. Rev. 118, 1888–1913. doi: 10.1175/1520-0493(1990)118<1888:osapco>2.0.co;2
Liang, J., and Wu, L. (2015). Sudden track changes of tropical cyclones in monsoon gyres: full-physics, idealized numerical experiments∗. J. Atmos. Sci. 72, 1307–1322. doi: 10.1175/jas-d-13-0393.1
Liang, J., Wu, L., Ge, X., and Wu, C.-C. (2011). monsoonal influence on typhoon morakot (2009). Part II: numerical study. J. Atmos. Sci. 68, 2222–2235. doi: 10.1175/2011jas3731.1
Liu, Q., Li, T., and Zhou, W. (2018). Impact of 10–60-day low-frequency steering flows on straight northward-moving typhoon tracks over the Western North Pacific. J. Meteorol. Res. 32, 394–409. doi: 10.1007/s13351-018-7035-8
Liu, Q., Zhou, W., Peng, M., and Li, T. (2019). Factors controlling northward and north-eastward moving tropical cyclones near the coast of East Asia. Front. Earth Sci. 13:778–790. doi: 10.1007/s11707-019-0797-1
Luo, Z., Davidson, N. E., Ping, F., and Zhou, W. (2011). Multiple-scale interactions affecting tropical cyclone track changes. Adv. Mech. Eng. 2011, 1–9.
Magnusson, L., Doyle, J. D., Komaromi, W. A., Torn, R. D., Tang, C. K., Chan, J. C. L., et al. (2019). Advances in understanding difficult cases of tropical cyclone track forecasts. Trop. Cyclone Res. Rev. 8, 109–122. doi: 10.1016/j.tcrr.2019.10.001
Miller, R. J., Tsui, T. L., and Schrader, A. J. (1988). Climatology of North Pacific Tropical Cyclone Tracks. NAVENVPREDRSCHFAC Tech. Report No. TR88-10. Monterey, CA: Naval Oceanographic and Atmospheric Research Laboratory, 511
Rappaport, E. N., Franklin, J. L., Avila, L. A., Baig, S. R., Beven, J. L., Blake, E. S., et al. (2009). Advances and challenges at the National Hurricane Center. Wea. Forec. 24, 395–419.
Shi, W., Fei, J., Huang, X., Cheng, X., Ding, J., and He, Y. (2014). A numerical study on the combined effect of midlatitude and low-latitude systems on the abrupt track deflection of typhoon Megi (2010). Mon. Wea. Rev. 142, 2483–2501. doi: 10.1175/mwr-d-13-00283.1
Wu, C.-C., Chen, S.-G., Chen, J.-H., Chou, K.-H., and Lin, P.-H. (2009). Interaction of Typhoon Shanshan (2006) with the midlatitude trough from both adjoint-derived sensitivity steering vector and potential vorticity perspectives. Mon. Wea. Rev. 137, 852–862. doi: 10.1175/2008mwr2585.1
Wu, C. C., Huang, T. S., Huang, W. P., and Chou, K. H. (2003). A new look at the binary interaction: potential vorticity diagnosis of the unusual southward movement of Tropical Storm Bopha (2000) and its interaction with Supertyphoon Saomai (2000). Mon. Wea. Rev. 131, 1289–1300. doi: 10.1175/1520-04932003131<1289:anlatb<2.0.co;2
Wu, C.-C., Yen, T.-H., Kuo, Y.-H., and Wang, W. (2002). Rainfall simulation associated with Typhoon Herb (1996) near Taiwan. Part I: the topographic effect. Wea. Forec. 17, 1001–1015. doi: 10.1175/1520-0434(2003)017<1001:rsawth>2.0.co;2
Wu, L., and Chen, X. (2016). Revisiting the steering principal of tropical cyclone motion in a numerical experiment. Atmos. Chem. Phys. 16, 14925–14936. doi: 10.5194/acp-16-14925-12016
Wu, L., Liang, J., and Wu, C.-C. (2011). Monsoonal influence on typhoon morakot (2009). Part I: observational analysis. J. Atmos. Sci. 68, 2208–2221. doi: 10.1175/2011jas3730.1
Wu, L., Ni, Z., Duan, J., and Zong, H. (2013). Sudden tropical cyclone track changes over the western north pacific: a composite study. Mon. Wea. Rev. 141, 2597–2610. doi: 10.1175/mwr-d-12-00224.1
Keywords: tropical cyclone, sudden track, multi-timescale wave, statistical study, dynamical process
Citation: Bi X, Chen G, Shi D, Wang K and Zhou W (2020) A Statistical Analysis of the Influences of Multi-Timescale Waves on Tropical Cyclone Sudden Track Changes Over the Western North Pacific. Front. Earth Sci. 8:309. doi: 10.3389/feart.2020.00309
Received: 10 April 2020; Accepted: 30 June 2020;
Published: 17 July 2020.
Edited by:
Ruifen Zhan, Fudan University, ChinaReviewed by:
Jienyi Tu, National Changhua University of Education, TaiwanSi Gao, Sun Yat-sen University, China
Copyright © 2020 Bi, Chen, Shi, Wang and Zhou. This is an open-access article distributed under the terms of the Creative Commons Attribution License (CC BY). The use, distribution or reproduction in other forums is permitted, provided the original author(s) and the copyright owner(s) are credited and that the original publication in this journal is cited, in accordance with accepted academic practice. No use, distribution or reproduction is permitted which does not comply with these terms.
*Correspondence: Guanghua Chen, Y2doQG1haWwuaWFwLmFjLmNu