 M. A. Gilbertson
 A. Taylor2
 S. J. Mitchell
 A. C. Rust
- 1School of Civil, Aerospace, and Mechanical Engineering, University of Bristol, Bristol, United Kingdom
- 2School of Earth Sciences, University of Bristol, Bristol, United Kingdom
Heating of water under hot pyroclastic flow deposits can drive hydroeruptions, forming craters and aprons of secondary deposits. According to the established conceptual model, steam pressure builds until failure of the pyroclastic overburden and a relatively low permeability (fine-grained) cap promotes secondary explosions. We explore a complementary model where the stress from drag related to gas flow up through the particle interstices is comparable in magnitude to the static pressure difference between the base and the top of the pyroclastic flow deposit. The drag force supports (part of) the weight of the particles and so reduces inter-particle friction; in a mono-sized bed this friction is effectively eliminated at the “minimum fluidisation velocity,” which depends on the size and density of the particles. Through analogue experiments we show that violent outbursts can be generated when there are vertical variations in the minimum fluidisation velocities of granular materials. We ran experiments with layers of particles with different sizes or size distributions (bi-modal with different proportions of fine and coarse particles) in a tank with a porous base that allowed a distributed upward airflow through them. A finer-grained layer capping a coarser layer does not generate jets of particles or craters; rather, increased gas flux leads to fluidisation of first the fine and then the coarse (lower) layer. However, when the upper layer is coarser, the bed domes upward as a gas pocket grows within the finer layer for some combinations of layer thicknesses and grain sizes. When the gas pocket penetrates the top of the bed, it forms a crater and erupts particles. The gas velocity when doming initiates is greater than that calculated for the weight of the top layer to be balanced by drag and the pressure difference across that layer. This discrepancy is explained by the layers having a strength (from inter-particle friction), which is consistent with the observed dependence of the initiation velocity on the absolute thickness of the layer. Using data from Mt St Helens 1980 deposits, we show that the drag-related trigger observed in the laboratory is a feasible mechanism for secondary hydroeruptions through pyroclastic flow deposits.
1. Introduction
Pyroclastic flows are currents of hot particles and gases which travel down valleys and spread laterally under gravity, and so are often deposited in stream-valleys and near-shore environments. Steam generated by heating surface water or shallow groundwater under a pyroclastic deposit may escape passively via fumaroles or diffusively through the permeable deposit; however, under some conditions the steam can drive sudden secondary eruption(s) through the primary pyroclastic flow deposit leaving craters, surge deposits and fallout from ballistics and tephra fountaining (e.g., Moyer and Swanson, 1987; Keating, 2005).
The secondary eruption craters spatially associated with water sources in historic pyroclastic flow deposits including those of Mount St Helens 1980 (e.g., Moyer and Swanson, 1987), Redoubt 1990 (Gardner et al., 1994), Mount Pinatubo 1991 (Torres et al., 1996) and Katmai (Valley of Ten Thousand Smokes) 1912 (e.g., Hildreth, 1983), suggest that it is common to form secondary hydroeruptions when hot pyroclastic flows are deposited on a wet terrestrial environment. Not only are they a hazard to people near freshly emplaced pyroclastic flows, they are a potential trigger for destabilisation and remobilisation of pyroclastic material, forming secondary flows with more distal effects: the secondary ignimbrites after the main 1991 eruption of Mount Pinatubo travelled up to 10 km and generated ash clouds up to 10 km high (Torres et al., 1996). Their common occurrence and associated hazards motivate a better understanding of mechanisms for generating secondary explosive hydroeruptions in pyroclastic flow deposits. There are likely to be multiple mechanisms; here we only consider the scenario of a non-welded pyroclastic flow deposit with an underlying water source and not any mechanisms that involve welding nor cohesion nor water gulleying down into hot pyroclastic material (e.g., Torres et al., 1996).
When a fluid (e.g., steam) source is set under a layer of granular material then fluid will flow through the layer at a rate determined by the permeability of the layer and the pressure gradient across it. If the layer is not sufficiently permeable for the flow through it to match the rate of fluid generated at the source, then the source pressure will increase until fluid leaves the source at the same rate as it is generated. The forces exerted on the granular layer by the fluid are due to both the pressure difference generated across it, which pushes up on the base of the layer, and the drag caused by the flow through it, which pushes up on particles throughout the thickness of the layer (van der Hoef et al., 2005). These forces are opposed by the weight of the granular layer and the inter-particle friction within it. When these forces are exceeded by those generated by the source, then the layer will fail.
The modelling of secondary hydroeruptions has concentrated on the build-up of pressure. Moyer and Swanson (1987) proposed what we term a “static pressure build-up” model for secondary hydroeruptions in pyroclastic flow deposits (also discussed by Keating, 2005), building on their and other's (Rowley et al., 1981) observations from Mount St Helens 1980–1981. This remains the best-documented and most-studied set of secondary hydroeruptions. Most of the secondary craters formed within a few days of the emplacement of the May 18, and to a lesser degree the June 12 1980, pyroclastic flows that were deposited on top of May 18 debris avalanche material; however, there were some secondary eruptions much later, including one in May 1981 that was filmed (Moyer and Swanson, 1987). Photographs of craters dotting the landscape and a vertical section through a crater later exposed by fluvial erosion are found in Rowley et al. (1981) and Brand et al. (2014) respectively. The craters were generally near-circular in plan, 5–100 m diameter and 1–20 m deep. There is a clear spatial association of the craters with pre-1980 stream-valleys even though the streams were disrupted by the debris avalanche. Moyer and Swanson (1987) inferred that the source of steam driving the secondary eruptions was water ponded on the debris avalanche deposit at the base of the pyroclastic flows and not deeper groundwater because the secondary eruption products are lacking in clasts of the distinctive May 18 “blast dacite” (cryptodome) from the debris avalanche under the primary pyroclastic flow deposits.
The “static pressure build-up” model (Moyer and Swanson, 1987; Keating, 2005) involves steam generation at the base of the hot pyroclastic flow deposit at a rate faster than it escapes, until the steam pressure reaches some critical value slightly exceeding lithostatic pressure (Keating, 2005), causing failure of the deposit. This failure causes rapid rise of steam, including steam flashed from water that became superheated due to the sudden decompression when the pyroclastic overburden failed. Thus factors that should control explosive vs. passive steam release include the rate of steam generation (i.e., availability of water and rate of heat transfer) and the deposit permeability, which if not welded depends on the grain size distribution and packing. Moyer and Swanson (1987) emphasise the importance of the permeability of the pyroclastic overburden in regulating the eruptive phenomena, with finer-grained, lower permeability deposits more conducive to explosive steam release; Torres et al. (1996) even suggest that a confining layer of fine ashfall can significantly inhibit the release of pore pressure in pyroclastic flow deposits. Torres et al. (1996) note that increased pore pressure within the pyroclastic flow deposit would decrease its strength, and Moyer and Swanson (1987) discuss the possibility that increased pore pressure might expand (de-compact) the pyroclastic material and so increase its permeability (with potential complex feedback if localised). However, there is no consideration of the dynamic drag force pushing up on pyroclasts throughout the deposit that is related to gas flow up though the pore space between the particles.
In this paper we explore an alternative mechanism for secondary hydroeruptions where the drag force is critical, and variations in grain size distribution of the pyroclastic flow deposit matter not because grain size affects permeability but because it affects the gas flux at which the drag force supports the weight of the particles. Using analogue experiments we show how it is possible for violent eruptions to take place in layered beds where the top layer is more permeable than the bottom when gas is passed through them. We argue that the observed behaviour is a result of the interaction between the particles and the fluid, the flow pattern induced in the bed of particles, and the collective mechanical properties of the particles. The mechanism we propose for secondary hydroeruptions has many similarities (and some differences) with that proposed by Nichols et al. (1994) to explain fluid escape structures in layered sediments in areas of rapid sedimentation in water. For both applications, it is important to understand the role of internal friction in the deformation and fluidisation of granular materials.
A granular layer can deform in response to a stress applied at a margin (e.g., pushing up on the base of the layer) because the particles transmit force to each other through friction, enabling them to behave collectively; however, it can also deform when there is a vertical fluid flow through the interstices of the granular layer owing to the drag exerted. In a bed with fluid flow up through the particles, the weight of the particles will be opposed by the drag, and so friction between particles decreases. If the particles are monosized and the flow rate is large enough to support the entire weight of the bed (the “minimum fluidisation velocity,” umf) then friction between the particles will be eliminated and the layer does not deform collectively. For a simple bed of uniform particles, umf is greater (i.e., a greater fluid velocity is needed to support the weight of the particles) for larger and/or denser particles (e.g., Rhodes, 1998).
Nichols et al. (1994) suggested that fluidisation might be an important process for the violent breaching of a layer of particles subject to a fluid flow through them. In their laboratory experiments they observed water flow up through water-saturated layered beds in which a layer of larger (or denser) particles overlaid a layer of smaller (or less dense) particles in a tank with a solid porous base to provide a distributed water source. At water velocities greater than umf of the bottom layer but less than umf of the top layer, the bottom layer divided so that a void (i.e., a pocket of water) formed between a fluidised layer of small particles at the bottom of the tank and a static layer of small particles pressed up against the base of the layer of large particles above it. In this condition, the drag exerted on the static layer of small particles exceeded that necessary to support its weight, and so this excess drag allowed these small particles to support the layer of larger particles. If the fluid velocity was increased so that the total drag on the top, composite (coarse and fine) layer exceeded its weight, the composite layer deformed until it suddenly failed, releasing a plume of particles into the water above it. Unlike secondary hydroeruptions in pyroclastic deposits, the burst-out and jetting in these experiments did not generate conical craters in the top of the granular bed.
We present new experiments that, like those of Nichols et al. (1994), involve fluid flow up through layers of particles in a tank with a porous base. However, a key difference is that the fluid is gas (air) rather than liquid water. The associated difference in buoyancy and Reynolds number will affect inter-particle forces and drag, and so the mechanical response of the layers and the fluidisation dynamics. For example, it is well-established in chemical engineering that in gas-fluidised systems, when the gas velocity exceeds umf, the excess gas flow forms bubbles that rise through the bed, whereas in liquid-fluidised beds, bubbles do not form and the bed expands when the velocity exceeds umf (Davidson and Harrison, 1963). These differences make the new experiments more relevant to secondary hydroeruptions in pyroclastic deposits.
We have kept the experiments simple in order to identify the key physical processes involved and to isolate the effects of individual factors. The goal is to test whether a fluidisation mechanism for triggering secondary hydroeruptions is feasible and not to reproduce the full dynamics of the eruptions. For example we use room-temperature air and a bed thickness of order 10 cm rather than steam and a deposit thickness of tens of metres, which means the analogue eruptions are not boosted by sudden decompression-induced flashing of superheated water to steam as in nature. A more fundamental simplification is representing the primary pyroclastic flow deposit as layers of uniform-density spheres with narrow unimodal or bimodal size distributions. Pyroclastic flow deposits often have complex vertical and lateral facies changes and broad particle size distributions from ash to blocks, and a range of clast densities from lithics to pumice. However, due to multiple flow units and pulses, as well as changes in conditions with time as the deposit is progressively aggregated, there can be sub-horizontal layers defined by changes in grain size distribution and componentry (e.g., dense lithic content) on the scale of interest to this study (e.g., tens of metres). Such layering is present in the pyroclastic flow deposits of Mount St. Helens 1980, as shown in the photographs and data from vertical sections exposed by fluvial incision presented in Brand et al. (2014). In a fluidisation mechanism for secondary hydroeruption triggering, we hypothesise that what matters is vertical variations in umf, not whether the size (or density) distribution of particles is narrow or broad. We make use of a huge body of work on fluidised beds, mostly in chemical engineering (but also in volcanology), with particles of different size, density, shape, and packing in order to relate the results of our simplified experiments to more complicated natural conditions.
2. Experimental Methods and Materials
The experiments were conducted with beds of particles in a transparent Perspex, vertical, planar (near-2D) container with a rectangular cross-section 300 mm by 8 mm as shown in Figure 1. The base was fitted with a porous plastic distributor (Vyon “D,” pore size nominally 20 μm) to ensure uniform gas distribution into the base of the bed of particles, which was fluidised using air from a central supply, controlled and metered by rotameters to a maximum accuracy of 2 mm/s for superficial gas speed in the particle bed. The upstream pressure was set by a pressure regulating valve at 1 bar. The particles were glass spheres (ballotini) with density ρp = 2, 500 kg/m3, chosen for their known and uniform properties.
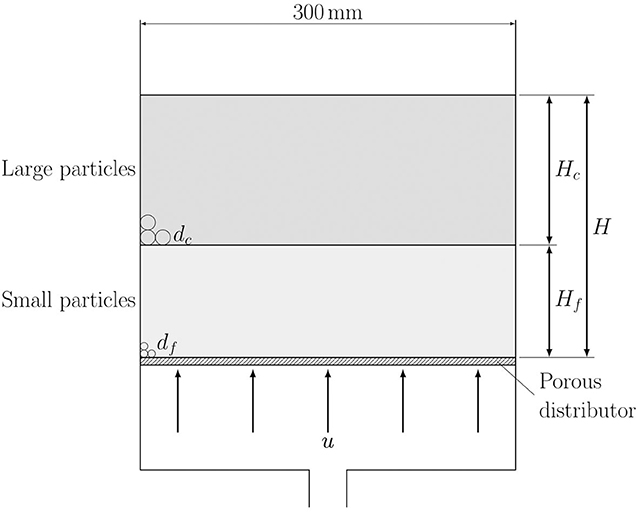
Figure 1. Schematic diagram of the layered fluidised bed when there is a layer of large particles over a layer of small ones.
The ballotini were sieved and the nominal diameter (d) taken to be the centre of the sieved range. The Sauter mean diameter (e.g., Breard et al., 2019) is the most suitable diameter for considering the balance between particle weight and fluid drag, but as the samples are well-sorted, the arithmetic, geometric and Sauter means are within a few percent (based on measurements of other batches of ballotini in the same laboratory), and we have taken this into account in our errors.
The total bed depth (H) was varied, with a maximum of 12 cm; the thickness of the component layers of the bed, and the sizes of particles in those layers were also varied. In all experiments the superficial gas velocity u (the volume flow rate per unit cross-sectional area of the bed) was increased incrementally and the behaviour of the particle layers observed through the transparent container walls. For some experiments pressure in the air near the base of the bed was determined with a metal tube attached to a manometer.
Most experiments began with a two-layer bed with each layer consisting of single particle components. The combinations of particle sizes tested are shown in Table 1. In a subset of these experiments the total bed depth (H) was kept constant at 10 cm but the coarse layer thickness (Hc) was varied as well as particle sizes in the two layers and therefore the size ratio r = dc/df, where the subscripts c and f refer to the coarse and fine particle layers respectively. A second subset of experiments consisted of a lower layer of 45–75 μm particles and an upper layer of particles with a diameter of 250–425 μm while Hc and Hc/H were varied systematically. A set of preliminary experiments explored the dynamics for three-layered beds with either a fine layer between two coarse layers or a coarse layer between two fine layers. In these experiments each layer contained a single particle size.
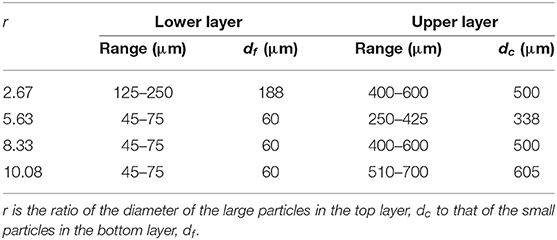
Table 1. Particles used for two-layer beds with mono-sized particles.
Experiments were also performed with two-layer beds consisting of mixtures of particles, where each layer contained two particle components, one large with a diameter dl and one small, diameter ds. The diameter for each layer was then determined by calculating the Sauter mean diameter, dav, which preserves the ratio between volume and surface area for the particles. In general, for a bi-modal mixture this is given by
where xs is the mass fraction of the smaller component in the mixture, and the density ratio for component i is
with the average density given by
For particles of the same density, this reduces to
The particle volume fraction, ϕ, of mixtures was calculated with the linear-mixture method of Yu and Standish (1991) for randomly-packed mixtures of spherical particles; ϕ depends on the particle size ratio of the components of the mixture, ds/dl, and has better packing than mono-sized beds when ds/dl < 0.741. The mixtures used and the resulting values of dav and ϕ for each layer are shown in Table 2.
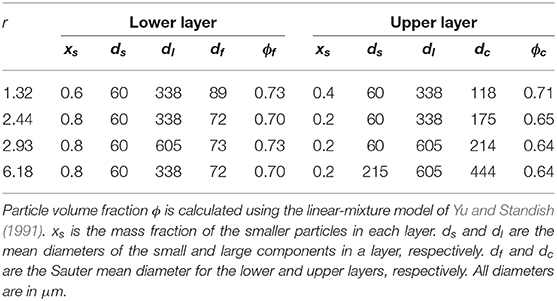
Table 2. Particles used for two-layer beds where each layer is a mixture of particles.
3. Observations
3.1. Fine Particles on Top of Coarse Particles
When a layer of large particles (high permeability) is on the bottom and covered by a layer of small particles (low permeability), we were unable to find any experiment conditions (gas flow rate, layer thicknesses) with our apparatus and particles for which static-pressure failure or crater formation occurred. For this configuration, as the gas velocity was increased there was no particle motion until umf for the top layer was reached and the top layer fluidised. At this point all the small particles were in motion and gas bubbles rose through the fine-particle layer. However, these motions did not disturb the bottom (coarse) layer, which remained undeformed and acted as a type of distributor (i.e., the behaviour of the top layer was the same as if it were the only layer in the container and was directly on the distributor plate at the base of the container). Nothing further took place until umf for the large particles was reached and it was fluidised, causing mixing of the layers.
3.2. Coarse Particles on Top of Fine Particles
A much greater diversity of behaviour is seen for gas flows up through beds of particles with a layer of larger particles on top of a layer of smaller particles. The situation is shown schematically in Figure 1.
3.2.1. Jetting and Bubbling
For beds where r(= dc/df) < 6.5, as u was increased, a velocity ui is reached at which activity initiates. Initially, a longitudinal gas pocket formed within the bottom fine particle layer similar to those seen in the liquid-fluidised beds of Nichols et al. (1994). The upper part of the layer of small particles was forced up against the layer of larger particles forming a double layer. This double layer deformed while maintaining the same thickness until the upper (coarse) layer of the bed is penetrated by the lower layer. This penetration could have the form of a jet or bubbles.
Jetting is shown in Figure 2. After initiation and the formation of a pocket, a column of fine particles intruded into the upper layer of large particles and a large cavity formed below it (both sometimes inclined). There appeared to be mechanical failure of the bed at the edges of the cavity. The top layer then suddenly failed and was penetrated and then broken through, causing particles to be projected above the bed and forming a jet of fine particles. While gas continued to be input at the base of the tank, the penetrating column of small particles widened and a stable, conical, bubbling pit of fine particles formed. In the example in Figure 2, before the breakthrough, the entire bottom layer was pushed up against the top layer and was not fluidised; however, after breakthrough only a portion of the fine layer pushed up on the base of the coarse layer, the rest formed a bubbling fluidised bed at the base of the tank.
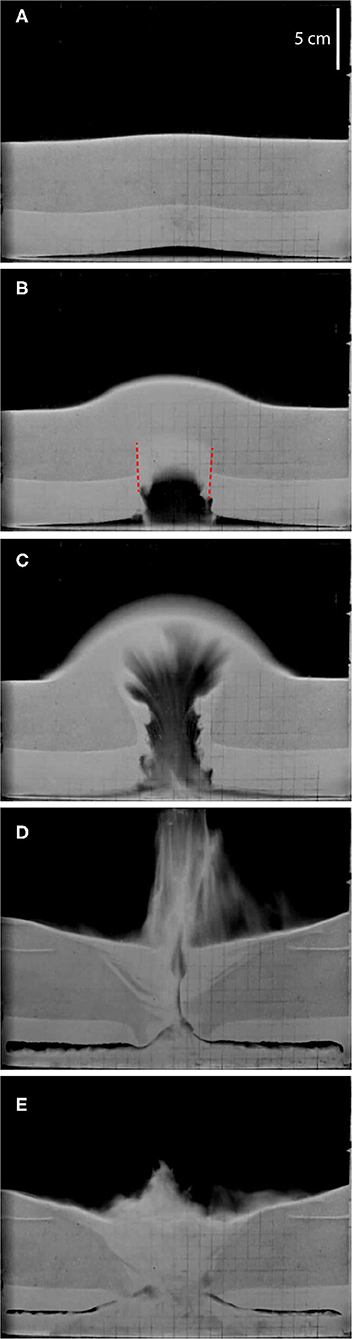
Figure 2. An example of jetting behaviour in a two-layer bed. r = 5.63, Hc/H = 0.6, H = 10 cm, df = 45–75 µm, dc = 250–425 µm. u = 3.3cm/s and photographs (B–E) were taken 0.5 s, 1.0 s, 3.0 s, and 5.0 s after (A). The experiment started with a layer of coarser particles (darker) over a layer of finer particles (lighter grey); the lighter-grey at the top of (A) relates to lighting at the top of the coarser layer. The red lines in (B) indicate apparent planes of failure in the bed.
An example of bubbling is shown in Figure 3. Many aspects of the bubbling regime were identical to jetting, but instead of a single cavity forming below the intruded column of small particles, smaller bubbles formed in the intrusion. When the top layer was breached, there was an overflow of small particles on top of the top layer, which broke up into blocks and sank. The crater area was dominated by bubbling. On some occasions this type of behaviour could be quite violent (“bubbles-jets”) with a plume of particles being thrown above the bed.
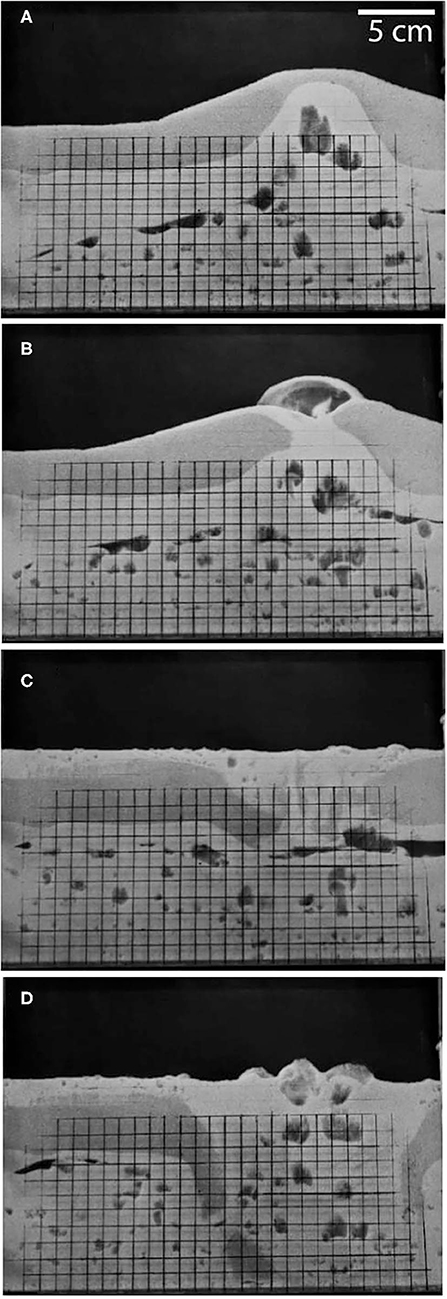
Figure 3. An example of bubbling behaviour in a two-layer bed showing the progression with time from after initiation (A) to breakthrough (B) and further bubbling of fines (lighter grey) as gas continues to flow through the bed (C then D). r = 2.67, Hc/H = 0.25, H = 12 cm, df = 125–250 µm, dc = 400–600 µm. The dark lines are a cm grid drawn on the front of the tank.
When either of the layers was very thin compared with the other (Hc or Hf = 1 cm), the bed could just become wholly fluidised as for a bed of single-sized particles.
There was no evidence seen of a large-scale expansion of the layers with increasing u; instead structures largely void of particles—the pocket, jets, bubbles—formed, even for 45– 75 μm particles for which some expansion might be expected (Geldart, 1973). If the gas flow into the base of the apparatus was ceased while there was a gas pocket in the lower layer but before breakthrough, the pocket simply collapsed non-dramatically.
3.2.2. Strength of Breakthrough
The strength of the breakthrough of gas and fines through the top layer is important in connection with behaviour (jetting, bubbling, bubble-jets). The type of behaviour and its strength, based on the maximum height attained by the ejected particles, is plotted out for beds of a fixed depth (H) and different values of r in Figure 4. The type of activity observed is indicative, and repeat tests showed it could differ for the same nominal conditions for some of the beds. However, jetting was more prevalent than bubbling for middling values of Hc/H and higher values of r. The strength of the breakthrough appeared to be highest for middling values of Hc/H but for all Hc/H it was diminished when r exceeded the percolation limit that permitted infiltration of fine particles into the coarse layer (see section 3.2.3 below) when jets could still take place but their vigour was significantly diminished. When the coarse layer was too thin then the void would not grow sufficiently to cause a jet to form; when it was too thick then the void could not grow sufficiently on its own to rupture the coarse layer.
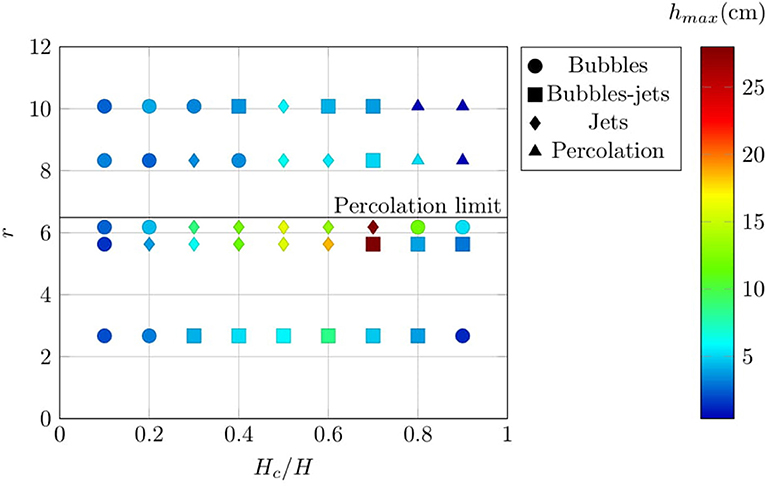
Figure 4. The observed activity type in two-layer planar beds for different particle size ratios r, different coarse layer thicknesses (Hc) and constant total bed thickness (H) of 10 cm. Colours indicate the maximum height particles are ejected above the top of the bed (hmax). The nine points for r = 6.18 correspond to experiments where both layers were formed from a mixture of two particle sizes (bimodal); all other data are for experiments with unimodal layers. The percolation limit, i.e., the value for r above which small particles can move through the interstices of large particles, is 6.5 (Yu and Standish, 1991).
After breakthrough, in the central part of the bed where breakthrough took place there appeared to be a region largely composed of fine particles which is fully fluidised. Away from this region, the layered structure of the bed was preserved though there might be some distortion and as for Nichols et al. (1994) some coarse particles passed downwards into the fluidised layer of fine particles below. A second layer of fine particles could form on top of the coarse layer owing to the fine particles that pass through the breakthrough region.
3.2.3. Percolation
A third type of behaviour occurred when a layer of large particles was over a layer of small ones when the small particles were sufficiently small relative to the large particles and umff < u < umfc. In this case, the formation of the pocket after initiation did not take place, but the small particles travelled through the interstices between the large particles, percolating between them as shown in Figure 5. This would happen when r > 6.5 (Yu and Standish, 1991) for a packed bed. Vertical columns that were evacuated of small particles formed relatively slowly as for Gilbertson and Eames (2001) and Nermoen et al. (2010). These acted as high-permeability conduits for gas and so suppressed bubbling (Gilbertson and Eames, 2001) and there was no projection of particles above the bed. Small particles were transported through the spaces between the large particles to the top of the bed where they form a shallow pool.
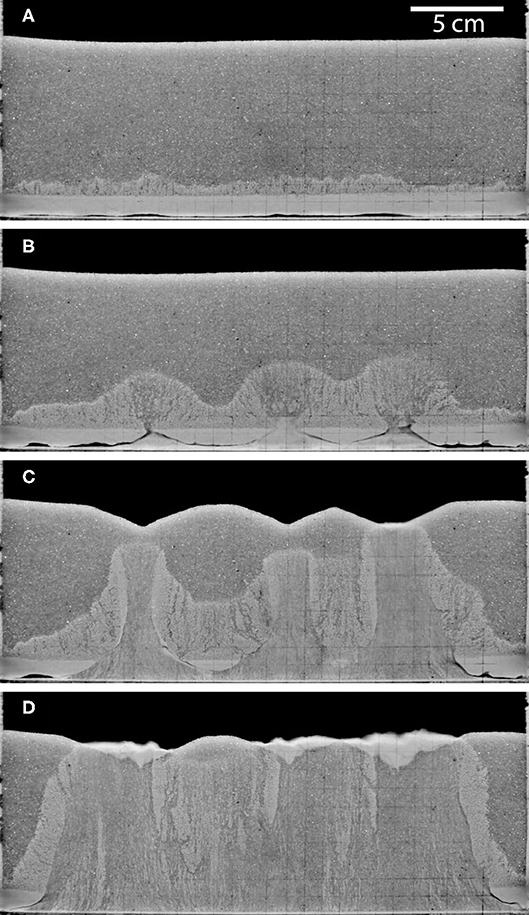
Figure 5. Photographs of percolation behaviour in experiment with: r = 10.08, Hf/H = 0.1, df = 45–75 µm, dc = 500–710 µm.u = 5.0 cm/s and photographs (B–D) were taken 10 s, 16 s, and 28 s after (A).
3.2.4. Three-Layer Beds
Experiments were also performed in beds of three layers of unimodal spheres, always with u < umfc. When a fine layer was between two coarse layers, the experiment proceeded in the upper two layers as if the bottom layer was not present: as u was incremented, a void formed in the fine layer and the top coarse layer was lifted until it failed. The particles in the bottom coarse layer did not move (i.e., the bottom layer acted as a distributor). When a coarse layer was between two layers containing the same fine particles, the upper layer behaved like an ordinary fluidised bed, and the behaviour of the lower-two layers was similar to the equivalent experiment with just those two layers.
4. Fluid Forces on Layered Particle Beds
Although uniform gas flow up through a layered bed of particles is a simple system, there is a rich variety of behaviour possible through the interaction between many different physical processes. Following the work of Nichols et al. (1994), the driving mechanism behind the deformation and rupture of the layers is the drag exerted on the particles by the passage of fluid past it. This exerts a force on the particles directly, but also can change the interaction of particles.
4.1. Fluidisation in Beds of Particles of a Single Size
For a bed of uniform particles of diameter d and density ρp, when there is a flow of fluid of superficial velocity u through it, the forces on the bed are the particles' net weight and the drag exerted on them. The drag is considerably larger than that on a single isolated particle owing to the presence of nearby, surrounding particles. As the fluid flow through a bed of single-sized particles is increased, the drag on the particles increases. Eventually the minimum fluidisation velocity, umf, is reached when drag balances the net weight of the bed. For mono-sized particles, this is also the point at which the weight of individual particles is supported and inter-particle friction is eliminated so that the bed behaves in a similar manner to a fluid. A simple way of expressing this balance is the semi-empirical Ergun equation (Ergun, 1952)
where ϕ is the particle volume fraction of the bed, μ is the viscosity of the fluid, Δρ is the difference between the particle and the fluid densities, and H is the depth of the bed. umf is a superficial velocity and so the actual average velocity within the bed is umf/ϕ. The left-hand side of the equation expresses the drag on the particles. A heuristic approach is taken summing the first term representing the inertial force to the second term representing the viscous force. The right-hand side of the equation is the net weight of the bed. It may be written in non-dimensional form as
where Remf is the particle Reynolds number (the ratio between inertial and viscous forces on a particle) at u = umf,
and Ar is the Archimedes number
the ratio of net weight to viscous forces, and a function of particle and fluid properties only. P and Q define the effect that the close proximity of particles has on drag in the bed and so are functions of ϕ. They are defined by
They may be related to inertial permeability (= d/P) and viscous (Darcian) permeability (= d2/Q).
Above the velocity of minimum fluidisation the net weight and the drag on the particles remain balanced. For particles that are not too small or light (Geldart, 1973), the excess gas flow is concentrated forming voids or “bubbles” in the bed that pass up through it (Davidson and Harrison, 1963). These bubbles can coalesce and divide, and also drive circulation currents of particles within the bed.
Fluidisation in a mono-sized bed of particles is idealised as a discrete event: it takes place at the gas velocity when at the bed scale the drag balances the net weight of the particles and at the particle scale inter-particle friction is practically eliminated. It is assumed that the drag on all the particles is the same for a given gas velocity and for each particle the only net vertical forces acting on it are its net weight and drag.
4.1.1. Fluidisation in a Two-Layer Bed
When a bed consists of two layers of particles, its fluidisation behaviour can be much more complicated. The minimum fluidisation velocity depends on the size and density of particles, and so from the point of view of individual particles, when there are two layers of different particles in a bed there will be an interval of fluid velocities over which the particles of one set will be fluidised and the other set will not be. The particles used in our experiments were differentiated by size only (density was constant) and so will be referred to as coarse and fine particles, but this is a proxy for referring to particles in a bed in which one set of particles has a higher value of umf than the other. In addition, the discussion below is for sets of particles for which r is not sufficiently large to allow particle percolation.
When a two-layer bed consists of a layer of coarse particles overlaid by a layer of fine particles, then the observed behaviour was straightforward as described in section 3.1.
More complex behaviour is seen when small umf particles form the lower layer and large umf particles the upper one. As for the opposite case (fine layer on top), as the fluid flow rate is increased it reaches the minimum fluidisation velocity for the fine particles; however, in this configuration the entire layer of small umf particles cannot be fluidised owing to the weight of the still unfluidised top layer of large umf particles. This causes a division of the fine-particle layer with a static upper part forced up against the upper layer and a lower part that is fluidised (Nichols et al., 1994): the drag exerted on the upper part of the fine-particle layer supports the weight of the small umf particles composing it and the excess drag (i.e., the total drag on the fine particles minus the drag to support the weight of the fine particles) supports the effective weight of the upper layer (Nichols et al., 1994). In this state, the weight of the upper layer of the bed (composed of coarser and so larger umf particles) is fully supported by the gas flow, but individual particles are not fluidised and there is significant friction between them; the same is true of the upper part of the layer of fine particles where the excess drag forces the particles together and so there is a frictional force between them. The particles in the lower part of the layer of fine particles (below the gas pocket) are fully fluidised i.e., the weight of the particles is fully supported and the inter-particle friction is insignificant.
A schematic diagram of the bed at the point at which the weight of the top layer is fully supported is shown in Figure 6. From the point of view of fluid drag, it is possible to estimate for a given gas velocity the thickness, , of the upper part of the layer of low umf particles required to support the weight of the upper layer of large umf particles. From the Ergun equation, Equation (5), summing the pressure drop through the two parts of the composite layer gives
where umfbed is the superficial velocity at which the weight of the upper layer is supported, and Δρ is the difference between the density of the particles and that of the surrounding fluid. The Ergun equation accommodates both drag and hydrostatic forces, the latter accounting for a factor of (1 − ϕ) in the denominator of both P and Q. The particle volume fraction ϕ is assumed to be uniform throughout the composite layer. This expression includes the effects of inertia, which were neglected by Nichols et al. (1994).
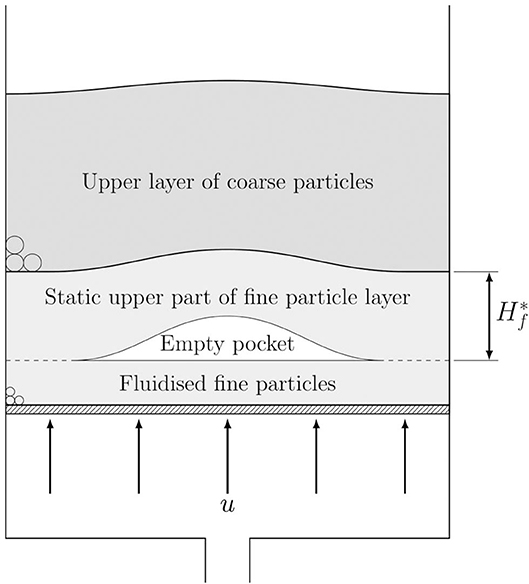
Figure 6. Schematic diagram of a two-layered bed just after activity in the bed has initiated when the weight of the top layer is supported by the effects of fluid drag.
Equation (7) may be non-dimensionalised so that
where Rec is calculated when u =umfbed, , the relative thickness of the layer of coarse particles, and the density difference ratio w = Δρc/Δρf.
For a given , this equation may be solved implicitly to obtain the corresponding umfbed, the gas velocity at which the net weight of the upper layer is balanced by fluid flow drag. For a given umfbed then
or, when all the particles have the same density so that w = 1,
These equations are wholly in terms of the large particles: the properties of the small particle layer enter only through r. The value of given by Equation (10) is a minimum value. In a system where u is steadily incremented, the value of required from Equation (10) will decrease as more of the weight of the coarse particles is supported directly by the flow through drag, but there is no mechanism by which fine particles can detach themselves from the double layer and so there will be a net upward force on the double layer.
4.2. Initiation of Activity in Layered Beds of Mono-Sized Particles
When the weight of the upper layer of the bed is supported, then it can start to deform, allowing the pocket to form in the lower layer of the bed. umfbed can therefore be identified with the point at which deformation in the bed is first observed; we call this the initiation velocity ui with corresponding particle Reynolds number, Rei = ρguidc/μ. Equation (10) is plotted out in Figure 7 along with experimental data for the first sub-set of experiments (fixed H = 10 cm). For the small-scale experiments, Hf has been used to calculate . was measured for the second sub-set of experiments (fixed r = 5.63). Neglecting the case when either layer was very thin (Hc or Hf = 1 cm), the mean relative thickness of the layer was with a standard deviation of 0.10; therefore it is reasonable to identify with Hc/H. When then Rei = Remfc.
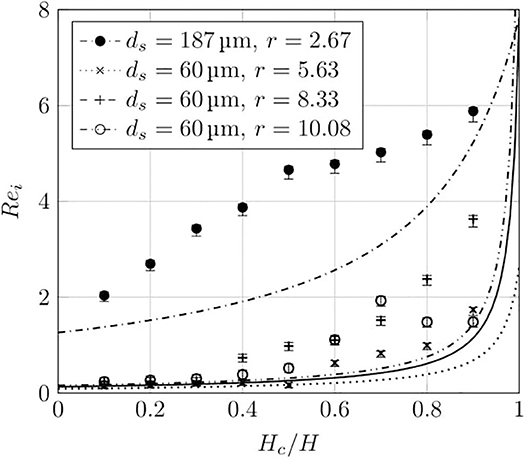
Figure 7. Variation of the Reynolds number of the large particles at the point of initiation of the formation of a pocket in the lower, fine particle layer of the bed. The initial thickness of the bed was 10 cm for all the beds. Curves are Equation (10), which relates Re and Hc/H at u = umf; points are experimental measurements.
It is apparent that even a thin bottom layer of fine particles is sufficient to greatly increase the fluid force on the upper layer of large particles and cause a sharp drop in the expected value of Rei. In the model, e.g., Equation (10), r controls the concavity of the curve, while the endpoints are controlled by the minimum fluidisation velocities for the fine and coarse particles alone. Many aspects of the theoretical curves are captured by the experimental measurements; however, the theory consistently under-predicts the Reynolds numbers at which initiation occurs in the experimental beds.
In the second sub-set of experiments there was a lower layer of 60 μm particles and an upper layer of particles with a diameter of 338 μm. Their particle size ratio r = 5.63 corresponded to some of the most energetic breakthroughs seen in the first sub-set of experiments. Figure 8 shows the Reynolds number for the initiation of activity with overall bed depth for sets of experiments where was kept constant. It can be seen that Rei depends strongly on Hc/H, as would be expected from Equation (7); however, if the activity in the bed was solely determined by the balance between weight and fluid drag then Rei should be a constant for a given value of Hc/H; in fact there is a clear dependence on H, or perhaps . There are signs that this levels out for deeper beds, but at values of Rei that are significantly in excess of what would be expected from Equation (7). For the largest values of Hc/H, the levelling-off occurs when the value of Reic = Remfc.
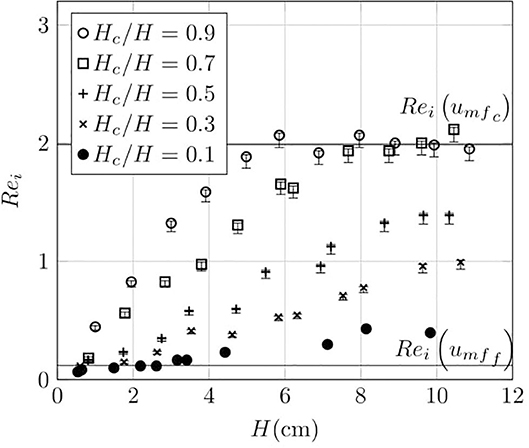
Figure 8. Initiation Reynolds number as a function of H for the larger particles in two-layer fluidised beds consisting of a lower layer of particles with diameters 45–75 μm and an upper layer of particles with diameters of 250–425 μm for five Hc/H values. The two black horizontal lines indicate the two Reynolds numbers corresponding to the minimum fluidisation velocities, umff and umfc, determined experimentally with mono-sized fluidised beds of each component with a depth of 4 cm.
4.2.1. Initiation of Activity for Two Layers of Particle Mixtures
Geological materials are rarely composed of a single component. Two-layer beds where each layer was composed of a mixture of particles as detailed in Table 2 were therefore examined. Each mixture consisted of a small component (subscript s) and a large component (subscript l). When calculating the drag, the Sauter mean diameter (4) is the most suitable diameter (van der Hoef et al., 2005) and its value for the upper layer is the diameter that is used in Rec and Arc. The mixing of particles can also allow better packing and so increase the drag experienced by the bed. The effect of packing in Equation (8) is determined by P and Q, and as ϕ will now be different in the upper and lower layers of the bed, then P and Q will also differ. Equation (8) therefore becomes
ϕf and ϕc can be estimated using a linear-mixture model (Yu and Standish, 1991; Yu and Zou, 1998), and the values for the mixtures used are listed in Table 2. From these, P and Q may be calculated for each layer and the equation solved for Rec.
The same types of behaviour were seen for layers that are bi-modal mixtures of particles as for the layers of mono-sized particles, except that for the mixtures tested, jetting was seen more often than for the mono-sized layered beds. For r = 6.18, the maximum height of ejected particles was also measured and these results are plotted in Figure 4, and it can be seen that the types of activity and the strength of breakthrough were comparable to the beds of mono-sized layers.
Figure 9 shows the Reynolds number at which activity initiates. The trends are the same as for the mono-sized (non-mixed) layers shown in Figure 7 including the significant under-prediction of the initiation Reynolds numbers by the theory based on fluidisation, Equation (10).
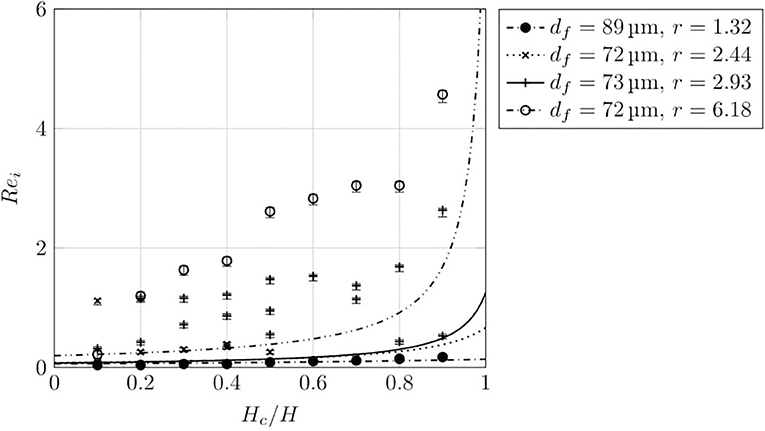
Figure 9. Dependence of initiation Reynolds number on relative coarse layer thickness for several beds consisting of mixtures of particles as specified in Table 2. All the beds had an overall thickness H = 10 cm. The curves describe Equation 10 and the points are experimental measurements.
4.3. Breakthrough for Layered Beds
After initiation, is maintained as there is no mechanism by which fine particles may be detached from it. This generates an excess drag on the layer of coarse particles and the immobile top part of the layer of fine particles, and so they are forced upwards to form the longitudinal air pocket. This pocket was typically centred within the tank, though on some occasions an asymmetrical pocket formed. A void above the pocket grew with increments of u until there was a sudden breakthrough of the lower layer through the upper layer in the form of bubbles or a jet.
For the set of experiments when Hc/H was kept constant, the breakthrough of the upper layer took place when u ≈ 1.2ui. In a conventional fluidised bed with a single layer of particles, the pressure drop over the bed would rise until it matched the weight of the bed and then level off (Davidson and Harrison, 1963); however, in our experiments for a two-layer bed with umfc > umff there was a steady pressure rise to a value significantly in excess of the weight of the bed until breakthrough. When breakthrough occurred, there was a sudden drop in pressure to a value close to that corresponding to the weight of the bed.
Figure 10 shows a typical pressure drop over a bed, recorded using a manometer with an outlet positioned at the bottom of the bed (i.e., just above the distributor plate). The pressures measured are steady pressures i.e., after each increment of u, the pressure was allowed to come to an equilibrium value. When u = 4 cm/s, the estimated pressure drop over the bed owing to drag calculated from terms equivalent to the first two terms of Equation (11) was 7200 Pa compared to the 6000 Pa measured. Some difference would be expected owing to the distortion of the particle layers at breakthrough, but this gives some confidence that the force exerted on the particles is dominated by drag.
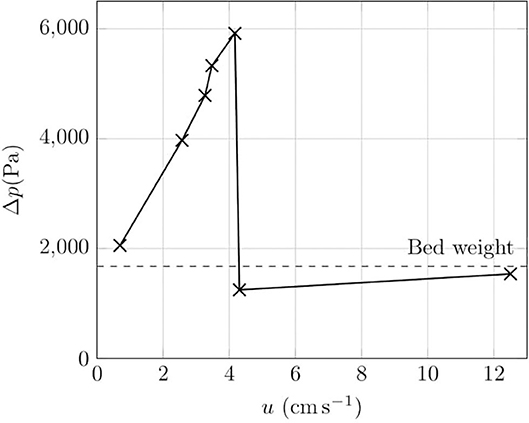
Figure 10. Change of pressure drop over a two-layer bed as u is incremented. The sudden fall in pressure corresponds to the point at which breakthrough takes place. The total bed thickness was 10 cm and the bed layers conformed to r = 2.44 in Table 2. The dashed line is the bed weight calculated as ϕcΔρcgHc + ϕfΔρfgHf. Hc/H = 0.6.
The strength of breakthrough, as indicated by the maximum height of the particles ejected from the bed, is shown in Figure 11 for five sets of experiments from the second sub-set for which Hc/H is constant. There is a similar dependency in the strength of the breakthrough on Hc/H with the strongest breakthroughs for middle values; however, there is a dependence on H in absolute terms as well.
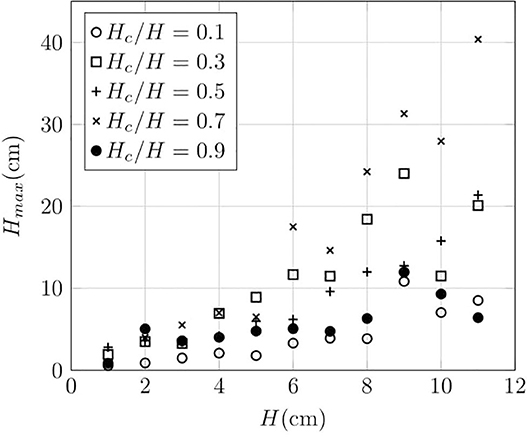
Figure 11. Strength of breakthrough for a two-layer fluidised bed where Hmax is the maximum observed height of particles ejected from the bed. Heights were measured to an accuracy of ±0.1 cm. The bed consisted of a lower layer of particles with diameters 45–75 μm particles and an upper layer of particles with a diameters 250–425 μm where Hc/H is kept constant over a range of H for five values of Hc/H.
5. Discussion
The established conceptual model of secondary hydroeruptions through hot pyroclastic flow deposits (e.g., Moyer and Swanson, 1987) emphasises the role of permeability (fine grain size) in the primary deposit. In this model, which we term “static pressure build-up,” the low permeability reduces the rate of steam escape enabling the underlying steam source to pressurise until the overburden fails, triggering the secondary eruption. However, for any non-zero permeability, if the pressure at the steam source increases, so will the flow up through the interstices of the deposit, increasing the drag force pushing upwards throughout the entire deposit thickness. We propose an alternative model where drag is fundamental to triggering secondary hydroeruptions. It is suitable for deposits that are effectively granular materials for which the permeability is high enough for the drag force to be comparable to the static pressure force; it is not relevant to secondary eruptions through welded deposits in which the particles will be stuck together regardless of the flow rate of gas. Our simple analogue experiments with uniform-density spherical particles demonstrate that upflow of gas from an underlying distributed source can cause localised violent outbursts of particles from the top of a bed of layered granular material.
Violent outbursts do not occur for single-layer beds or in two-layer beds where the capping layer is finer-grained (lower permeability) than the layer below it; however, if the layers are reversed so that the coarser-grained layer is on top, then jets of particles form for some gas fluxes and layer thicknesses and grain size contrasts. Our experiments and theoretical considerations, including those outlined in Nichols et al. (1994), indicate that what matters is not the permeability of the layers but the minimum gas velocity for drag to support the weight of the particles, umf. In the experiments we controlled umf through particle size and used spherical particles with unimodal or bimodal size distributions, which are well-studied in industrial applications and are the easiest to model and understand; however, in general umf will be determined by the size distribution, densities and shapes of particles making up a layer.
The violent breakthrough in layered systems where the top layer has a umf larger than that in the lower layer is enabled by the interaction between the two layers. The upper part of the lower layer of fine particles (above a gas pocket) supports the weight of the upper layer of coarse particles, forming a composite structure. In neither part of this composite are the particles individually fluidised because the gas flow is not large enough to fluidise the large particles, and the small particles are forced against the large ones by the excess drag on them. This ensures that there continues to be significant inter-particle friction and the composite has a strength so that the upstream pressure increases to a value in excess of the lithostatic. The theory based on fluidisation alone, Equation (10), underestimates Rei for both mono-sized layers and mixed layers; this is consistent with the static strength of layers also playing a role in the initiation of activity. It is the arching of the bed (permitted by it having a strength) which forms a region with no particles. This gas pocket causes increased flow through its apex, locally fluidising the particles above. In this region where there is full fluidisation, jets and bubbles can form which further concentrate the flow. Once breakthrough is achieved, the central portion of the bed is fully fluidised and the pressure drop over it is suddenly reduced to that corresponding to the bed's weight, releasing the excess pressure. This transient, and the concentrated flow owing to bubbles or a jet, generates the plume of particles expelled at breakthrough.
The analogue experiments and theoretical constraints indicate that the drag-induced triggering of secondary hydroeruptions pyroclastic deposits requires that:
• The deposit is a granular material with particles free to move relative to one another if the local gas flow is sufficient for the weights of particles to be supported. This means the primary deposit is not welded and has low cohesion.
• The deposit has some strength through friction in order to allow buildup of overpressure.
• The primary deposit is layered with vertical changes in umf.
• There is a layer with sufficiently low umf (e.g., it is sufficiently fine-grained) for the upwards velocity of steam generated by the thermal energy of the primary deposit to exceed it.
• This low-umf layer is overlaid by a layer with higher umf (e.g., due to coarser grain size and/or higher proportion of lithic clasts of high density).
• The low-umf layer is sufficiently thick compared to the thickness of the deposit above it to satisfy Equation (9).
5.1. Application to Deposits
To consider the above requirements and apply the insights from our analogue experiments to secondary hydroeruptions, we refer to the Mount St Helens (MSH) 1980 eruption. It has well-studied primary pyroclastic flow deposits (Kuntz et al., 1981; Rowley et al., 1981; Brand et al., 2014) and the best-documented secondary hydroeruptions (Rowley et al., 1981; Moyer and Swanson, 1987). That the deposits can be treated as low-strength granular materials that would fluidise with sufficiently fast upflow of gas is suggested by the “striking deformation” when people attempted to walk on the primary deposits in the weeks after emplacement (Wilson and Head, 1981) and the sloughing of the primary deposits into the secondary hydroeruption craters to form gentle slopes (Rowley et al., 1981). Based on the responses to loads on the top surface and shear vane tests in the upper channel deposit, Wilson and Head (1981) estimated a yield strength of ~ 300–2,000 N/m2 and 400–18,000 N/m2, respectively. However, a degassed and compacted deposit (with degassing induced by loading experiments) was substantially stronger (e.g., it could support an adult standing on one foot), and they attributed much higher compressive strengths of 100,000–250,000 N/m2 determined from cone penetration to the efficiency of degassing induced by the steadily increasing force applied during these tests. We hypothesise that for the drag-induced triggering of secondary hydroeruptions, the increased strength with compaction demonstrates how the portion of the (fine-grained) layer where umf < u can gain an appreciable strength when it is pushed up and is compacted against the weight of the overlying material with umf > u. The pressure that builds in the gas pocket, which contributes to the intensity of the outburst when the overlying material is breached, depends on the bending strength of the material above the pocket, and so although most of the deposit would be weak and easily deformed, the compaction induced by excess drag in the low umf part of the composite layer above where the pocket initiated would allow greater pressure to accumulate.
Sections through the MSH May 18 pyroclastic flow deposits exposed along drainages by recent erosion that were studied by Brand et al. (2014) reveal that the primary deposits can be considered as layered with vertical changes in grain size and componentry, and so there are vertical variations in umf. Although the four main units (I, II, III, IV) of the May 18 pyroclastic flows have intricate vertical and lateral facies variations, the outcrop photographs and diagrams of Brand et al. (2014) show laterally continuous layering defined by grain size (and componentry) is common over distances of tens of metres. Lithofacies include: massive lapilli tuff; block-rich massive lapilli tuff, sometimes with block-rich basal breccia; pumice lens; fine-grained massive ash, up to tens of centimetres thick. There is considerable variation in median grain size and sorting (Kuntz et al., 1981; Brand et al., 2014): for example, the median of the samples sieved by Brand et al. (2014) 7.1–7.2 km from source vary from < 100 µm to > 10 cm. The stratigraphic logs show that there is commonly a sudden increase in grain size with stratigraphic height across unit boundaries (e.g., from units II to III and from III to IV), which would correspond to vertical increases in umf.
The preservation of layers in the primary deposits, including close to secondary hydroeruption sites, means that the steam flux after emplacement was not sufficient to exceed umf of most (or all) of the deposit. However, for the proposed drag-induced triggering of secondary eruptions, there must be layer(s) where the steam velocity exceeded umf. Figure 12 shows umf as a function of particle diameter for three particle fractions (ϕ = 0.5, 0.6, 0.7) and two end-member particle densities that correspond to the typical pumice density (750 kg/m3) and the bubble-free (glass and crystals) juvenile clast density (2,550 kg/m3) determined by Kuntz et al. (1981). It indicates that the effects of the expected variations in density and particle volume fractions would usually be much less important than variations in grain size in their effects on variations of umf in pyroclastic flow deposits. For beds with a range of particle sizes (e.g., pyroclastic deposits), if the property of interest relates to drag (e.g., umf and permeability, Breard et al., 2019), then the relevant particle diameter is the Sauter mean diameter (Equation 4). The Sauter mean diameter is sensitive to the finer grain sizes and is always smaller than the median (by mass) when all the particles are considered to have the same density (and also when the fine particles are relatively dense).
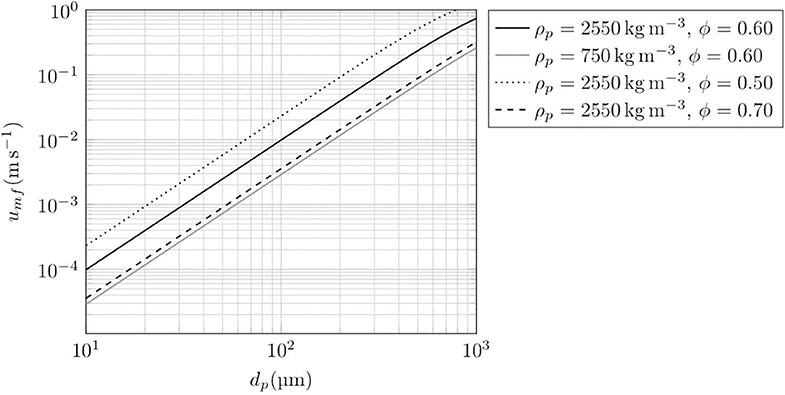
Figure 12. Typical minimum fluidisation curves with particle diameter calculated from Equation (5) showing their sensitivity to particle density and particle volume fraction. The fluidising gas is superheated water vapour with a temperature of 250 °C: ρ=2.37 kg/m3 and μ = 1.80 × 10⁻⁵ kg/ms.
Most of the secondary hydroeruptions occurred within a few days of emplacement of the May 18 pyroclastic flows. Moyer and Swanson (1987) include data on the grain size distribution of one May 18 pyroclastic flow sample down to 9Φ ≈ 2 µm, with just 0.12 wt.% finer than 9Φ. Applying Equation (4) and using the geometric mean for the diameter of each particle size bin gives a Sauter mean diameter of 110 μm. Breard et al. (2019) show how to estimate the Sauter mean diameter from the commonly reported Φ-scale based median (Md) and sorting (σ) parameters, assuming a log-normal particle size distribution. This gives a Sauter mean diameter of 97 μm for the same Moyer and Swanson (1987) sample, in good agreement with Equation (4). Applying the Breard et al. (2019) approach to the nine May 18 pyroclastic flow size distributions in Kuntz et al. (1981) gives mean Sauter mean diameters of 55–206 μm. Data from the more extensive sampling of recent exposures of the May 18 units along drainages by Brand et al. (2014) suggest the Sauter mean diameter can range from < 10 microns to > 1 mm [c.f. Figure 4F of Brand et al. (2014) and Figure 9B of Breard et al. (2019)].
Figure 12 gives a sense of the implications of these grain size data for the ranges of umf in pyroclastic flow deposits. For example, for a density of 2,550 kg/m3, Sauter mean diameters of 55, 200, and 1, 000 μm correspond to umf values (and the volume flux of steam generated per unit area) of 3 × 10⁻³ m/s, 4 × 10⁻² m/s, and 0.7 m/s, respectively. These steam rates suggest that it is feasible for upflow of steam to overcome umf of some, but not most, of a pyroclastic flow deposit succession as required to trigger secondary hydroeruptions and preserve layered deposits. However, the argument would clearly be strengthened by modelling of steam generation and data on grain size and density from samples collected at the roots of secondary hydroeruptions, which are beyond the scope of this study.
In our laboratory experiments with layers of mono-sized particles, the intensity of outbursts of particles was substantially diminished when the ratio of the particle diameters of the two layers was sufficient for the smaller particles to percolate through the interstices of the coarser layer above. For these experiments this meant that violent outbursts were abated when r > 6.5. This will be partly because excess drag on the particles in the lower layer causes percolation rather than it being exerted against the upper layer. Also the mixing of the small and large particles causes umf for the upper layer to be decreased (Gilbertson, 2019). For natural pyroclastic deposits with much broader size distributions we expect percolation to be much less important because of the more efficient packing and smaller interstices than in mono-sized beds. In fluidised beds of mixtures, segregation often takes place owing to the difference in umf of the components (Gilbertson, 2019); however, this was not apparent in experiments with mixtures of particles because the particles in the composite structure are not individually fluidised and they are not free to move. Thus we expect the intensity of outbursts to increase for greater r, even when r > 6.5, in pyroclastic deposits, with r based on the ratio of Sauter mean diameter of layers. Other factors that would affect intensity are the bending strength of the beds and the relative thickness of the layers; further work is required to make robust quantitative predictions of their roles.
The mechanism for triggering secondary hydroeruptions we have explored in this paper complements that proposed by Moyer and Swanson (1987) in that in both models steam pressure builds at depth before the deposit is breached causing a sudden pressure drop and eruption of steam and particles. The addition of the role of drag in our model means that the root of the secondary eruption is not necessarily at the depth of the steam source: it can, and generally would, be higher up in the deposit where there is a relatively low-umf layer. Moyer and Swanson (1987) proposed that the steam source for the MSH secondary hydroeruptions was pools of water on top of the May 18 debris avalanche deposit because of the dearth of the distinctive cryptodome dacite clasts from the debris avalanche in the secondary hydroeruption deposits. In our drag-related mechanism for secondary eruption triggering, the water could be in pools on top of the debris avalanche but could also be groundwater. Indeed, the secondary hydroeruptions that took place a year after emplacement of the pyroclastic flows are most likely to be related to seasonal recharge and a rising water table.
6. Conclusion
Secondary explosions through pyroclastic flow deposits have occurred in several historical eruptions, indicating they are a common hazard where hot pyroclastic flows are deposited on a wet environment. There has however been relatively little study of the phenomenon, perhaps because the explosion craters and the associated surge and fallout deposits are readily modified and eroded, and so may often be poorly preserved or not recognized in the geological record.
Our laboratory experiments show that violent outbursts analogous to secondary eruptions can be generated by the drag induced by a distributed flow of gas through a granular material with vertical variations in the minimum fluidisation velocities. Notably, a low-permeability cap is not required to trigger a secondary eruption; in fact, the experiments demonstrate that distributed gas flow up through a granular layer capped with a finer-grained (and so lower permeability) layer made of particles of the same density does not generate jets of particles or craters. However, when the upper layer is coarser, a gas pocket may grow within the finer layer causing the bed to dome upwards until it fails forming a crater and erupting particles. Combining these results with theoretical considerations and constraints from the Mt St Helens 1980 sequence, we conclude that for sufficient steam flux, secondary eruptions can be triggered within pyroclastic flow deposits where there is a fine-grained layer with very low minimum fluidisation velocity under a layer that is coarser and/or contains more dense clasts so that a greater upward velocity of steam is required to fluidise it.
Our experiments with air flow up through layers of unimodal or bimodal glass spheres are very simple; however, the complex behaviour observed provides insights into even more complicated natural secondary eruptions. The experiments are intended only to elucidate the physical origins and triggers of eruptions and not the dynamics of the eruptions themselves, which will be strongly affected by the generation of the steam that drives them. When the eruption is triggered, the associated pressure drop will induce flashing of superheated water at depth to steam. Steam compressibility may also affect the eruption, which is not the case in the experiments due to the much smaller length-scale and pressure drop. These differences mean that once triggered, the natural secondary eruption is likely to be more energetic than predicted by the processes involved in the experiments.
Data Availability Statement
All datasets generated for this study are included in the article/Supplementary Material.
Author Contributions
AR conceived the project and supervised AT and SM, who did the experiments and analysis of data. MG re-analyzed and re-plotted the data, and developed some theoretical constraints. MG, AR, and SM created the figures. MG and AR wrote the manuscript. All authors contributed to the article and approved the submitted version.
Funding
The research was conducted by the authors in the ordinary course of their employment or education at the University of Bristol. Expenses were paid from academic discretionary accounts.
Conflict of Interest
The authors declare that the research was conducted in the absence of any commercial or financial relationships that could be construed as a potential conflict of interest.
Supplementary Material
The Supplementary Material for this article can be found online at: https://www.frontiersin.org/articles/10.3389/feart.2020.00324/full#supplementary-material
References
Brand, B. D., Mackaman-Lofland, C., Pollock, N. M., Bendaña, S., Dawson, B., and Wichgers, P. (2014). Dynamics of pyroclastic density currents: Conditions that promote substrate erosion and self-channelization - Mount St Helens, Washington (USA). J. Volcanol. Geotherm. Res. 276, 189–214. doi: 10.1016/j.jvolgeores.2014.01.007
Breard, E. C. P., Jones, J. R., Fullard, L., Lube, G., Davies, C., and Dufek, J. (2019). The permeability of volcanic mixtures-implications for pyroclastic currents. J. Geophys. Res. Solid Earth 124, 1343–1360. doi: 10.1029/2018JB016544
Gardner, C. A., Neal, C. A., Waitt, R. B., and Janda, R. J. (1994). Proximal pyroclastic deposits from the 1989-1990 eruption of redoubt volcano, Alaska-stratigraphy, distribution, and physical characteristics. J. Volcanol. Geotherm. Res. 62, 213–250. doi: 10.1016/0377-0273(94)90035-3
Geldart, D. (1973). Types of gas fluidization. Powder Technol. 7, 285–292. doi: 10.1016/0032-5910(73)80037-3
Gilbertson, M. A. (2019). Estimation of the minimum fluidisation velocities in well-mixed bi-disperse fluidised beds. Powder Technol. 346, 433–440. doi: 10.1016/j.powtec.2019.02.019
Gilbertson, M. A., and Eames, I. (2001). Segregation patterns in gas-fluidized systems. J. Fluid Mech. 433, 347–356. doi: 10.1017/S0022112001003950
Hildreth, W. (1983). The compositionally zoned eruption of 1912 in the Valley of Ten Thousand Smokes, Katmai National Park, Alaska. J. Volcanol. Geotherm. Res. 18, 1–56. doi: 10.1016/0377-0273(83)90003-3
Keating, G. N. (2005). The role of water in cooling ignimbrites. J. Volcanol. Geotherm. Res. 142, 145–171. doi: 10.1016/j.jvolgeores.2004.10.019
Kuntz, M., Rowley, P., MacLeod, N., Reynolds, R., McBroome, L., Kaplan, A., et al. (1981). “Petrography and particle size distribution of pyroclastic flow, ash-cloud and surge deposits,” in The 1980 eruptions of Mount St. Helens. U.S. Geological Survey Professional Paper 1250, 425–539.
Moyer, T. C., and Swanson, D. A. (1987). Secondary hydroeruptions in pyroclastic-flow deposits: examples from Mount St. Helens. J. Volcanol. Geotherm. Res. 32, 299–319. doi: 10.1016/0377-0273(87)90081-3
Nermoen, A., Raufaste, C., deVilliers, S. D., Jettestuen, E., Meakin, P., and Dysthe, D. K. (2010). Morphological transitions in partially gas-fluidized granular mixtures. Phys. Rev. E 81:061305. doi: 10.1103/PhysRevE.81.061305
Nichols, R. J., Sparks, R. S. J., and Wilson, C. J. N. (1994). Experimental studies of the fluidization of layered sediments and the formation of fluid escape structures. Sedimentology 41, 233–253. doi: 10.1111/j.1365-3091.1994.tb01403.x
Rowley, P. D., Kuntz, M. A., and MacLeod, N. S. (1981). “Pyroclastic-flow deposits,” in The 1980 Eruptions of Mount St. Helens. U.S. Geological Survey Professional Paper 1250, 489–512.
Torres, R. C., Self, S., and Martinez, M. M. L. (1996). “Secondary pyroclastic flows from the June 15, 1991, ignimbrite of Mount Pinatubo,” in Fire and Mud: Eruptions and Lahars of Mount Pinatubo, Philippines, eds C. G. Newhall and R. S. Punongbayan (Seattle: University of Washington Press), 625–678.
van der Hoef, M. A., Beetstra, R., and Kuipers, J. A. M. (2005). Lattice-boltzmann simulations of low-Reynolds-number flow past mono- and bidisperse arrays of spheres: results for the permeability and drag force. J. Fluid Mech. 528, 233–254. doi: 10.1017/S0022112004003295
Wilson, L., and Head, J. (1981). “Morphology and rheology of pyroclastic flows and their deposits, and guidelines for future observations,” in The 1980 Eruptions of Mount St. Helens. U.S. Geological Survey Professional Paper 1250, 513–524.
Yu, A. B., and Standish, N. (1991). Estimation of the porosity of particle mixtures by a linear-mixture packing model. Indus. Eng. Chem. Res. 30, 1372–1385. doi: 10.1021/ie00054a045
Keywords: fluidisation, pyroclastic flow, secondary eruption, hydroeruption, drag, granular, jet, minimum fluidisation velocity
Citation: Gilbertson MA, Taylor A, Mitchell SJ and Rust AC (2020) A Fluidisation Mechanism for Secondary Hydroeruptions in Pyroclastic Flow Deposits. Front. Earth Sci. 8:324. doi: 10.3389/feart.2020.00324
Received: 16 March 2020; Accepted: 13 July 2020;
Published: 02 September 2020.
Edited by:
Stuart Mead, Massey University, New ZealandReviewed by:
Sonia Calvari, National Institute of Geophysics and Volcanology, ItalyLaura Pioli, University of Cagliari, Italy
Copyright © 2020 Gilbertson, Taylor, Mitchell and Rust. This is an open-access article distributed under the terms of the Creative Commons Attribution License (CC BY). The use, distribution or reproduction in other forums is permitted, provided the original author(s) and the copyright owner(s) are credited and that the original publication in this journal is cited, in accordance with accepted academic practice. No use, distribution or reproduction is permitted which does not comply with these terms.
*Correspondence: A. C. Rust, YWxpc29uLnJ1c3RAYnJpc3RvbC5hYy51aw==