 Weiqi Wang1
 Guoru Huang
- 1School of Civil Engineering and Transportation, South China University of Technology, Guangzhou, China
- 2State Key Laboratory of Subtropical Building Science, School of Civil Engineering and Transportation, South China University of Technology, Guangzhou, China
- 3Guangdong Engineering Technology Research Center of Safety and Greenization for Water Conservancy Project, Guangzhou, China
Dam-break flood simulation can evaluate the impact of a dam break, and is significant in conducting risk analyses, creating emergency plans, and mitigating calamities. In this study, the dam-break flood evolution process in the downstream areas of Minzhi Reservoir in Shenzhen, China, was investigated using a two-dimensional shallow-water model. The two-dimensional shallow-water model was utilized for solving two-dimensional shallow water equations for free-surface flow using the finite volume method. A refined grid with an unstructured mesh of triangular cells constrained by building walls was constructed in this model to represent urban structures. The dam-break flood hydrograph and the process of the expansion of the flood under different failure conditions were determined by adopting two breach mechanisms, namely, the instantaneous and gradual dam break mechanisms. The results indicated that the peak flow of the instantaneous dam break was relatively large at the beginning of the dam break. The peak flow in the case of the gradual dam break was comparatively small when seepage failure deformation occurred near the upper part of the dam. The inundation information obtained during the evolution of the dam-break flood, including information regarding the regularity of the flood evolution, distribution of the maximum water depth, and variation of the depth and velocity with time, were also analyzed.
Introduction
Dams and reservoirs are vital hydraulic structures used for flood storage and energy supply, and they also play an increasingly important role in regional and national economic development. However, the use of reservoirs creates potential risks because of the massive quantity of water that is stored in reservoirs. A broken reservoir dam results in dam-break flood, leading to the rapid release of large volumes of water. It may have devastating consequences on human lives, property, and infrastructure (Penna et al., 2013; Azeez et al., 2019), especially in urban areas and in areas with a high population density and high property concentration.
Compared to other types of dams, such as concrete and rubber dams, earth dams have simple structures, and their loose soil particles have a relatively high probability of breaching. There are two major types of dam-break mechanisms: gradual dam break and instantaneous dam break. Currently, significant progress, with high stability and accuracy, has been made in research on the instantaneous dam-break mechanism (Renzhi, 1982). However, stability and accuracy cannot be guaranteed in the case of a gradual dam break although several cases of gradual dam breaks have been investigated; this is because vital information regarding the gradual failure process is obtained through visual inspection. Studies on gradual failure can be classified into two categories. In the studies belonging to the first category, the regression equation is established using key parameters, such as dam height and reservoir storage capacity, to simulate the dam-break process (Macdonald and Langridgemonopolis, 1984; Wahl, 2004). In the studies belonging to the second category, the failure process of the internal structure of the dam is investigated based on fluid mechanics, dam hydraulics, and other disciplines to construct a considerably objective failure process model, such as dam-break model (Bechteler and Broich, 1991), BEED model (Singh, 1996), and Breach model (Fread, 1988). These models were developed based on previous failure instances, and essential details regarding the gradual failure process are not sufficiently accurate. Furthermore, these models are generalized at various levels, and researchers cannot determine the levels of generalization that provide satisfactory results. In general, although significant achievements have been made on dam-break simulations, theoretical developments are still required to improve the accuracy and stability of the results.
Studies on urban floods in urban areas are significant both theoretically and in actual flood control planning. In the last few decades, shallow water equations (SWEs) have been developed to provide relatively accurate numerical solutions that describe the flow characteristics of dam breaks. These SWEs were derived via the vertical integration of the Navier–Stokes equations using the boundary conditions of bottom and surface water. Academically, the three principal numerical approaches for simulating the urban floods are the finite difference method (Seyoum et al., 2012), the finite element method (Quecedo and Pastor, 2002; Hervouet, 2007; Karna et al., 2011), and the finite volume method (FVM) (Gallegos et al., 2009; Xia et al., 2019; Xing et al., 2019). With the development of numerical simulation technology, researchers gradually pay attention to the computational efficiency of the model. Neal et al. (2012) stated that the simplified form of the SWEs can achieve the same accuracy as the SWEs with a relatively less calculation time. In recent decades, several main simplified forms, such as the diffusive wave equations, the inertial formulation equations, and the kinematic wave equations, have been widely used in simulating urban floods (Chen et al., 2005; Yin et al., 2015; Li et al., 2020). Meanwhile, the graphic processing units (GPUs) accelerated computing technology has been noticed in reducing computational cost. Liang et al. (2015) presented a GPU-accelerated urban flood model and they accelerated the model’s computational process up to nine times faster with the GPU parallel computing technology. The model proposed in this paper, the two-dimensional shallow-water model (SWM-2D) (Yu, 2015; Yu et al., 2015), is a FVM-based model for urban flood modeling. An implicit dual time-stepping method is implemented in SWM-2D to improve computational efficiency and it can reduce computational cost by 55–78% compared to the explicit time scheme with the same algorithm. The SWM-2D utilizes the Godunov-type FVM and the Harten-Lax-van Leer-Contact approximate Riemann solver to overcome the primary difficulties encountered in solving the SWEs including the wetting-drying boundary and hydraulic jumps problems. Chen et al. (2018) coupled the SWM-2D and the storm water management model and applied the validated model to simulating the inundation response to rainstorm patterns in an urban area. These studies showed that the SWM-2D has been exhibited an outstanding performance in modeling urban floods.
With the more frequent occurrence of urban flooding, urban flood modeling has increasingly gained the attention of researchers. As a significant feature in urban areas, the obstruction of impervious structures and preferential flow paths between buildings is an important factor that should be considered. In recent years, several studies have focused on the influence of impervious structures (Yu and Lane, 2006; Schubert et al., 2008; Neal et al., 2009). These studies have demonstrated that impervious structures and street slopes are significant factors with regard to flow paths in urban flood modeling. Furthermore, different methods have been proposed for describing the impact of impervious structures, such as building hole methods (Aronica and Lanza, 2005; Schubert et al., 2008), building resistance methods (Liang et al., 2007; Gallien et al., 2011), and building block methods (Hunter et al., 2008). These different methods are based on various data requirements with different complexities. However, the relationships between the complexity of the data and the accuracy of the method are unclear.
This paper researches the dam-break flood propagation process caused by various hypothetical dam failure modes of the Minzhi Reservoir Dam in Shenzhen, China. We firstly obtained the flood discharge hydrographs under four dam-break modes. Then the SWM-2D model was applied to simulate possible dam-break scenarios in urban areas. The flood propagation processes under different dam-break scenarios were illustrated and compared. The main innovations of this paper are 1) the different characteristics of flood flows under four dam failure modes were presented; 2) the significant impact of impervious buildings on dam-break flood propagation was studied with a self-developed model, SWM-2D model. The remainder of this study is organized as follows: Materials and Methods presents the flood discharge hydrographs and the SWM-2D model; Results shows the results obtained by the numerical simulation. Finally, discussion and conclusion are drawn in Discussion and Conclusion.
Materials and Methods
Research Area
Minzhi Reservoir is situated in the Longhua New District in Shenzhen, China. The total reservoir capacity is 4.02 million m3 at a check water level of 82.36 m, and the constant reservoir capacity is 2.71 million m3 at a water level of 79.58 m. Minzhi Street, which covers a total area of 26 km2 with a population of 427,000, is located in the downstream area of the Minzhi Reservoir. If the dam in the Minzhi Reservoir is broken, the dam-break flood from the rapidly released water will cause severe damages to lives, property, and infrastructure downstream. Considering the topography and area that would probably be submerged, a study area of 4 km2 was examined in this study. Furthermore, three typical positions, Hengling Village in the upstream area near the reservoir (P1), residential and business districts around the midstream (P2), and the Shuiwei New Village in the downstream area (P3) were selected for detailed analysis. Figure 1 shows the research area highlighted with red-bordered lines and three typical positions.
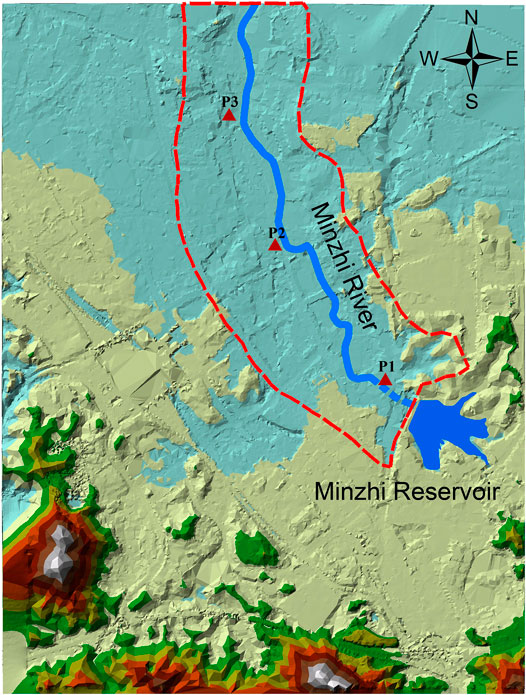
FIGURE 1. Location of the study area and the three typical positions: P1, P2, and P3.
Failure Modes and Dam-Break Discharge
The main dam of the Minzhi Reservoir is an earth dam, and a gradual dam break is the most probable case. Because the risk of an instantaneous dam break owing to potential earthquakes or other natural factors (e.g., landslides) is higher than that of the occurrence of a gradual dam break, two breach mechanisms were adopted in this study to simulate the dam failure process and plot the flood hydrograph. These are the instantaneous (including partial and complete dam break) and gradual dam break mechanisms.
Regarding the calculation of the instantaneous dam-break discharge, there is a slight difference between the two methods. Following the approach used by Renzhi (1993), a series of formulas was used to calculate the peak discharge of the dam-break in this study. The discharge equation is expressed as follows:
where
Assuming that
For the calculation of the gradual dam-break discharge, we assume that the dam initially undergoes seepage deformation to a certain extent, after which the dam body undergoes instantaneous failure. The seepage deformation of the dam begins with the formation of a small hole and expands gradually. In this case, the dam-break flood discharge is calculated using the following equation proposed by Yuanfang (2010):
where
Two breach mechanisms were adopted in this study: instantaneous dam-break (including partial and complete dam-break) and gradual dam-break. Four failure conditions were considered to simulate the dam-break. Table 1 lists the details of the failure conditions.
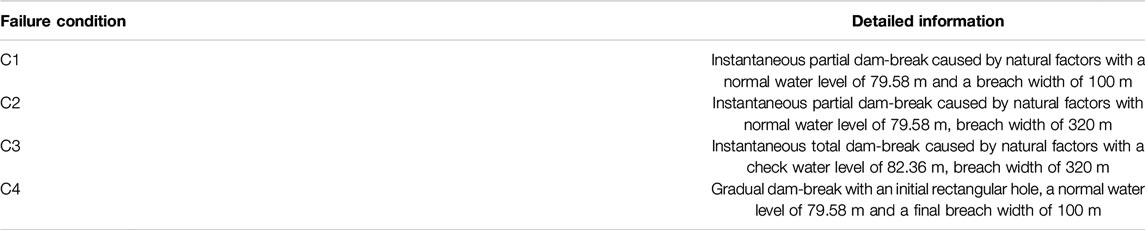
TABLE 1. Four different failure conditions.
The Two-Dimensional Shallow Water Model
The SWM-2D is a FVM based model used for modeling free-surface flow by solving the two-dimensional SWEs, which is the simplified form of the three-dimensional Navier–Stokes equations considering the vertical average, where the non-linear terms necessitate the adoption of certain assumptions and approximations when the horizontal length scale is significantly larger than the vertical scale. The matrix form of governing equations is expressed as follows:
where
where
A Godunov-type FVM based on an unstructured mesh is implemented in the SWM-2D. The integral form of governing equations is:
where
Several sets of data were obtained to establish the flood inundation model. 1) A digital elevation model constructed using discrete elevation data was developed for constructing the terrain model. 2) According to the previous relevant investigations by Shenzhen Water Planning & Design Institute Co., Ltd., China, the value of the Manning coefficient n was set to 0.03 in this study. 3) Information on building footprints was outlined based on a computer-aided design file for the mesh generation using the building-hole method.
In this study, the mesh consisted of 65,089 triangle cells, and the meshes around the buildings were refined for the detailed analysis of the effect of impervious structures. The minimum mesh size around the buildings was approximately 1 m2. Three types of boundary conditions were used in the model. The first boundary condition was the free-slip wall boundary condition, which was formulated for the building walls; the interior of this boundary type does not participate in the water exchange. The second boundary condition was the dam-break flood discharge, which was determined in the previous section and is applied at the breach position. The third condition was the free outflow boundary condition, which exists along the research area boundaries.
Results
Analysis of Dam-Break Flood Hydrographs
The flood hydrographs of the dam-break under four hypothetical conditions, as shown in Figure 2, were plotted based on the different reservoir water levels (normal water level and check water level) using the equations in Failure Modes and Dam-Break Discharge section.
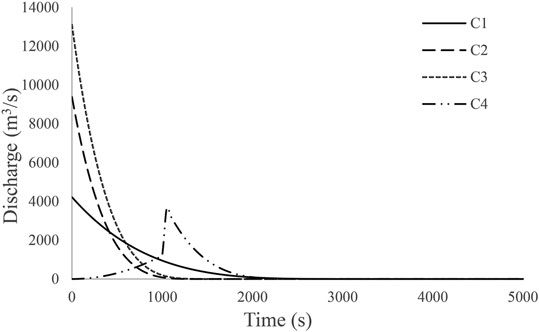
FIGURE 2. Flood hydrographs under different conditions.
Figure 2 shows that for the instantaneous dam break, the discharge reaches its maximum value at the initial moment of the breaking of the dam, and then drops rapidly with a continuous decrease in water level in the reservoir because of the flood outflow. In addition, there was a significant positive correlation between the maximum peak discharge and the breach width, and a negative correlation with the duration of the flood. Regarding the gradual dam break, the dam-break discharge slowly increased with the gradual widening of the hole width of the hole at the initial seepage deformation. Owing to the failure of the dam body after seepage deformation developed, the flood discharge rapidly reached the maximum value, similar to the case of the instantaneous dam break. During this discharge process, the maximum discharge in the seepage deformation stage was 1,206 m3/s, and it rapidly reached 3,632 m3/s when the dam body experienced failure. The detailed parameters of the flood discharge under different operating conditions are listed in Table 2.
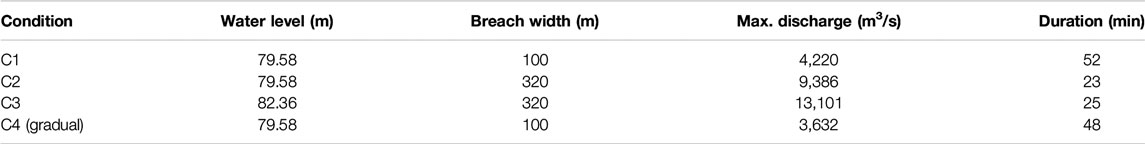
TABLE 2. Flood parameters under different conditions.
Analysis of Water Volume Balance
To ensure the rationality of this model based on the SWM-2D, the analysis of water balance is essential. The discharge flow was calculated using the dam-break flood hydrograph, and the water volume in the inundation area was obtained from the simulation results. The approach for verifying the water volume balance involved comparing their differences. Table 3 shows the comparison between the discharged flow and water volume in flood model inundation areas under the failure condition 3 at 1, 5, 10, 25, and 40 min. From Table 3, the water volumes obtained using the two statistical methods were almost equal, and the model was rational with respect to the water balance because the maximum relative error was only 0.99%.
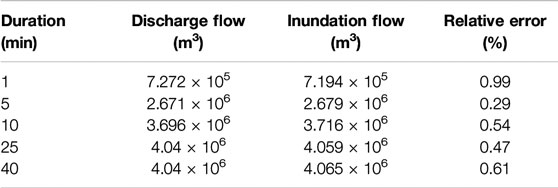
TABLE 3. Analysis of water balance.
Flood Inundation Information
The most severe submerged condition (condition 3) was selected for detailed analysis. The flood inundation maps at different times are shown in Figure 3.
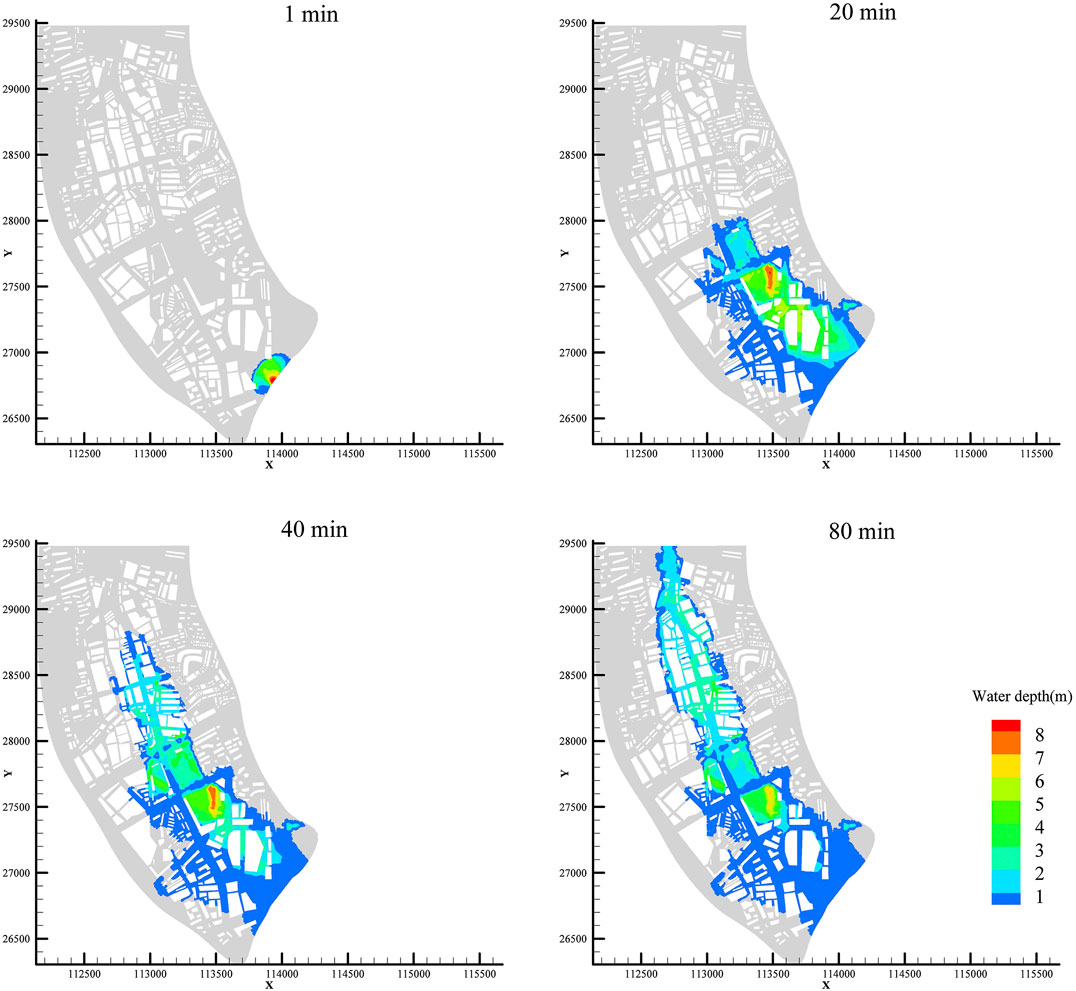
FIGURE 3. Inundation extent under condition 3 at 1, 20, 40, and 80 min.
From the flood inundation maps in Figure 3, we can observe the complete process of flood routing in the research area. Within 1 min of the dam break, the upstream residential areas were rapidly submerged owing to the outflow of a significant quantity of flood water at a high flow velocity. Within 20 min, the flood submerging range extended to the middle reaches, where residential and commercial buildings were concentrated, and the dam-break flood continued to expand as it traveled downstream. Within 40 min, downstream areas are affected by the dam-break flood. The flood began to recede slowly because of the influence of dense impervious structures after 80 min.
The maximum submerged depth of water refers to the maximum submerged water level during the evolution of a dam-break flood. It is an indicator of the severity of flood submergence: the higher the maximum submerged water depth, the more severe the damages. The maximum submerged depth of the flood can aid in evaluating the distribution of the areas severely affected owing to the dam-break flood in the urban area. From the simulation results, the maximum submerged depth information of each grid under the four conditions was extracted, as displayed in Figure 4.
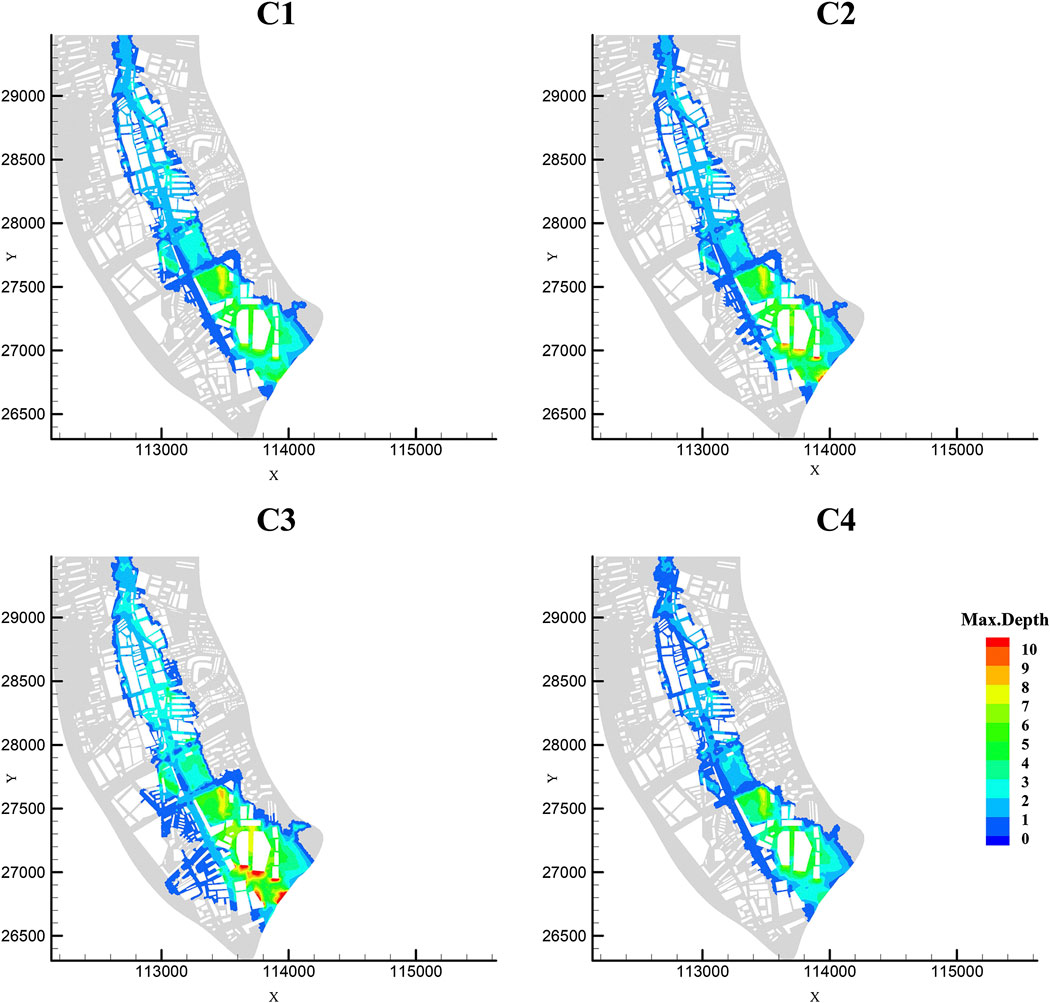
FIGURE 4. Maximum submerged depth under different failure conditions (C1–C4).
Form the maximum submerged depth maps, we can observe that during the occurrence of an urban dam-break flood, the maximum submerged water depth was significantly influenced by the local buildings. The maximum water depth can reach 18 m in the worst case (condition 3) in the front of the building which is most closed to the dam breach. And the water depth between the buildings is relatively lower owing to the restrictions provided by the streets on the flood discharge. The main reason for this trend was that the flood water was obstructed by local impervious structures when the dam-break flood entered the city. Thus, it could not flow out within a short period through the roads or streets, where the terrain was flat or the surface elevation was significantly lower, but the channel is considerably narrow. Hence, the water level rose rapidly in the region in front of the buildings.
Analysis of Water Depth and Velocity
We selected three typical positions in the analysis of the flood routing results to demonstrate the regularity of the flood evolution process of a dam-break flood and to provide a better representation of the developmental process. The positions were in the concentrated residential areas and were severely affected by the flood; the positions included Hengling Village at the upstream near the reservoir (P1), the residential and business districts around the midstream (P2), and Shuiwei New Village at the downstream (P3). Figures 5, 6 show the water depth and velocity variations, respectively, with time, at the typical positions under the four failure conditions.
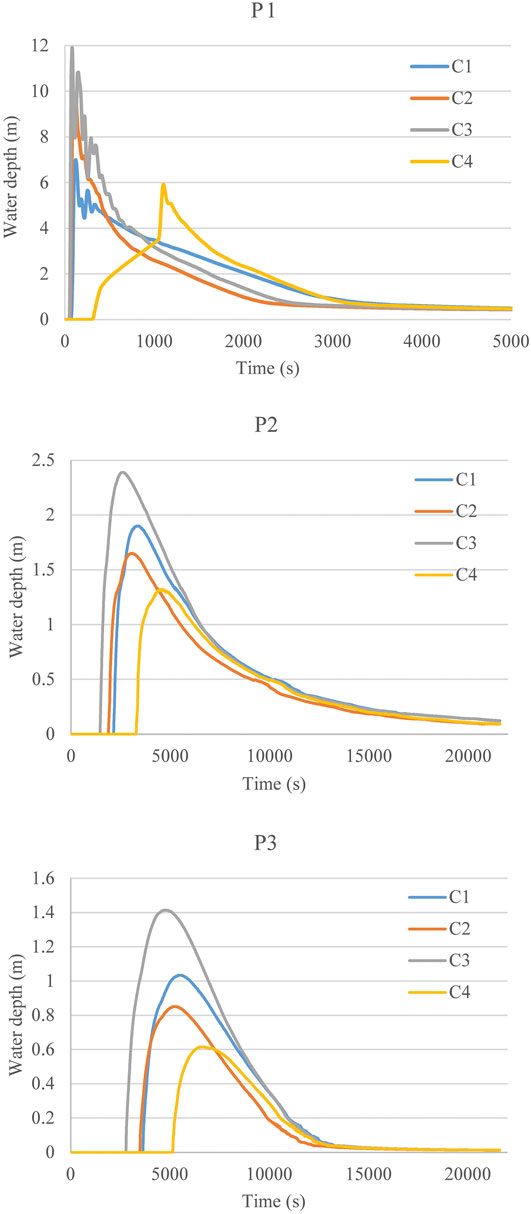
FIGURE 5. Depth–time graphs at P1, P2, and P3 under condition C1–C4.
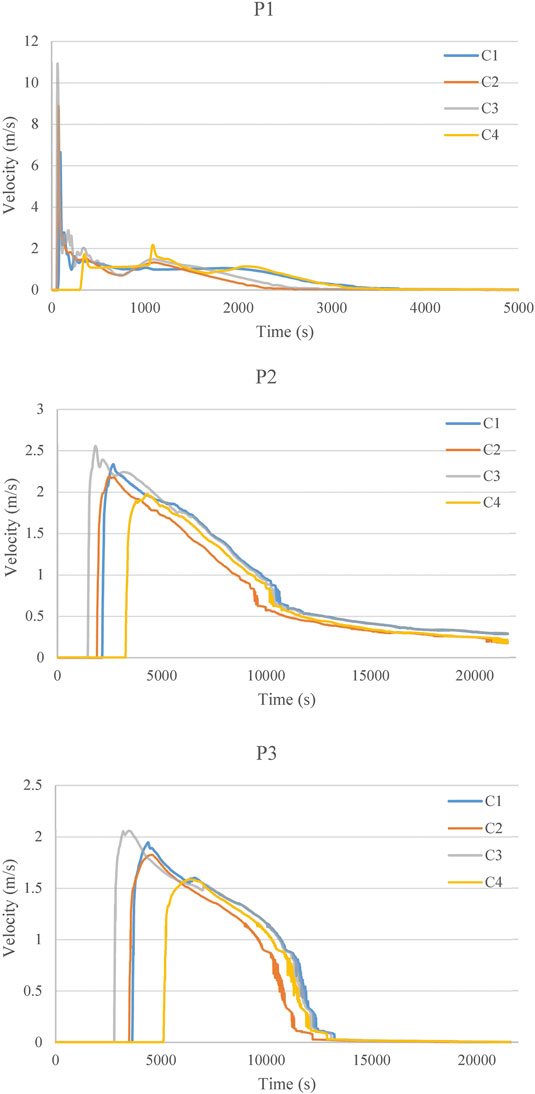
FIGURE 6. Velocity–time graphs at P1, P2, and P3 under condition C1–C4.
For the instantaneous dam break, the depth-time graphs indicate that the water depth at each typical position increases rapidly with the occurrence of the upstream flood, and there was variation in the increase in the water depth with respect to different reservoir water levels. The dam-break flood arrived at Hengling Village within 50 s with rapidly rising water levels, and the water depth could reach a maximum of 11.91 m under failure condition 3. Subsequently, the water depth decreased significantly until the reservoir was empty. Moreover, the maximum water depths were comparatively low under the other failure conditions. And there is still a pounding after the flood receded because of the relatively low topography. The regularity of the flood evolution processed at P2 and P3 was similar. But there still exists some differences that compared to condition 1, the maximum water depth at P2 and P3 are lower under condition 2, although the peak discharge of condition 2 is larger. The reason for this situation can be indicated by the flood hydrographs and the flood wave propagation. In condition 2, the flood extent in upstream areas is much larger because of the wider breach of the dam and the higher flood peak discharge. With the same total volume of dam-break flood water, the water depth at P2 and P3 is lower under condition 2 because of the more powerful restrictions provided by more impervious structures upstream on the flood discharge. Unlike in the case of the instantaneous dam-break, the rate of increase in the water depth for the gradual dam break was slower when the dam-break flood had just arrived at P1 because of the effect of the initial seepage deformation stage. However, this phenomenon was observed only at P1 because P2 and P3 were far from the dam breach position, and the deformation effect becomes slighter and can be neglected. The maximum water depth slightly decreased, and the flood arrival time is delayed evidently because the dam-break discharge is small and increases slowly at the initial time of failure.
The velocity–time graphs presented above show the regularity of the velocity variation with time at each typical position. The maximum flow velocity along the typical positions decreased gradually as the flood flowed downstream. At Hengling Village (P1), a maximum flow velocity exceeding 10.7 m/s can be attained under failure conditions 3, which may damage the buildings. the water depth decreased significantly until the reservoir was empty. However, at positions 2 and 3, which were far from the breach position, the flow velocity dropped to below 2.5 m/s and had a slight influence on the structural safety of the buildings. The flow velocity in the case of the gradual dam break was significantly slower than that in the case of the instantaneous dam break, and this phenomenon was particularly evident in the area near the breach position. Furthermore, a similar phenomenon was observed in the case of the regularity of the water depth. This could be owing to the dam-break flood effect caused by the different failure modes (instantaneous dam break and gradual dam break), which gradually becomes evident with a decrease in the distance between the affected area and the breach position. Table 4 shows the key parameters in the flood routing progress.
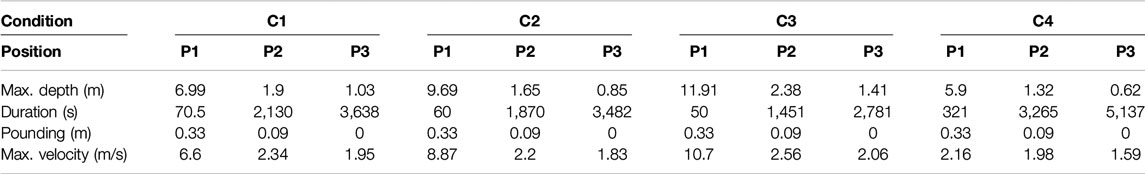
TABLE 4. Key parameters in the flood routing progress.
Discussion and Conclusion
In this study, the dam-break flood hydrographs under various hypothetical failure modes, including instantaneous dam-break and gradual dam-break, were calculated. The 2D hydrodynamic model based on the SWM-2D was built to study the flood wave propagation caused by four different hypothetical failure modes for the downstream urban areas of the Minzhi Reservoir Dam in Shenzhen, China.
Dam-break floods in urban areas can lead to different flow problems and it is difficult to resolve these problems using numerical methods, such as flows with highly unsteady, hydraulic jumps, and wetting and drying problems. In this study, the feasibility of the dam-break model based on the SWM-2D is verified preliminarily, according to the analysis results of the water volume balance and hazard data (such as data regarding the regularity of the flood evolution, the variation of water depth and velocity with time, and the distribution of the maximum water depth) obtained during the evolution of the dam-break flood.
The flood hydrographs indicate that the water level in a reservoir when the dam break occurs plays a significant role in discharge forecasting, especially for the upstream areas. In addition, particularly for the gradual dam break, the prediction of the breach geometry is a critical factor in the dam-break simulation, but the accuracy of the prediction is difficult to guarantee. Hence, the real-time monitoring of the reservoir water level is a significant prerequisite in dam safety programs and the flood risk management of dam failure.
The various flood inundation maps show that impervious structures have a crucial impact on the regular pattern of dam-break flood propagation in urban areas. And the distance in-between adjacent impervious buildings is a important parameter to the influence of impervious structures on inundation flow because this aspect is related to the possibility for water to penetrate inside a block of buildings. As Bruwier et al. (2018) indicated, in flood-resilient urban planning, increasing the spacing between buildings will significantly reduce the backwater effect of impervious buildings on inundation flow. The variation of flood hydrographs has a significant influence on the submerged condition of the upstream areas. But with the obstruction of impervious structures and the consumption of flood energy, the impact of variation of flood hydrographs decreases gradually, especially in the residential areas with dense impervious structures. And the results also indicate that a higher peak flood discharge does not always lead to a higher water depth. The reason for this situation can be that the flood extent in upstream areas may be much larger with a higher flood peak discharge, while the total volume of dam-break flood is the same. This situation can result in a lower water depth in the downstream areas with a higher peak flood discharge.
Compared to other flood models, the effect of impervious structures is particularly significant in the urban flood model. The building hole method can be used to describe the shape of buildings accurately, and the method demonstrates exceptional performance in simulating the obstruction of impervious structures. However, considering the significant complexities of building shapes, the use of this method can result in unexpected mesh refinements. This phenomenon also occurs around the narrow gaps between the impervious structures and facilities with complex outlines, which can increase the calculation time.
Author Contributions
WW, WC developed the model and analyzed the simulation results; WW, WC discussed the results; WW drafted the manuscript and WC critically revised the paper; GH designed and supervised the study.
Funding
This work was funded by the National Key R&D Program of China (2017YFC1502704); the National Natural Science Foundation of China (51739011).
Conflict of Interest
The authors declare that the research was conducted in the absence of any commercial or financial relationships that could be construed as a potential conflict of interest.
References
Aronica, G. T., and Lanza, L. G (2005). Drainage efficiency in urban areas: A case study. Hydrol. Process. 19 (5), 105–1119. doi:10.1002/hyp.5648
Azeez, O., Elfeki, A. M. M., Kamis, A. S., and Chaabani, A. (2019). Dam break analysis and flood disaster simulation in arid urban environment: The Um Al-Khair dam case study, Jeddah, Saudi Arabia. Nat. Hazards. 100, 1011–1995. doi:10.1007/s11069-019-03836-5
Bechteler, W., and Broich, K. (1991). Effects in Dam-Break Modeling. Madrid, Spain: Congress of the International Association Hydraulic Research, IAHR.
Bruwier, M., Mustafa, A., Aliaga, D. G., Archambeau, P., Erpicum, S., Nishida, G., et al. (2018). Influence of urban pattern on inundation flow in floodplains of lowland rivers. Sci. Total Environ. 622–623, 446–458. doi:10.1016/j.scitotenv.2017.11.325
Chen, A. S., Hsu, M. H., Chen, T. S., and Chang, T. J. (2005). An integrated inundation model for highly developed urban areas. Water Sci. Technol. 51 (2), 221–229. doi:10.2166/wst.2005.0051
Chen, W., Huang, G., Zhang, H., and Wang, W. (2018). Urban inundation response to rainstorm patterns with a coupled hydrodynamic model: A case study in Haidian Island, China. J. Hydrol. 564, 1022–1035. doi:10.1016/j.jhydrol.2018.07.069
Fread, D. (1988). BREACH, An Erosion Model for Earthen Dam Failures. MD, United States: Hydrologic Research Laboratory, National Weather Service, NOAA.
Gallegos, H. A., Schubert, J. E., and Sanders, B. F. (2009). Two-dimensional, high-resolution modeling of urban dam-break flooding: A case study of Baldwin Hills, California. Adv. Water Resour. 32 (8), 1323–1335. doi:10.1016/j.advwatres.2009.05.008
Gallien, T. W., Schubert, J. E., and Sanders, B. F. (2011). Predicting tidal flooding of urbanized embayments: A modeling framework and data requirements. Coast Eng. 58 (6), 567–577. doi:10.1016/j.coastaleng.2011.01.011
Hervouet, J.-M. (2007). Hydrodynamics of Free Surface Flows: Modelling with the Finite Element Method. New York: Wiley Online Library.
Hunter, N. M., Bates, P. D., Neelz, S., Pender, G., Villanueva, I., Wright, N. G., et al. (2008). Benchmarking 2D hydraulic models for urban flood simulations. Water Manag. 161 (1), 13–30. doi:10.1680/wama.2008.161.1.13
Karna, T., De Brye, B., Gourgue, O., Lambrechts, J., Comblen, R., Legat, V., et al. (2011). A fully implicit wetting-drying method for DG-FEM shallow water models, with an application to the Scheldt Estuary. Comput. Methods Appl. Mech. Eng. 200 (5), 509–524. doi:10.1016/j.cma.2010.07.001
Li, H., Gao, H., Zhou, Y., Xu, C.-Y., Ortega, M. R. Z., and Sælthun, N. R. (2020). Usage of SIMWE model to model urban overland flood: A case study in Oslo. Hydrol. Res. 51 (2), 366–380. doi:10.2166/nh.2020.068
Liang, D., Falconer, R. A., and Lin, B. (2007). Coupling surface and subsurface flows in a depth averaged flood wave model. J. Hydrol. 337 (1), 147–158. doi:10.1016/j.jhydrol.2007.01.045
Liang, Q., Xia, X., and Hou, J. (2015). Efficient urban flood simulation using a GPU-accelerated SPH model. Environ. Earth Sci. 74 (11), 7285–7294. doi:10.1007/s12665-015-4753-4
Macdonald, T. C., and Langridgemonopolis, J. (1984). Breaching characteristics of dam failures. J. Hydraul. Eng. 110 (5), 567–586. doi:10.1061/(ASCE)0733-9429(1984)110:5(567)
Neal, J. C., Bates, P. D., Fewtrell, T. J., Hunter, N. M., Wilson, M. D., and Horritt, M. S. (2009). Distributed whole city water level measurements from the Carlisle 2005 urban flood event and comparison with hydraulic model simulations. J. Hydrol. 368 (1), 42–55. doi:10.1016/j.jhydrol.2009.01.026
Neal, J., Villanueva, I., Wright, N., Willis, T., Fewtrell, T., and Bates, P. (2012). How much physical complexity is needed to model flood inundation? Hydrol. Process. 26 (15), 2264–2282. doi:10.1002/hyp.8339
Penna, I. M., Derron, M. H., Volpi, M., and Jaboyedoff, M. (2013). Analysis of past and future dam formation and failure in the Santa Cruz River (San Juan province, Argentina). Geomorphology 186 (2), 28–38. doi:10.1016/j.geomorph.2012.12.011
Quecedo, M., and Pastor, M. (2002). A reappraisal of Taylor–Galerkin algorithm for drying–wetting areas in shallow water computations. Int. J. Numer. Methods Fluid. 38 (6), 515–531. doi:10.1002/fld.225
Renzhi, X. (1982). Computation for the discharge from the site of dam-break. J. Nanjiang Hydraul. Res. Inst. (1), 43–58. doi:10.16198/j.cnki.1009-640x.1982.01.004
Schubert, J. E., Sanders, B. F., Smith, M. J., and Wright, N. G. (2008). Unstructured mesh generation and landcover-based resistance for hydrodynamic modeling of urban flooding. Adv. Water Resour. 31 (12), 1603–1621. doi:10.1016/j.advwatres.2008.07.012
Seyoum, S. D., Vojinovic, Z., Price, R. K., and Weesakul, S. (2012). Coupled 1D and noninertia 2D flood inundation model for simulation of urban flooding. J. Hydraul. Eng. 138 (1), 23–34. doi:10.1061/(asce)hy.1943-7900.0000485
Wahl, T. L. (2004). Uncertainty of predictions of embankment dam breach parameters. J. Hydraul. Eng. 130 (5), 389–397. doi:10.1061/(asce)0733-9429(2004)130:5(389)
Xia, X., Liang, Q., and Ming, X. (2019). A full-scale fluvial flood modelling framework based on a high-performance integrated hydrodynamic modelling system (HiPIMS). Adv. Water Resour. 132, 103392. doi:10.1016/j.advwatres.2019.103392
Xing, Y., Liang, Q., Wang, G., Ming, X., and Xia, X. (2019). City-scale hydrodynamic modelling of urban flash floods: The issues of scale and resolution. Nat. Hazards. 96 (1), 473–496. doi:10.1007/s11069-018-3553-z
Yin, J., Yu, D., Yin, Z., Wang, J., and Xu, S. (2015). Modelling the anthropogenic impacts on fluvial flood risks in a coastal mega-city: A scenario-based case study in Shanghai, China. Landsc. Urban Plann. 136, 144–155. doi:10.1016/j.landurbplan.2014.12.009
Yu, D., and Lane, S. N. (2006). Urban fluvial flood modelling using a two-dimensional diffusion-wave treatment, part 1: Mesh resolution effects. Hydrol. Process. 20 (7), 1541–1565. doi:10.1002/hyp.5935
Yu, H., Huang, G., and Wu, C. (2015). Efficient finite-volume model for shallow-water flows using an implicit dual time-stepping method. J. Hydraul. Eng. 141 (6), 04015004. doi:10.1061/(asce)hy.1943-7900.0000998
Yu, H. (2015). Research on numerical simulation technology of urban floods. dissertation/doctoral thesis. Guangzhou: South China University of Technology.
Keywords: dam-break, flood propagation, shallow-water equations, numerical models, urban area
Citation: Wang W, Chen W and Huang G (2020) Research on Flood Propagation for Different Dam Failure Modes: A Case Study in Shenzhen, China. Front. Earth Sci. 8:527363. doi: 10.3389/feart.2020.527363
Received: 16 January 2020; Accepted: 18 September 2020;
Published: 05 October 2020.
Edited by:
Mingfu Guan, The University of Hong Kong, Hong KongReviewed by:
Zhiguo He, Zhejiang University, ChinaIlhan Özgen-Xian, Lawrence Berkeley National Laboratory, United States
Copyright © 2020 Wang, Chen and Huang. This is an open-access article distributed under the terms of the Creative Commons Attribution License (CC BY). The use, distribution or reproduction in other forums is permitted, provided the original author(s) and the copyright owner(s) are credited and that the original publication in this journal is cited, in accordance with accepted academic practice. No use, distribution or reproduction is permitted which does not comply with these terms.
*Correspondence: Guoru Huang, aHVhbmdnckBzY3V0LmVkdS5jbg==