 Isabel de Cala1*
 Koji Ohata2
 Robert Dorrell3
 Hajime Naruse2Marco Patacci1Lawrence A. Amy4
 Steve Simmons3
 Stuart J. McLelland3William D. McCaffrey1
- 1School of Earth and Environment, Institute of Applied Geosciences, University of Leeds, Leeds, United Kingdom
- 2Division of Earth and Planetary Sciences, Graduate School of Science, Kyōto, Japan
- 3Energy and Environment Institute, University of Hull, Hull, United Kingdom
- 4School of Earth Sciences, University College Dublin, Dublin, Ireland
The interaction between turbidity currents and mobile substrates can lead to the development of different types of bedforms. Although much research has been conducted on bedform development beneath open channel flows, research into bedform development beneath waning gravity currents is relatively rare. Analysis of density current-related bedform development has therefore relied upon open channel flow phase diagrams. We report on an experimental study designed to assess the development of bedforms under steady and waning saline density currents. The experimental density currents developed stepped density profiles in which a higher-density basal zone was separated from the ambient fluid by a zone of intermediate density; any bedforms that developed were contained within the bottom layer of the current. Under different conditions ripples, dunes, downstream migrating antidunes and long wavelength antidunes were observed to form and could be distinguished based on their interactions and phase relationships with the upper surface of the lower denser layer of the current. Due to limited mixing between the upper and lower layer of the current and maintenance of current momentum, currents set with slowing discharge flow rates maintained a steady flow velocity in the lower layer of the flow. As a result, sustained bedform formative conditions were achieved within this lower layer, while waning current conditions effected the rest of the flow. Under waning currents, it was seen how pre-existing bed states can determine the subsequent evolution of bedforms. This illustrates the limitations of existing phase diagrams as they do not account for trajectory or rate of passage of flows through different bedform phase spaces. In order to establish a reliable quantitative association between the flow regime and the type of bedform development, it is critical to adopt an appropriate Froude number calculation method for stratified flow. The updated density current phase diagram indicates supercritical flow can be achieved at lower flow velocities than for open channel flows due to the effects of reduced gravity. Bedform depositional structures found in outcrop and on the modern sea floor provide data that helps to interpret the hydrodynamic and sedimentological character of the current that formed them. Therefore, understanding the processes involved in bedform development beneath density currents will enable more accurate estimation of the properties of flows.
Introduction
Turbidity currents are a type of buoyancy-driven flow whose density excess arises via turbulent suspension of sediment (Middleton, 1993; Kneller and Buckee, 2000). They are one of the principal means of redistributing sediment, nutrients and pollutants in the world’s oceans (Masson et al., 2006; Galy et al., 2007; Covault, 2011; Dorrell et al., 2014; Azpiroz-Zabala et al., 2017; Pohl et al., 2020) and pose a significant risk to offshore infrastructure (Bruschi et al., 2006; Carter et al., 2014; Clare et al., 2016). The deposits (turbidites) are accumulations of multiple flows and collectively form the largest sedimentary landforms on the Earth’s surface (Kneller, 2013). The interaction between turbidity currents and their substrate may result in the generation of various types of bedforms via processes of sediment erosion, transportation and deposition (Hand, 1974; Garcia and Parker, 1993; Wynn et al., 2000a; Wynn et al., 2000b; Postma et al., 2009; Sequeiros et al., 2010; Postma and Cartigny, 2014). Collection of data directly from active turbidity currents is challenging; due to their magnitude and speed they are known to have destroyed the analytical equipment deployed to measure them (Azpiroz-Zabala et al., 2017; Paull et al., 2018 and references therein). However, via sea floor surveys (Normark et al., 1980; Hughes Clarke, 2016; Hage et al., 2018; Paull et al., 2018), experimental work (Parker et al., 1987; Alexander et al., 2008; Spinewine et al., 2009; Sequeiros et al., 2010; Cartigny et al., 2011; Cartigny et al., 2014; Fedele et al., 2016; Koller et al., 2017; Koller et al., 2019) and more commonly, by studies of bedforms preserved in outcrop (e.g., Bouma, 1962; Hubert, 1966; Keith and Friedman, 1977; Lucchi and Valmori, 1980; Lowe, 1982; Mutti, 1992; Kneller and McCaffrey, 2003; Sylvester and Lowe, 2004; Bakke et al., 2008; Arnott, 2012; Sumner et al., 2012) research into bedform development by turbidity currents has taken place. Yet, interpretation of depositional bedforms structures found in turbidites often relies upon research done for bedforms in open channel flows. Fedele et al. (2016), Koller et al. (2017), Koller et al. (2019), and Sequeiros et al. (2010) have shown that open channel flow bedform phase diagrams incorrectly predict bedform development and morphodynamics beneath density currents. This shortcoming has been attributed to hydrodynamic differences between density currents and fluvial flows (Sequeiros et al., 2010; Fedele et al., 2016; Koller et al. 2017; Koller et al. 2019), illustrating a need for further research to determine what controls bedform formation beneath turbidity currents, in comparison to other environments. Much of our understanding of the hydrodynamic and sedimentological character of turbidity currents is derived from analysis of preserved depositional structures found in turbidites. Therefore, more accurate interpretation of the turbidity current can be achieved via improved understanding of the sedimentological processes responsible for certain depositional products.
Although previous research has mainly focused on the flow dynamics of steady density currents, real-world turbidity currents are commonly characterized by the passage of high velocity heads, followed by progressive waning of mean velocity during passage of the body and tail of the current over periods of hours to days (Kneller and Branney, 1995; Kneller and McCaffrey, 2003; Azpiroz-Zabala et al., 2017). To understand the development of bedforms in the prototype environment, it is therefore critical to understand how bedforms evolve both in steady and waning flow fields. This study presents results from original experiments that examine bedform development under both steady and waning saline density currents. A discussion is presented on the hydrodynamic and sedimentary processes involved in the generation of ripples, dunes and antidunes, as well as the complexities of bedform response to altering bedform phase space conditions under waning currents.
Bedform Classifications and Phase Diagrams
Research into the origin of sedimentary bedforms, their development and their morphodynamics has mainly been carried out for open channel flows (Shields, 1936; Allen, 1962; Allen, 1963; Allen, 1982; Leeder, 2011). This body of work remains the most comprehensive area of research that studies the complex feedback and interactions that take place between a mobile substrate and a flow (Kennedy, 1969; Yalin, 1977; Engelund and Fredsoe, 1982; Ashley, 1990; Bennet and Best, 1995, Bennet and Best, 1996; Colman and Nikora, 2011, among others). Since this body of work underpins the study of bedforms in any sedimentary setting, this research will be referred to throughout this investigation. A review of key aspects relating to this study is therefore presented.
Bedform classification has been the subject of much research which has defined various methods to distinguish between different bedform types. A well-established classification defines bedforms based on the flow regime that generated them (Harms and Fahnestosk, 1965). Subcritical bedforms are defined as lower-regime forms: these are lower-stage plane bed, ripples and dunes. Supercritical bedforms are defined as upper-regime forms: these include upper stage plane bed, antidunes and cyclic steps (Harms and Fahnestosk, 1965; Ashley, 1990; Knighton, 1998; Sun and Parker, 2005; Cartigny et al., 2011).
When comparing dunes and ripples, which are geometrically similar, two approaches recur in the literature: dunes and ripples may be distinguished by associated flow characteristics and bedform interaction with the flow (Bridge and Best, 1988; Bennet and Best, 1995; Bennet and Best, 1996); alternatively, they may be defined according to their dimensions (Guy et al., 1961; Ashley, 1990; Raudkivi, 2006; Colombini and Stocchino, 2011).
It is widely recognized that dunes and ripples differ hydrodynamically (Richards, 1980; Baas, 1994; Bennet and Best, 1995). As dunes and ripples interact with a current, both experience flow separation at the crest. As dunes are relatively larger, flow separation at the crest is greater, as is the associated turbulent wake region and shear layer which generate from the crest and extend downstream (Venditti, 2013). As a result, compared to ripples, dunes generate larger-scale turbulence that arises at the shear layer generated by Kelvin Helmholtz instabilities (Baas, 1994; Bennett and Best, 1996; Schindler and Robert, 2005; Leeder, 2011; Venditti, 2013). The turbulent structures upwell through the entire flow depth (“ejection events”) and can interact with the flow surface (known as “boils”) (Yalin, 1992; Best, 1993; Bennet and Best, 1995; Bennet and Best, 1996; Best, 2005; Fernandez et al., 2006). Ripples have a small separation zone and shear layer that are restricted to the near bed region (30–40% of the water column) and therefore do not interact with the current’s surface (Baas, 1994; Bennett and Best, 1996; Schindler and Robert, 2005; Leeder, 2011; Venditti, 2013). This means that dunes scale with flow depth, while ripples exist independently of flow depth (Jackson, 1976; Yalin, 1977; Schindler and Robert, 2005).
Dunes and ripples may also be defined according to their dimensions (Guy et al., 1961; Ashley, 1990; Raudkivi, 2006; Colombini and Stocchino, 2011; Bartholdy et al., 2015). Distinctions are based on bedform dimensions such as wavelength and height: Ashley (1990) suggests that dune bedform dimensional data – for open channel flow – exists as a single genetic population, separate from smaller ripple forms. While there remains debate in the literature on the best method to distinguish between ripples and dunes (Jerolmack and Mohrig, 2005; Bartholdy et al., 2015), in this study the primary method used to distinguish them was to observe the presence of a phase relationship between dune bedforms and the upper surface of the lower layer of the current (as described by Fedele et al., 2016); for ripples no such relationship exists (cf. Fedele et al., 2016). In addition to studying phase relationships, in this study bedform dimensional data was also collected which was expected to resolve larger dune dimensions compared to ripples.
The type of phase relationship was also observed to differentiate dunes and supercritical bedforms. Under supercritical flow conditions, supercritical bedforms develop as the mobile substrate takes on the shape and amplitude of the surface waves that propagate at the current’s free surface (McLean, 1990; Fourrière et al., 2010). As a result, supercritical bedforms are in phase with the current interface. Antidune development occurs under supercritical flow (Recking et al., 2009). They are free-surface dependent (Cartigny et al., 2014) and may migrate upstream, downstream or remain stationary (Kennedy, 1963). Subcritical bedforms are distinguishable from supercritical bedforms as they have an out-of-phase relationship.
Fedele et al. (2016), Koller et al. (2017), and Koller et al. (2019) investigated the development of bedforms beneath density currents. They chose to differentiate dune and ripple bedforms on the basis of flow characteristics, specifically shear stress. They note that a lower denser layer develops within their experimental saline gravity currents and describe an out-of-phase relationship between dunes and the upper surface of this layer.
Observational, experimental and theoretical modeling, principally under open-channel conditions, have refined understanding of the hydrodynamic and sedimentological conditions associated with bedform generation and growth, leading to the development of bedform stability diagrams (Raudkivi, 1976; van Rijn, 1984; Southard and Boguchwal, 1990; Van den Berg and Van Gelder, 2009). These are widely used to predict the type of bedform that will develop under specific sets of boundary conditions. Based on their experiments, Fedele et al. (2016) developed a new stability diagram for bedforms formed under density currents but noted that further refinement of the bedform stability fields was needed. They noted that collection of more hydrodynamic and sedimentological data under experimentally controlled conditions was required to advance understanding of bedform development under density currents.
Materials and Methods
Experimental Set Up and Methods
Experiments were conducted at the Total Environment Simulator (TES) at the University of Hull (see Figure 1 for setup). The TES is a 14 m long, 6 m wide and 2 m deep tank with two 3 m deep sump tanks situated at either end that hold 21 m3 of water. A density-current channel was placed inside the larger tank. Made of transparent Perspex, and supported by Rexroth beams, it was 10 m long, 0.15 m wide and 0.60 m high. The interior channel was fully submerged when the large tank filled to a depth of 1 m. The sump tanks enabled experiments to be run for 45 min without any back-water effects.
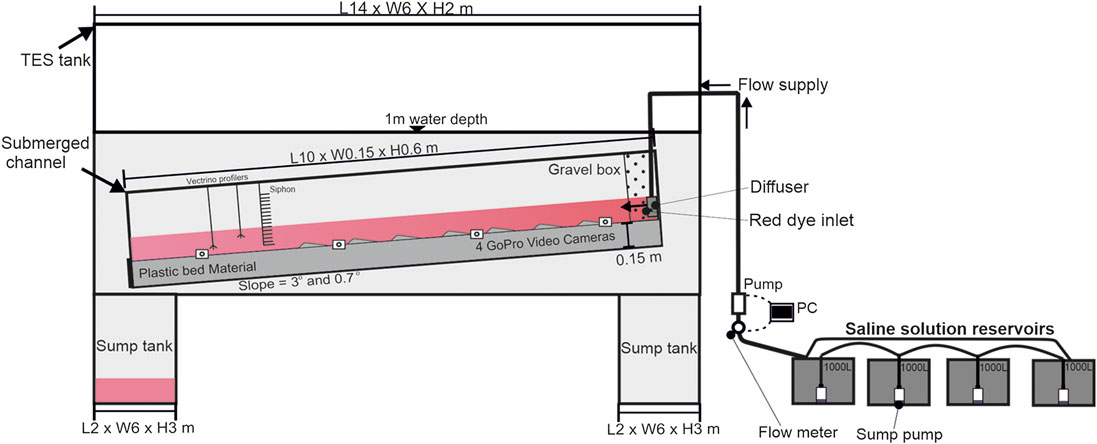
FIGURE 1. Experimental set up.
The flat base of the interior channel was set at 3° for Experiments 1 and 2, then was lowered to 0.7° for Experiments 3, 4, and 5 (Table 1). A mobile substrate comprising plastic sediment particles of median size 427 µm and specific gravity 1.50 was laid to a thickness of 15 cm inside the interior channel; the upper surface was smoothed before the start of each experiment. For each experiment salt was mixed and dissolved into 4,000 L of water to reach 6% salt concentration (1,060 kg m−3). An excess density of 6%, above fresh water ambient (1,000 kg m−3), is equivalent to a suspended sediment load of 3.75% v/v (of density 2,600 kg m−3).
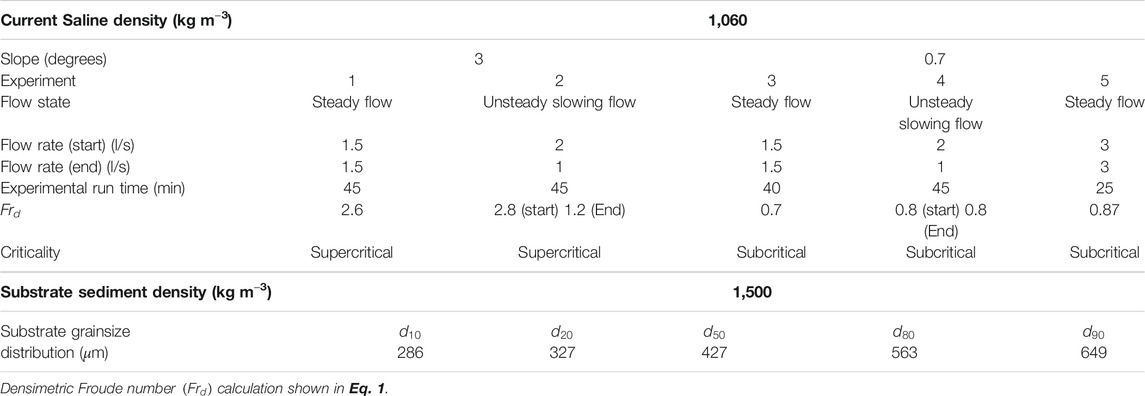
TABLE 1. Experimental parameters and characteristics of the plastic sediment that was used for the channel substrate used in each experiment.
The saline solution was held in four 1,000 L reservoirs each equipped with a sump pump enabling the circulation of the saline solution within the reservoir to ensure the total dissolution of the salt and to prevent the mixture becoming stratified. In this set-up, the sump pumps were also used to mix between the separate reservoirs. Each reservoir was sampled for both temperature and density every 10 min for 1 h prior to each experiment, to check that the saline solution had reached and maintained a density of 1,060 kg m−3. During the experiments a larger pump extracted saline solution from one primary reservoir; the other three were connected to the primary reservoir via the sump pumps, inputting saline solution to maintain a steady hydraulic head throughout the experiment. Once extracted by the larger pump, the saline solution was introduced into the upstream inlet of the submerged interior channel. At the inlet, the flow passed through a diffuser (with concentric tubes and discharge holes) and a 40 cm long and 15 cm wide gravel box to remove the momentum inherited from the pipe flow and to distribute the flow evenly across the width of the flume as a purely gravity driven current. On exiting the gravel box, the saline density current flowed over the substrate. For runs with unsteady flow conditions, a flow meter (MAG5100W electromagnetic) and linked computer program designed in MATLAB controlled the pump speed to ensure that the flow discharge reduced gradually and smoothly over the course of the experiment.
Immediately downstream of the gravel box, a sediment feeder was positioned to deposit more sediment onto the bed, replenishing the substrate as partial scouring took place at the point where the current exited the gravel box. To visualize the current, red pond dye was introduced to the channel at the current outlet via a tube connected to a peristaltic pump. Inputting the dye directly into the channel, rather than mixing it inside the reservoirs, allowed more control over the height at which dye was introduced to the density current. Having periods of colorless flow also enabled better visualization of any bedforms formed.
The measurement equipment included two Nortek vectrino profilers (with sampling frequencies of 100 Hz) to record the downstream, cross-stream and vertical velocity components of the flow. The vectrino probes were orientated and aligned with the downstream (x), cross-stream (y), and vertical (z) directions of the flume, then fixed in place so the three-dimensional components of the flow (x, y, z) were recorded accurately. The vectrinos were positioned at 8 and 7 m from the upstream end of the channel to ensure their presence did not impact bedform development in the middle of the channel. A siphon array connected to a Watson Marlow multichannel peristatic pump was placed into the flume, in front of the vectrinos, at specific times to collect fluid samples. The array sat 4 cm up from the bed and siphoned over 45 cm up through the saline density current and the ambient fluid. The siphon tubes were 3 mm in diameter. Samples consisting of 24 measurement points were taken every 7 min over 2-min intervals. After each collection, the siphon array was removed from the channel while the peristaltic pump remained on. Twenty-four peristaltic pipes, each 7 m long, connected each siphon channel to the sample collection pots outside of the TES. It took 5 min for the collected sample to pass through the piping. This offset timing meant that first samples were collected 5 min after the experiment had started, whilst the last samples were collected in pots 5 min after the experiment had ended. Velocity data collected during siphoning was discarded. Siphon sample density and temperature measurements were collected using a handheld Anton Paar density meter (Model: DMA 35 Basic). These results were recorded within 45 min of their collection to ensure no significant temperature change or evaporation took place that might have affected the density reading.
To collect bedform development data, four underwater GoPro cameras were positioned inside the large tank facing different sections of the interior submerged channel, fixed at bed level height. Each GoPro had a field of view of 2.5 m.
Experimental Parameters
Five experiments were carried out. Both the density of the saline current and the sediment size used for the channel substrate remained constant. The discharge flow rate and slope were varied. Table 1 shows the experimental parameters for each run and details the properties of the plastic sediment that was used for the sediment bed of the flume. This material was chosen as it is coarse enough for the development of a range of bedform types and has a low enough density to enable sediment transport.
The finite amount of saline solution stored in the four reservoirs meant that Experiments 1–4, which were carried out with a discharge between 1 and 2 l/s, had a run time of approximately 40–45 min. At times the pipe that extracted the saline solution from the reservoirs was positioned within a deeper hollow of the irregular base of the reservoir. This resulted in minor variations in total experimental run time between experiments. Experiment 5 was carried out under faster discharge flow rates (3 l/s) and as such the experimental run time was shorter at 25 min.
The Froude number
Nevertheless, the densimetric Froude number (
where U is the average velocity of the lower layer of the density current (m s−1), ρ is the current density,
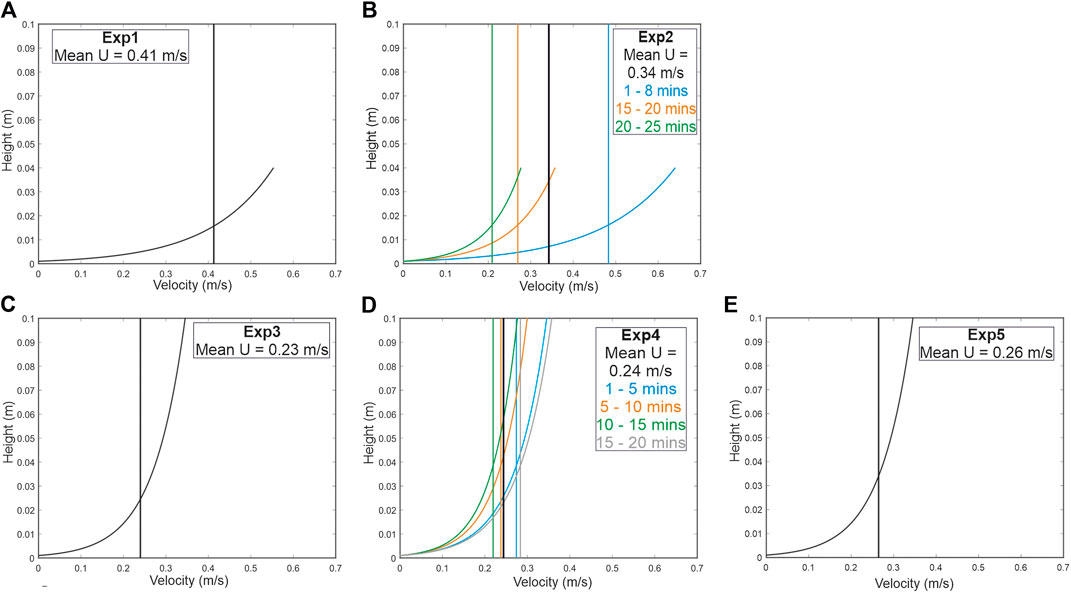
FIGURE 2. Experiments 1–5 (A–E), interpolated velocity profiles based on shear velocity calculations for the lower layer of each density current. For steady flow experiments, shear velocity was time-averaged over the whole run. For unsteady flows, shear velocity was time-averaged over 5-min intervals.
Data Processing
The velocity data was filtered (2SD from a moving mean) to remove any noise and outliers from the dataset. This velocity data was then used to calculate the near bed shear velocity (
The shear velocity is given by the gradient of the velocity profile, where
Analysis of Bedform Dimensions
Videos were taken throughout each experiment to capture bedform dynamics. Images were edited to remove the barrel lens distortion effect. Image processing software (Image J) was used to obtain five x and y coordinates for each bedform: the upstream and downstream bedform troughs, and the crest and mid points of the stoss and lee slopes (Figure 3). Bedform wavelength was calculated by taking the upstream trough from the downstream trough (
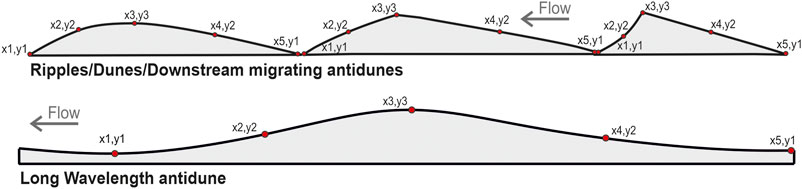
FIGURE 3. Schematic diagram of asymmetric bedforms. The red points depict the locations the x, y coordinates were recorded on each bedform.
Drag Coefficient
The drag coefficient
Results
Current Density
Figures 4A–E show the density profiles measured for each experiment. Figure 4F compares the average density profiles for each experiment. Concentration measurements were not retrieved from the lower 4 cm of the density current, due to the practicalities of suspending the siphon over the channel. It is assumed that densities close to 1,060 kg m−3 were reached in this region, as the flow close to the bed experiences virtually no flow dilution due to upper boundary entrainment.
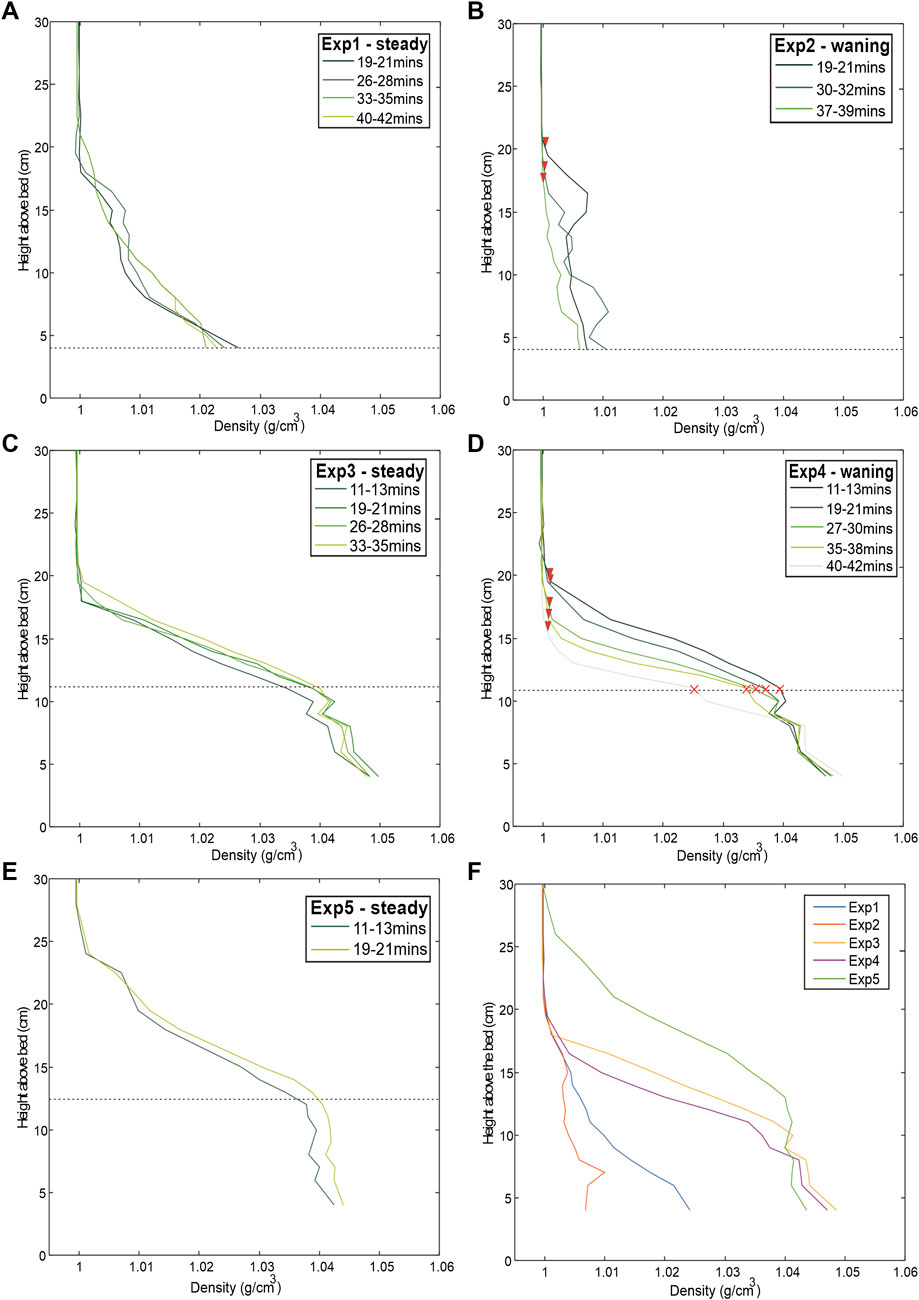
FIGURE 4. Vertical concentration profiles averaged over 2–3 min. The black dashed line denotes the height of the interface between upper and lower denser layer and the red crosses attribute this point to specific profiles, depicting the constant height of the interface throughout the run. Experiments 2 and 4 are waning currents, the red triangles mark the change in height of the upper surface of the current with the ambient fluid over time. They depict the gradual reduction in height as the flow is slowed. Plot (F) shows average density profiles for each run based on available data in (A–E). Experiments 1–5 correspond to plots (A–E), respectively.
The experiments resolved a lower layer in the flow, situated just below the velocity maximum that is denser than the upper layer of the current. Whilst a saline flow is used in the experiments that experiences no inherent stratification from sedimentation, the less dense upper layer is driven by the entrainment of ambient water. To better understand the structure of the current, the bottom layer was dyed red during each run to enable visualization of flow interaction with the bed. Figures 4A–F record the lower denser layer of the flow - the dashed lines on the density profiles depict the position of its upper surface. Experiments carried out on the steeper 3° slope have thinner bottom denser layers, with the surface of the denser layer situated 3–5 cm above the bed. On the shallower 0.7° slope, the bottom denser layer is thicker, with the surface situated 10–15 cm above the bed. Slope therefore appears to be the most significant control on bottom layer thickness, via the development of an associated flow regime; thinner flows are associated with supercritical fast flowing conditions and thicker flows with subcritical, lower flow velocities. Very little mixing appears to take place across the interface between the dense lower layer and the mixing region above. This is evident in Figure 4 where the density profiles show an abrupt transition from the bottom denser layer into the mixing region. This transition is most abrupt for supercritical flows.
Figure 4 also shows how density profiles change with time during runs with steady discharge flow rates (Experiments 1, 3, and 5) compared to runs with waning discharge flow rates (Experiments 2 and 4). The steady runs are characterized by relatively constant density values throughout the experiment, whereas in unsteady runs concentrations higher up in the flow progressively decrease as discharge flow rates reduce. Figures 4B,D show a reduction in height of the boundary between the density current and the ambient water over time (identified by red triangle markers). However, despite a reduction in the overall height of the density current, it is notable that the slowing discharge flow rate was not associated with any change in the thickness of the denser bottom layer, which remained relatively constant. This observation will be explored further within the Discussion section.
Flow Velocity
Figures 5A,B presents the velocity data recorded throughout Experiments 1 and 2. (For Experiments 3–5, the velocity data did not record the velocity maximum, which was situated just above the measurement window). Figure 5 also plots the top of the bed and the height of the upper surface of the lower denser layer of the current, which under supercritical flow was in-phase with the bed. The height of the surface of this lower denser layer is determined using the density profiles (Figure 4), photographs and videos taken throughout the experiments, all of which record the bottom denser layer. In both Figures 5A,B, the height of the velocity maximum either aligns with, or closely corresponds to, the height of the upper surface of the lower denser layer of the current. In Figure 5A, between 15 and 24 min the velocity maximum slightly decreases due to the vectrino being temporarily situated in a bedform trough where the flow is slowed. Figure 5B also shows an overall decrease in the velocity maximum between the start of the run (0–7 min) compared to near the end of the run. This is attributed to increased frictional drag as bedforms have become established upon the bed, whereas between 0 and 7 min (at the point where velocity data was being collected) bedform development had not started.
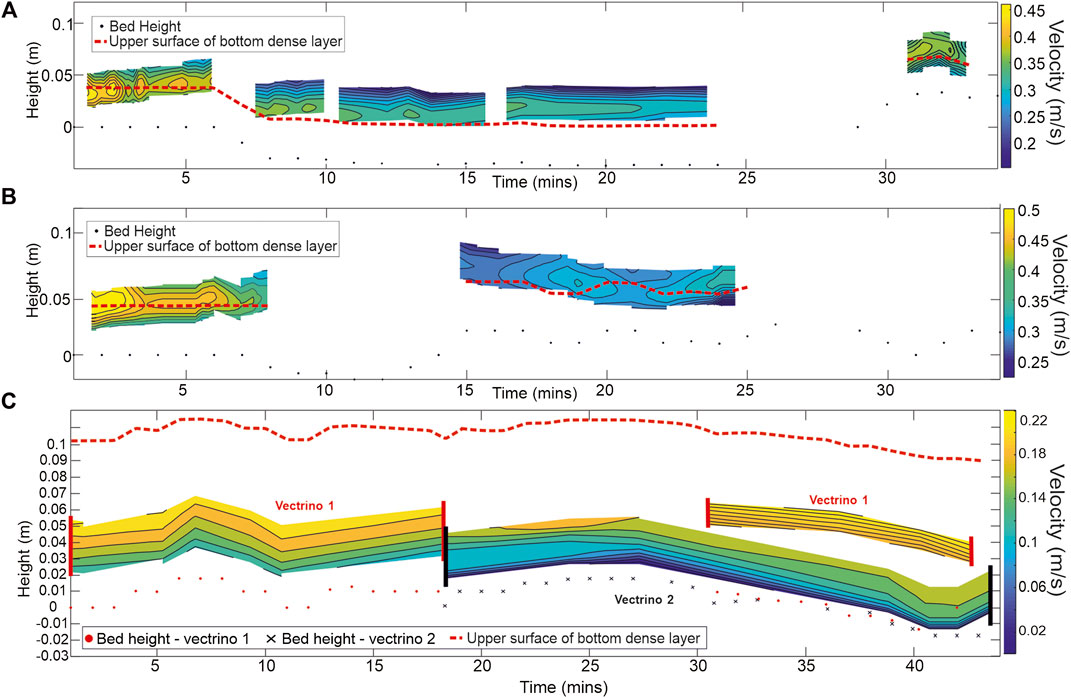
FIGURE 5. Contour plots of the downstream velocity component throughout Experiments 1 (supercritical steady flow) (A) and 2 (supercritical waning flow) (B). The dashed red lines identify the height of the upper surface of the lower denser layer of the density current. The black dots indicate the height of the substrate beneath the vectrino. (C) Contour plot of the downstream velocity component throughout Experiment 4 (subcritical waning flow), recorded within the bottom dense layer of the flow. Velocity measured between 0–18 and 33–43 min was recorded by vectrino one which was positioned higher above the bed. Velocity measured between 18 and 44 min was recorded by vectrino 2, positioned lower in the flow. The red dots indicate the height of the substrate beneath vectrino one and the black crosses indicate the height of the substrate beneath vectrino 2.
Figure 5C depicts how velocity changed throughout Experiment 4. Unlike Experiments 1 and 2, the velocity maximum was not recorded. However, Figure 5C shows that despite the discharge flow rate slowing over the course of the run, the velocity within the bottom layer of the current appears to maintain a relatively steady velocity throughout the run, while the upper layer of the flow wanes (Figure 4D).
Bedforms
Most of the substrate material was carried as bedload and some of the sediment was observed to be transported as suspended load. A variety of bedforms developed during experiments, including ripples, dunes, downstream migrating antidunes and long wavelength antidunes. Figure 6 shows a timeline of bedform development for each experiment, the associated drag coefficient change and the ratio between bedform wavelength and height of the lower layer of the current.
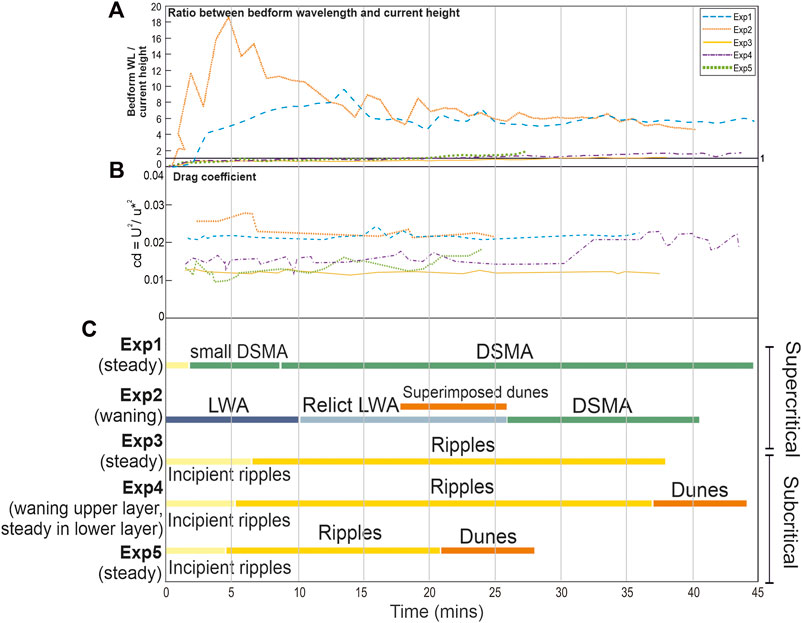
FIGURE 6. (A) Ratio between bedform wavelength and the height of the lower layer of the current. (C) Bedform development timeline for Experiments 1–5 (DSMA, downstream migrating antidunes; LWA, long wavelength antidunes) and (B) the associated drag coefficient change.
As noted previously, bedforms were classified according to the phase relationship of bedforms with the current interface. Bedforms developed within a lower denser layer within the current, and as such bedform phase relationship was determined with respect to the upper surface of the lower dense layer of currents (not the top of the current). To support the results of the phase-relationship method, bedform dimensional data was collected to further help distinguish ripples from dunes. Bedform dimensional data are shown in Figure 7.
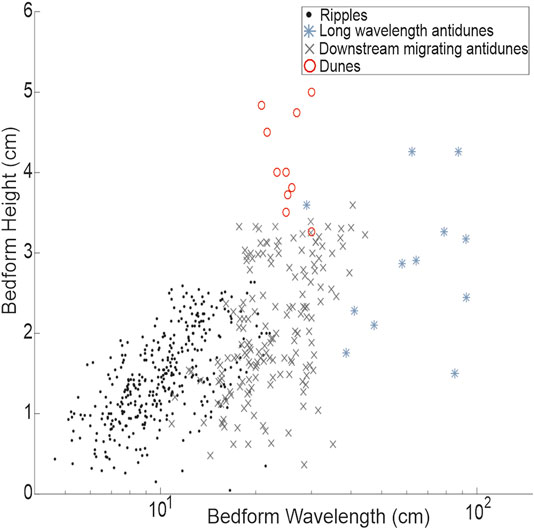
FIGURE 7. Bedform dimensions (data from all experiments).
Subcritical Bedforms
Ripples formed at the start of each run, except for Experiment 2 where long wavelength antidunes formed immediately due to fast supercritical conditions. Usually, ripple development preceded the development of larger bedforms. Bedforms developed as small incipient ripples with wave heights and lengths <1 cm, gradually increasing in size to reach maximum heights and lengths of 3.5 and 21 cm, respectively (Figure 7). Ripples were asymmetric and on reaching heights of 2–3 cm, small separations zones with recirculation cells downstream of the bedform crest could be observed (cf. Baas, 1994). Figures 8A,C show photos of typical ripples having no effect on the upper surface of the lower denser layer of the current. Both the low drag coefficient calculated throughout Experiment 3 and the ratio between bedform wavelength and height of the lower layer of the current that remains mainly below 1 (Figure 6), show that ripples formed in Experiment 3 impart the least drag on the flow.
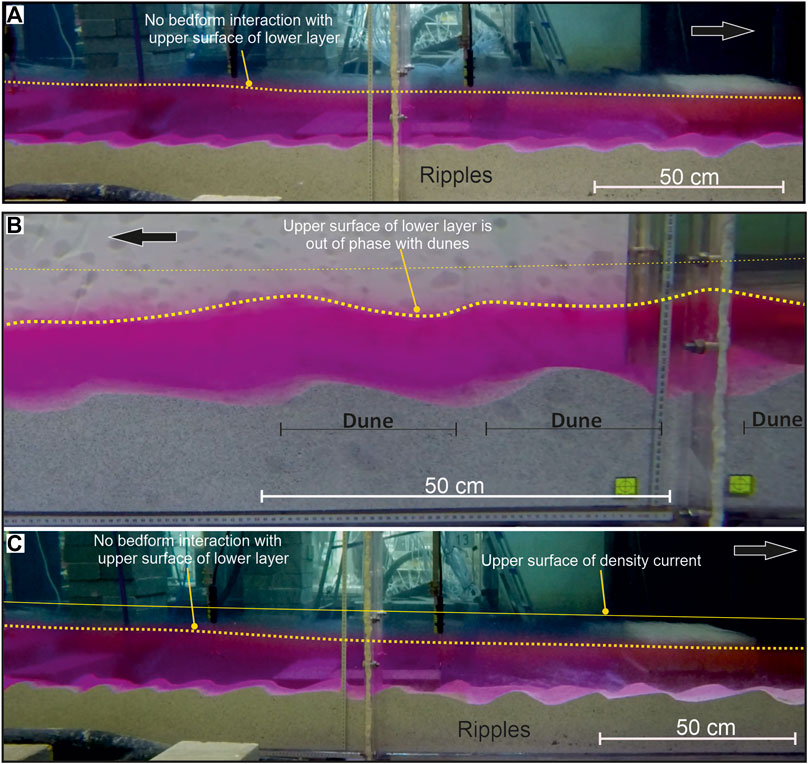
FIGURE 8. Bedform current interaction. Two layers can be recognized in the density current: the lower denser layer of the density current is dyed red/pink, the upper surface of the lower denser layer is indicated by a yellow dotted line. The current interface with ambient water is indicated by a solid yellow line. Direction of flow is indicated by an arrow in each photograph. (A) There is no interaction between ripples and the lower layer upper surface (Experiment 3). (B) Dune bedforms formed toward the end of Experiment 5. The dunes are out-of-phase with the upper surface of the lower layer. From photo (A) it is hard to determine the height of the upper surface of the current. (C) is taken from another flume angle during Experiment 3 in which the upper surface of the current can be distinguished.
Dunes formed on the shallower 0.7° slope under subcritical flow regimes in both Experiments 4 and 5. Under steady state flow in Experiment 5; dunes developed gradually over 25 min (Figure 9). Over the course of the run, ripples evolved into dunes via steady ripple growth and by two or more ripples merging to form larger dunes. Although dunes were established toward the end of Experiment 5, it was not possible to observe their continued development due to limitations on the duration of the experiment.
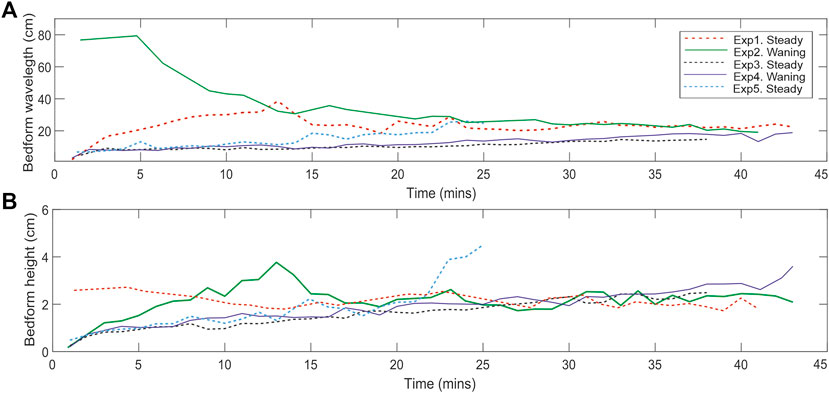
FIGURE 9. Average height and wavelength of bedforms measured every 30 s in a 2-m-wide window located 4–6 m from the upstream end of channel. (A) Bedform wavelength. (B) Bedform height. Steady flow experiments depicted by dashed lines. Waning flow experiments depicted by solid lines.
Unlike the ripples in Figures 8A,B, shows the out-of-phase interaction of dune bedforms with the upper surface of the lower denser layer. Figure 6 shows that during Experiments 4 and 5, the ratio between bedform wavelength and the height of the lower layer of the current increases just above 1 with the onset of dune development at 30–32 min (Experiment 4) and 22 min (Experiment 5). Figure 6 also shows a simultaneous slight increase in drag with the onset of dune formation. This is evidence that dunes are beginning to obstruct the flow.
The calculated shear velocity values associated with dunes (0.043–0.05 m s−1) were larger compared to ripples (0.03–0.037 m s−1). Greater shear velocities lead to increased sediment transport associated with dunes compared to ripples. Therefore, it was observed that dune bedforms experienced stronger zones of flow separation from the bedform crest transporting more sediment downstream onto the following bedform. Figure 7 also shows that ripples and dunes have separate dimensional fields. Although the differences between these two fields is small, when this approach is considered in support of the bedform phase-relationship method, it can be concluded that there is a strong case both to identify and to distinguish the ripples and dunes developed in these experiments.
Experiment 4 entailed a slowing discharge flow rate over a shallow 0.7° slope where subcritical conditions prevailed. It was expected that as the discharge flow rate slowed the bedforms would reduce in size. However, the bedforms in Experiment 4 gradually increased in size and grew steadily (Figure 9), forming an out-of-phase dune bedforms toward the end of the run despite the slowing current.
Interestingly, dunes also formed on the steeper 3° slope under supercritical conditions (Experiment 2, waning current), in this case superimposed upon the long wavelength antidunes that formed at the start of the experiment when the discharge flow rate was fastest. An example is shown in Figure 10, where the superimposed dunes are out-of-phase with the upper surface of the lower layer of the current, as highlighted by the dotted line.
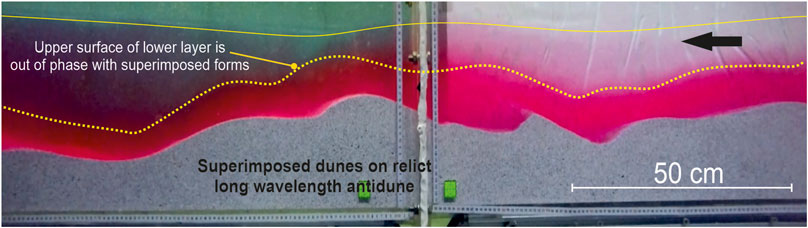
FIGURE 10. Superimposed dunes upon the relict remains of a long wavelength antidune (Experiment 2). The dotted line depicts the upper surface of the lower denser layer. The solid line depicts the approximate height of the current interface with the ambient fluid (based on Figure 4B). Flow is from right to left (arrow). The superimposed dunes interact with this upper surface in an out-of-phase manner. Mixing between the lower and upper layers of the flow can be observed; the upper layer has become light pink.
Supercritical Bedforms
Under supercritical conditions, long wavelength antidunes and downstream migrating antidunes formed. Downstream migrating antidunes were formed only on the steeper 3° slopes in both Experiments 1 and 2 where supercritical flow prevailed. Downstream migrating antidunes are characterized by their clear in-phase relationship with the upper surface of the denser lower interval within the density current (Figure 11A). They were observed to form initially as small (1–2 cm high and 15–25 cm wavelength) symmetrical forms that migrated slowly downstream. As the bed reached equilibrium they developed into larger and sometimes asymmetric downstream migrating forms, reaching maximum heights of 3.5 cm and maximum wavelengths of 42 cm (Figure 7). They always remained in-phase with the lower denser interval surface. Under the steady flow conditions of Experiment 1, downstream migrating antidunes appeared to be the stable bedform. In Experiment 2, under a slowing current, long wavelength antidunes formed at the start of the run when flow was faster, transitioning to downstream migrating antidunes as the flow decelerated.
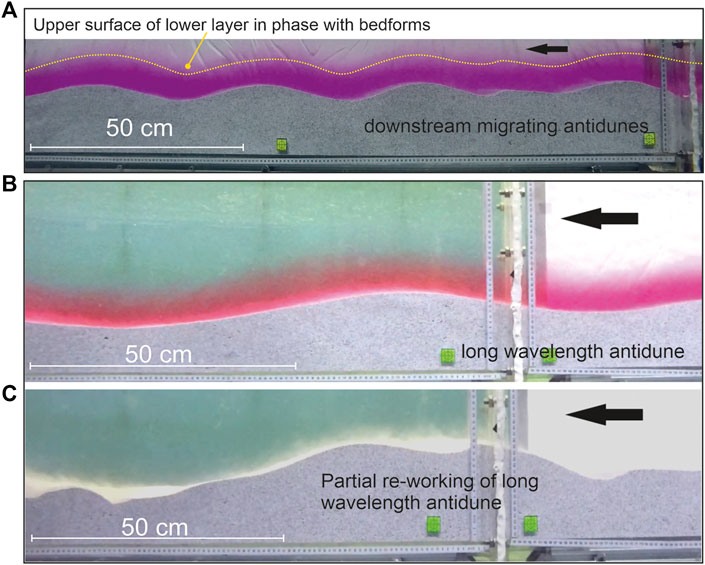
FIGURE 11. (A) Experiment 1: Example of the in phase, downstream migrating antidunes formed under steady flow conditions. The yellow dotted line defines the upper surface of the lower denser layer of the current. (B) Experiment 2: Example of a long wavelength antidune. It is in phase with the upper surface of the lower denser layer of the current (dyed pink). (C) Partial re-working of the long wavelength antidune. Flow is from right to left in all photos (arrows).
Long wavelength antidunes formed only on the steeper 3° slope, under supercritical conditions, during Experiment 2. Under these fast-flowing conditions, higher shear velocities (cf. 0.07 m s−1) and resulting high sediment transport rates, long wavelength antidunes were established rapidly across the bed. They reached wavelengths of up to 100 cm, heights of 7 cm and were in-phase with the upper surface of the lower layer of the current, as shown in Figure 11B. They had symmetrical sinuous morphologies, rounded crests and migrated very slowly upstream or were stationary. At the start of the run the long wavelength antidunes dominated the bed. As the discharge flow rate was slowed it encouraged the development of smaller downstream migrating antidunes that partially reworked the long wavelength antidune bedforms (Figure 11C).
Figure 6 shows that in both Experiments 1 and 2 the ratio between bedform wavelength and height of the lower layer of the flow have a ratio much larger than 1. As such the current will just follow a variably sloped bed rather than bedforms impeding the flow.
Discussion
Bedform Development Under Steady Flows
Under steady flows, bedform development was gradual regardless of the current’s criticality. This development or lag stage is interpreted as the bed gradually establishing equilibrium with the current (Sequeiros et al., 2010). In Experiment 5, dune bedforms formed toward the end of the run. This took place via the gradual growth and coalescence of ripples that saw the gradual reduction in the number of smaller forms upon the bed (cf. Raudkivi and Witte, 1990). As previously stated, the length of Experiment 5 was shorter due to the faster discharge flow rate. However, it can be speculated that, had the run been longer, dunes would have established themselves across the entire bed, becoming the prevalent stable bedform. Eventually, bedforms became large enough to alter the hydrodynamic relationship between the bed and current due to increased turbulence associated with the onset of dune bedform development.
Under the steady supercritical flow conditions of Experiment 1, downstream migrating antidunes formed (as in Fedele et al. (2016)). Due to the faster velocities and higher degrees of turbulence associated with supercritical conditions, they developed and became established upon the bed (within the first 5 min of the run) as the equilibrium bedform (Figure 6). These bedforms have been defined as downstream migrating antidunes, rather than dunes or washed out dunes, because they are determined to have formed under different formative processes compared to dune bedforms formed under subcritical flows. Subcritical dunes form independently of the flow interface and will grow gradually, or via the coalescence of smaller ripple forms, until they become large enough to impart a greater level of turbulence throughout the flow (compared to ripples). If the flow is sufficiently shallow (as in these experiments), the dunes can force the upper surface of the lower denser layer of the flow into an out-of-phase relationship. By way of contrast, supercritical bedform development is entirely dependent on the flow interface: the bed establishes its form and behavior due to the interaction of the surface waves that propagate at the flow interface under supercritical conditions with the bed (McLean, 1990; Fourrière et al., 2010). The bed is influenced and shaped by the action of the surface waves upon the mobile substrate so that it is transformed to their shape. As a result, the resulting (antidune) bedforms are in-phase with the flow interface. The clear in-phase relationship of downstream migrating antidunes with the interface of the lower denser layer of the current can be seen in Figure 11A. Bedform dimensions in Experiment 1 remained relatively constant in both height and wavelength throughout the run (Figure 9).
Bedform Development Under Waning Flows: Maintenance of Flow Conditions in the Lower Layer of the Density Current
Dunes formed during Experiment 4 in a similar manner to Experiment 5. Early-formed ripples gradually increased in height and wavelength by coalescence to finally form dunes toward the end of the experiment. An explanation is required to account for how bedform dimensions may have increased despite forming beneath a current set up to have a waning discharge flow rate. This may be because the waning of the flow is not sufficient to prevent the growth of bedform dimensions that occurs as the bed progressively establishes equilibrium with the flow (albeit in this case with a presumed equilibrium state that is itself progressively changing). Alternatively, data suggests that unlike the upper layer of the flow, the lower dense layer does not wane. This mechanism is discussed below.
Investigations into saline density current stratification have been carried out by Dorrell et al. (2019), who studied saline underflows in the Black Sea, and by Sequeiros et al. (2010) under experimental conditions. As is the case in the present experiments and in Fedele et al. (2016), the development of a dense basal layer is described, evident in vertical density profiles. An upward transition to less dense flow at or near the height of maximum flow velocity is also observed. Dorrell et al. (2019) attribute the development of a two-layered flow to the current’s interaction with bedforms. Bedforms increase the turbulence through the water column. The resulting increased vertical fluid motion causes the development of boundary-induced internal gravity waves that create unstable flow conditions, resulting in the formation of an eddy transport barrier at the height of the velocity maximum that prohibits mixing between the upper and lower layers of the current. Dorrell et al. (2019) further explain that as a result, the current concentration and momentum are maintained within the lower layer. In the experiments described here, a similar density profile was developed during Experiment 4 (Figure 4D). It is notable that the density profile of the basal layer remained a constant thickness throughout the experiment (highlighted by red crosses, Figure 4D); the reduction in discharge flow rate appears to have been principally experienced in the upper region of the current as Figure 4D shows a progressive thinning of the upper layer of the flow as the current slowed. Figure 5C shows that velocity measured in the bottom denser layer of the flow does not respond to Experiment 4’s reducing input flow rate. This maintenance of flow velocity in the lower layer of the current may have enabled and sustained dune formative conditions. Both Winterwerp et al. (1992) and Paull et al. (2018) explain that bedform development and dimensions may be controlled by properties of a near-bed dense layer within the density current. Although it is not observed within the timeframe of the present experiments, it is suggested that as the upper layer continues to wane it will completely diminish. It is hypothesized that breaking of internal gravity waves at the interface between the upper and lower layers of the flow results in momentum absorption at the interface. This causes the interface to act as an energy sink that eventually causes the collapse of the upper layer of the flow.
While it is acknowledged that there are limitations in representing and scaling the stratification of natural sediment-laden density currents using experimental saline density currents, there are few other techniques to simulate bedform development in low density flows. The two-layered flow described here and by Dorrell et al. (2019) is thought applicable to sediment laden density flows as the same formative mechanisms apply. Due to the effects of internal gravity waves within the current and anti-diffuse mixing within the lower layer, the stratification within the lower layer of a sediment laden density current is reduced. It is therefore suggested by Dorrell et al. (2019) that saline density flows might be a good proxy for low density turbidity currents. Further, Cartigny and Postma (2017) investigate how sediment concentration in the dense basal layer of turbidity currents might alter bedform development. Their phase diagrams depict the potential for subcritical bedform development in the form of ripples and dunes forming under low density turbidity currents. However, they also explain that high density currents will suppress turbulence in the lower region of the flow, preventing subcritical bedform development (Paull et al., 2018), which is reliant on turbulent flow for their formation. Therefore, the results presented here may only relate to low density turbidity currents. Further, it is recognized that Luchi et al. (2018) have also postulated two-layer sediment gravity flows. However, these have only been established for statistically steady flows, which are unlikely to be realized in the real world due to the effects of bedform and current interaction, spatial changes and channel geometry, etc.
Influence of Pre-Existing Bed State
Under supercritical waning flow conditions long wavelength antidunes were initially formed (Experiment 2; Figure 11B). As the discharge flow rate was reduced current conditions no longer supported their formation and the long wavelength antidunes began to be re-worked and modified (Figure 11C). However, their large forms were not entirely reworked, leaving relict long wavelength antidunes as a dominant feature upon the bed. These relict forms created obstructions to the flow contributing to the continuously slowing current by locally producing increased vertical flow movement and turbulent stresses. This led to an increase in mixing between the upper layer and lower layer of the flow. This is evident in Figure 10 where the red dye used to color the lower layer of the flow can be seen to have mixed with the more dilute upper layer of the flow. It is inferred that the combination of increased turbulence and reduced current velocity associated presence of the relict bed forms meant that locally the flow met dune forming conditions allowing dunes to form, superimposed upon the relict antidunes.
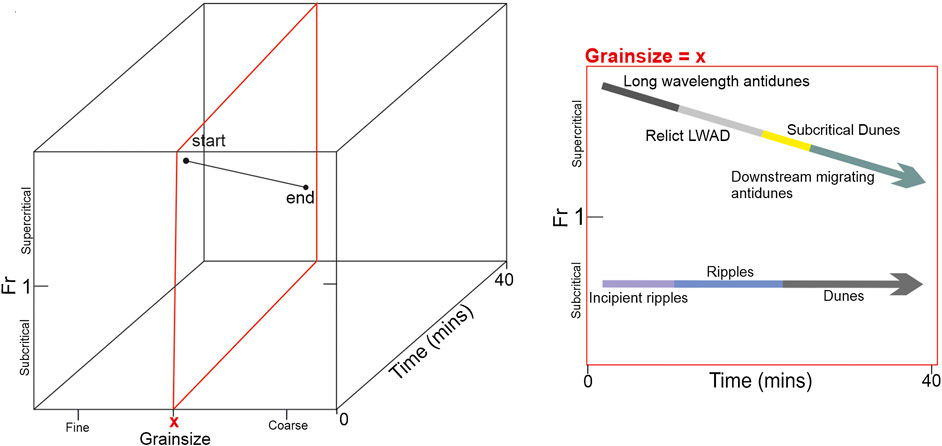
FIGURE 12. Conceptual phase diagram with a third axis for time, depicting how a bed under steady conditions might evolve (based on Experiment 5), compared to bedforms under a waning current (based on Experiment 2).
In Experiment 2, partially reworked relict bedforms influenced local flow conditions so that subcritical dune forms were able to develop within a supercritical regime. Therefore, the presence of previously established bedforms should be considered when predicting the types of new bedform that might develop under certain flow regimes. It follows that the relationship between bedform evolution and flow characteristics may be dependent on the flow history and is therefore non-unique (Osborne and Vincent, 1993; Austen et al., 2007; Huntley et al., 2008, Huntley and Coco, 2009; Martin and Jerolmack, 2013). For example, Colman (1969), Allen (1973), Baas (1994), and Kostaschuk and Villard (1996) describe a delay in how bedforms respond to changes in flow conditions, resulting in bedform hierarchies that adjust differently depending on their size. Alternatively, change in flow conditions might occur faster than bedforms can adjust (Paarlberg et al., 2010). Due to the variety of ways a bed might respond to pre-existing conditions, and the fact most experimental and modeling work focuses on bedform development starting from an initially flat bed (Huntley and Coco, 2009; Martin and Jerolmack, 2013), documentation of the nature of this dependence is incomplete. The present experiments resolve another way in which pre-existing bed morphology (relict long wavelength antidunes) can influence subsequent bedform development under density currents, as dune formative conditions were met when current conditions were locally altered in association with the relict forms.
The trajectory and rate of passage of individual flows through different bedform phase spaces are not considered in either open channel flow bedform phase diagrams, like that of Van den Berg and Van Gelder’s (2009), or the new bedform phase diagram for density currents of Fedele et al. (2016). It is clear there are ramifications for the reliability of bedform phase diagrams to make accurate predictions of bedform development; the speed and direction at which currents pass through different bedform phase spaces should be considered.
Under dis-equilibrium conditions during a gradually waning flow, there are many ways in which a bed could conceivably evolve under a waning current. In the single example presented in Experiment 2, bedform evolution is influenced by the inability of the waning current to fully re-work the initial large antidune bedforms which, as previously described, led to the development of subcritical dunes under prevailing supercritical conditions.
Figure 12 depicts a simple conceptual representation of a phase diagram that considers time as well as flow conditions and grainsize. While Experiment 2 by itself does not provide total understanding of bedform evolution under waning currents, it does highlight the added complexities involved in bedform prediction under waning flows. Further research is needed not only into how bedforms evolve under waning currents, but also into how the rate of current waning impacts bedform development.
Phase Diagram Analysis of New Data
Bedforms that developed under steady flows, plus long wavelength antidunes (which formed at the start of Experiment 2 as the stable bedform) are plotted onto and compared with existing phase diagrams including Van den Berg and Van Gelders’ (2009) phase diagram for open channel flow and the newly developed bedform phase diagram for density currents of Fedele et al. (2016).
Phase Diagram for Steady Open Channel Flow
Results from the present experiments are plotted onto Van den Berg and Van Gelder’s (2009) adaptation of Van Rijn’s (1984) dimensionless phase diagram (Figure 13A) which plots the Particle Parameter (
where ν is the kinematic viscosity (m s−2).
where,
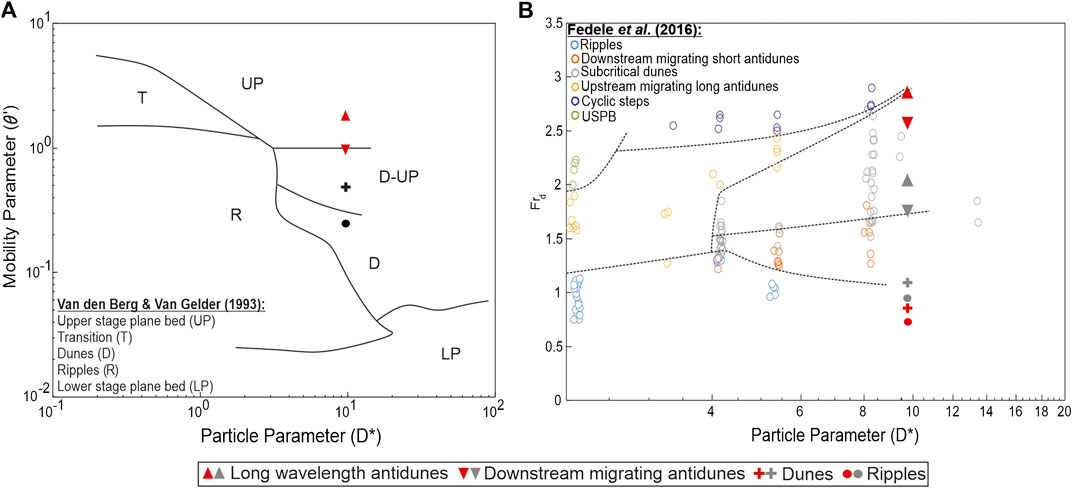
FIGURE 13. Bedforms developed during the present experiments are plotted onto bedform phase diagrams for open-channel and density driven flows. (A) Van den Berg and Van Gelder’s (2009) dimensionless phase diagram. (B) A modified version of Fedele’s et al. (2016) new bedform phase diagram for density currents: Particle parameters (D*) were calculated and re-plotted against
Figure 13A shows that the Van den Berg and Van Gelder’s (2009) phase diagram is only partially accurate in predicting the bedforms made by the experimental density currents. While the subcritical bedforms (ripples and dunes) do develop close to, or in the same defined stability fields, for those bedforms, the supercritical bedforms (downstream migrating antidunes and long wavelength antidunes) developed beneath supercritical density flows fall where the phase diagram predicts transitional bedforms between dunes and upper stage plane bed should occur. Also, the new data shows that both supercritical and subcritical bedforms exist within much tighter regions on the open channel phase diagram compared to the phase spaces relating to open channel flow bedforms.
Similarly, when plotted on the bedform phase diagram for density currents proposed by Fedele et al. (2016) the new data shows that the subcritical ripple bedforms plot in close proximity to supercritical bedforms, whereas in open channel flows subcritical bedforms are significantly separated from supercritical bedforms. Both results from the present experiments and that of Fedele et al. (2016) indicate that supercritical conditions in density currents are achieved at much slower velocities compared to open channel flows. This is due to the effects of reduced gravity (Fedele et al., 2016). The apparent narrowness of the density current subcritical bedform stability field could in part explain the rarity of dune cross-stratification in turbidites.
Phase Diagram for Steady Density Currents
Fedele et al. (2016) produced a new bedform phase diagram for bedforms formed by density currents. Figure 13B compares the data collected in this study to a modified version of Fedele’s et al. (2016) phase diagram, for which the Particle Parameter has been calculated (Eq. 4). Points in red plot
Figure 13B shows that
It is suggested that it is more accurate to associate bedforms with bulk Froude number calculations for the less stratified lower layer of the flow in which all bedform development took place in both the present experiments and in the experiments carried out by Fedele et al. (2016). Results from the present experiments that calculate
Figure 13B shows that subcritical dunes and downstream migrating antidunes are also discontinuous in Froude number, allowing some refinement of the phase space associated with subcritical bedforms. Figure 13B also allows further refinement of the long wavelength antidunes phase space. Long wavelength antidunes were the stable bedform at the start of Experiment 2, results (based on the
Conclusions
This paper reports on a series of experiments investigating the controls on bedform development and maintenance under both steady and waning saline density currents.
This work shows that
1. Bedforms developed within a lower denser layer of density currents, whose dynamics dictated the bedform type.
2. Distinctions can be made between subcritical bedforms (ripples and dunes) and supercritical bedforms (downstream migrating antidunes and long wavelength antidunes), via an effective bedform classification method based on the phase relationship of bedforms with the upper surface of the lower layer of the current.
3. It is critical to adopt an appropriate Froude number calculation method for stratified flow in order to establish a reliable quantitative link between the flow regime and the type of bedform development.
4. It is evident that the reduced gravity experienced by the saline density currents enabled supercritical conditions to be achieved at slower flow rates than is the case for open channel flow.
5. Pre-existing bed states may exert a first-order influence on subsequent bedform development regardless of the nominal flow regime. It is proposed that this effect, which is not captured by current phase diagram designs, is recognized as a new control on bedform development.
Data Availability Statement
The datasets generated for this study are available on request to the corresponding author.
Author Contributions
IC lead the research, wrote the manuscript, interpreted the data and created the figures. IC and KO carried out the experiments and the experimental design and set up was done by IC, KO, RD, HN, SS, and SM. IC, KO, RD, HN, and WM designed the focus of the research. The MATLAB code to control the pump speed was written by SS. Feedback on the manuscript and edits were provided by all the authors.
Funding
This study was funded by The Turbidites Research Group, School of Earth and Environment, University of Leeds, UK (Sponsors: AkerBP, BP, ConocoPhillips, Equinor, Eni, Hess, Murphy, OMV, Oxy and Shell), the Leeds Anniversary Research Scholarship, Japan Society for the Promotion of Science—Grant-in-Aid (KAKENHI) Grant Number 18J22211, JSPS Overseas Challenge Program for young researchers, and the Energy and Environment Institute, University of Hull, Hull, UK. We would like to thank Brendan Murphy at the Total Environment Simulator laboratory, University of Hull as well as Lee Wilson and the research students at the University of Hull for their assistance setting up the experiments.
Conflict of Interest
The authors declare that the research was conducted in the absence of any commercial or financial relationships that could be construed as a potential conflict of interest.
Acknowledgments
We would like to thank Brendan Murphy at the Total Environment Simulator laboratory, University of Hull as well as Lee Wilson and the research students at the University of Hull for their assistance setting up the experiments.
References
Alexander, J., McLelland, S. J., Gray, T. E., Vincent, C. E., Leeder, M.R., and Ellett, S. (2008). Laboratory sustained turbidity currents form elongate ridges at channel mouths. Sedimentology. 55, 845–868. doi:10.1111/j.1365-3091.2007.00923.x
Allen, J. R. L. (1962). Asymmetrical ripple marks and the origin of cross-stratification: Nature 194, 167–169. doi:10.1038/194167a0
Allen, J. R. L. (1963). The classification of cross-stratified units with notes on their origin. Sedimentology 2, 93–114. doi:10.1111/j.1365-3091.1963.tb01204.x
Allen, J. R. L. (1973). Phase differences between bed configuration and flow in natural environments, and their geological relevance. Sedimentology 20 (2), 323–329. doi:10.1111/j.1365-3091.1973.tb02054.x
Allen, J. R. L. (1982). Sedimentary structures: their character and physical basis. Amsterdam: Elsevier.
Arnott, R. W. C. (2012). Turbidites, and the case of the missing dunes. J. Sediment. Res. 82, 379. doi:10.2110/jsr.2012.29
Ashley, G. M. (1990). Classification of large-scale subaqueous bedforms: a new look at an old problem. J. Sediment. Res. 60, 160–172. doi:10.2110/jsr.60.160
Austin, M. J., Masselink, G., O’Hare, T. J., and Russell, P. E. (2007). Relaxation time effects of wave ripples on tidal beaches. Geophys. Res. Lett. 34, 16. doi:10.1029/2007GL030696
Azpiroz-Zabala, M., Cartigny, M. J. B., Talling, P. J., Parsons, D. R., Sumner, E. J., Clare, M. A., et al. (2017). Newly recognized turbidity current structure can explain prolonged flushing of submarine canyons. Sci. Adv. 3, e1700200. doi:10.1126/sciadv.1700200
Baas, J. H. (1994). A flume study on the development and equilibrium morphology of current ripples in very fine sand. Sedimentology 41, 185–209. doi:10.1111/j.1365-3091.1994.tb01400.x
Baines, P. (1998). Topographic effects in stratified flows. Cambridge, UK: Cambridge University Press
Bakke, K., Gjelberg, J., and Agerlin Petersen, S. (2008). Compound seismic modelling of the Ainsa II turbidite system, Spain: application to deep-water channel systems offshore Angola. Mar. Petrol. Geol. 25, 1058–1073. doi:10.1016/j.marpetgeo.2007.10.009
Bartholdy, J., Ernstsen, V. B., Flemming, B. W., Winter, C., Bartholomä, A., and Kroon, A. (2015). On the formation of current ripples. Sci. Rep. 5, 11390. doi:10.1038/srep11390
Bennett, S. J., and Best, J. L. (1995). Mean flow and turbulence structure over fixed, two dimensional ripples: implications for sediment transport and bedform stability. Sedimentology 42, 491–513. doi:10.1111/j.1365-3091.1995.tb00386.x
Bennett, S. J., and Best, J. L. (1996). “Mean flow and turbulence structure over fixed ripples and the ripple-dune transition,” in Coherent flow structures in open channels. Editors P. J. Ashworth, S. J. Bennett, J. L. Best, S. J. McLelland (Chichester, UK: John Wiley & Sons), 281–304.
Best, J. (1993). “On the interactions between turbulent flow structure, sediment transport and bedform development: some considerations from recent experimental research,” in Turbulence: perspectives on flow and sediment transport. Editors N. Clifford, J. French, and J. Hardisty (Chichester, UK: Wiley), 61–92.
Best, J. (2005). The fluid dynamics of river dunes: a review and some future research directions. J. Geophys. Res. Earth Surf. 110, F04S02. doi:10.1029/2004JF000218
Bonnefille, R. (1963). Essais de synthese des lois du debut d’entrainement des sediments sous l’action d’un courant en regime continu. Bull. du Centre de Rech. et d’ess. de Chatou. 5, 17–22.
Bridge, J. S., and Best, J. L. (1988). Flow, sediment transport and bedform dynamics over the transition from dunes to upper‐stage plane beds: implications for the formation of planar lamination. Sedimentology 35, 753–763. doi:10.1111/j.1365-3091.1988.tb01249.x
Bruschi, R., Bughi, S., Spinazzè, M., Torselletti, E., and Vitali, L. (2006). Impact of debris flows and turbidity currents on seafloor structures. Norw. J. Geol. 86, 317–337.
Carter, L., Gavey, R., Talling, P., and Liu, J. (2014). Insights into submarine geohazards from breaks in subsea telecommunication cables. Oceanography 27, 58–67. doi:10.5670/oceanog.2014.40
Cartigny, M. J., and Postma, G. (2017). “Turbidity current bedforms,” in Atlas of bedforms in the Western Mediterranean. Editors Guillén, J., Acosta, J., Latino Chiocci, F., and Palanques, A. (Switzerland, Europe: Springer International Publishing).
Cartigny, M. J. B., Postma, G., van den Berg, J. H., and Mastbergen, D. R. (2011). A comparative study of sediment waves and cyclic steps based on geometries, internal structures and numerical modeling. Mar. Geol. 280, 40–56. doi:10.1016/j.margeo.2010.11.006
Cartigny, M. J. B., Ventra, D., Postma, G., and van Den Berg, J. H. (2014). Morphodynamics and sedimentary structures of bedforms under supercritical‐flow conditions: new insights from flume experiments. Sedimentology 61, 712–748. doi:10.1111/sed.12076
Cartigny, M. J. B., Eggenhuisen, J. T., Hansen, E. W. M., and Postma, G. (2013). Concentration-dependent flow stratification in experimental high-density turbidity currents and their relevance to turbidite facies models. J. Sediment. Res. 83, 1046–1064. doi:10.2110/jsr.2013.71.
Clare, M. A., Hughes Clarke, J. E., Talling, P. J., Cartigny, M. J. B., and Pratomo, D. G. (2016). Preconditioning and triggering of offshore slope failures and turbidity currents revealed by most detailed monitoring yet at a fjord-head delta. Earth Planet Sci. Lett. 450, 208–220. doi:10.1016/j.epsl.2016.06.021
Coleman, J. M. (1969). Brahmaputra river: channel processes and sedimentation. Sediment. Geol. 3 (2–3), 129–239. doi:10.1016/0037-0738(69)90010-4
Colman, S. E., and Nikora, V. I. (2011). Fluvial dunes: initiation, characterization, flow structure. Earth Surf. Process. Landforms 36, 39–57. doi:10.1002/esp.2096
Colombini, M., and Stocchino, A. (2011). Ripple and dune formation in rivers. J. Fluid Mech. 673, 121–131. doi:10.1017/S0022112011000048
Covault, J. A. (2011). Submarine fans and canyon-channel systems: a review of processes, products, and models. Nat. Educ. Knowl. 3, 4.
Dorrell, R. M., Darby, S. E., Peakall, J., Sumner, E. J., Parsons, D. R., and Wynn, R. B. (2014). The critical role of stratification in submarine channels: implications for channelization and long runout of flows. J. Geophys. Res. Oceans 119, 2620–2641. doi:10.1002/2014JC009807
Dorrell, R. M., Peakall, J., Darby, S. E., Parsons, D. R., Johnson, J., Sumner, E. J., et al. (2019). Self-sharpening induces jet-like structure in seafloor gravity currents. Nat. Commun. 10, 1381. doi:10.1038/s41467-019-09254-2
Dorrell, R. M., Peakall, J., Sumner, E. J., Parsons, D. R., Darby, S. E., Wynn, R. B., et al. (2016). Flow dynamics and mixing processes in hydraulic jump arrays: implications for channel-lobe transition zones. Mar. Geol. 381, 181–193. doi:10.1016/j.margeo.2016.09.009
Engelund, F., and Fredsoe, J. (1982). Sediment ripples and dunes. Annu. Rev. Fluid Mech. 14, 13–37. doi:10.1146/annurev.fl.14.010182.000305
Fedele, J. J., Barnaal, Z., Tulenko, J., and Awalt, S. (2016). “Bedforms created by gravity flows,” in Autogenic dynamics and self-organization in sedimentary systems. Editors Budd, D. A., Hajek, E. A., and Purkis, S. J. (Tulsa, OK: SEPM), Special Publication, Vol. 106, 65–121. doi:10.2110/sepms
Fernandez, R., Best, J., and López, F. (2006). Mean flow, turbulence structure, and bed form superimposition across the ripple‐dune transition. Water Resour. Res. 42, W05406. doi:10.1029/2005WR004330
Fourrière, A., Claudin, P., and Andreotti, B. (2010). Bedforms in a turbulent stream: formation of ripples by primary linear instability and of dunes by nonlinear pattern coarsening. J. Fluid Mech. 649, 287–328. doi:10.1017/S0022112009993466
Galy, V., France-Lanord, C., Beyssac, O., Faure, P., Kudrass, H., and Palhol, F. (2007). Efficient organic carbon burial in the Bengal fan sustained by the Himalayan erosional system. Nature 450, 407–410. doi:10.1038/nature06273
Garcia, M., and Parker, G. (1993). Experiments on the entrainment of sediment into suspension by a dense bottom current. J. Geophys. Res. 98, 4793–4807. doi:10.1029/92JC02404
Guy, H. P., Simons, D. B., and Richardson, E. V. (1961). Summary of alluvial channel data from flume experiments 1956–1961. Washington, DC: United States Government Printing Office, 462‐I.
Hage, S., Cartigny, M. J. B., Clare, M. A., Sumner, E. J., Vendettuoli, D., Hughes Clarke, J. E., et al. (2018). How to recognize crescentic bedforms formed by supercritical turbidity currents in the geologic record: insights from active submarine channels. Geology 46, 563–566. doi:10.1130/g40095.1
Hand, B. M. (1974). Supercritical flow in density currents. J. Sediment. Res. 44 (3), 637–648. doi:10.1306/74D72AB3-2B21-11D7-8648000102C1865D
Harms, J. C., and Fahnestock, R. K. (1965). “Stratification, bed forms, and flow phenomena (with an example from the Rio Grande),” in Primary sedimentary structures and their hydrodynamic interpretation. Editor G. V., Middleton (Tulsa, OK: SEPM), Special Publication, Vol. 12, 84–115.
Huang, H., Imran, J., Pirmez, C., Zhang, Q., and Chen, G. (2009). The critical densimetric Froude number of subaqueous gravity currents can be non‐unity or non‐existent. J. Sediment. Res. 79, 479–485. doi:10.2110/jsr.2009.048
Hubert, J. F. (1966). Modification of the model for internal structures in graded beds to include a dune division. Nature 211, 614–615. doi:10.1038/211614a0
Hughes Clarke, J. E. (2016). First wide-angle view of channelized turbidity currents links migrating cyclic steps to flow characteristics. Nat. Commun. 7, 1–13. doi:10.1038/ncomms11896
Huntley, D., and Coco, G. (2009). “How do bedforms respond to changing conditions? A study using abstracted models,” inProceedings of coastal dynamics 2009: impacts of human activities on dynamic coastal processes, Tokyo, Japan, September 7–11, 2009 (World Scientific Publishing), 21–36.
Huntley, D., Coco, G., Bryan, K., and Murray, A. (2008). Influence of ‘defects’ on sorted bedform dynamics. Geophys. Res. Lett. 35, 2. doi:10.1029/2007GL030512
Jackson, R. (1976). Sedimentological and fluid-dynamic implications of the turbulent bursting phenomenon in geophysical flows. J. Fluid Mech. 77, 531–560. doi:10.1017/S0022112076002243
Jerolmack, D. J., and Mohrig, D. (2005). A unified model for subaqueous bed form dynamics. Water Resour. Res. 41, W12421. doi:10.1029/2005WR004329
Keith, B. D., and Freidman, G. M. (1977). A slope-fan-basin-plain model, Taconic Sequence, New York and Vermont. J. Sediment. Res. 47 (3), 1220–1241. doi:10.1306/212F7310-2B24-11D7-8648000102C1865D
Kennedy, J. F. (1963). The mechanics of dunes and antidunes in erodible-bed channels. J. Fluid Mech. 16 (4), 521–544. doi:10.1017/S0022112063000975
Kennedy, J. F. (1969). The formation of sediment ripples, dunes and antidunes. Annu. Rev. Fluid Mech. 1, 147–168. doi:10.1146/annurev.fl.01.010169.001051
Kneller, B. C. (2013). “Turbidites,” in Encyclopedia of sediments and sedimentary rocks. Editors G. V. Middleton, M. J. Church, M. Coniglio, L. A. Hardie and F. J. Longstaffe (Dordrecht, Netherlands: Springer).
Kneller, B. C., and Branney, M. J. (1995). Sustained high-density turbidity currents and the deposition of thick massive sands. Sedimentology 42 (4), 607–616. doi:10.1111/j.1365-3091.1995.tb00395.x
Kneller, B. C., and Buckee, C. (2000). The structure and fluid mechanics of turbidity currents: a review of some recent studies and their geological implications. Sedimentology 47, 62–94. doi:10.1046/j.1365-3091.2000.047s1062.x
Kneller, B. C., and McCaffrey, W. D. (2003). The interpretation of vertical sequences in turbidite beds: the influence of longitudinal flow structure. J. Sediment. Res. 73, 706–713. doi:10.1306/031103730706
Koller, D. K., de Oliveira Borges, A. L., Puhl, E., and Manica, R. (2017). Prediction of the bedforms generated by density currents based on fluvial phase diagrams. Brazilian J. Water Resour. 22, 49. doi:10.1590/2318-0331.0217160021
Koller, D. K., Manica, R., de Oliveira Borges, A. L., and Fedele, J. (2019). Experimental bedforms by saline density currents. Braz. J. Genet. 49. doi:10.1590/2317-4889201920180118
Kostaschuk, R., and Villard, P. (1996). Flow and sediment transport over large subaqueous dunes: Fraser River, Canada. Sedimentology 43 (5), 849–863. doi:10.1111/j.1365-3091.1996.tb01506.x
Leeder, M. R. (2011). Sedimentology and sedimentary basins: from turbulence to tectonics. 2nd Edn. Oxford, England: Wiley-Blackwell.
Lowe, D. R. (1982). Sediment gravity flows; II. Depositional models with special reference to the deposits of high-density turbidity currents. J. Sediment. Res. 52 (1), 279–297. doi:10.1306/212F7F31-2B24-11D7-8648000102C1865D
Lucchi, F. R., and Valmori, E (1980). Basin-wide turbidites in a Miocene, over-supplied deep-sea plain: a geometrical analysis. Sedimentology. 27, 241–270. doi:10.1111/j.1365-3091.1980.tb01177.x, 2013
Luchi, R., Balachandar, S., Seminara, G., and Parker, G. (2018). Turbidity currents with equilibrium basal driving layers: a mechanism for long runout. Geophys. Res. Lett. 45, 1518–1526. doi:10.1002/2017GL075608
Martin, R. L., and Jerolmack, D. J. (2013). Origin of hysteresis in bed form response to unsteady flows. Water Resour. Res. 49, 1314–1333. doi:10.1002/wrcr.20093, 2013
Masson, D. G., Harbitz, C. B., Wynn, R. B., Pedersen, G., and Løvholt, F. (2006). Submarine landslides: processes, triggers and hazard prediction. Philos Trans A. Math Phys Eng Sci. 364, 2009. doi:10.1098/rsta.2006.1810
McLean, S. (1990). The stability of ripples and dunes. Earth Sci. Rev. 29, 131–144. doi:10.1016/0012-8252(0)90032-Q10.1016/0012-8252(90)90032-q
Middleton, G. V. (1993). Sediment deposition from turbidity currents. Annu. Rev. Earth Planet Sci. 21, 89–114. doi:10.1146/annurev.ea.21.050193.000513
Normark, W., Hess, G. R., Stow, D. A. V., and Bowen, A. J. (1980). Sediment waves on the Monterey fan levee: a preliminary physical interpretation. Mar. Geol. 37 (1–2), 1–18. doi:10.1016/0025-3227(80)90009-2
Osborne, P., and Vincent, C. (1993). Dynamics of large and small scale bedforms on a macrotidal shoreface under shoaling and breaking waves. Mar. Geol. 115 (3–4), 207–226. doi:10.1016/0025-3227(93)90051-V
Paarlberg, A. J., Dohmen-Janssen, C. M., Hulscher, S. J. M. H., Termes, P., and Schielen, R. (2010). Modelling the effect of time-dependent river dune evolution on bed roughness and stage. Earth Surf. Process. Landforms 35 (15), 1854–1866. doi:10.1002/esp.2074
Parker, G., Garcia, M., Fukushima, Y., and Yu, W. (1987). Experiments on turbidity currents over an erodible bed. J. Hydraul. Res. 25, 123–147. doi:10.1080/00221688709499292
Paull, C. K., Talling, P. J., Maier, K. L., Parsons, D., Xu, J., Caress, D. W., et al. (2018). Powerful turbidity currents driven by dense basal layers. Nat. Commun. 9, 4114. doi:10.1038/s41467-018-06254-6
Petrie, J., and Diplas, P. (2015). Evaluation of the logarithmic law of the wall for river flows. River Res. Appl. 32 (5), 1082–1093. doi:10.1002/rra.2920
Pohl, F., Eggenhuisen, J. T., Kane, I. A., and Clare, M. A. (2020). Transport and burial of microplastics in deep-marine sediments by turbidity currents. Environ. Sci. Technol. 54 (7), 4180–4189. doi:10.1021/acs.est.9b07527
Postma, G., and Cartigny, M. J. B. (2014). Supercritical and subcritical turbidity currents and their deposits - a synthesis. Geology 42, 987–990. doi:10.1130/G35957.1
Postma, G., Cartigny, M. J. B., and Kleverlaan, K. (2009). Structureless, coarse-tail graded Bouma Ta formed by internal hydraulic jump of the turbidity current? Sediment. Geol. 219, 1–6. doi:10.1016/j.sedgeo.2009.05.018
Raudkivi, A. J. (2006). Transition from ripples to dunes. J. Hydraul. Eng. 132, 12. doi:10.1061/(asce)0733-9429(2006)132:12(1316)
Raudkivi, A. J., and Witte, H. H. (1990). Development of bed features. J. Hydraul. Eng. ASCE 116, 1063–1079. doi:10.1061/(asce)0733-9429(1990)116:9(1063)
Recking, A., Frey, P., Paquier, A., and Belleudy, P. (2009). An experimental investigation of mechanisms involved in bed load sheet production and migration. J. Geophys. Res. 114, F4. doi:10.1029/2008jf000990
Richards, K. J. (1980). The formation of ripples and dunes on an erodible bed. J. Fluid Mech. 99 (3), 597–618. doi:10.1017/S002211208000078X
Schindler, R. J., and Robert, A. (2005). Flow and turbulence structure across the ripple-dune transition: an experiment under mobile bed conditions. Sedimentology 52, 627–649. doi:10.1111/j.1365-3091.2005.00706.x
Sequeiros, O. E., Spinewine, B., Beaubouef, R. T., Sun, T., Garcia, M. H., and Parker, G. (2010). Bedload transport and bed resistance associated with density and turbidity currents. Sedimentology 57 (6), 1463–1490. doi:10.1111/j.1365-3091.2010.01152.x
Shields, A. (1936). Application of similarity principles and turbulence research to bed-load movement. Pasadena, CA: Soil Conservation Service, California Institute of Technology.
Southard, J., and Boguchwal, L. (1990). Bed configuration in steady unidirectional water flows; Part 2. Synthesis of flume data. J. Sediment. Res. 60, 658–679. doi:10.1306/212F9241-2B24-11D7-8648000102C1865D
Spinewine, B., Sequeiros, O. E., Garcia, M. H., Beaubouef, R. T., Sun, T., Savoye, B., et al. (2009). Experiments on wedge-shaped deep sea sedimentary deposits in minibasins and/or on channel levees emplaced by turbidity currents. Part II. Morphodynamic evolution of the wedge and of the associated bedforms. J. Sediment. 79, 608–628. doi:10.2110/jsr.2009.065
Sumner, E. J., Talling, P. J., Amy, L. A., Wynn, R. B., Stevenson, C., and Frenz, M. (2012). Facies architecture of individual basin‐plain turbidites: comparison to existing models and implications for flow processes. Sedimentology 59, 1850–1887. doi:10.1111/j.1365-3091.2012.01329.x
Sun, T., and Parker, G. (2005). Transportational cyclic steps created by flow over an erodible bed. Part 2. Theory and numerical simulation. J. Hydraul. Res. 43, 502. doi:10.1080/00221680509500148
Sylvester, Z., and Lowe, D. R. (2004). Textural trends in turbidites and slurry beds from the Oligocene flysch of the East Carpathians, Romania. Sedimentology 51, 945–972. doi:10.1111/j.1365-3091.2004.00653.x
Thorpe, S. A. (2010). Turbulent hydraulic jumps in a stratified shear flow. J. Fluid Mech. 654, 305–350. doi:10.1017/S0022112010000625
Thorpe, S. A., and Li, L. (2014). Turbulent hydraulic jumps in a stratified shear flow. Part 2. J. Fluid Mech. 758, 94–120. doi:10.1017/jfm.2014.502
Tilston, M., Arnott, R. W. C., Rennie, C. D., and Long, B. (2015). The influence of grain size on the velocity and sediment concentration profiles and depositional record of turbidity currents. Geology 43, 839–842. doi:10.1130/g37069.1
Van den Berg, J. H., and Van Gelder, A. (2009). “A new bedform stability diagram, with emphasis on the transition of ripples to plane bed in flows over fine sand and silt,” in Alluvial sedimentation. Editors Marzo, M., and Puigdefábregas, C. doi:10.1002/9781444303995.ch2
Van Rijn, L. C. (1984). Sediment transport, Part III: bed forms and alluvial roughness. J. Hydraul. Eng. 110, 1733–1754. doi:10.1061/(asce)0733-9429(1984)110:12(1733)
Venditti, J. G. (2013). “Bedforms in sand-bedded rivers,” in Treatise on geomorphology. Editor Shroder, F. (Cambridge, MA: Academic Press), 137–162.
Waltham, D. (2004). Flow transformations in particulate gravity currents. J. Sediment. Res. 74, 129–134. doi:10.1306/062303740129
Winterwerp, J. C., Bakker, W. T., Mastbergen, D. R., and van Rossum, H. (1992). Hyperconcentrated sand‐water mixture flows over erodible bed. J. Hydraul. Eng. 118, 1508–1525. doi:10.1061/(asce)0733-9429(1992)118:11(1508)
Wynn, R. B., Masson, D. G., Stow, D. A. V., and Weaver, P. P. E. (2000a). Turbidity current sediment waves on the submarine slopes of the western Canary Islands. Mar. Geol. 163, 185–198. doi:10.1016/S0025-3227(99)00101-2
Wynn, R. B., Weaver, P. P. E., Ercilla, G., Stow, D. A. V., and Masson, D. G. (2000b). Sedimentary processes in the selvage sediment-wave field, NE Atlantic: new insights into the formation of sediment waves by turbidity currents. Sedimentology 47, 1181–1197. doi:10.1046/j.1365-3091.2000.00348.x
Keywords: bedforms, saline density current, turbidity current, dunes, ripples, antidunes, experimental
Citation: de Cala I, Ohata K, Dorrell R, Naruse H, Patacci M, Amy LA, Simmons S, McLelland SJ and McCaffrey WD (2020) Relating the Flow Processes and Bedforms of Steady-State and Waning Density Currents. Front. Earth Sci. 8:535743. doi: 10.3389/feart.2020.535743
Received: 17 February 2020; Accepted: 28 August 2020;
Published: 22 October 2020.
Edited by:
Anne Bernhardt, Freie Universität Berlin, GermanyReviewed by:
Florian Pohl, Durham University, United KingdomChristopher Stevenson, University of Liverpool, United Kingdom
Copyright© 2020 de Cala, Ohata, Dorrell, Naruse, Patacci, Amy, Simmons, McLelland and McCaffrey. This is an open-access article distributed under the terms of the Creative Commons Attribution License (CC BY). The use, distribution or reproduction in other forums is permitted, provided the original author(s) and the copyright owner(s) are credited and that the original publication in this journal is cited, in accordance with accepted academic practice. No use, distribution or reproduction is permitted which does not comply with these terms.
*Correspondence: Isabel de Cala, SXNhYmVsLmRlY2FsYUBnbWFpbC5jb20=